Inter-Comparison of AIRS Temperature and Relative Humidity Profiles with AMMA and DACCIWA Radiosonde Observations over West Africa

 , and
, and
Abstract

1. Introduction
2. Methodology
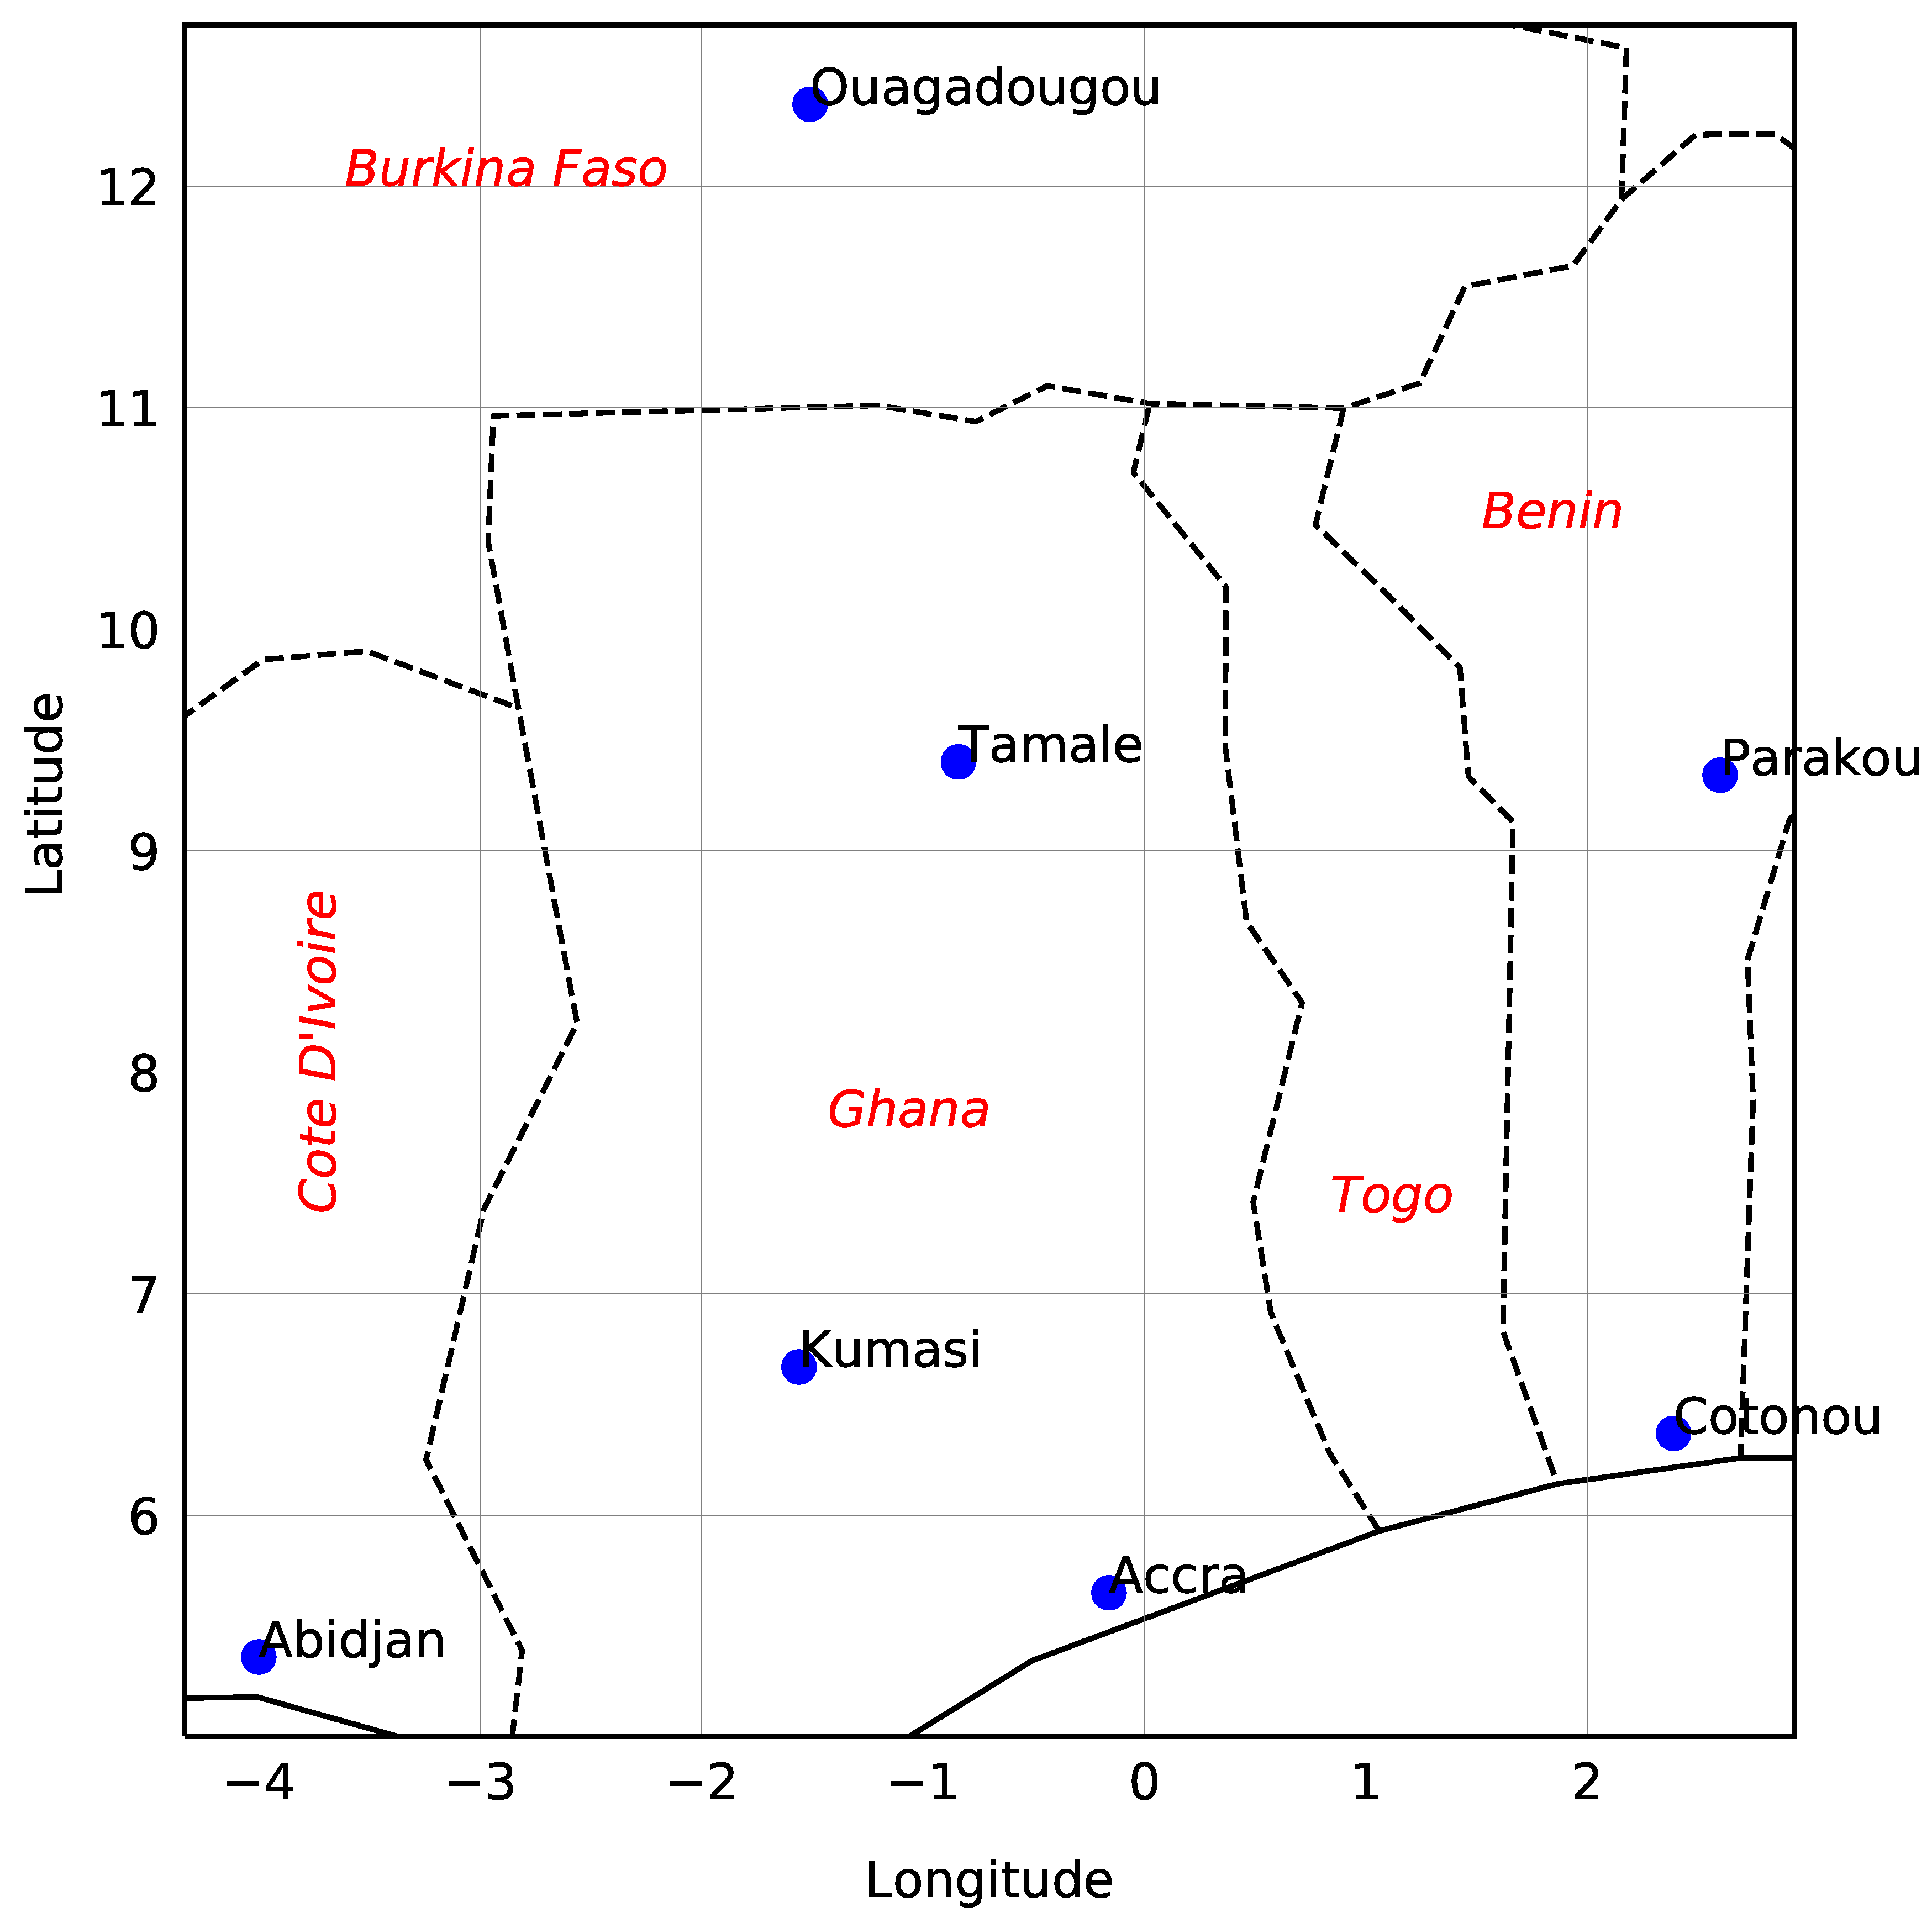
2.1. Radiosonde Observations over West Africa
2.2. AIRS Temperature and Humidity Profiles
2.3. NCEP_R2 Datasets
2.4. Data Collocation and Statistical Analysis
2.4.1. Data Sampling
2.4.2. Temperature and Humidity Profile Statistics
2.4.3. Thunderstorm Convective Indices
2.4.4. Cloud/Cloud-Free Analysis
3. Results and Discussion
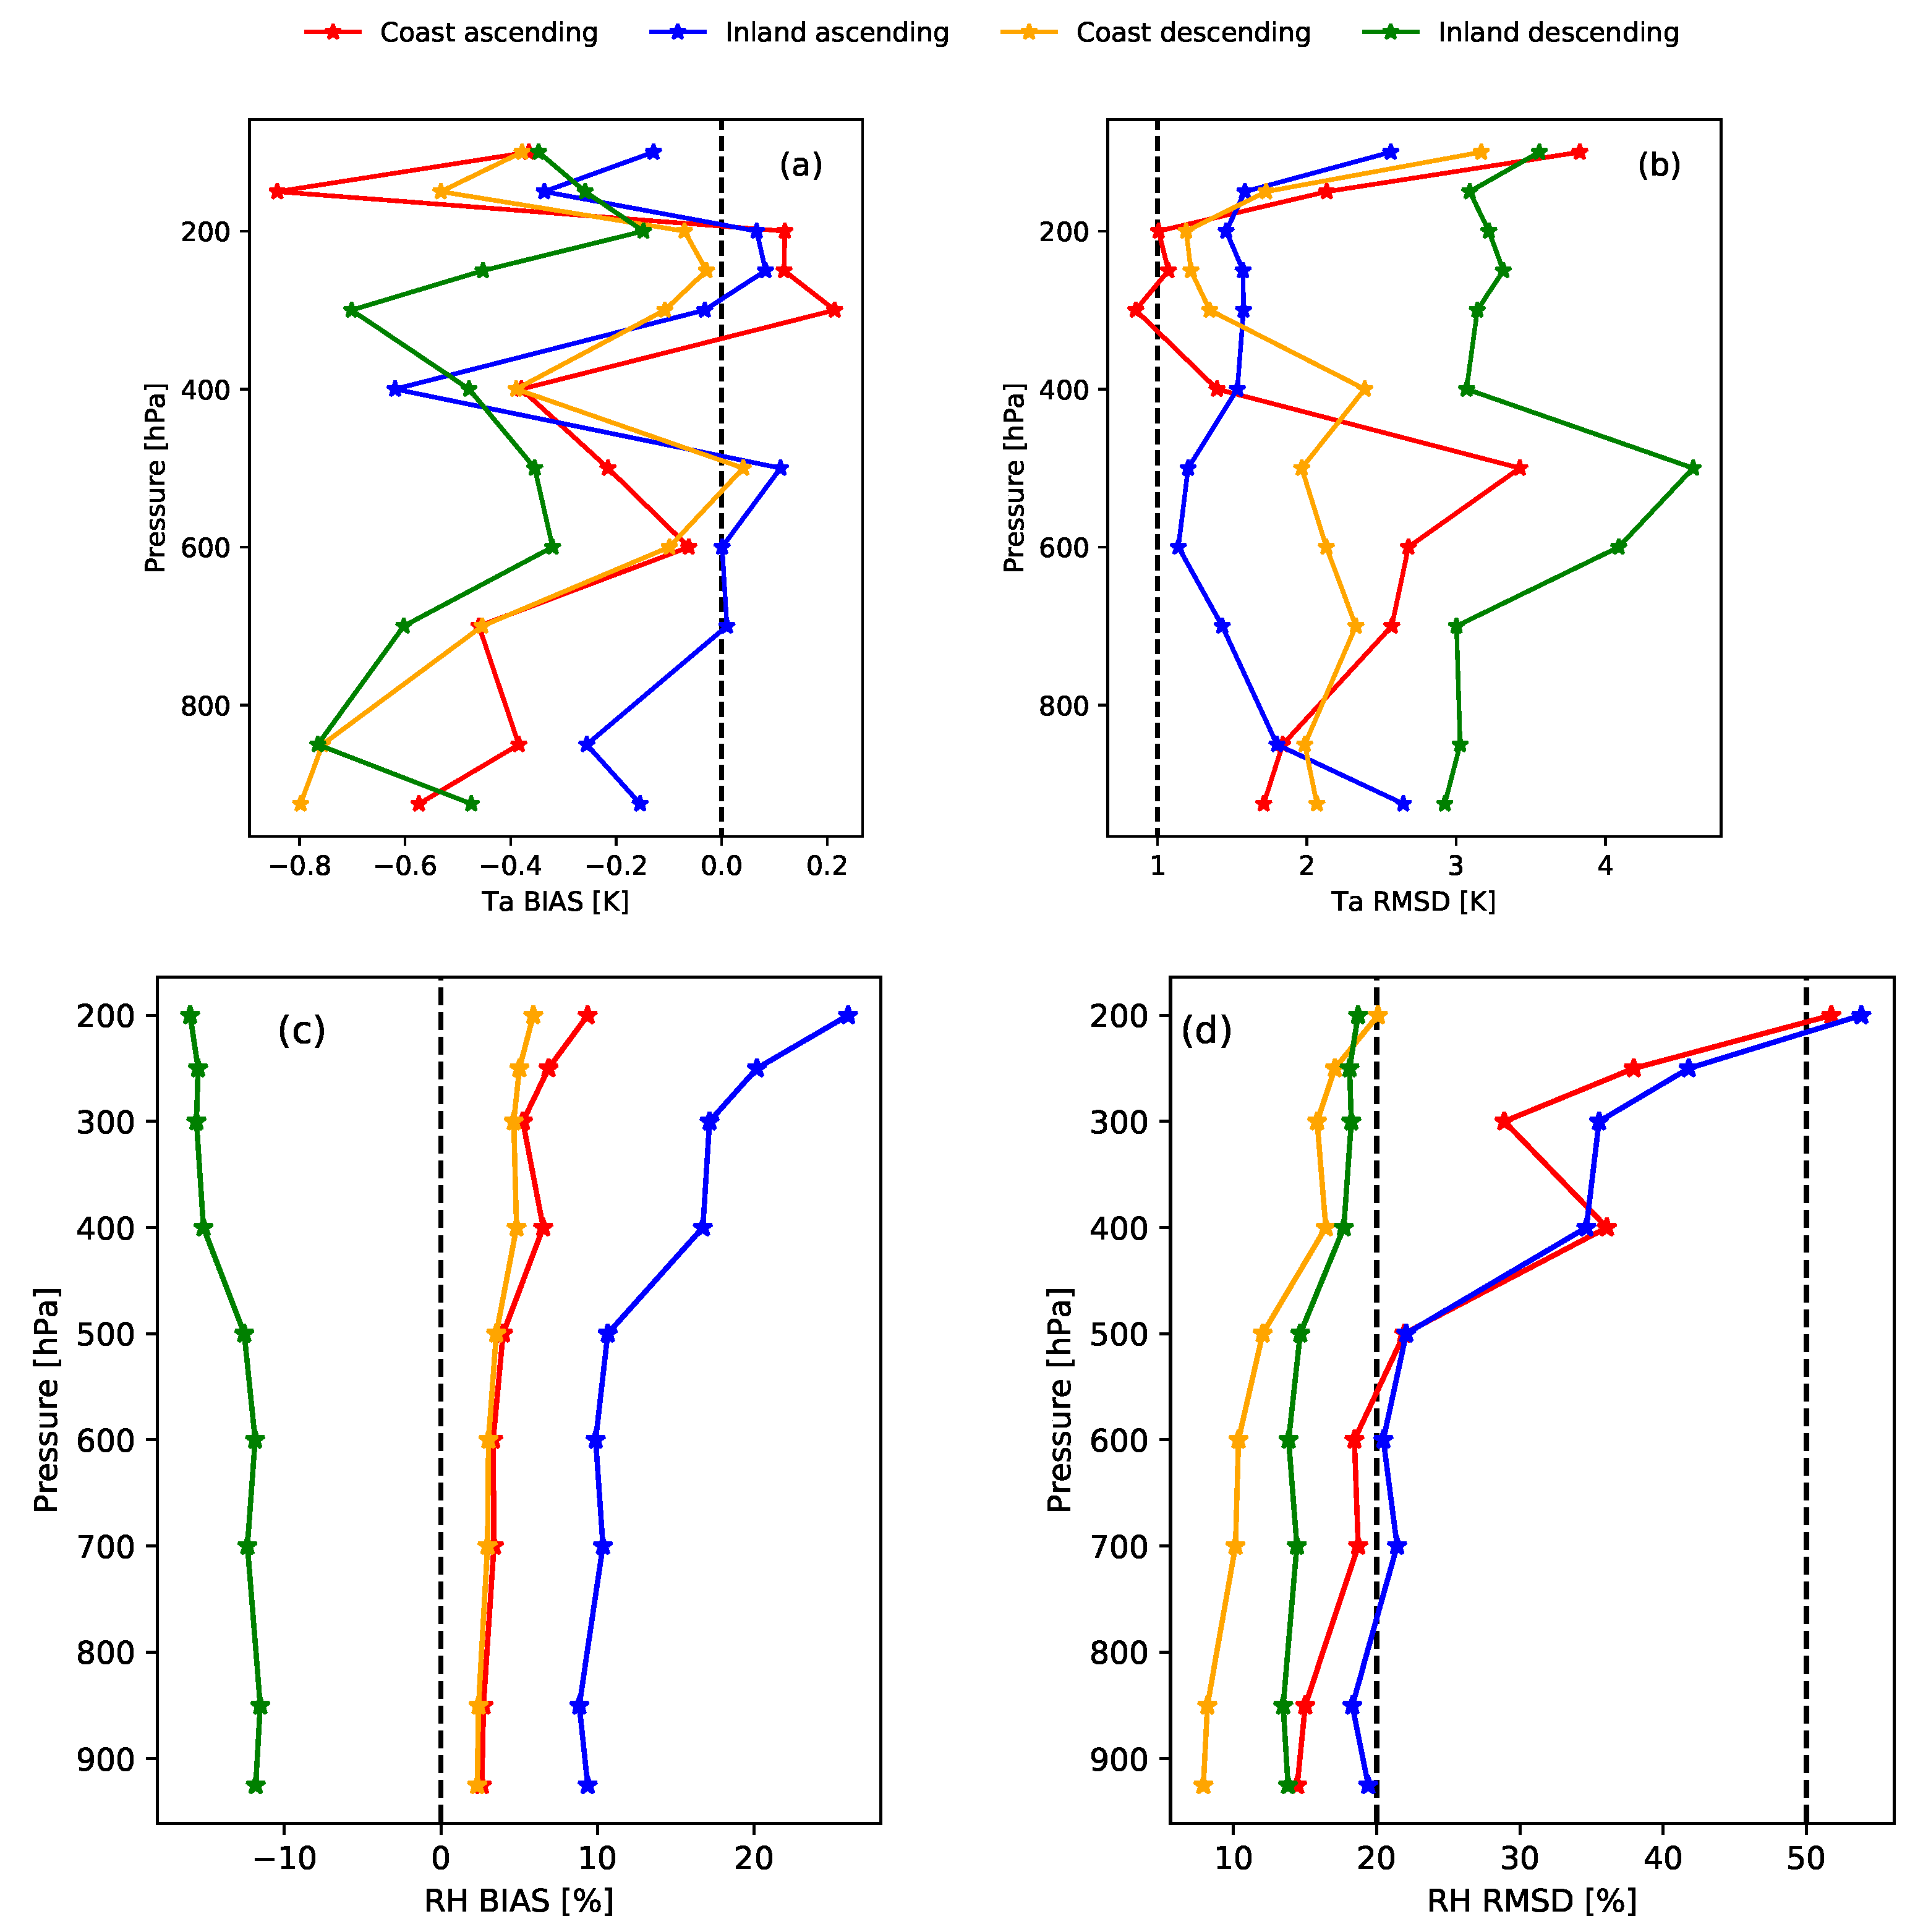
3.1. Diurnal Analysis of AIRS Temperature and Relative Humidity
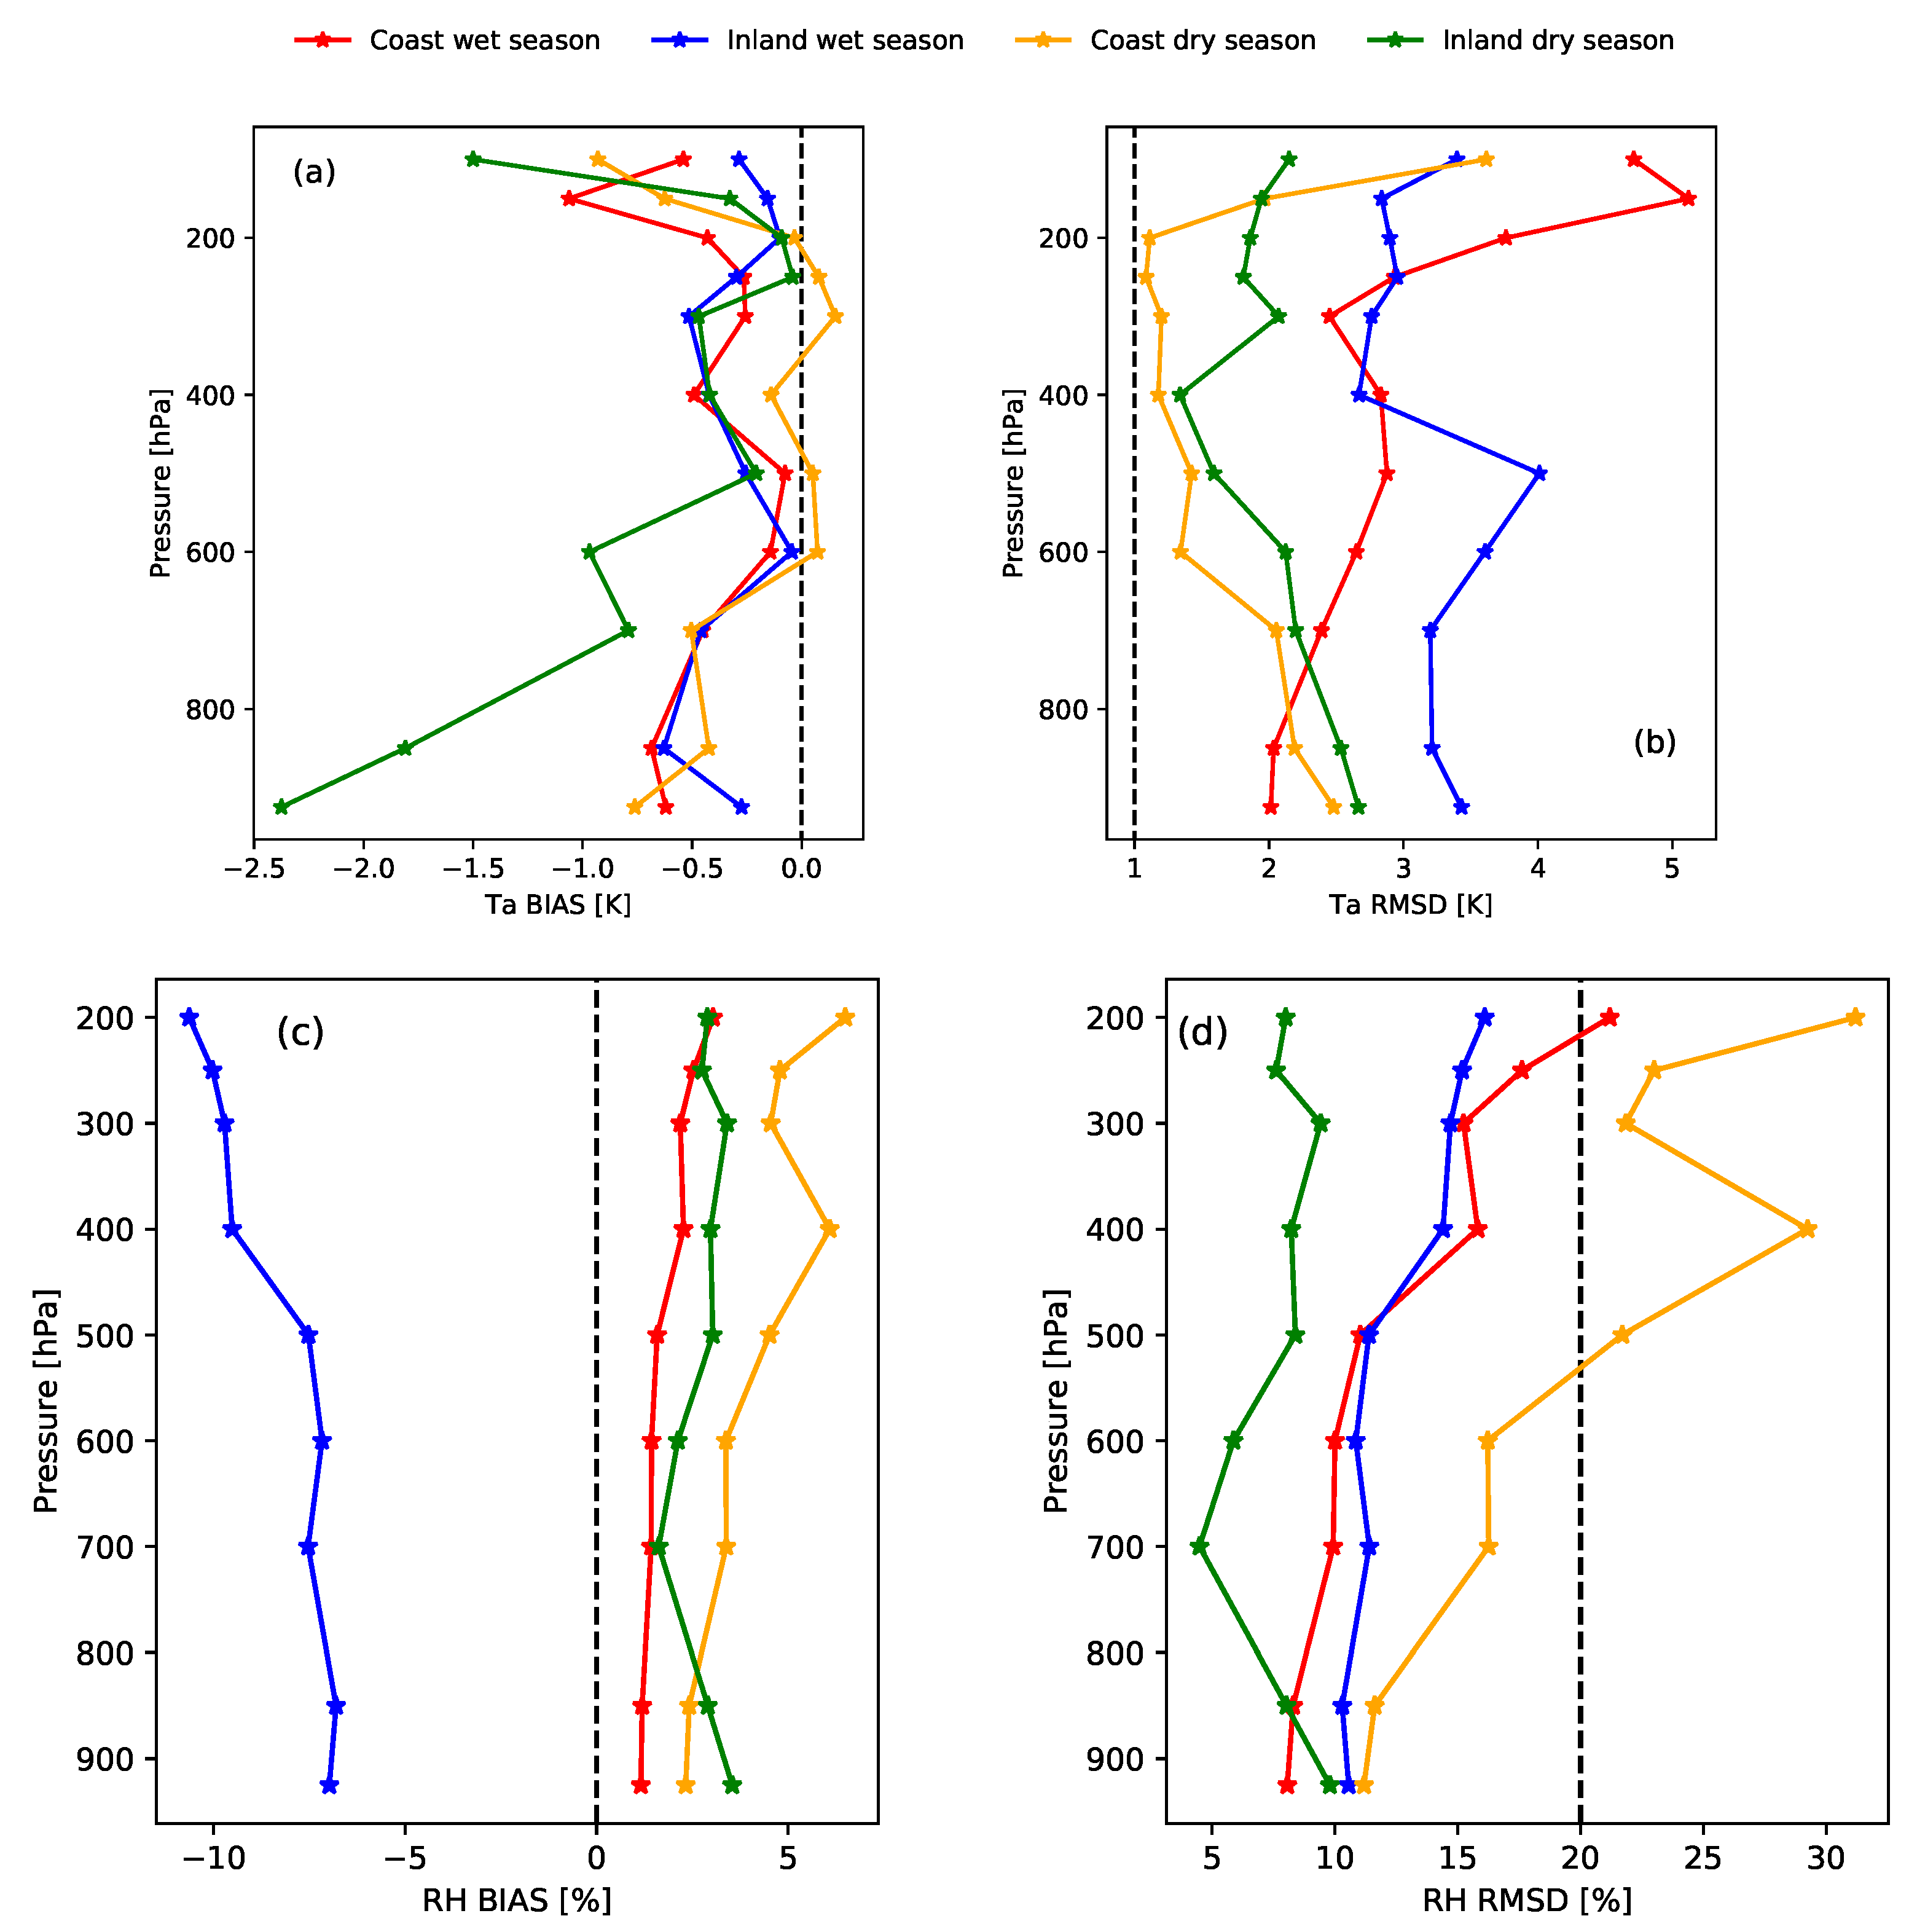
3.2. Seasonal Analysis of AIRS Temperature and Relative Humidity Profiles
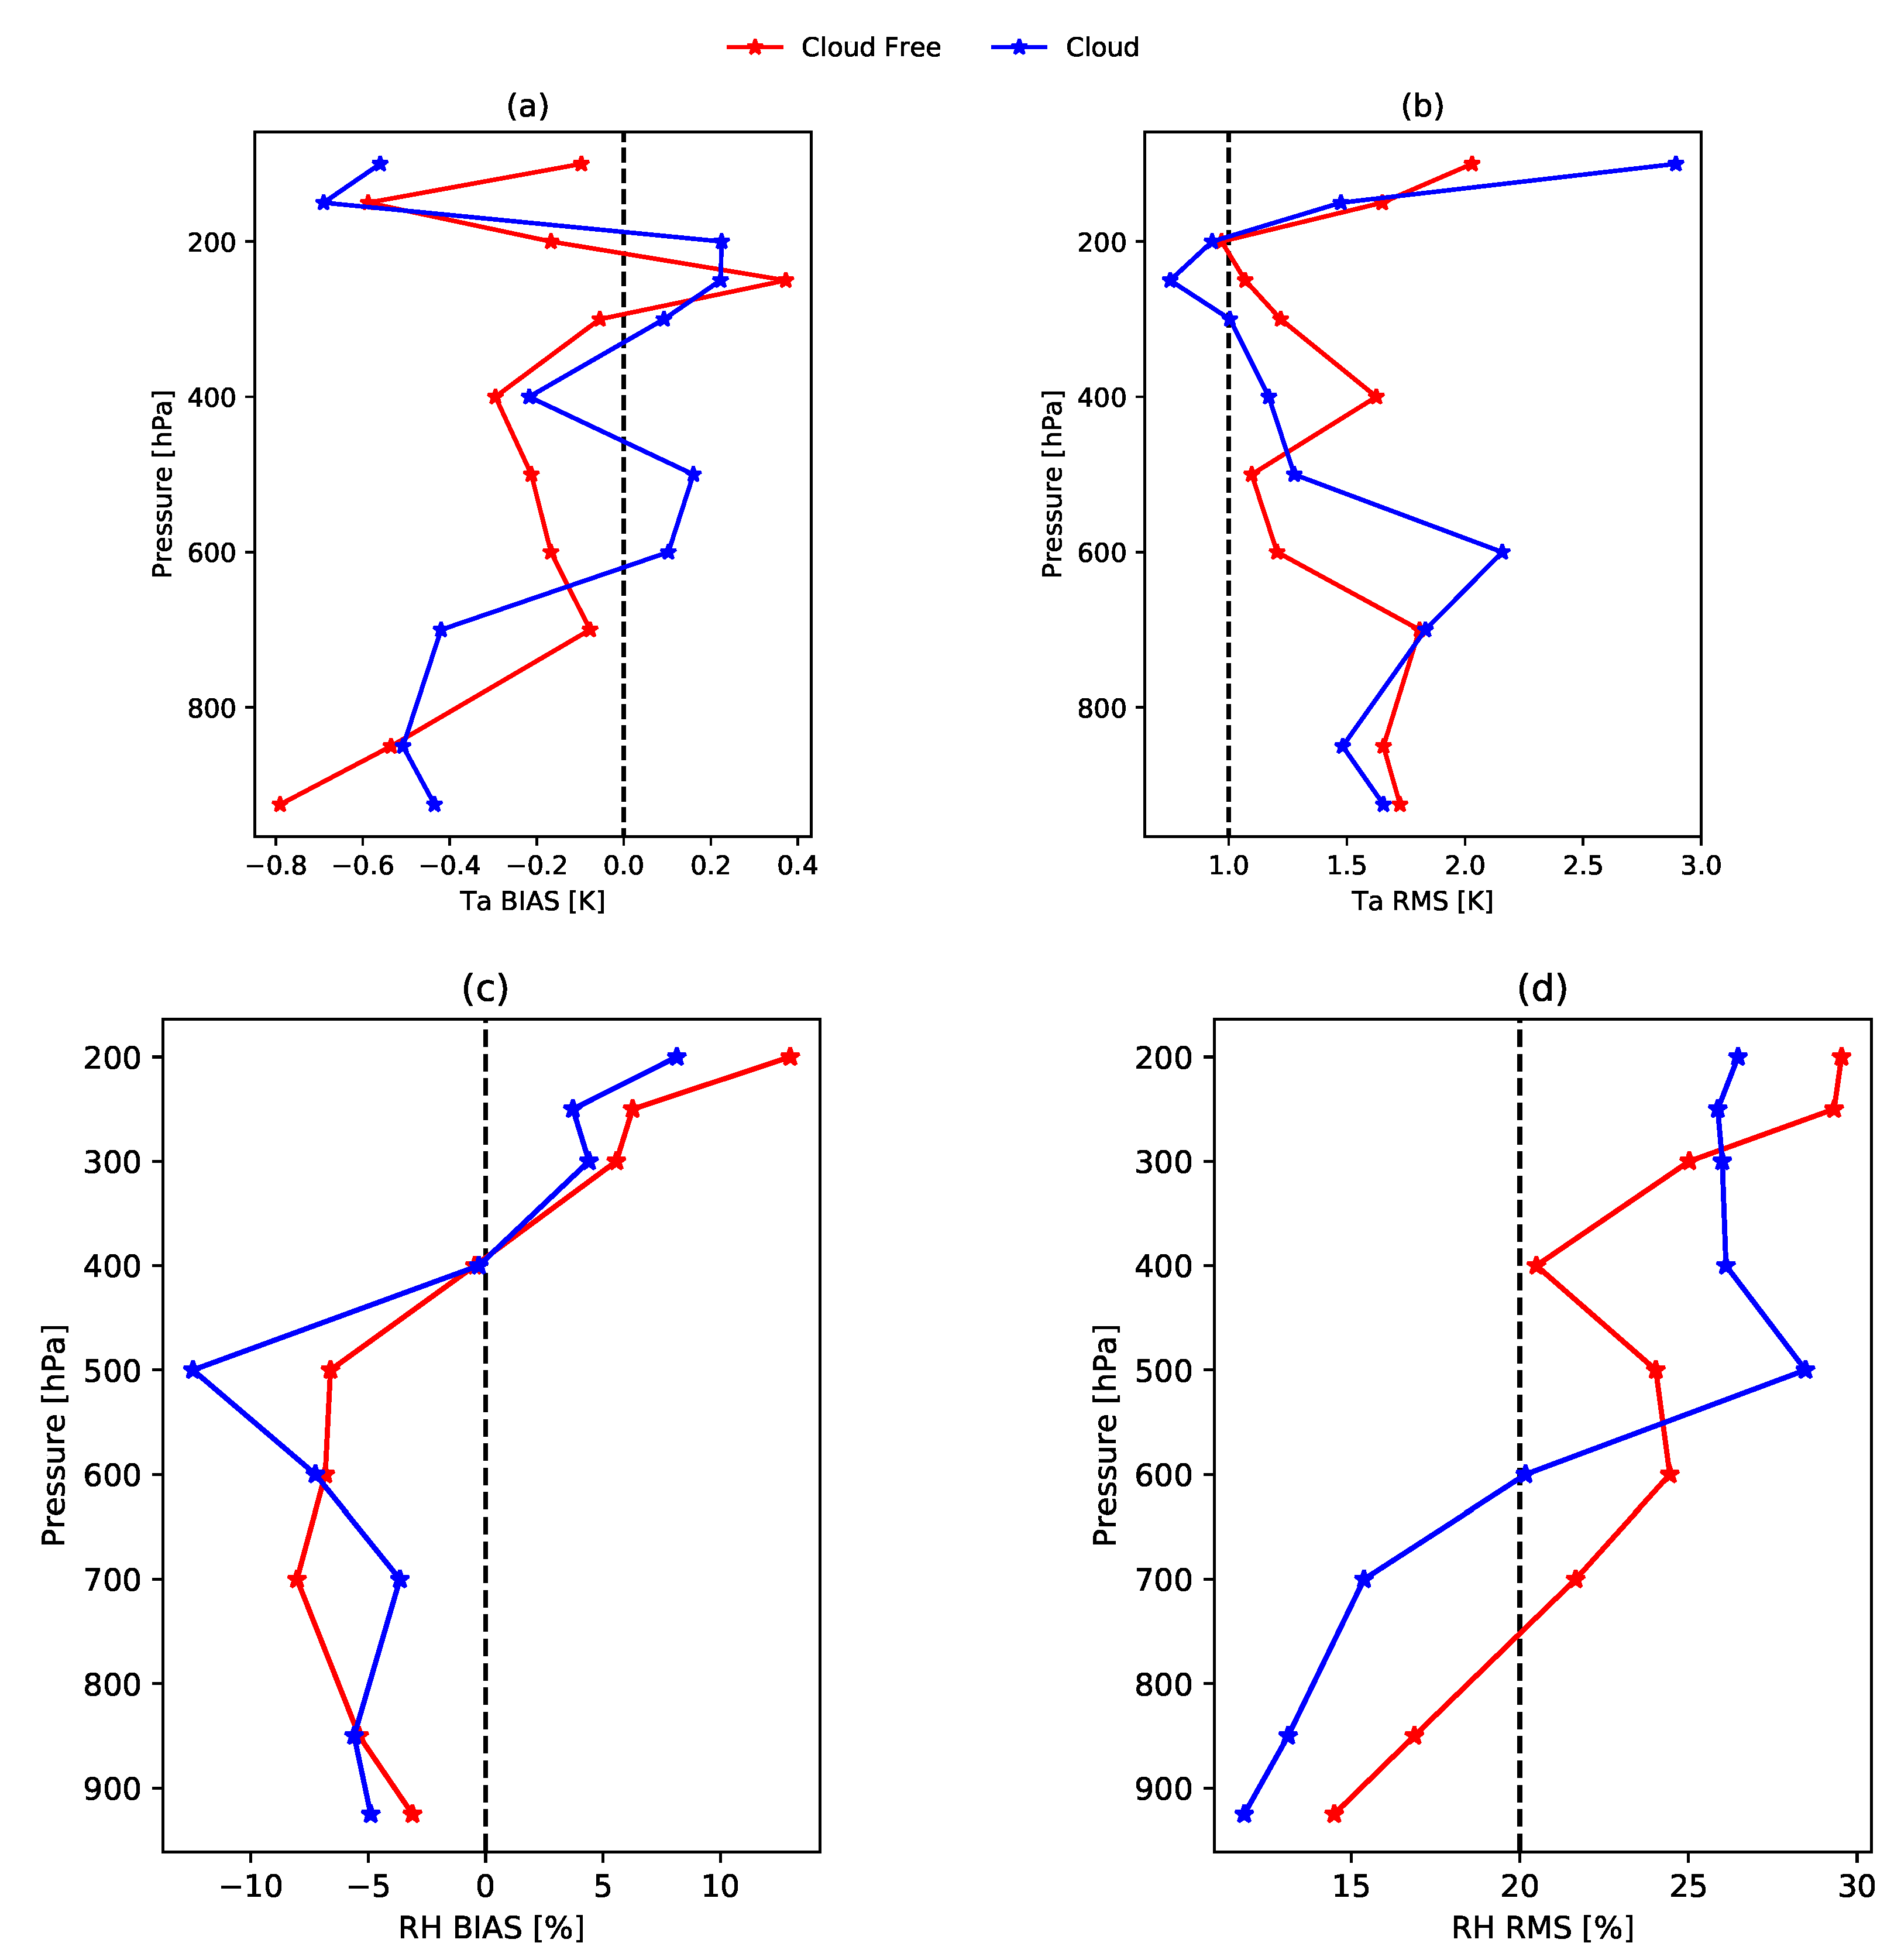
3.3. Cloud Dependence of AIRS Temperature and Relative Humidity Retrieval Accuracy
3.4. AIRS and NCEP_R2 Retrieval Skill Comparisons
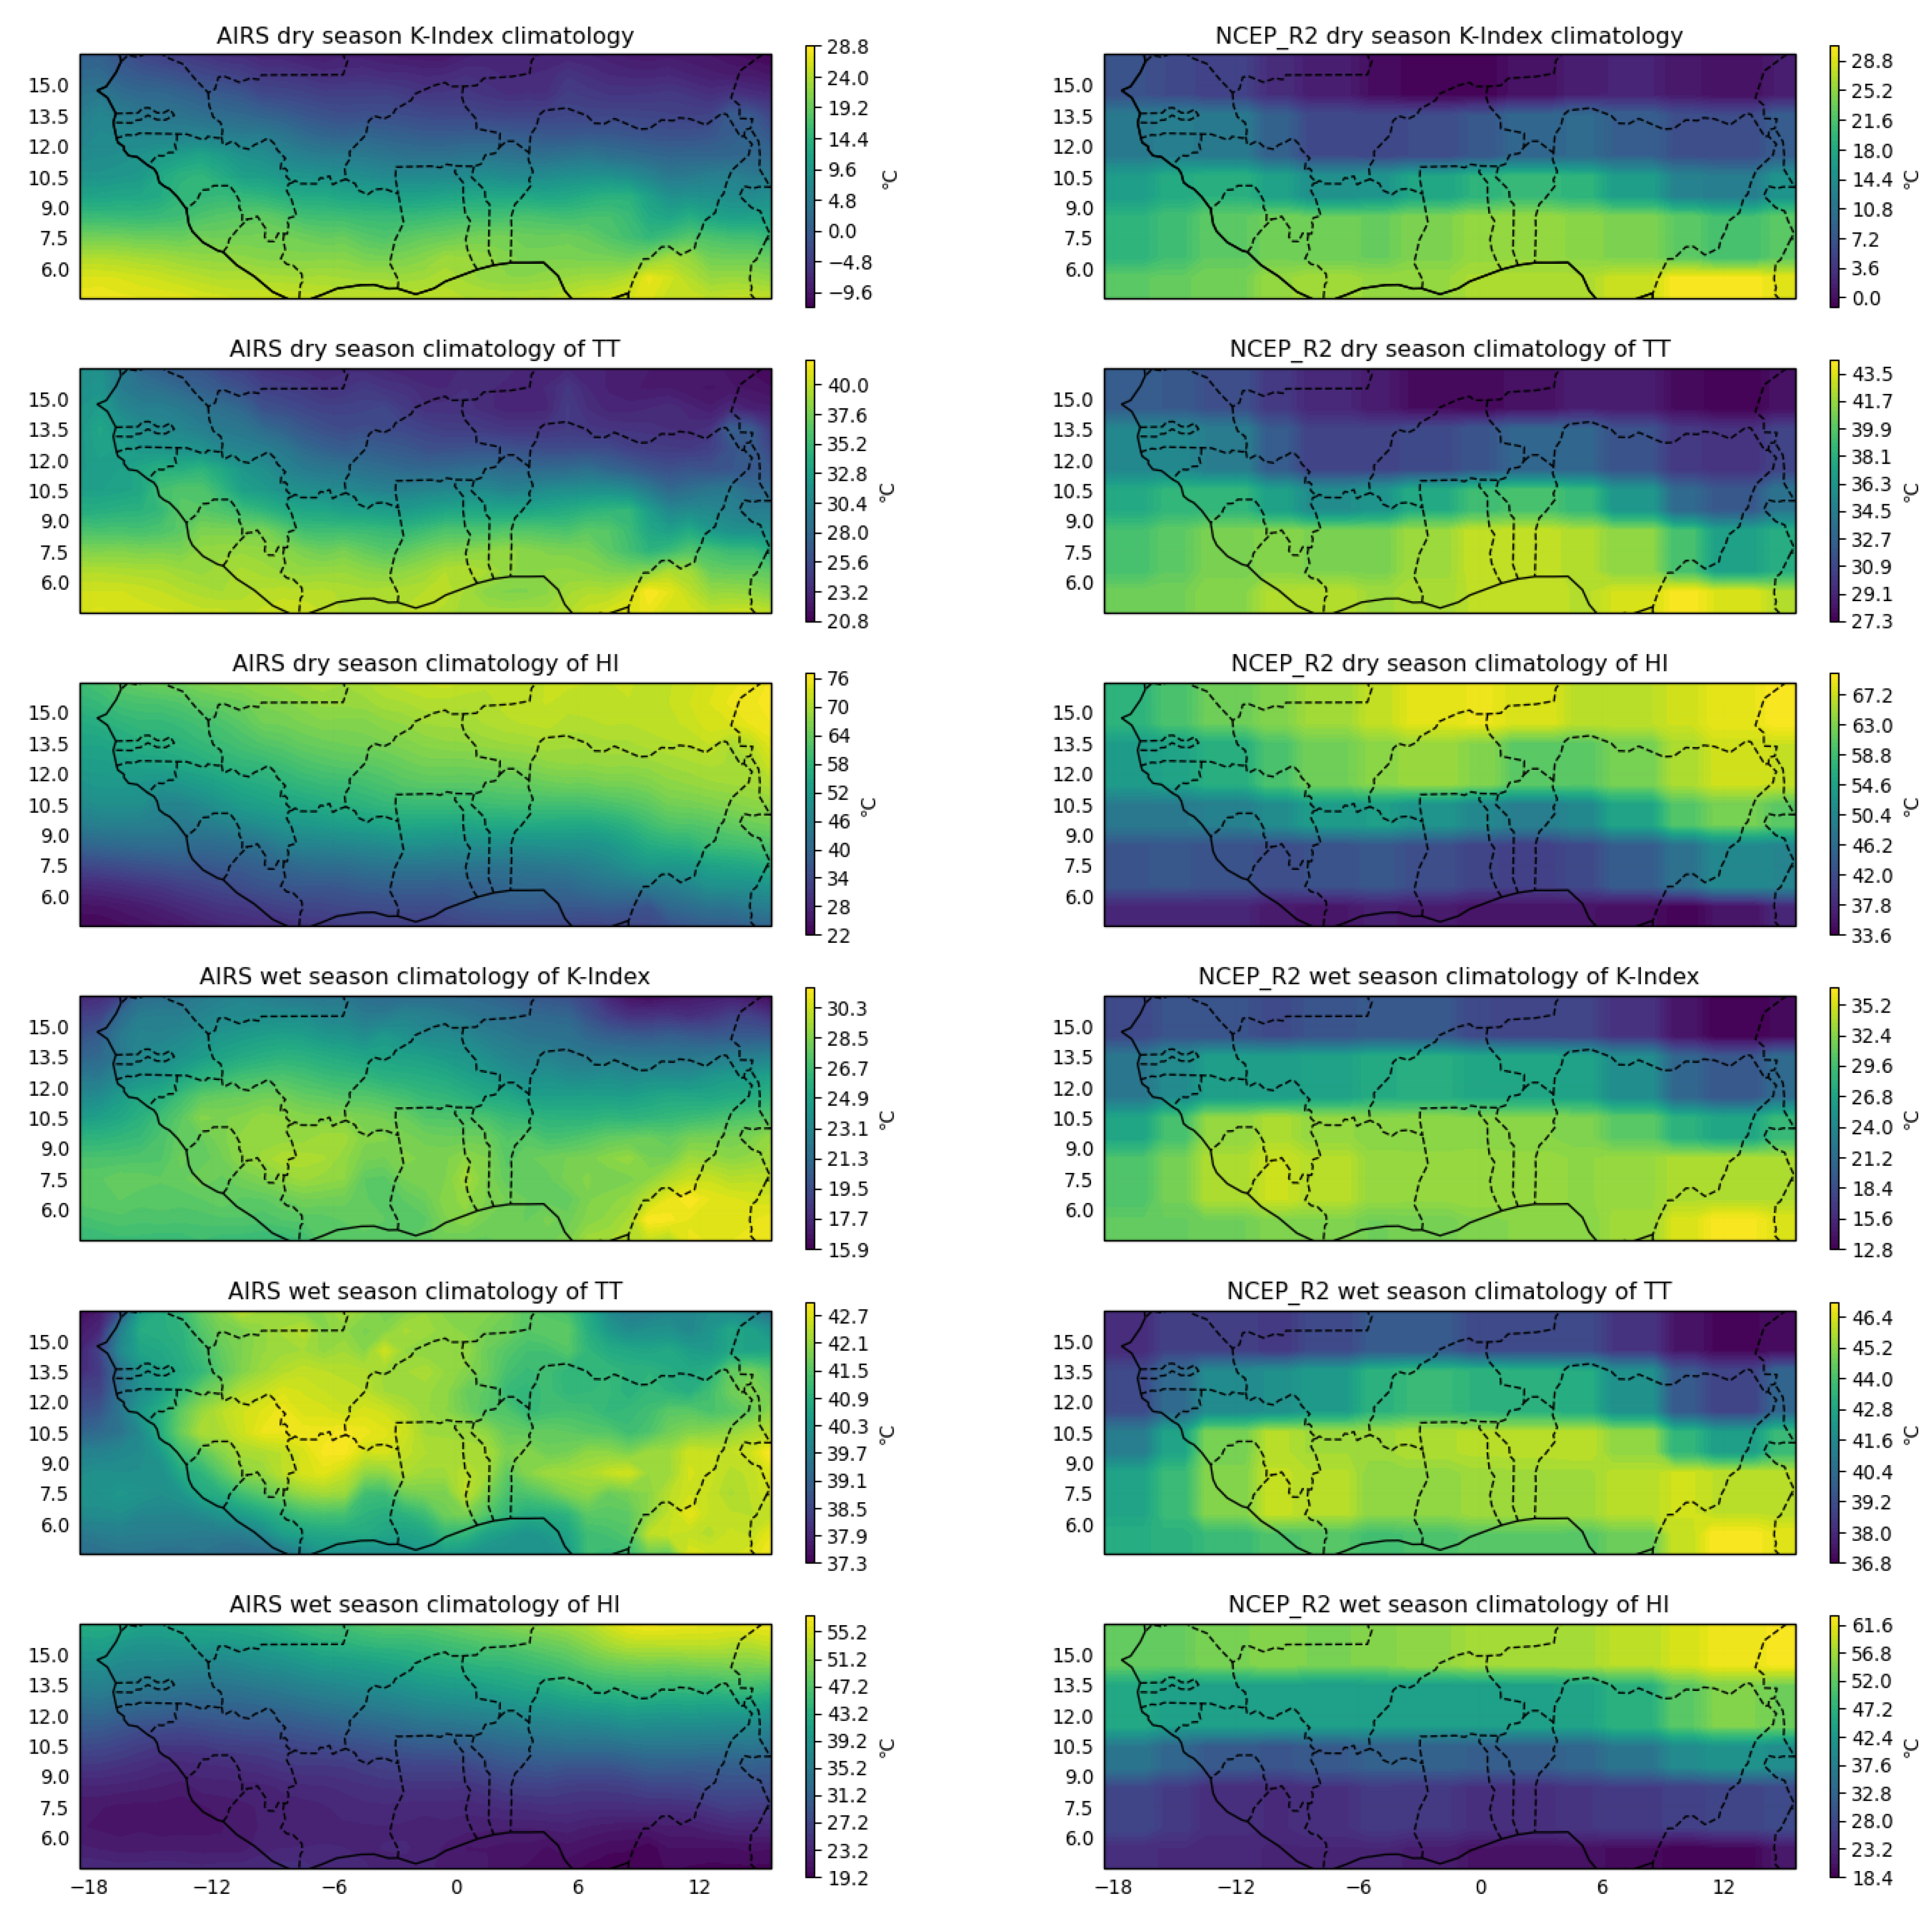
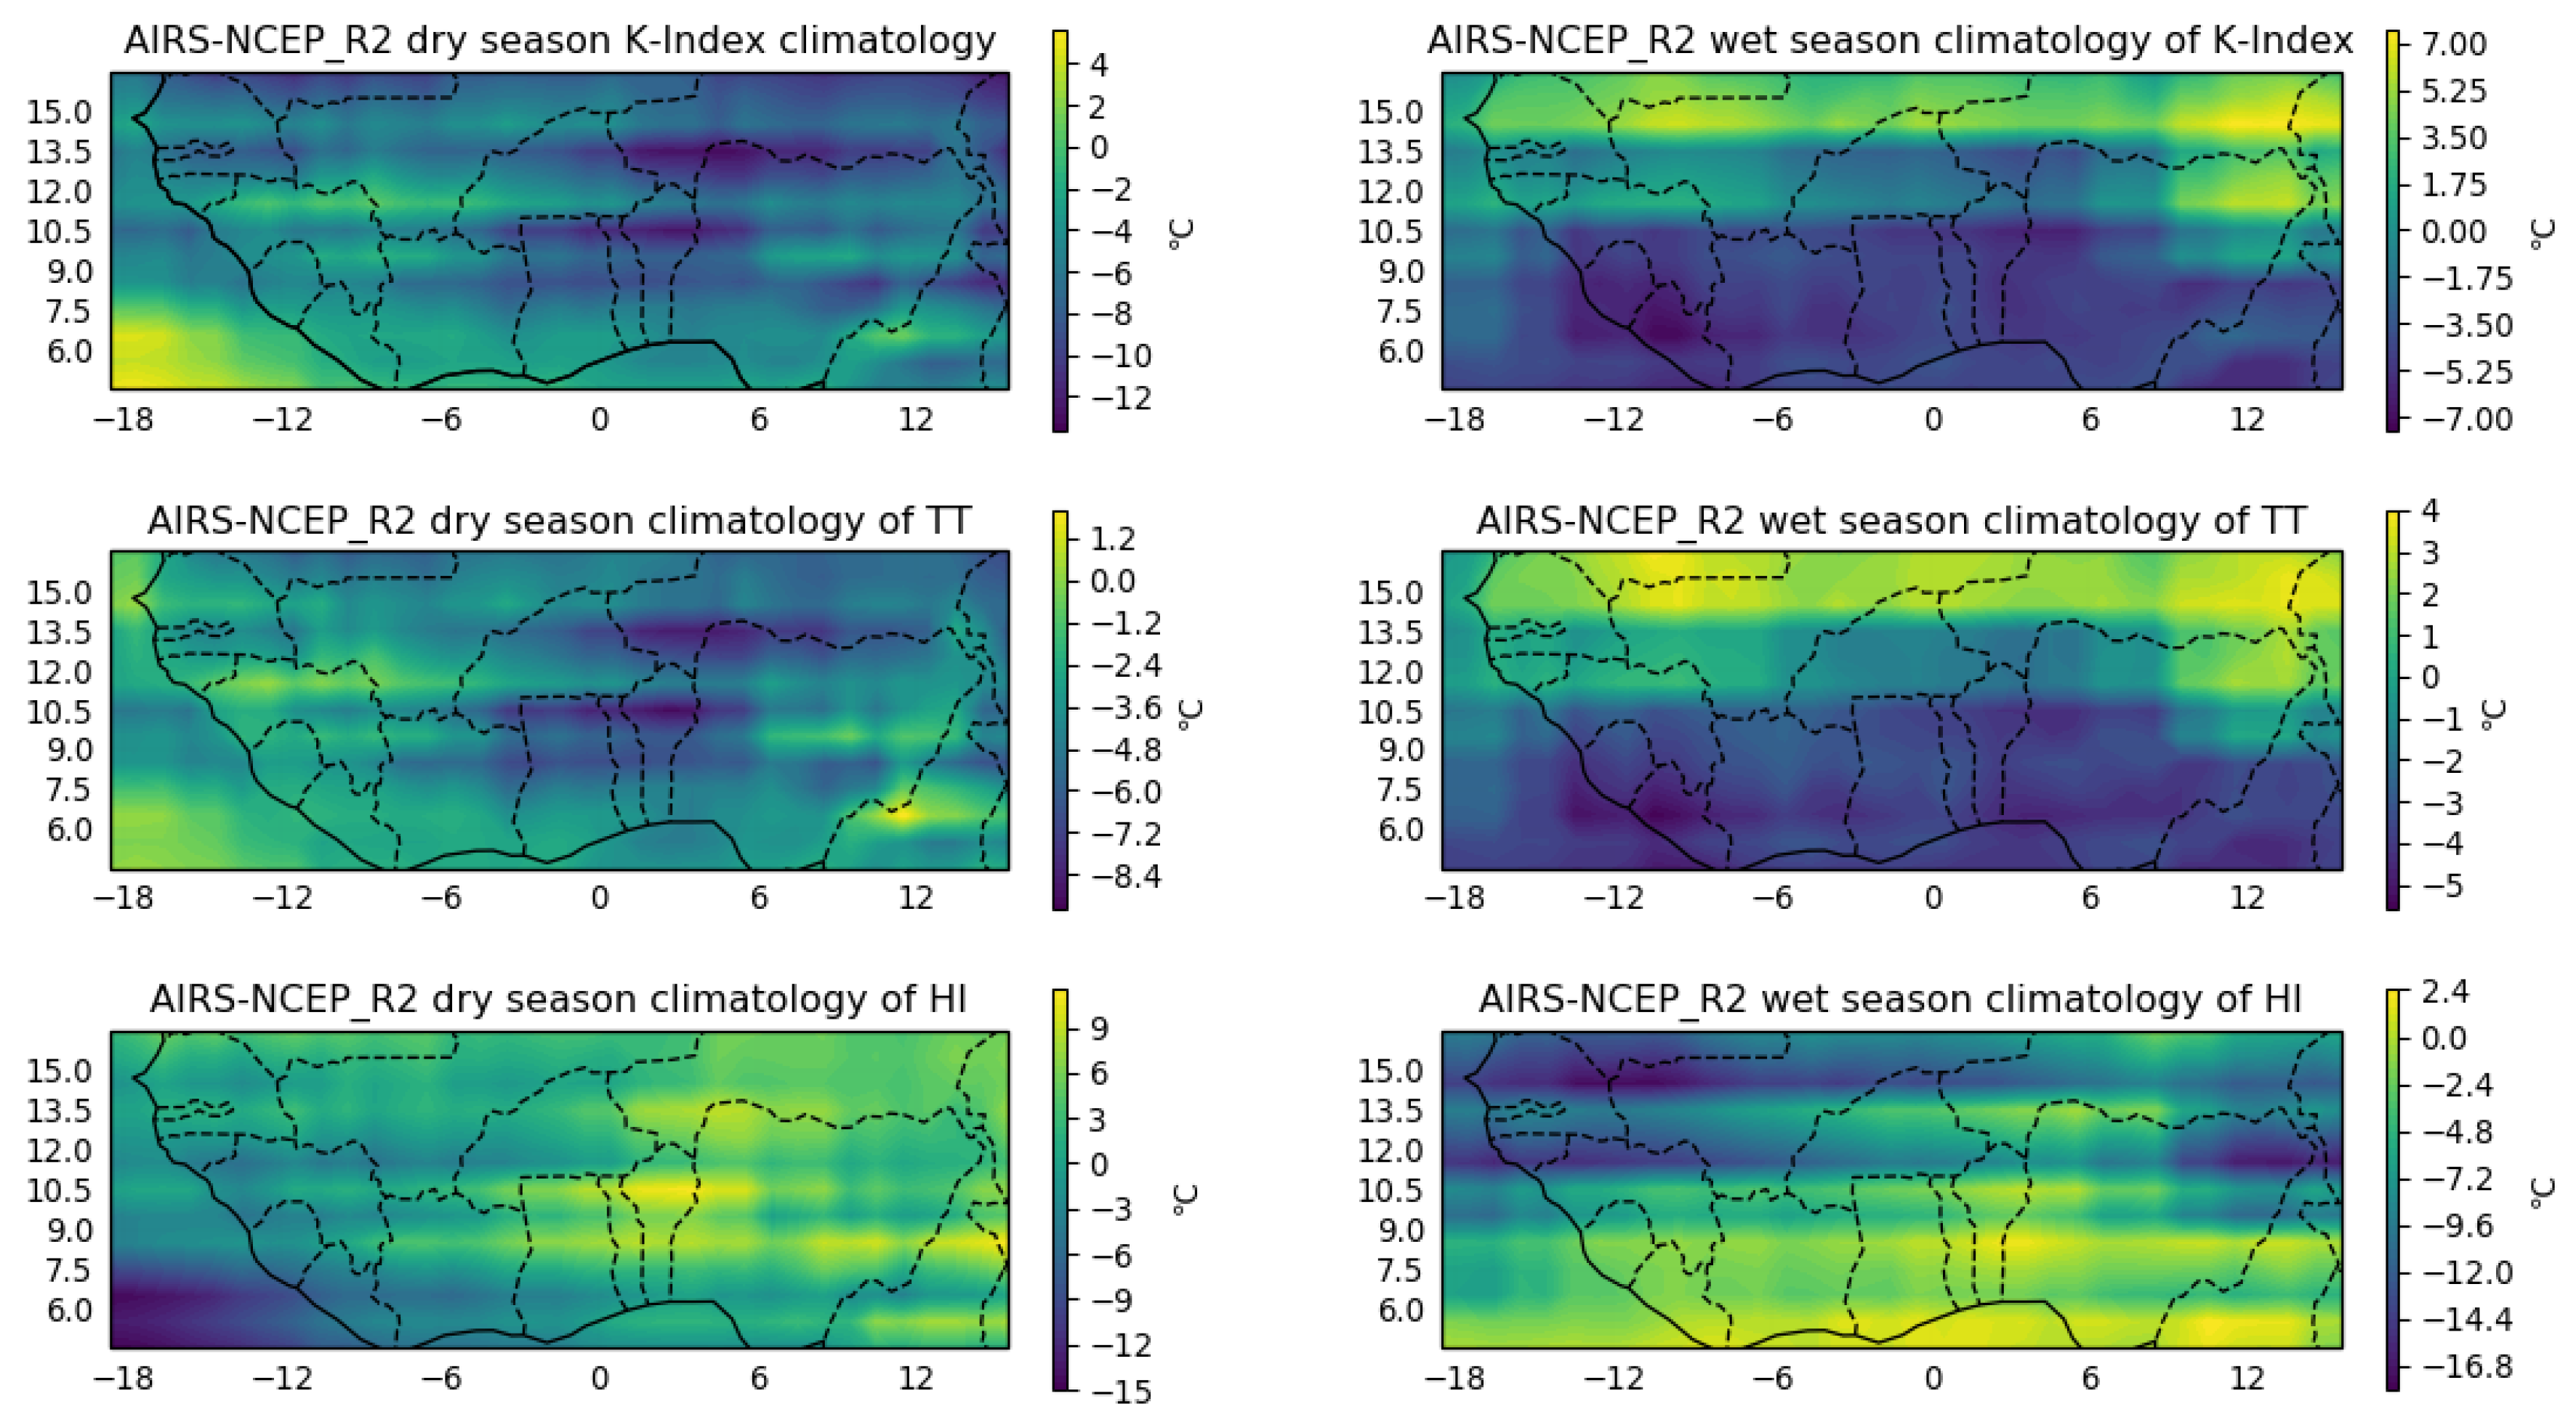
3.5. Variation of Thunderstorm Convective Indices at the Stations
4. Conclusions
Author Contributions
Funding
Acknowledgments
Conflicts of Interest
References
- Diao, M.; Jumbam, L.; Sheffield, J.; Wood, E.F.; Zondlo, M.A. Validation of AIRS/AMSU-A water vapor and temperature data with in situ aircraft observations from the surface to UT/LS from 87 N–67 S. J. Geophys. Res. Atmos. 2013, 118, 6816–6836. [Google Scholar] [CrossRef]
- Divakarla, M.G.; Barnet, C.D.; Goldberg, M.D.; McMillin, L.M.; Maddy, E.; Wolf, W.; Zhou, L.; Liu, X. Validation of Atmospheric Infrared Sounder temperature and water vapor retrievals with matched radiosonde measurements and forecasts. J. Geophys. Res. Atmos. 2006, 111. [Google Scholar] [CrossRef]
- Mears, C.A.; Wang, J.; Smith, D.; Wentz, F.J. Intercomparison of total precipitable water measurements made by satellite-borne microwave radiometers and ground-based GPS instruments. J. Geophys. Res. Atmos. 2015, 120, 2492–2504. [Google Scholar] [CrossRef]
- Madhulatha, A.; Rajeevan, M.; Venkat Ratnam, M.; Bhate, J.; Naidu, C. Nowcasting severe convective activity over southeast India using ground-based microwave radiometer observations. J. Geophys. Res. Atmos. 2013, 118, 1–13. [Google Scholar] [CrossRef]
- Chen, M.; Wang, Y.; Gao, F.; Xiao, X. Diurnal evolution and distribution of warm-season convective storms in different prevailing wind regimes over contiguous North China. J. Geophys. Res. Atmos. 2014, 119, 2742–2763. [Google Scholar] [CrossRef]
- He, X.; Kim, H.; Kirstetter, P.E.; Yoshimura, K.; Chang, E.C.; Ferguson, C.R.; Erlingis, J.M.; Hong, Y.; Oki, T. The diurnal cycle of precipitation in regional spectral model simulations over West Africa: Sensitivities to resolution and cumulus schemes. Weather Forecast. 2015, 30, 424–445. [Google Scholar] [CrossRef]
- Taylor, C.M.; Belušić, D.; Guichard, F.; Parker, D.J.; Vischel, T.; Bock, O.; Harris, P.P.; Janicot, S.; Klein, C.; Panthou, G. Frequency of extreme Sahelian storms tripled since 1982 in satellite observations. Nature 2017, 544, 475. [Google Scholar] [CrossRef]
- Parker, D.J. Meteorology of Tropical West Africa: The Forecasters’ Handbook; John Wiley & Sons: Hoboken, NJ, USA, 2017. [Google Scholar]
- Flores, F.; Rondanelli, R.; Díaz, M.; Querel, R.; Mundnich, K.; Herrera, L.A.; Pola, D.; Carricajo, T. The life cycle of a radiosonde. Bull. Am. Meteorol. Soc. 2013, 94, 187–198. [Google Scholar] [CrossRef]
- Bayat, A.; Maleki, S.M. Comparison of precipitable water vapor derived from AIRS and SPM measurements and its correlation with surface temperature of 29 synoptic stations over Iran. J. Atmos.-Sol.-Terr. Phys. 2018, 178, 24–31. [Google Scholar] [CrossRef]
- Redelsperger, J.L.; Thorncroft, C.D.; Diedhiou, A.; Lebel, T.; Parker, D.J.; Polcher, J. African Monsoon Multidisciplinary Analysis: An international research project and field campaign. Bull. Am. Meteorol. Soc. 2006, 87, 1739–1746. [Google Scholar] [CrossRef]
- Knippertz, P.; Fink, A.H.; Deroubaix, A.; Morris, E.; Tocquer, F.; Evans, M.J.; Flamant, C.; Gaetani, M.; Lavaysse, C.; Mari, C.; et al. A meteorological and chemical overview of the DACCIWA field campaign in West Africa in June–July 2016. Atmos. Chem. Phys. 2017, 17, 10893–10918. [Google Scholar] [CrossRef]
- Aumann, H.H.; Chahine, M.T.; Gautier, C.; Goldberg, M.D.; Kalnay, E.; McMillin, L.M.; Revercomb, H.; Rosenkranz, P.W.; Smith, W.L.; Staelin, D.H.; et al. AIRS/AMSU/HSB on the Aqua mission: Design, science objectives, data products, and processing systems. IEEE Trans. Geosci. Remote Sens. 2003, 41, 253–264. [Google Scholar] [CrossRef]
- Olsen, E.T.; Aumann, H.; Broberg, S.; Chen, L.; Elliott, D.; Fetzer, E.; Fishbein, E.; Friedman, S.; Gaiser, S.; Granger, S.; et al. AIRS/AMSU/HSB Version 6 Data Release User Guide; Goddard Space Flight Center, NASA, Jet Propulsion Laboratory, California Institute of Technology: Pasadena, CA, USA, 2017.
- Susskind, J.; Barnet, C.D.; Blaisdell, J.M. Retrieval of atmospheric and surface parameters from AIRS/AMSU/HSB data in the presence of clouds. IEEE Trans. Geosci. Remote Sens. 2003, 41, 390–409. [Google Scholar] [CrossRef]
- Susskind, J. Improved soundings and error estimates using AIRS/AMSU data. In Algorithms and Technologies for Multispectral, Hyperspectral, and Ultraspectral Imagery XII; International Society for Optics and Photonics: San Diego, CA, USA, 2006; Volume 6233, p. 623319. [Google Scholar]
- Susskind, J. Recent theoretical advances in analysis of AIRS/AMSU sounding data. In Algorithms and Technologies for Multispectral, Hyperspectral, and Ultraspectral Imagery XIII; International Society for Optics and Photonics: San Diego, CA, USA, 2007; Volume 6565, p. 65651H. [Google Scholar]
- McMillin, L.M.; Zhao, J.; Rama Varma Raja, M.; Gutman, S.I.; Yoe, J.G. Radiosonde humidity corrections and potential Atmospheric Infrared Sounder moisture accuracy. J. Geophys. Res. Atmos. 2007, 112. [Google Scholar] [CrossRef]
- Quaas, J. Evaluating the “critical relative humidity” as a measure of subgrid-scale variability of humidity in general circulation model cloud cover parameterizations using satellite data. J. Geophys. Res. Atmos. 2012, 117. [Google Scholar] [CrossRef]
- Ferguson, C.; Wood, E. An evaluation of satellie remote sensing data products for land surface hydrology: Atmospheric Infrared Sounder. J. Hydrometeorol. 2010, 11, 1234–1261. [Google Scholar] [CrossRef]
- Ferguson, C.; Wood, E. Observed land-atmosphere coupling from satellite remote sensing and reanalysis. J. Hydrometeorol. 2011, 12, 1221–1254. [Google Scholar] [CrossRef]
- Prasad, A.K.; Singh, R.P. Validation of MODIS Terra, AIRS, NCEP/DOE AMIP-II Reanalysis-2, and AERONET Sun photometer derived integrated precipitable water vapor using ground-based GPS receivers over India. J. Geophys. Res. Atmos. 2009, 114. [Google Scholar] [CrossRef]
- Singh, T.; Mittal, R.; Shukla, M.V. Validation of INSAT-3D temperature and moisture sounding retrievals using matched radiosonde measurements. Int. J. Remote Sens. 2017, 38, 3333–3355. [Google Scholar] [CrossRef]
- Boylan, P.; Wang, J.; Cohn, S.A.; Fetzer, E.; Maddy, E.S.; Wong, S. Validation of AIRS version 6 temperature profiles and surface-based inversions over Antarctica using Concordiasi dropsonde data. J. Geophys. Res. Atmos. 2015, 120, 992–1007. [Google Scholar] [CrossRef]
- Milstein, A.B.; Blackwell, W.J. Neural network temperature and moisture retrieval algorithm validation for AIRS/AMSU and CrIS/ATMS. J. Geophys. Res. Atmos. 2016, 121, 1414–1430. [Google Scholar] [CrossRef]
- Xuebao, W.; Jun, L.; Wenjian, Z.; Fang, W. Atmospheric profile retrieval with AIRS data and validation at the ARM CART site. Adv. Atmos. Sci. 2005, 22, 647–654. [Google Scholar] [CrossRef]
- Reale, A.; Tilley, F.; Ferguson, M.; Allegrino, A. NOAA operational sounding products for advanced TOVS. Int. J. Remote Sens. 2008, 29, 4615–4651. [Google Scholar] [CrossRef]
- Liang, C.; Eldering, A.; Gettelman, A.; Tian, B.; Wong, S.; Fetzer, E.; Liou, K. Record of tropical interannual variability of temperature and water vapor from a combined AIRS-MLS data set. J. Geophys. Res. Atmos. 2011, 116. [Google Scholar] [CrossRef]
- Susskind, J.; Blaisdell, J.M.; Iredell, L.; Keita, F. Improved temperature sounding and quality control methodology using AIRS/AMSU data: The AIRS science team version 5 retrieval algorithm. IEEE Trans. Geosci. Remote Sens. 2011, 49, 883–907. [Google Scholar] [CrossRef]
- Olsen, E.T. AIRS Version 6.1.1 Processing Files Description; Goddard Space Flight Center, NASA, Jet Propulsion Laboratory, California Institute of Technology: Pasadena, CA, USA, 2016.
- Kanamitsu, M.; Ebisuzaki, W.; Woollen, J.; Yang, S.K.; Hnilo, J.; Fiorino, M.; Potter, G. Ncep–doe amip-ii reanalysis (r-2). Bull. Am. Meteorol. Soc. 2002, 83, 1631–1644. [Google Scholar] [CrossRef]
- Wang, Y.; Zhou, D.; Bunde, A.; Havlin, S. Testing reanalysis data sets in Antarctica: Trends, persistence properties, and trend significance. J. Geophys. Res. Atmos. 2016, 121. [Google Scholar] [CrossRef]
- Peppler, R.A. A Review of Statics Stability Indices and Related Thermodynamic Parameters; Technical report; Illinois State Water Survey: Champaign, IL, USA, 1988. [Google Scholar]
- George, J. Weather Forecasting for Aeronautics; Academic Press: New York, NY, USA, 1960; pp. 409–415. [Google Scholar]
- Miller, R.C. Notes on Analysis and Severe-Storm Forecasting Procedures of the Air Force Global Weather Central; AWS: Seattle, WA, USA, 1975; Volume 200. [Google Scholar]
- Jacovides, C.; Yonetani, T. An evaluation of stability indices for thunderstorm prediction in Greater Cyprus. Weather Forecast. 1990, 5, 559–569. [Google Scholar] [CrossRef]
- Marinaki, A.; Spiliotopoulos, M.; Michalopoulou, H. Evaluation of atmospheric instability indices in Greece. Adv. Geosci. 2006, 7, 131–135. [Google Scholar] [CrossRef]
- Pfahl, S.; Niedermann, N. Daily covariations in near-surface relative humidity and temperature over the ocean. J. Geophys. Res. Atmos. 2011, 116. [Google Scholar] [CrossRef]
- Amekudzi, L.K.; Yamba, E.I.; Preko, K.; Asare, E.O.; Aryee, J.; Baidu, M.; Codjoe, S.N. Variabilities in rainfall onset, cessation and length of rainy season for the various agro-ecological zones of Ghana. Climate 2015, 3, 416–434. [Google Scholar] [CrossRef]
- Baidu, M.; Amekudzi, L.K.; Aryee, J.N.; Annor, T. Assessment of long-term spatio-temporal rainfall variability over Ghana using wavelet analysis. Climate 2017, 5, 30. [Google Scholar] [CrossRef]
- Wong, S.; Fetzer, E.J.; Schreier, M.; Manipon, G.; Fishbein, E.F.; Kahn, B.H.; Yue, Q.; Irion, F.W. Cloud-induced uncertainties in AIRS and ECMWF temperature and specific humidity. J. Geophys. Res. Atmos. 2015, 120, 1880–1901. [Google Scholar] [CrossRef]


| Station | Ascending Overpass | Descending Overpass | Dry Season (December–February) | Wet Season (March–November) |
|---|---|---|---|---|
| Abidjan | 30 | 248 | 91 | 187 |
| Accra | 18 | 12 | - | 30 |
| Cotonou | 58 | 118 | 56 | 120 |
| Kumasi | 5 | 3 | - | 8 |
| Parakou | 18 | 86 | 7 | 97 |
| Tamale | 14 | 13 | 3 | 24 |
| Ougadougou | 12 | 31 | 5 | 38 |
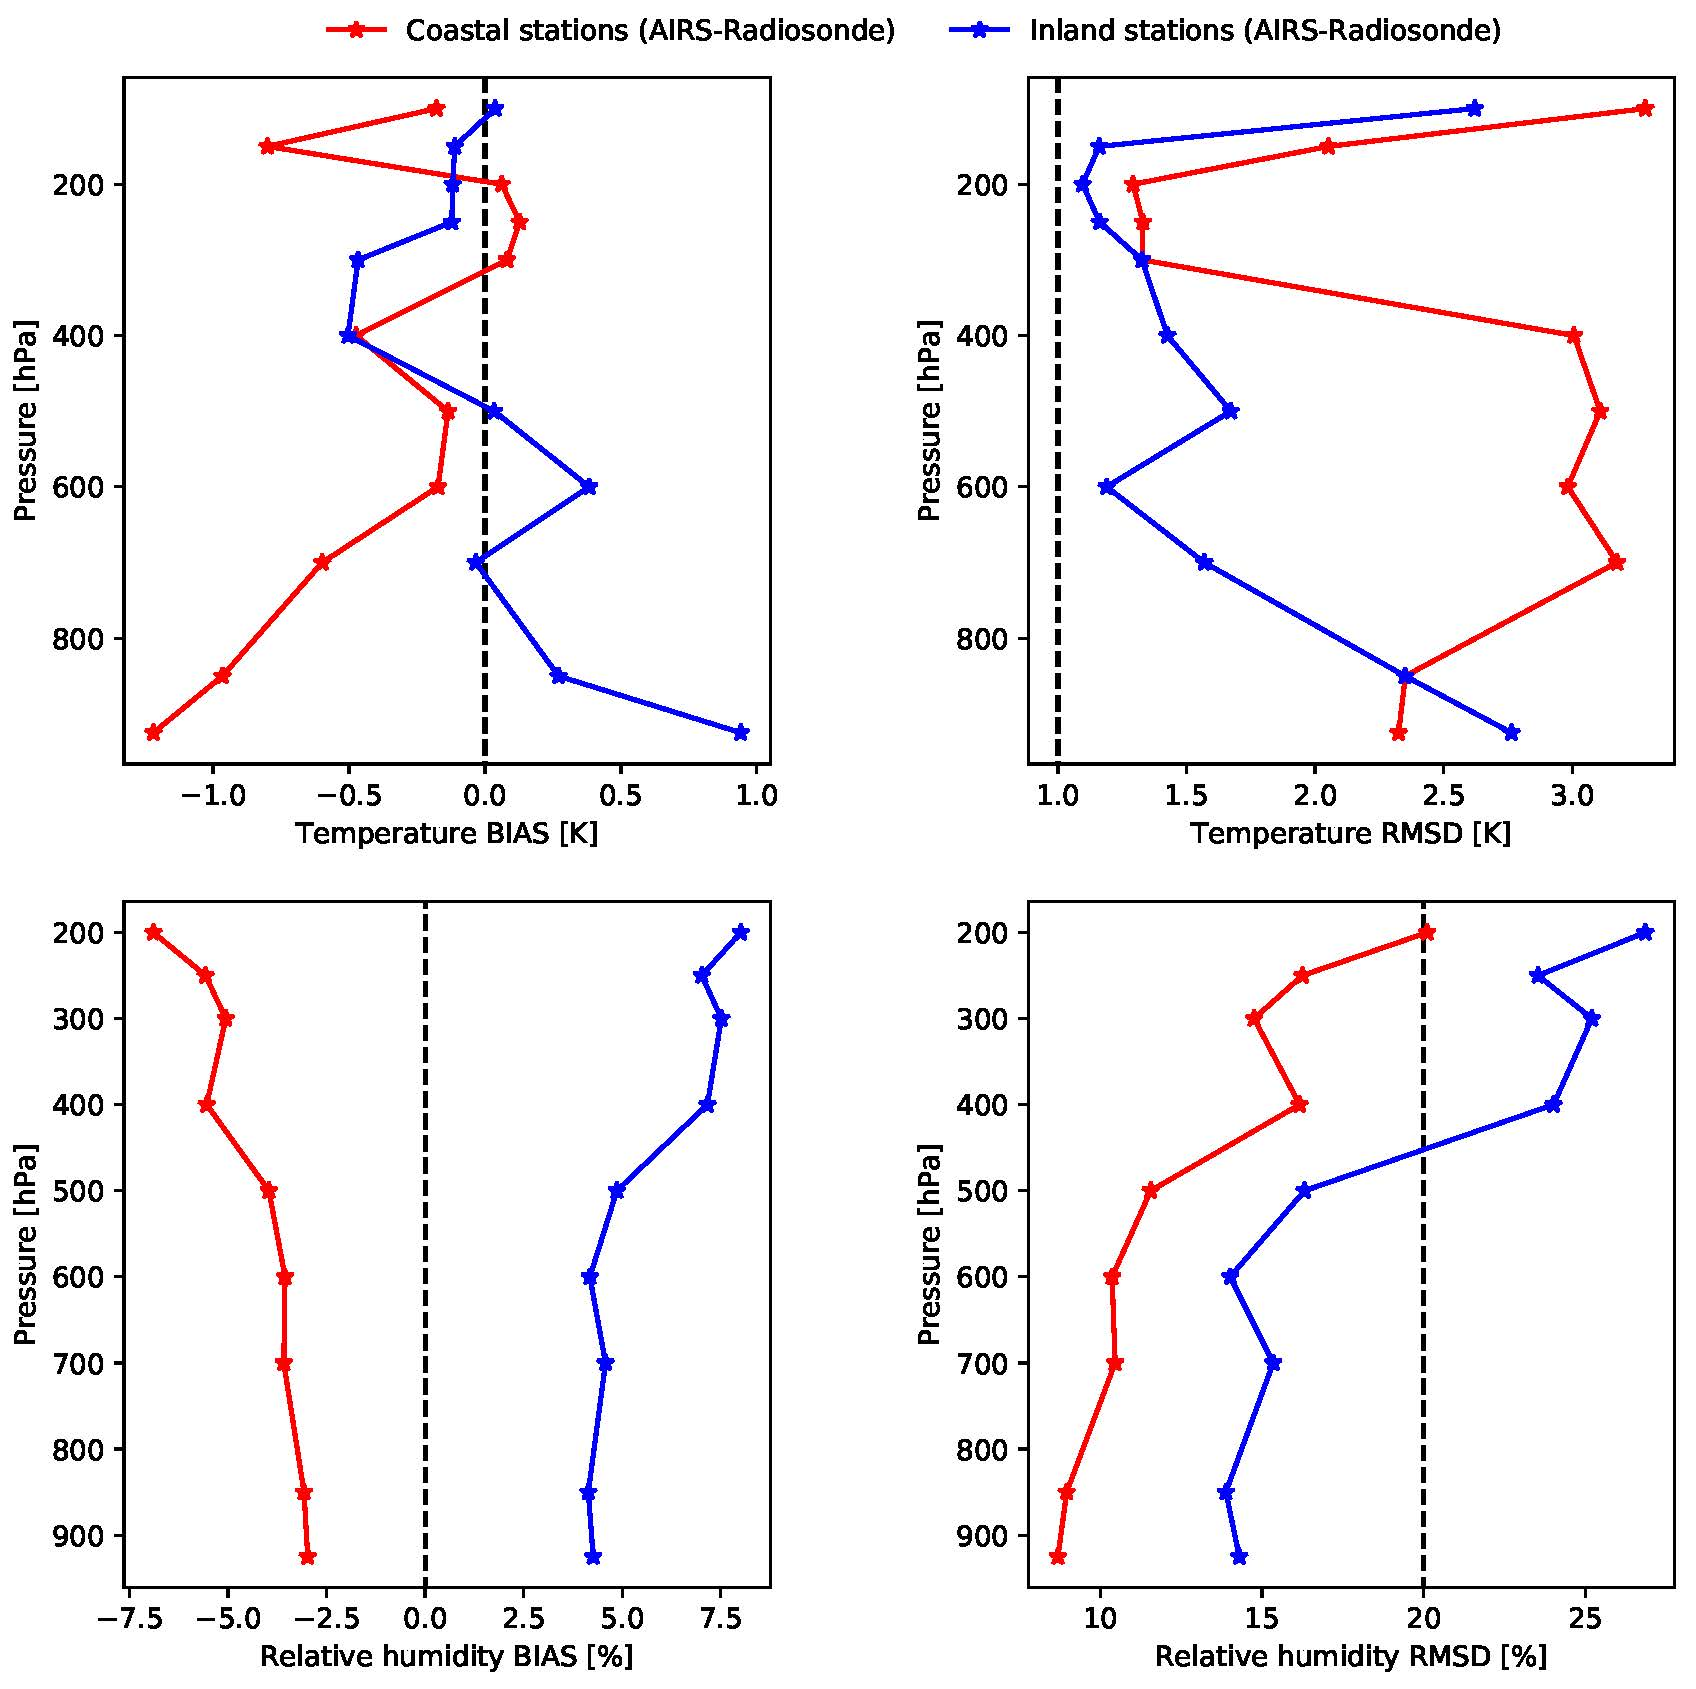
| Pressure Level (hPa) | Temperature RMSD (%) | RH RMSD (%) | ||
|---|---|---|---|---|
| Coast | Inland | Coast | Inland | |
| 925 | 2.32 | 2.76 | 8.68 | 7.73 |
| 850 | 2.35 | 2.34 | 8.96 | 7.97 |
| 700 | 3.17 | 1.56 | 10.45 | 9.30 |
| 600 | 2.98 | 1.18 | 10.36 | 9.22 |
| 500 | 3.10 | 1.67 | 11.55 | 10.28 |
| 400 | 3.00 | 1.42 | 16.16 | 14.38 |
| 300 | 1.32 | 1.32 | 14.75 | 13.13 |
| 250 | 1.33 | 1.67 | 16.25 | 14.46 |
| 200 | 1.29 | 1.09 | 20.10 | 17.89 |
| 150 | 2.05 | 1.16 | ||
| 100 | 3.28 | 2.62 | ||
| Station | K-Index | TT Index | HI | ||||||
|---|---|---|---|---|---|---|---|---|---|
| RAOB | AIRS | NCEP | RAOB | AIRS | NCEP | RAOB | AIRS | NCEP | |
| Abidjan | 23.86 | 25.13 | 25.80 | 38.43 | 40.64 | 40.65 | 29.73 | 29.55 | 28.80 |
| Cotonou | 23.18 | 25.47 | 20.58 | 37.30 | 40.47 | 38.78 | 29.58 | 22.33 | 40.34 |
| Ougadougou | −1.85 | −9.37 | 9.44 | 21.81 | 13.50 | 27.78 | 77.31 | 95.89 | 63.57 |
| Parakou | 21.05 | 23.50 | 28.82 | 37.52 | 38.02 | 43.80 | 42.53 | 42.75 | 38.00 |
| Tamale | −2.26 | −0.66 | 21.88 | 27.97 | 30.53 | 46.05 | 76.75 | 72.46 | 45.61 |
| Station | K-Index | TT Index | HI | ||||||
|---|---|---|---|---|---|---|---|---|---|
| RAOB | AIRS | NCEP | RAOB | AIRS | NCEP | RAOB | AIRS | NCEP | |
| Abidjan | 27.77 | 28.20 | 30.01 | 40.18 | 41.26 | 41.45 | 21.57 | 21.56 | 17.95 |
| Accra | 28.50 | 30.99 | 28.61 | 39.95 | 40.83 | 39.73 | 19.44 | 15.18 | 14.29 |
| Cotonou | 23.35 | 32.21 | 31.26 | 35.51 | 42.04 | 42.05 | 21.78 | 14.24 | 15.90 |
| Kumasi | 28.19 | 31.32 | 32.74 | 40.51 | 42.37 | 42.80 | 18.82 | 15.55 | 12.51 |
| Ougadougou | 22.72 | 31.80 | 33.57 | 37.45 | 45.27 | 46.36 | 28.90 | 22.78 | 23.74 |
| Parakou | 29.15 | 33.52 | 33.79 | 41.82 | 43.39 | 44.37 | 21.44 | 14.24 | 15.64 |
| Tamale | 29.78 | 32.48 | 32.36 | 42.76 | 45.40 | 46.99 | 23.97 | 23.21 | 17.24 |
© 2020 by the authors. Licensee MDPI, Basel, Switzerland. This article is an open access article distributed under the terms and conditions of the Creative Commons Attribution (CC BY) license (http://creativecommons.org/licenses/by/4.0/).
Share and Cite
Osei, M.A.; Amekudzi, L.K.; Ferguson, C.R.; Danuor, S.K. Inter-Comparison of AIRS Temperature and Relative Humidity Profiles with AMMA and DACCIWA Radiosonde Observations over West Africa. Remote Sens. 2020, 12, 2631. https://doi.org/10.3390/rs12162631
Osei MA, Amekudzi LK, Ferguson CR, Danuor SK. Inter-Comparison of AIRS Temperature and Relative Humidity Profiles with AMMA and DACCIWA Radiosonde Observations over West Africa. Remote Sensing. 2020; 12(16):2631. https://doi.org/10.3390/rs12162631
Chicago/Turabian StyleOsei, Marian Amoakowaah, Leonard Kofitse Amekudzi, Craig R. Ferguson, and Sylvester Kojo Danuor. 2020. "Inter-Comparison of AIRS Temperature and Relative Humidity Profiles with AMMA and DACCIWA Radiosonde Observations over West Africa" Remote Sensing 12, no. 16: 2631. https://doi.org/10.3390/rs12162631
APA StyleOsei, M. A., Amekudzi, L. K., Ferguson, C. R., & Danuor, S. K. (2020). Inter-Comparison of AIRS Temperature and Relative Humidity Profiles with AMMA and DACCIWA Radiosonde Observations over West Africa. Remote Sensing, 12(16), 2631. https://doi.org/10.3390/rs12162631