Localized Subsidence Zones in Gävle City Detected by Sentinel-1 PSI and Leveling Data


Abstract
1. Introduction
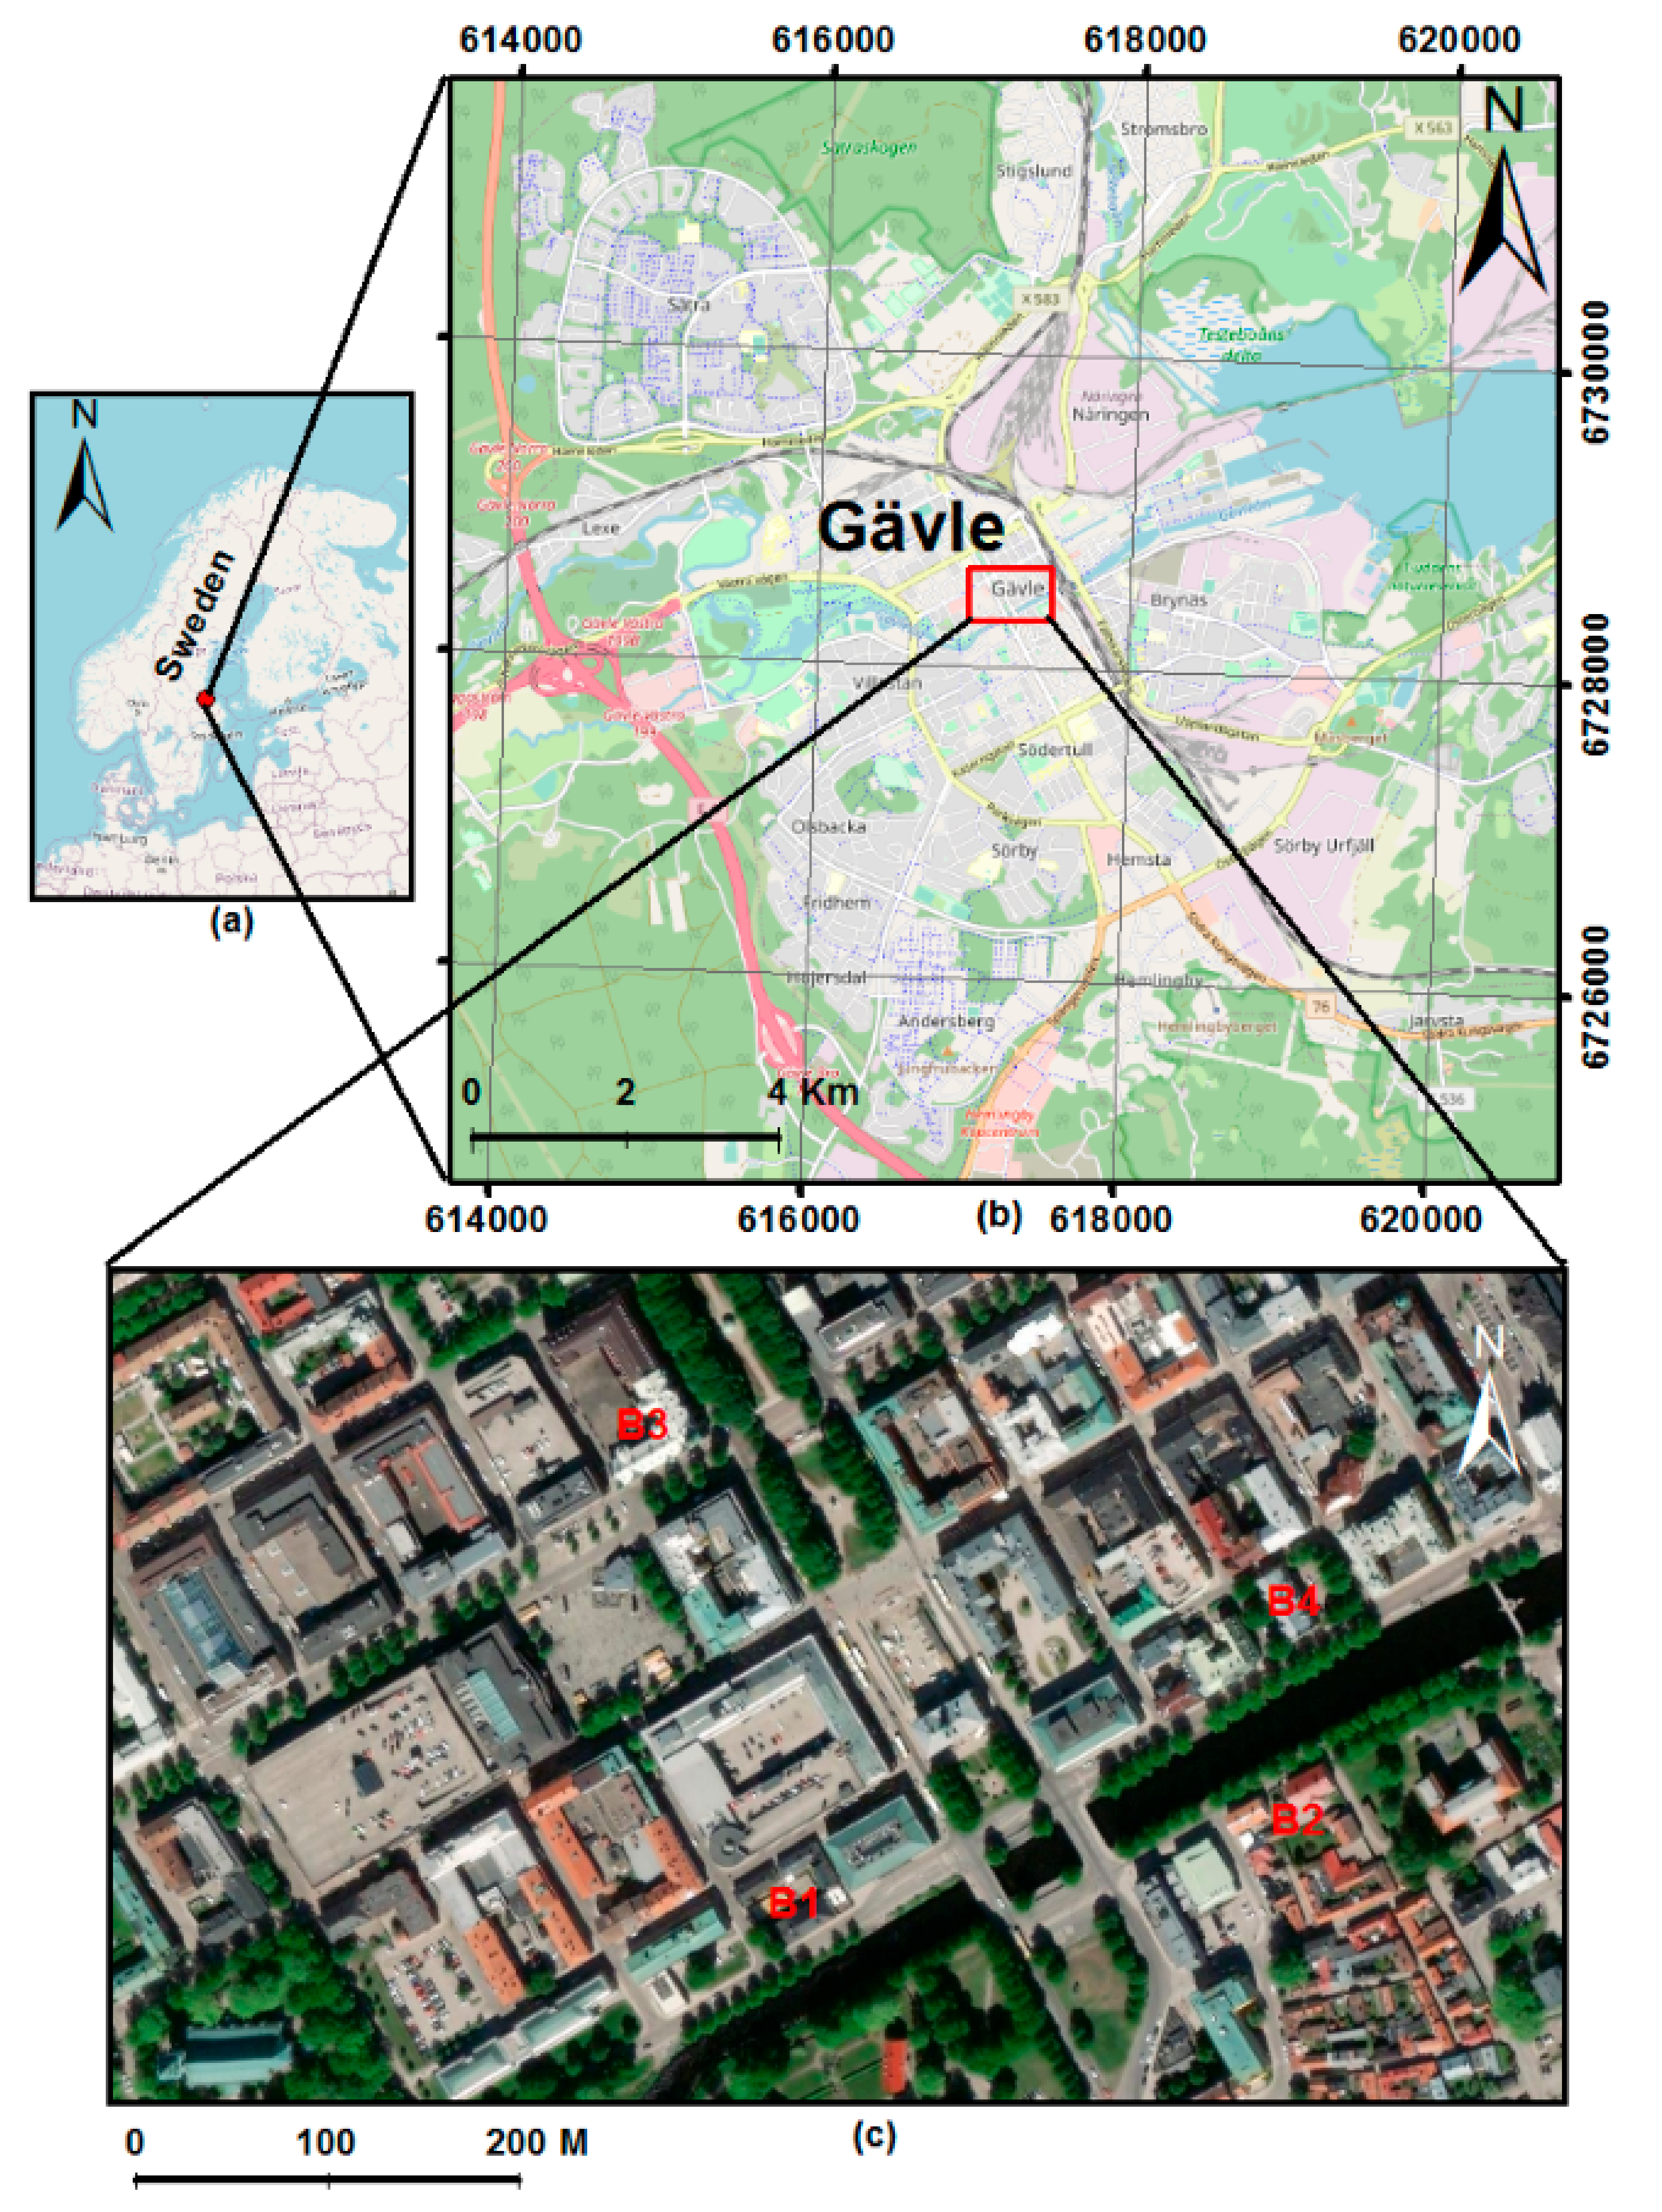
2. Study Area
3. Data and Methods
3.1. PSI Method
3.2. Sentinel-1 Data and Analysis
3.3. Levelling Data and Analysis
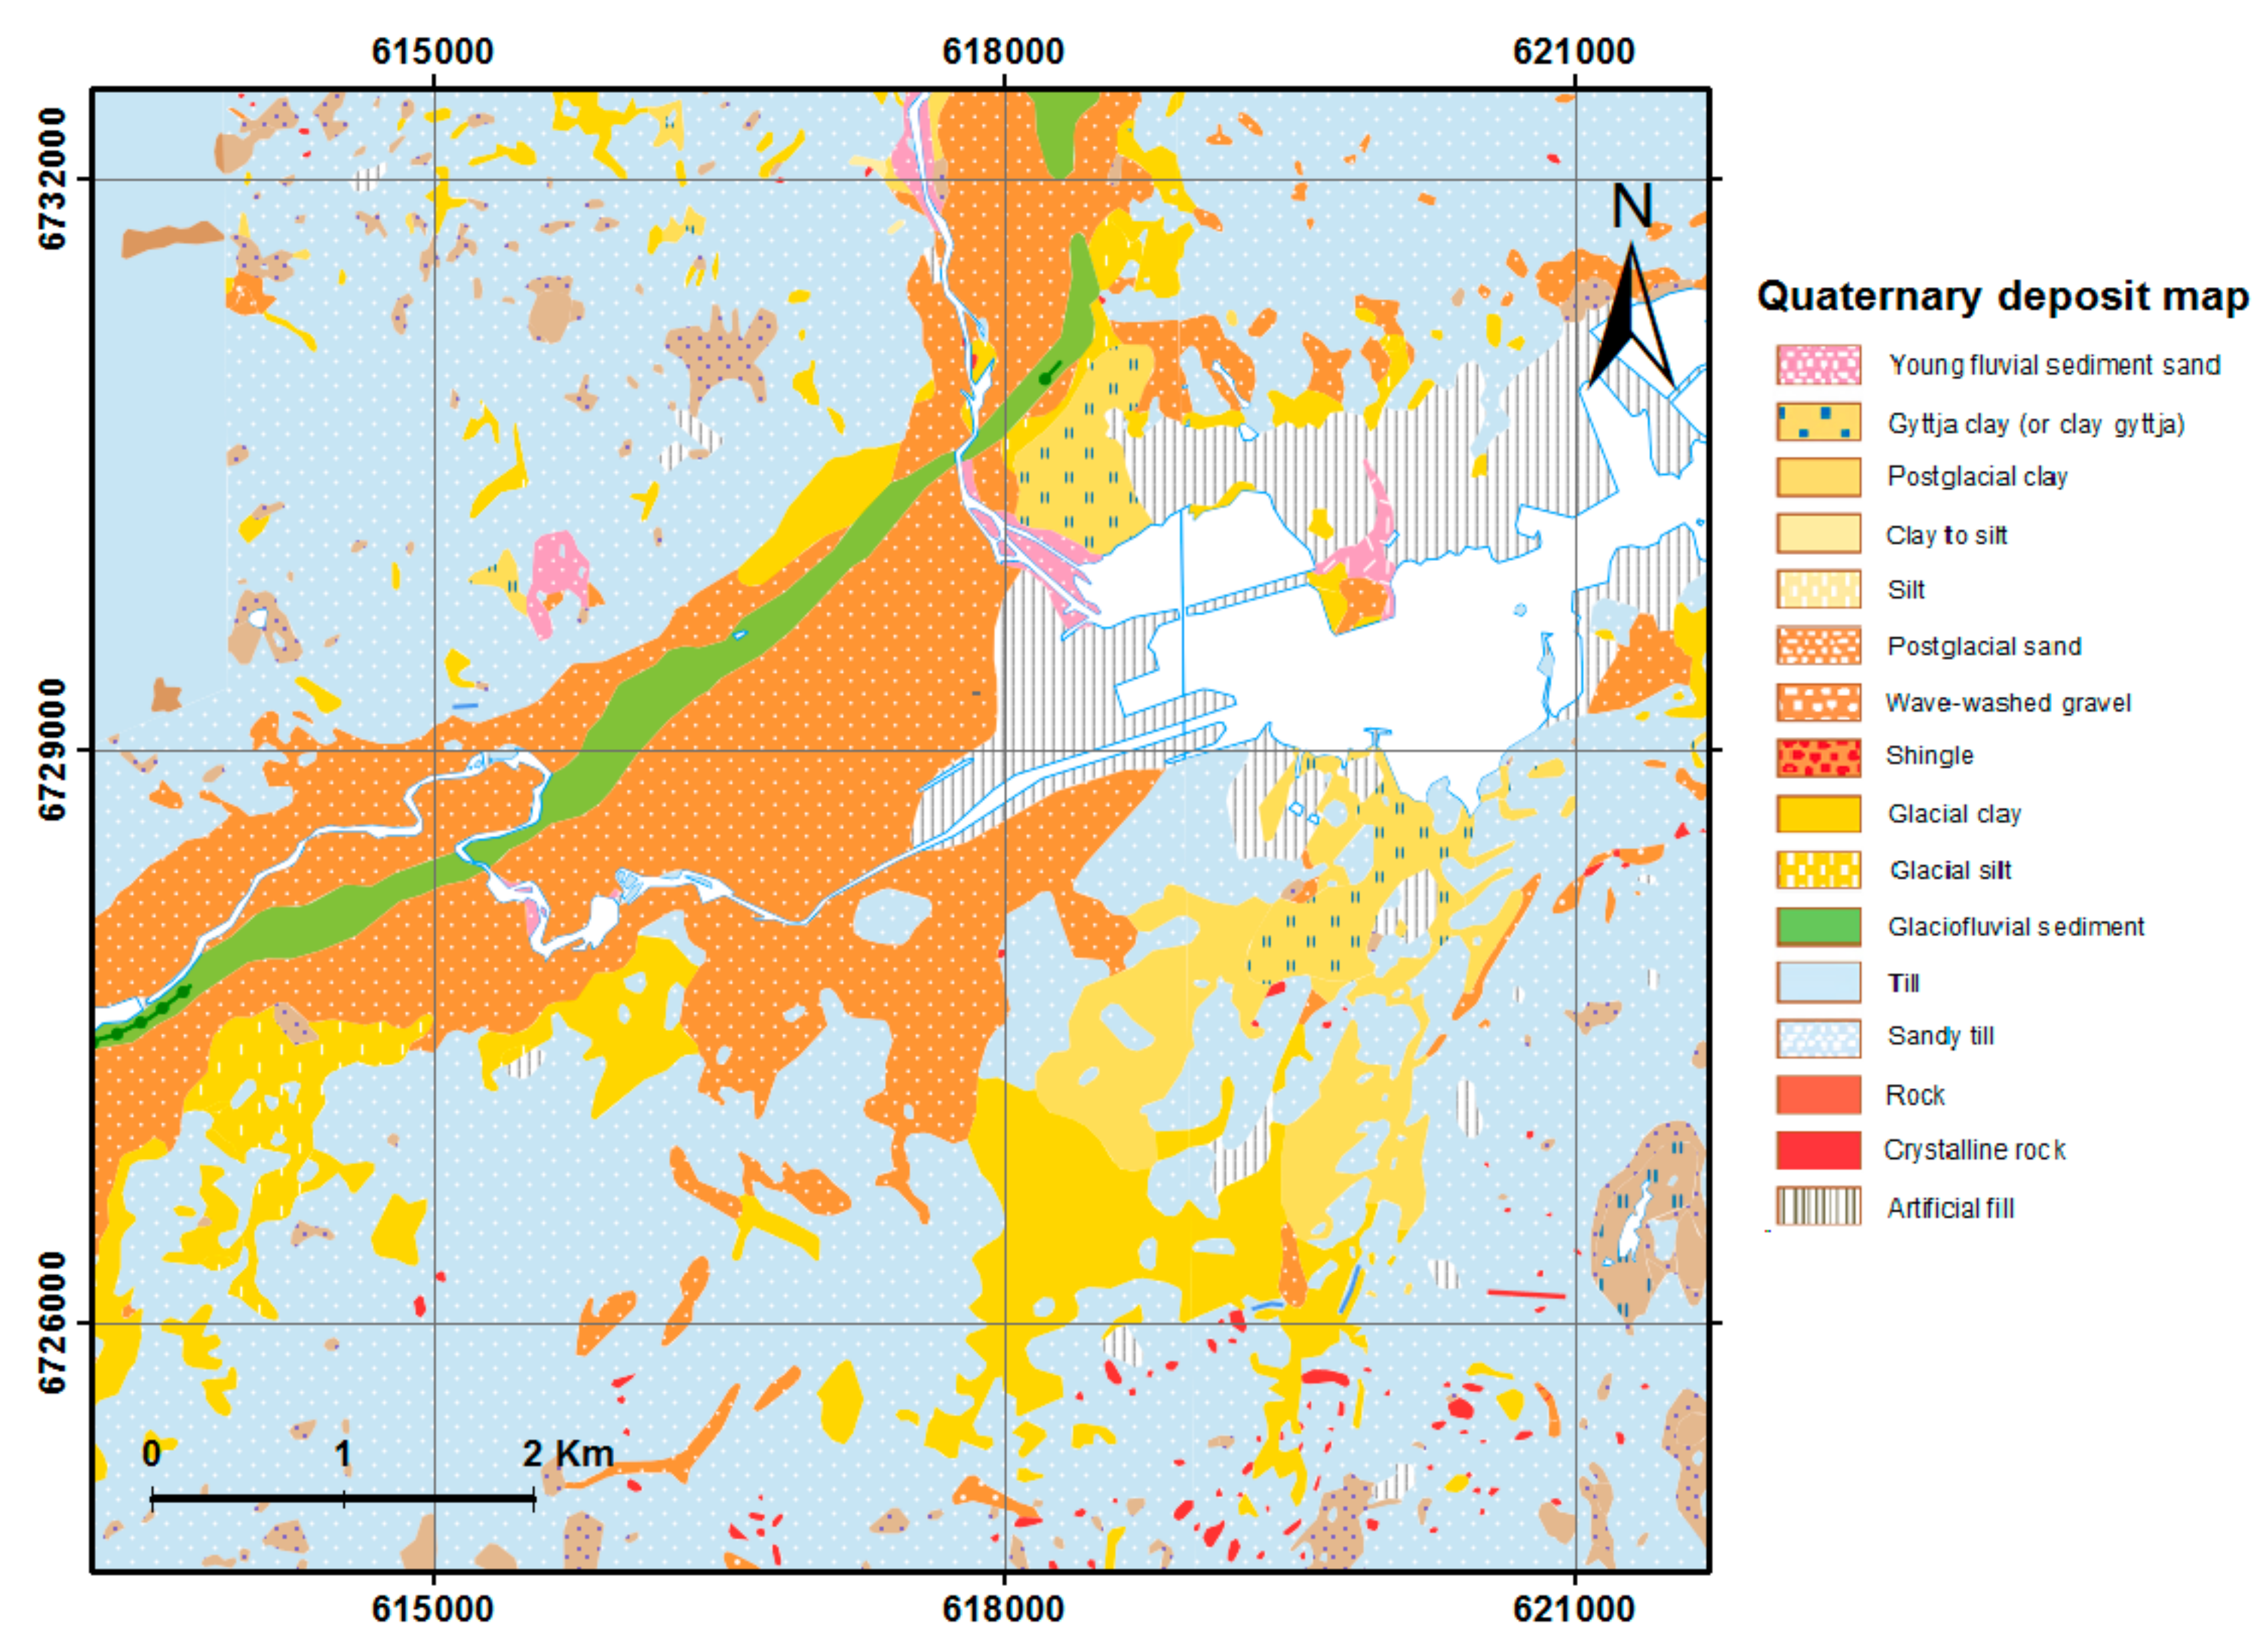
3.4. Geological Data and Analysis
4. Results and Discussions
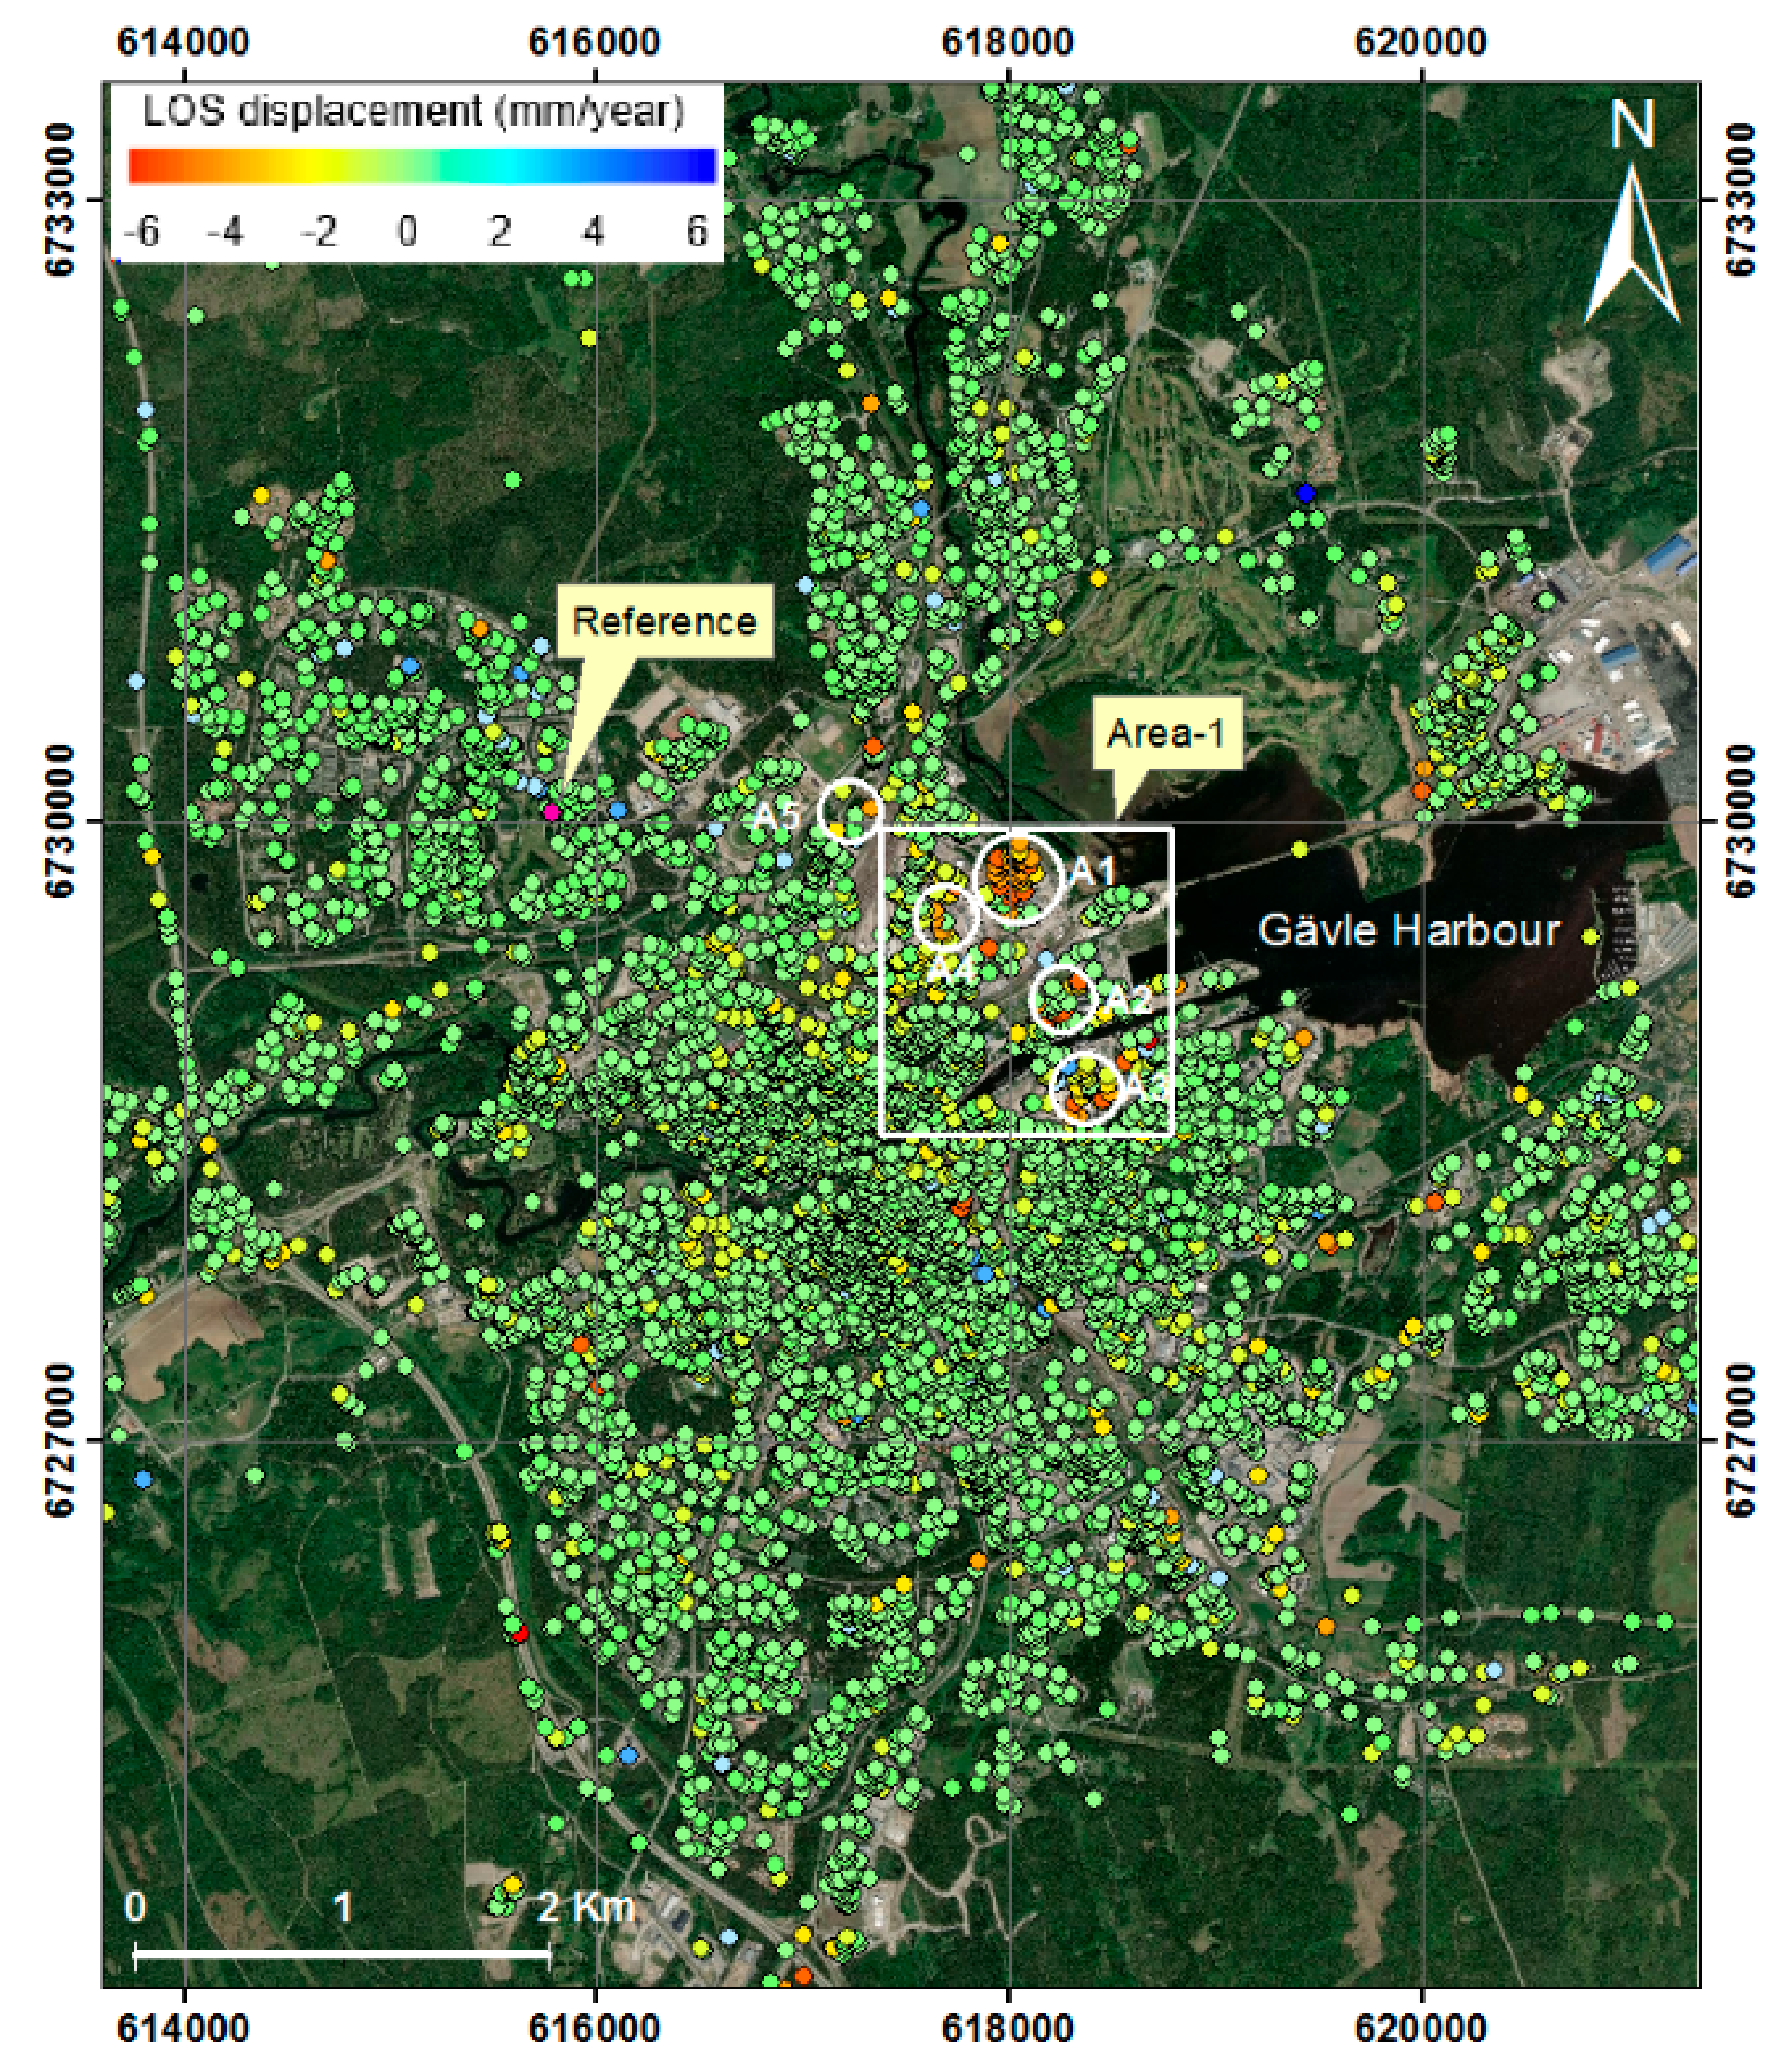
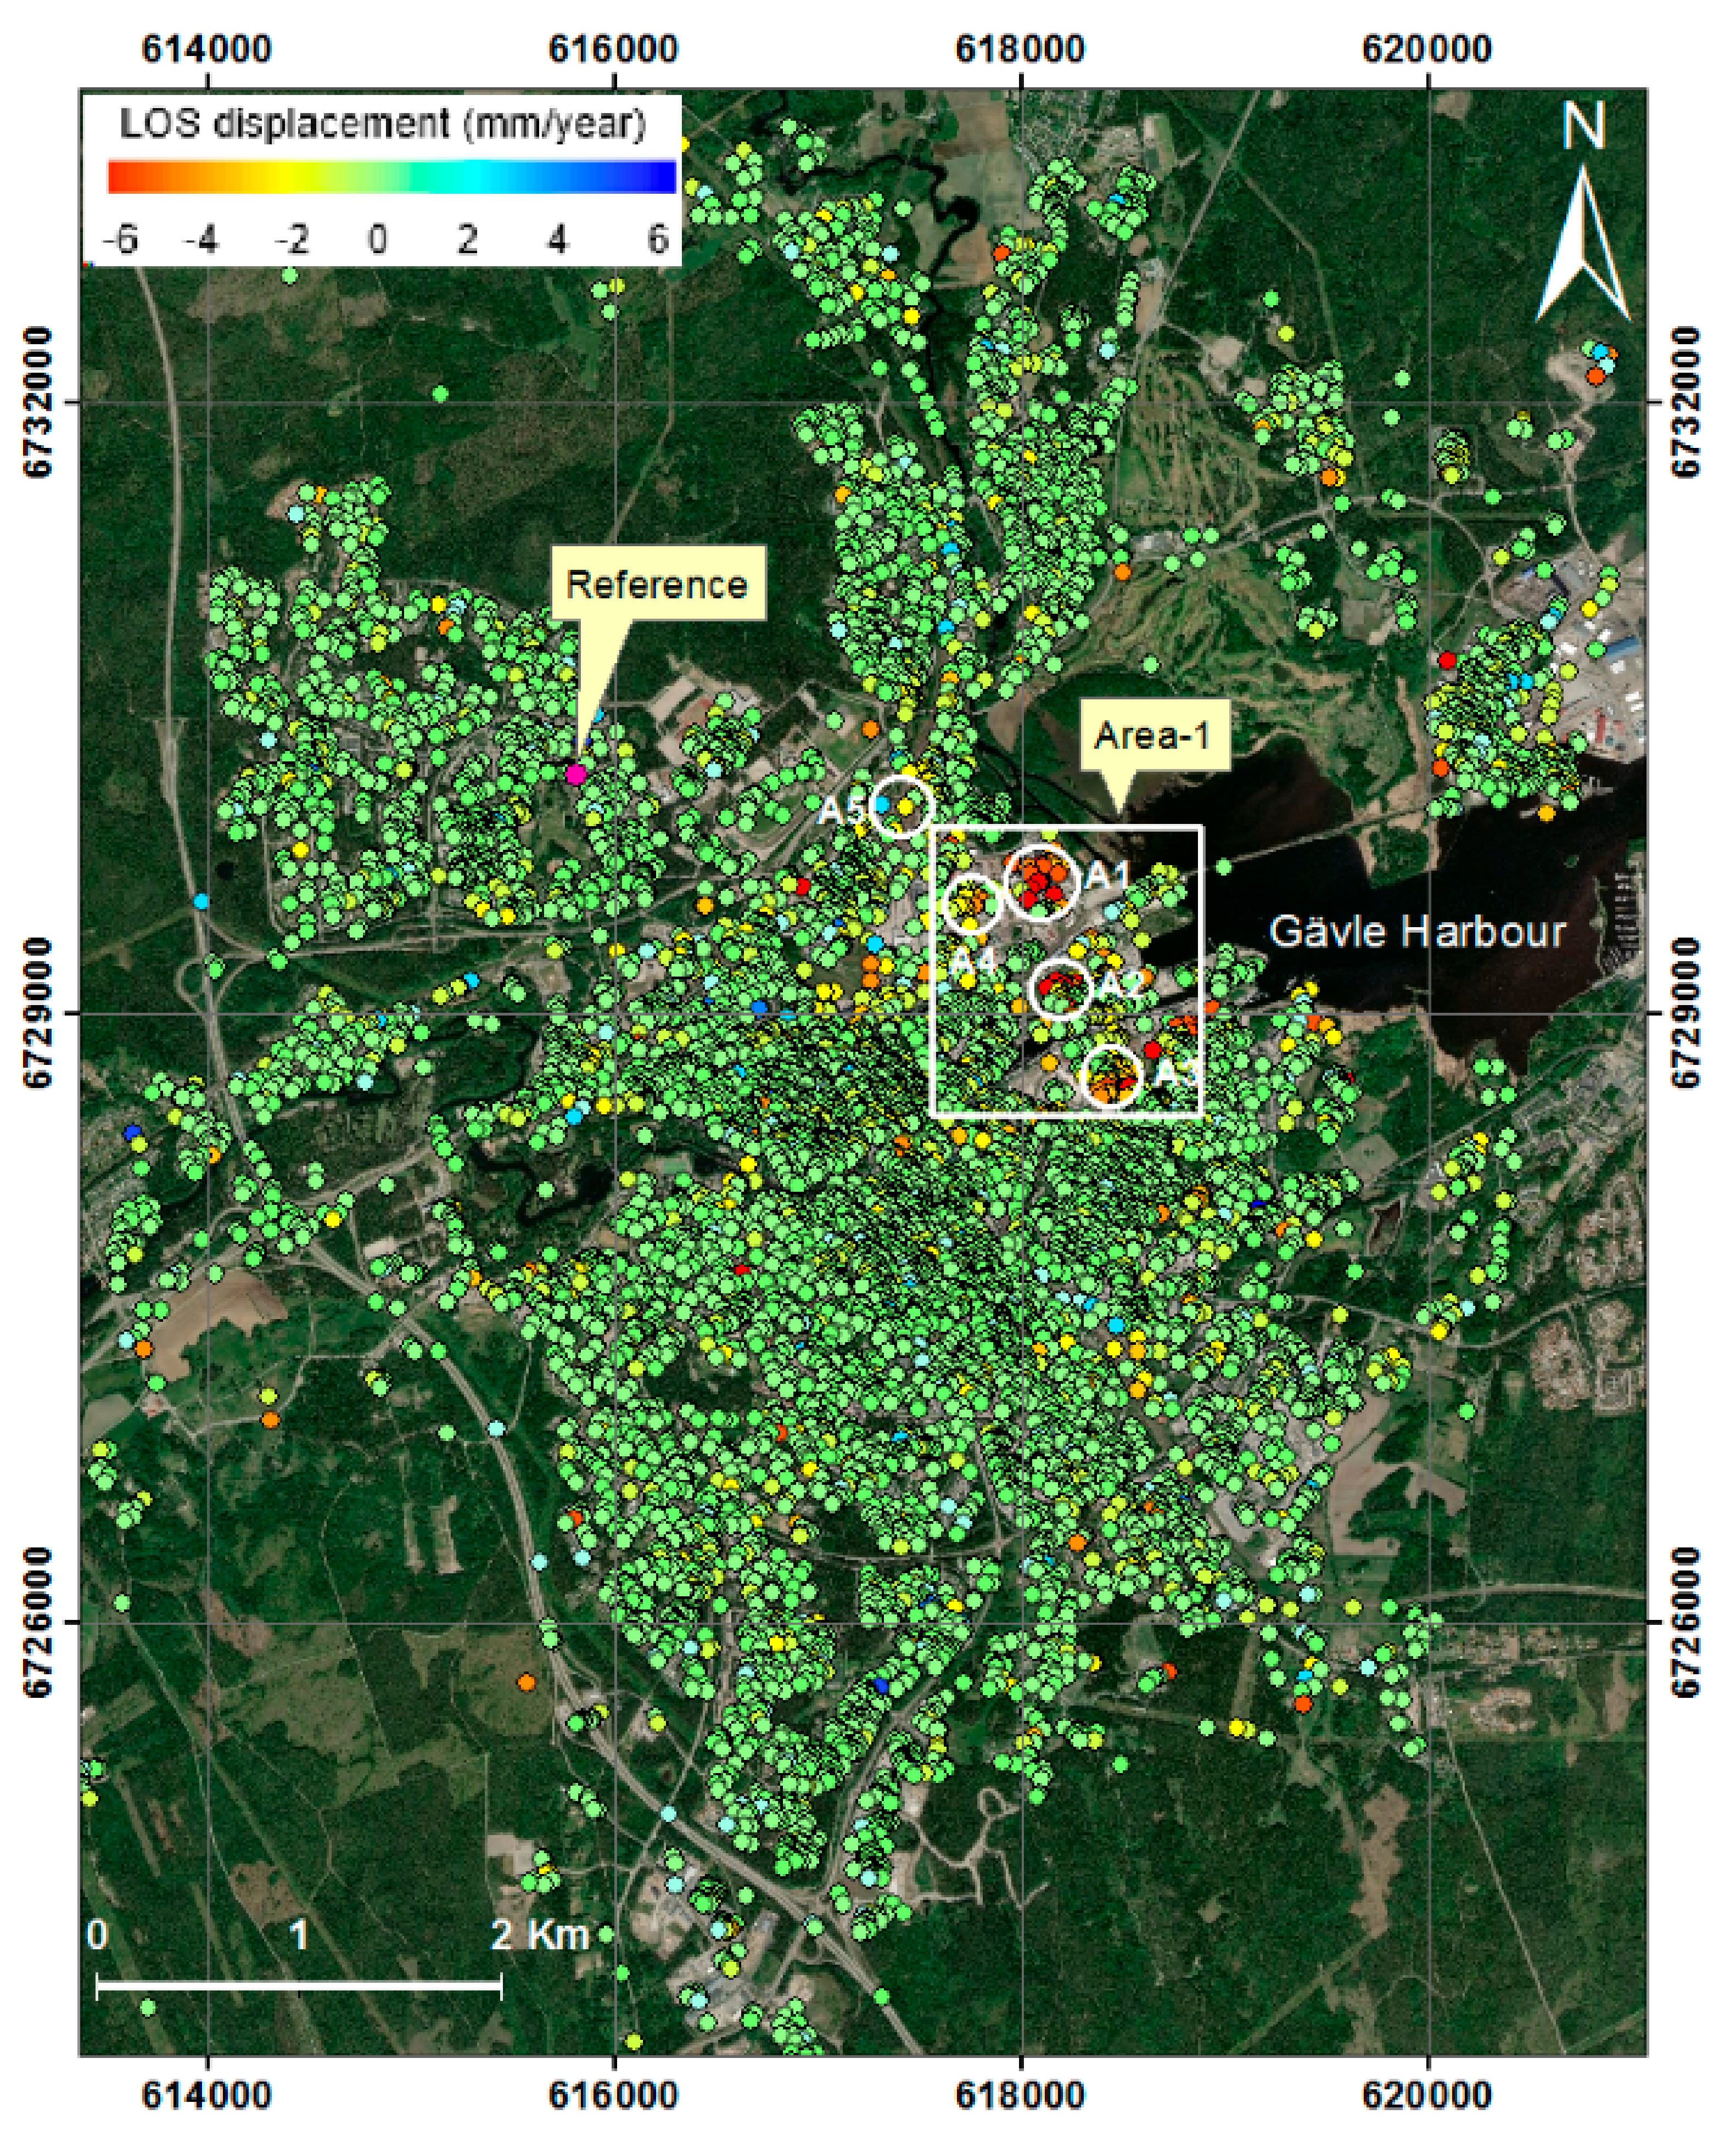
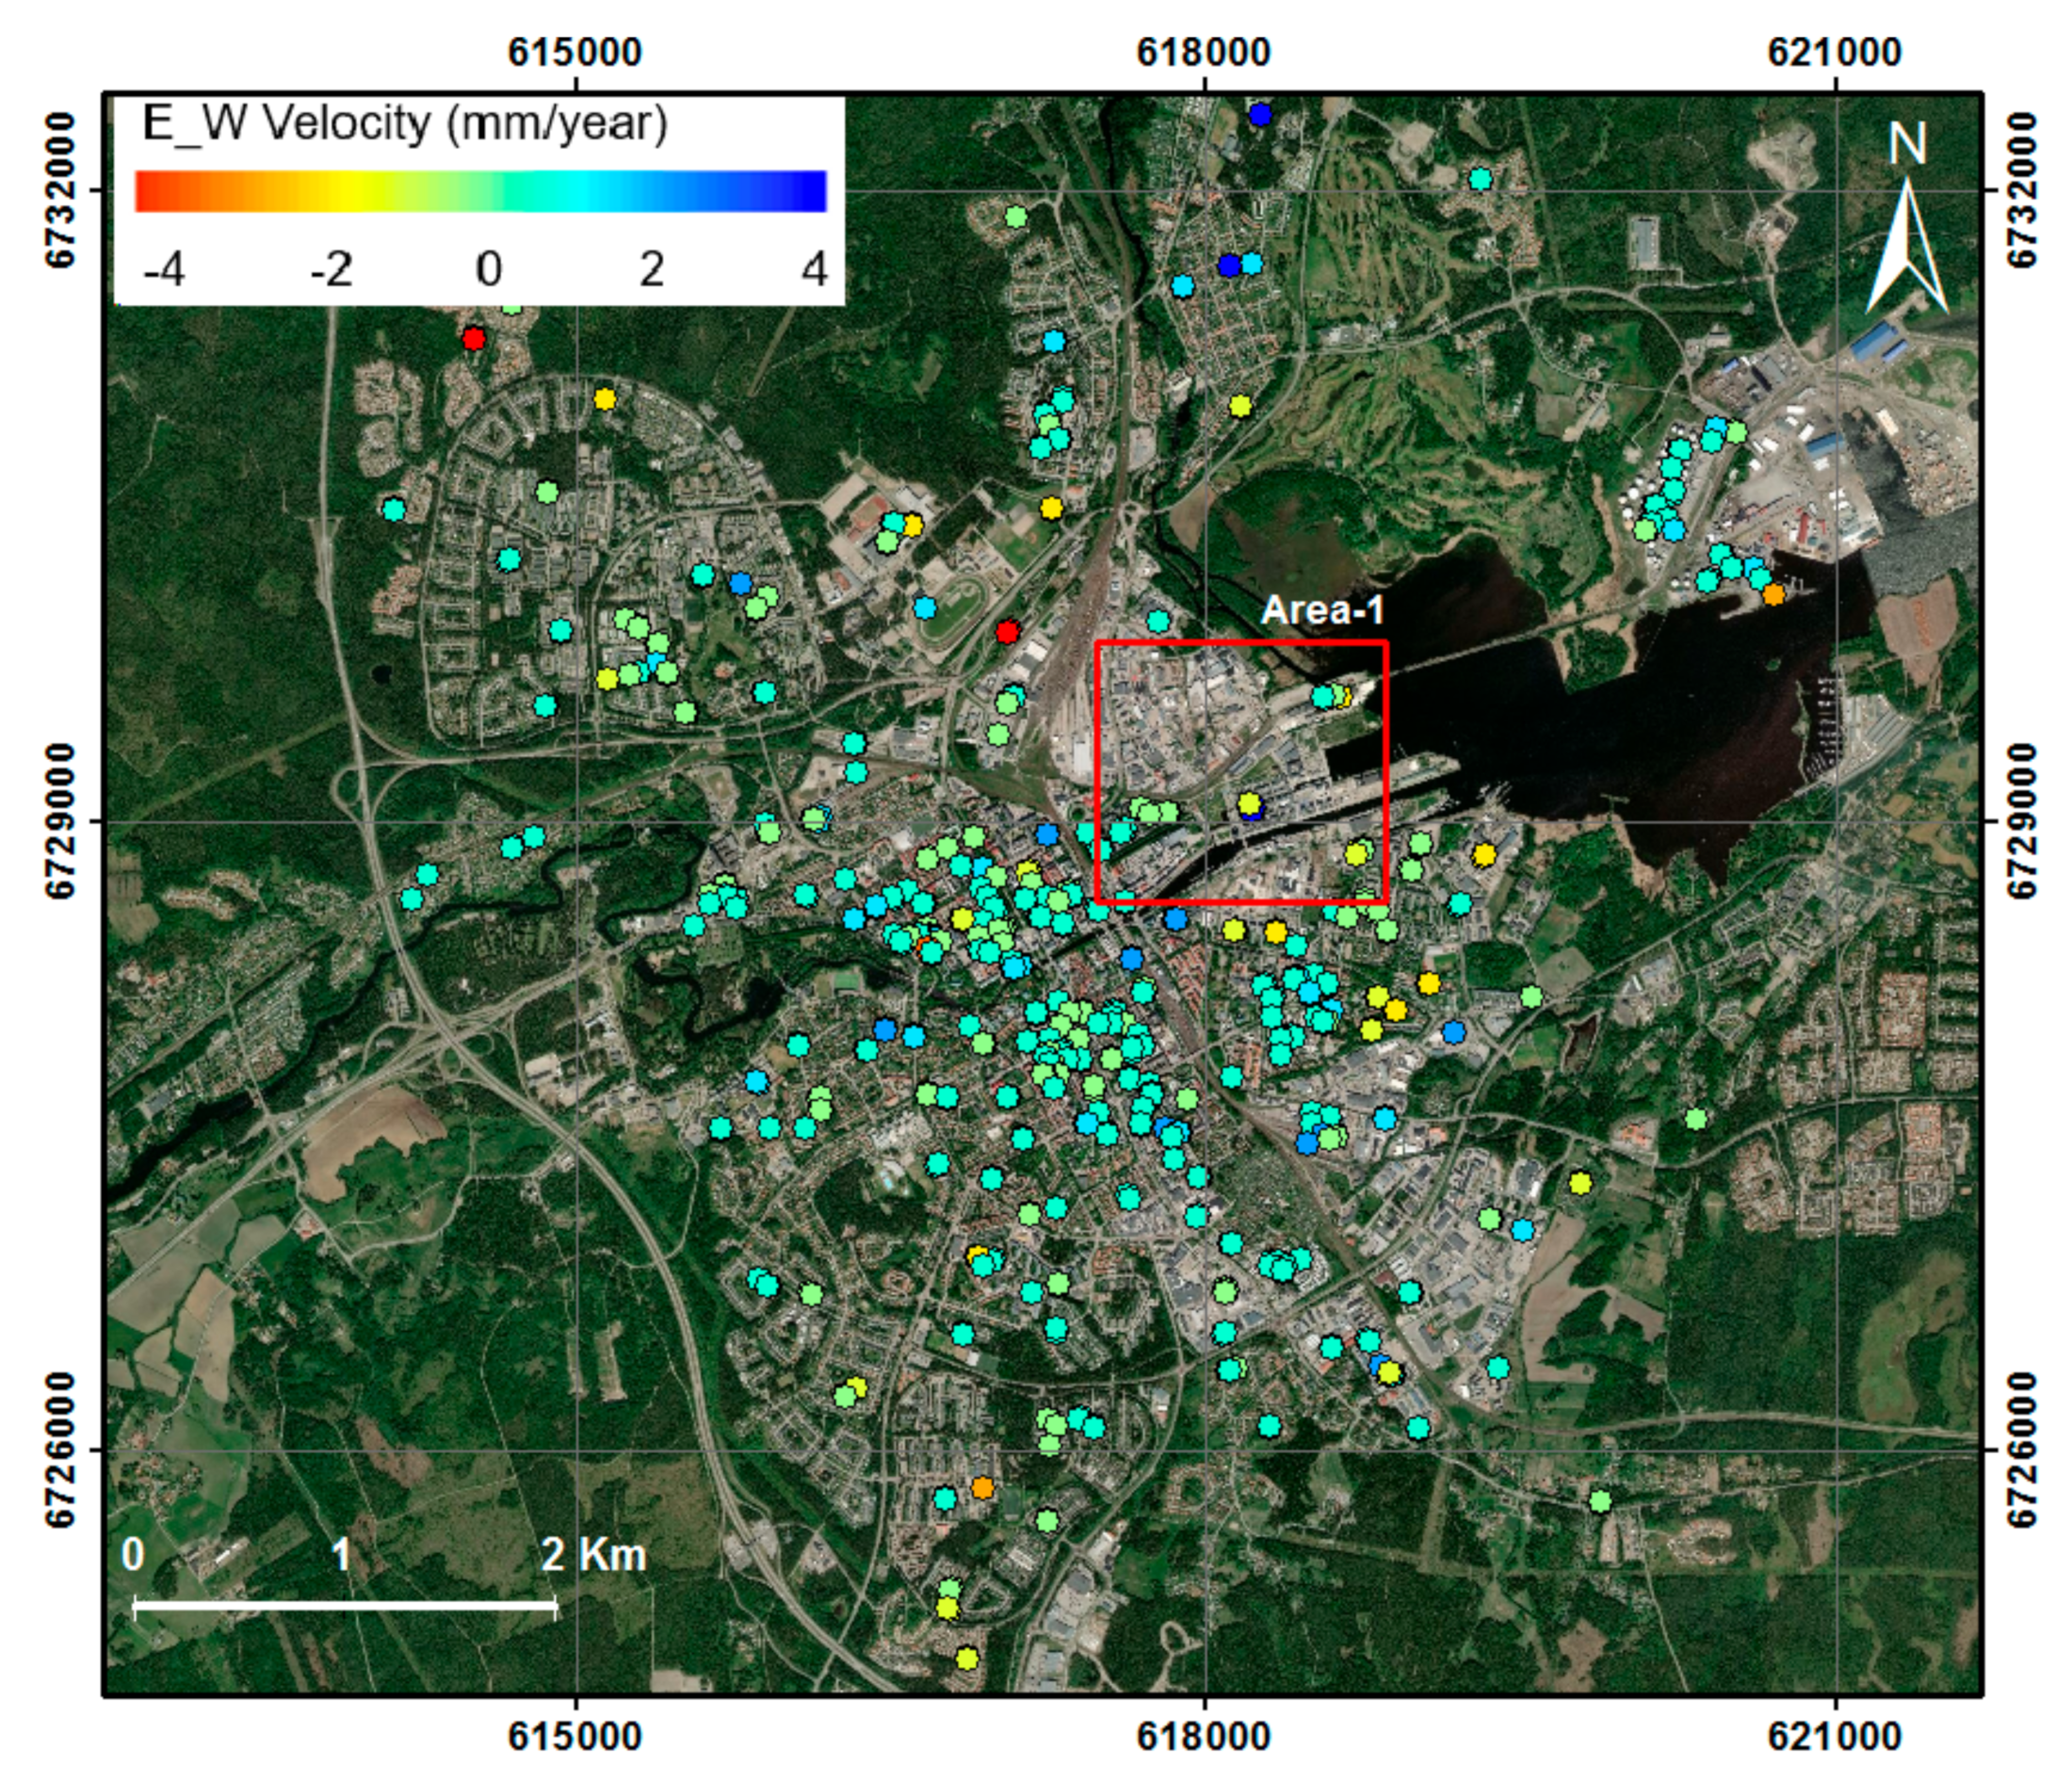
4.1. PSI Results
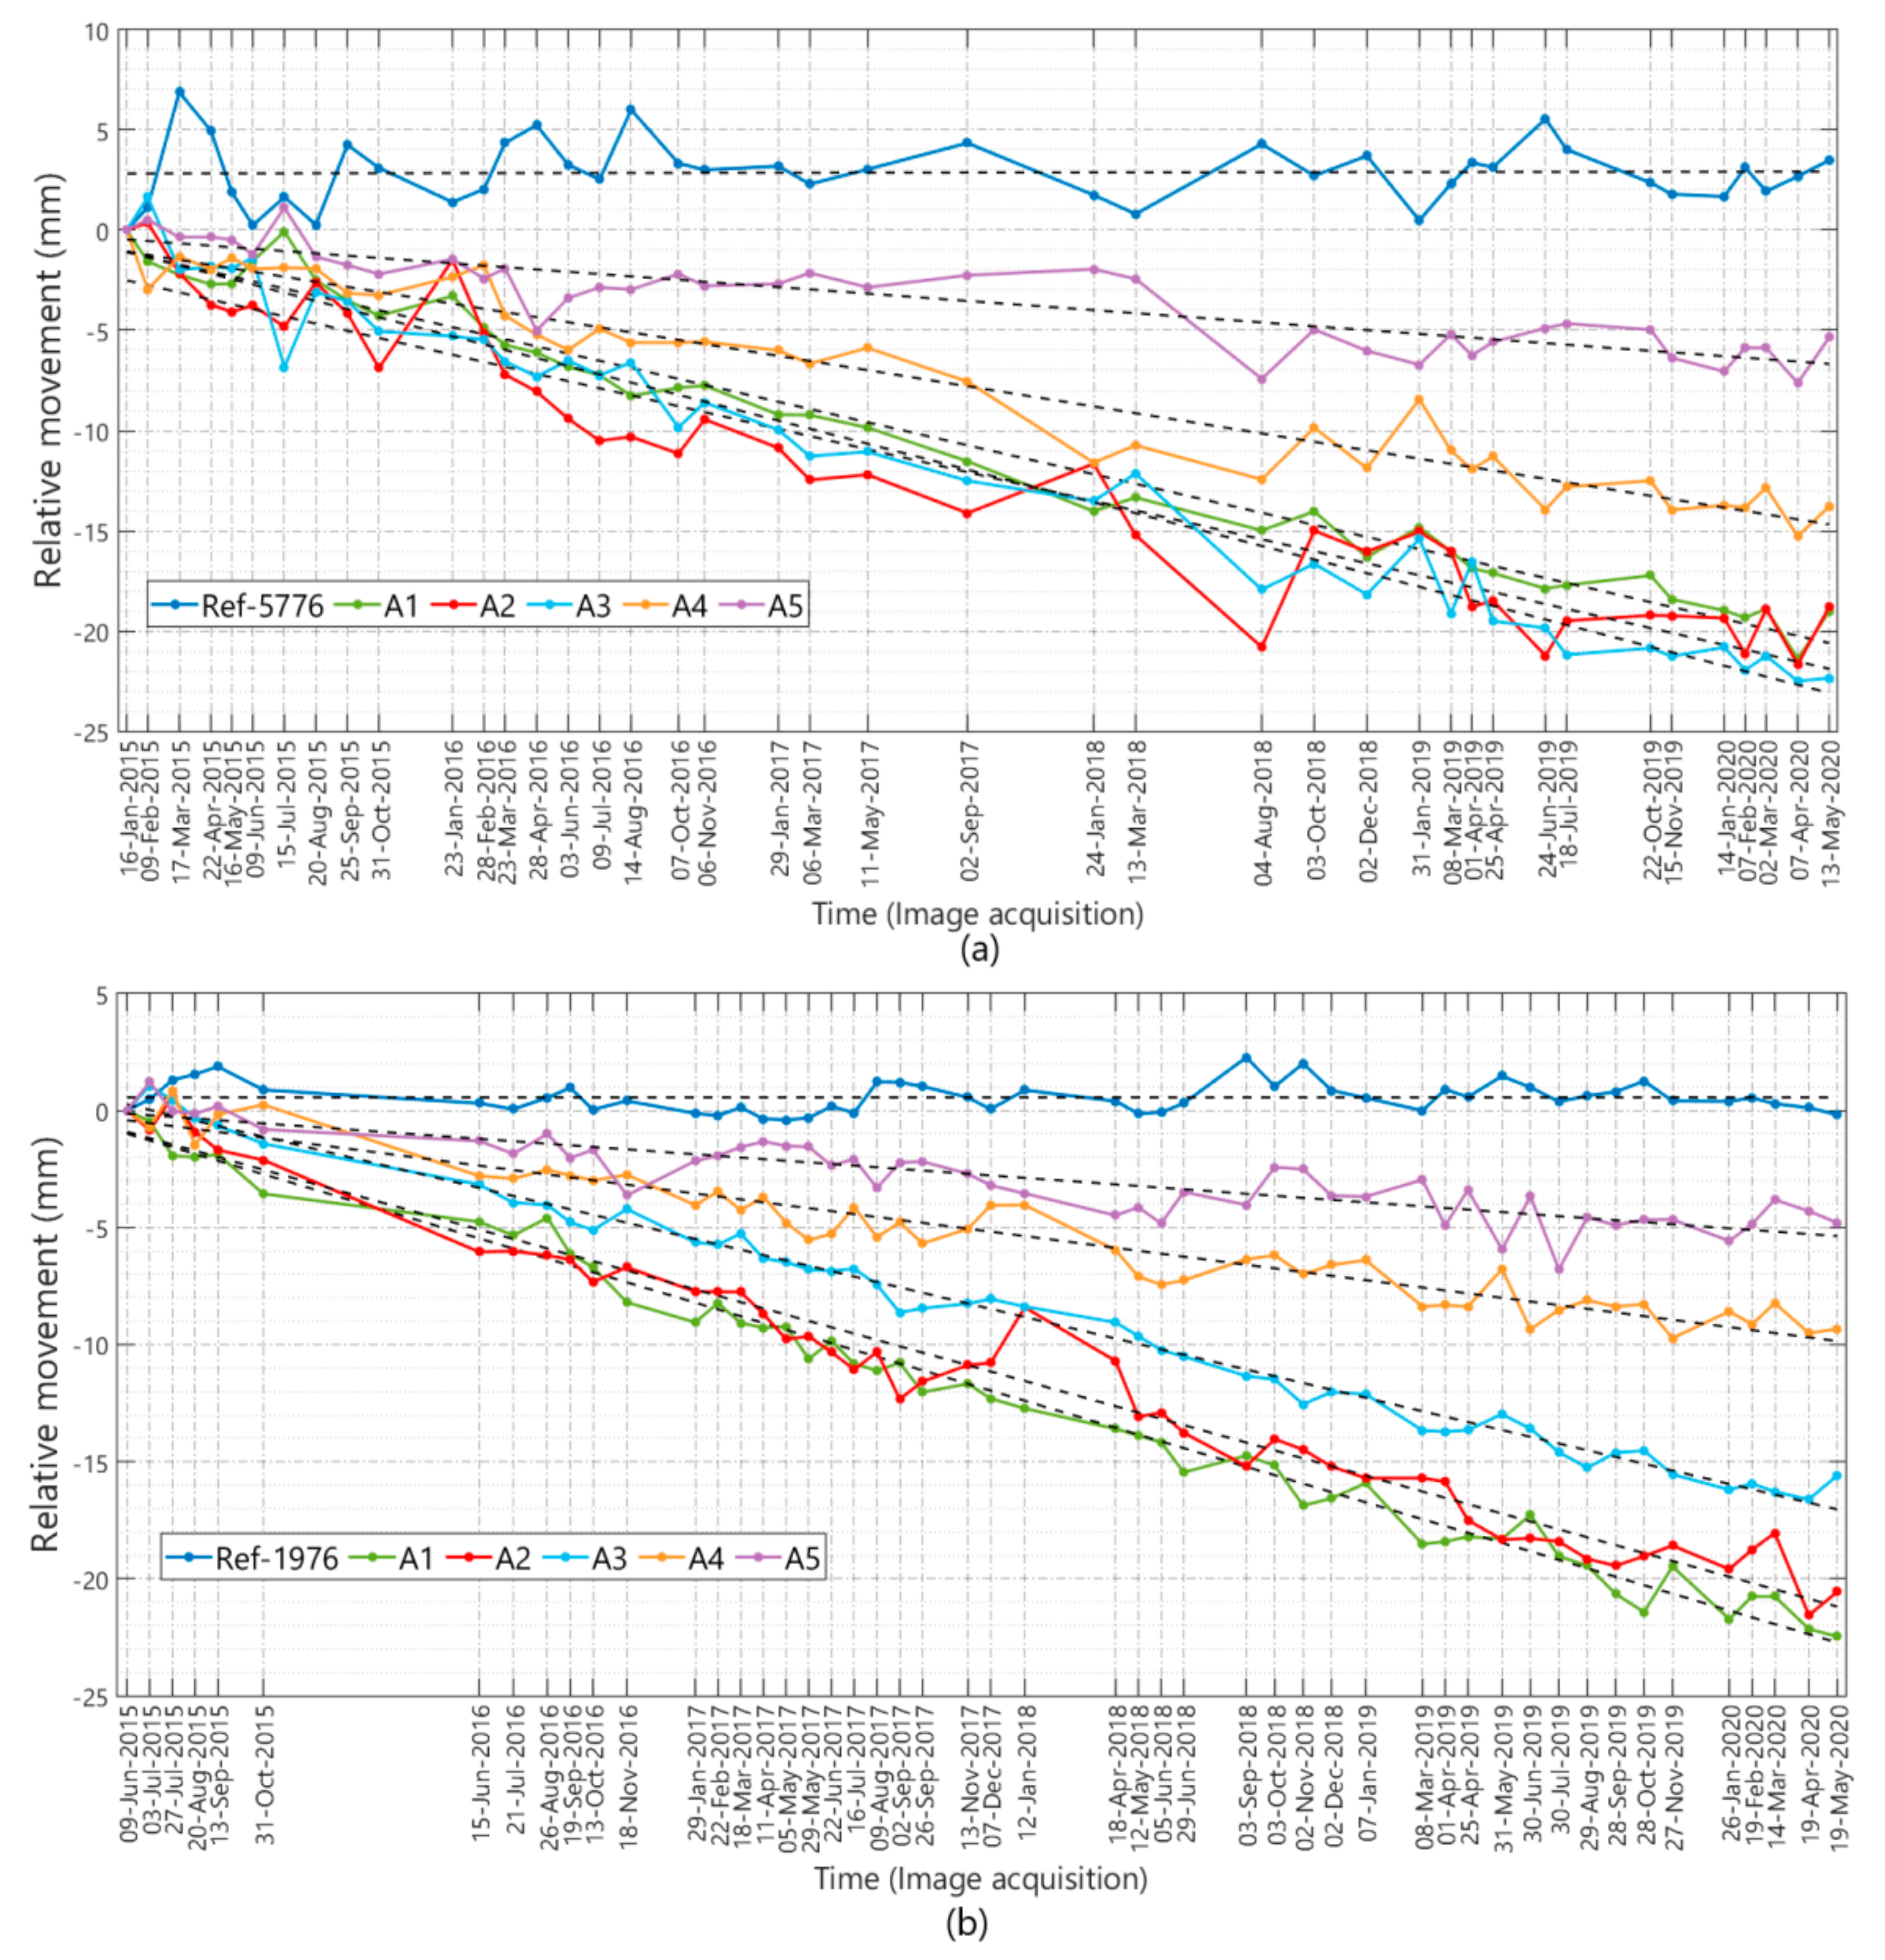
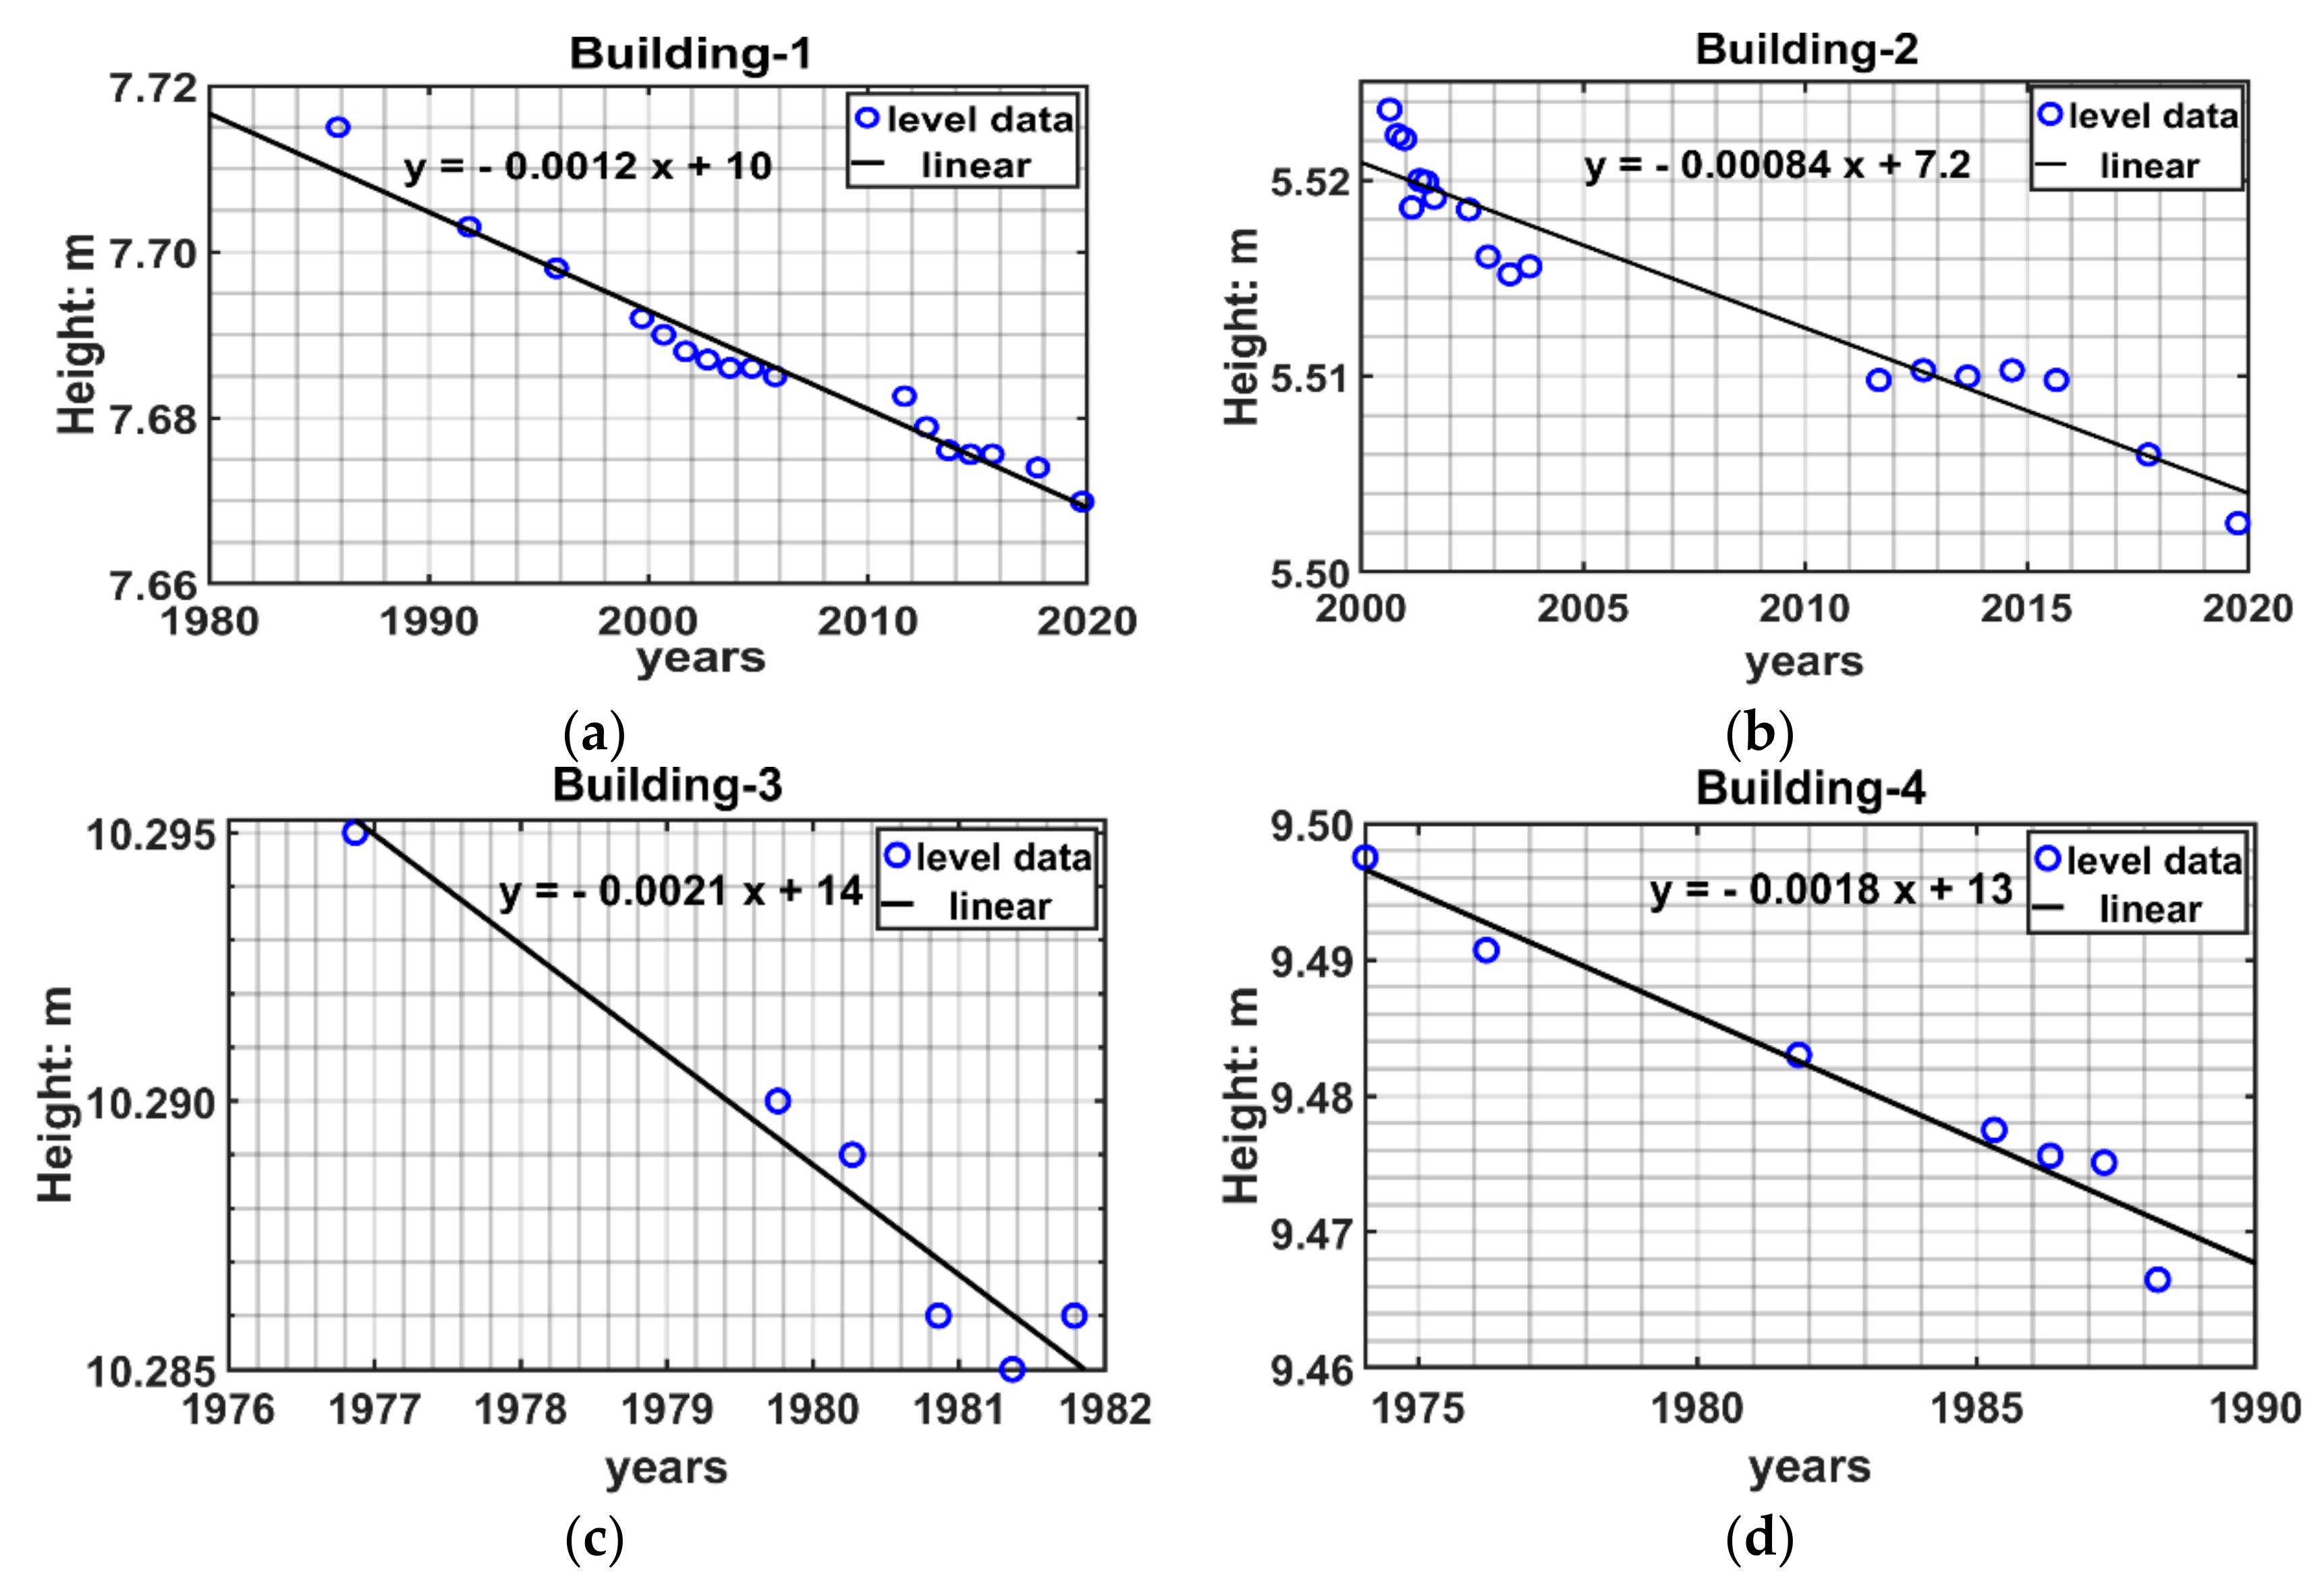
4.2. Leveling Data And the PSI Results
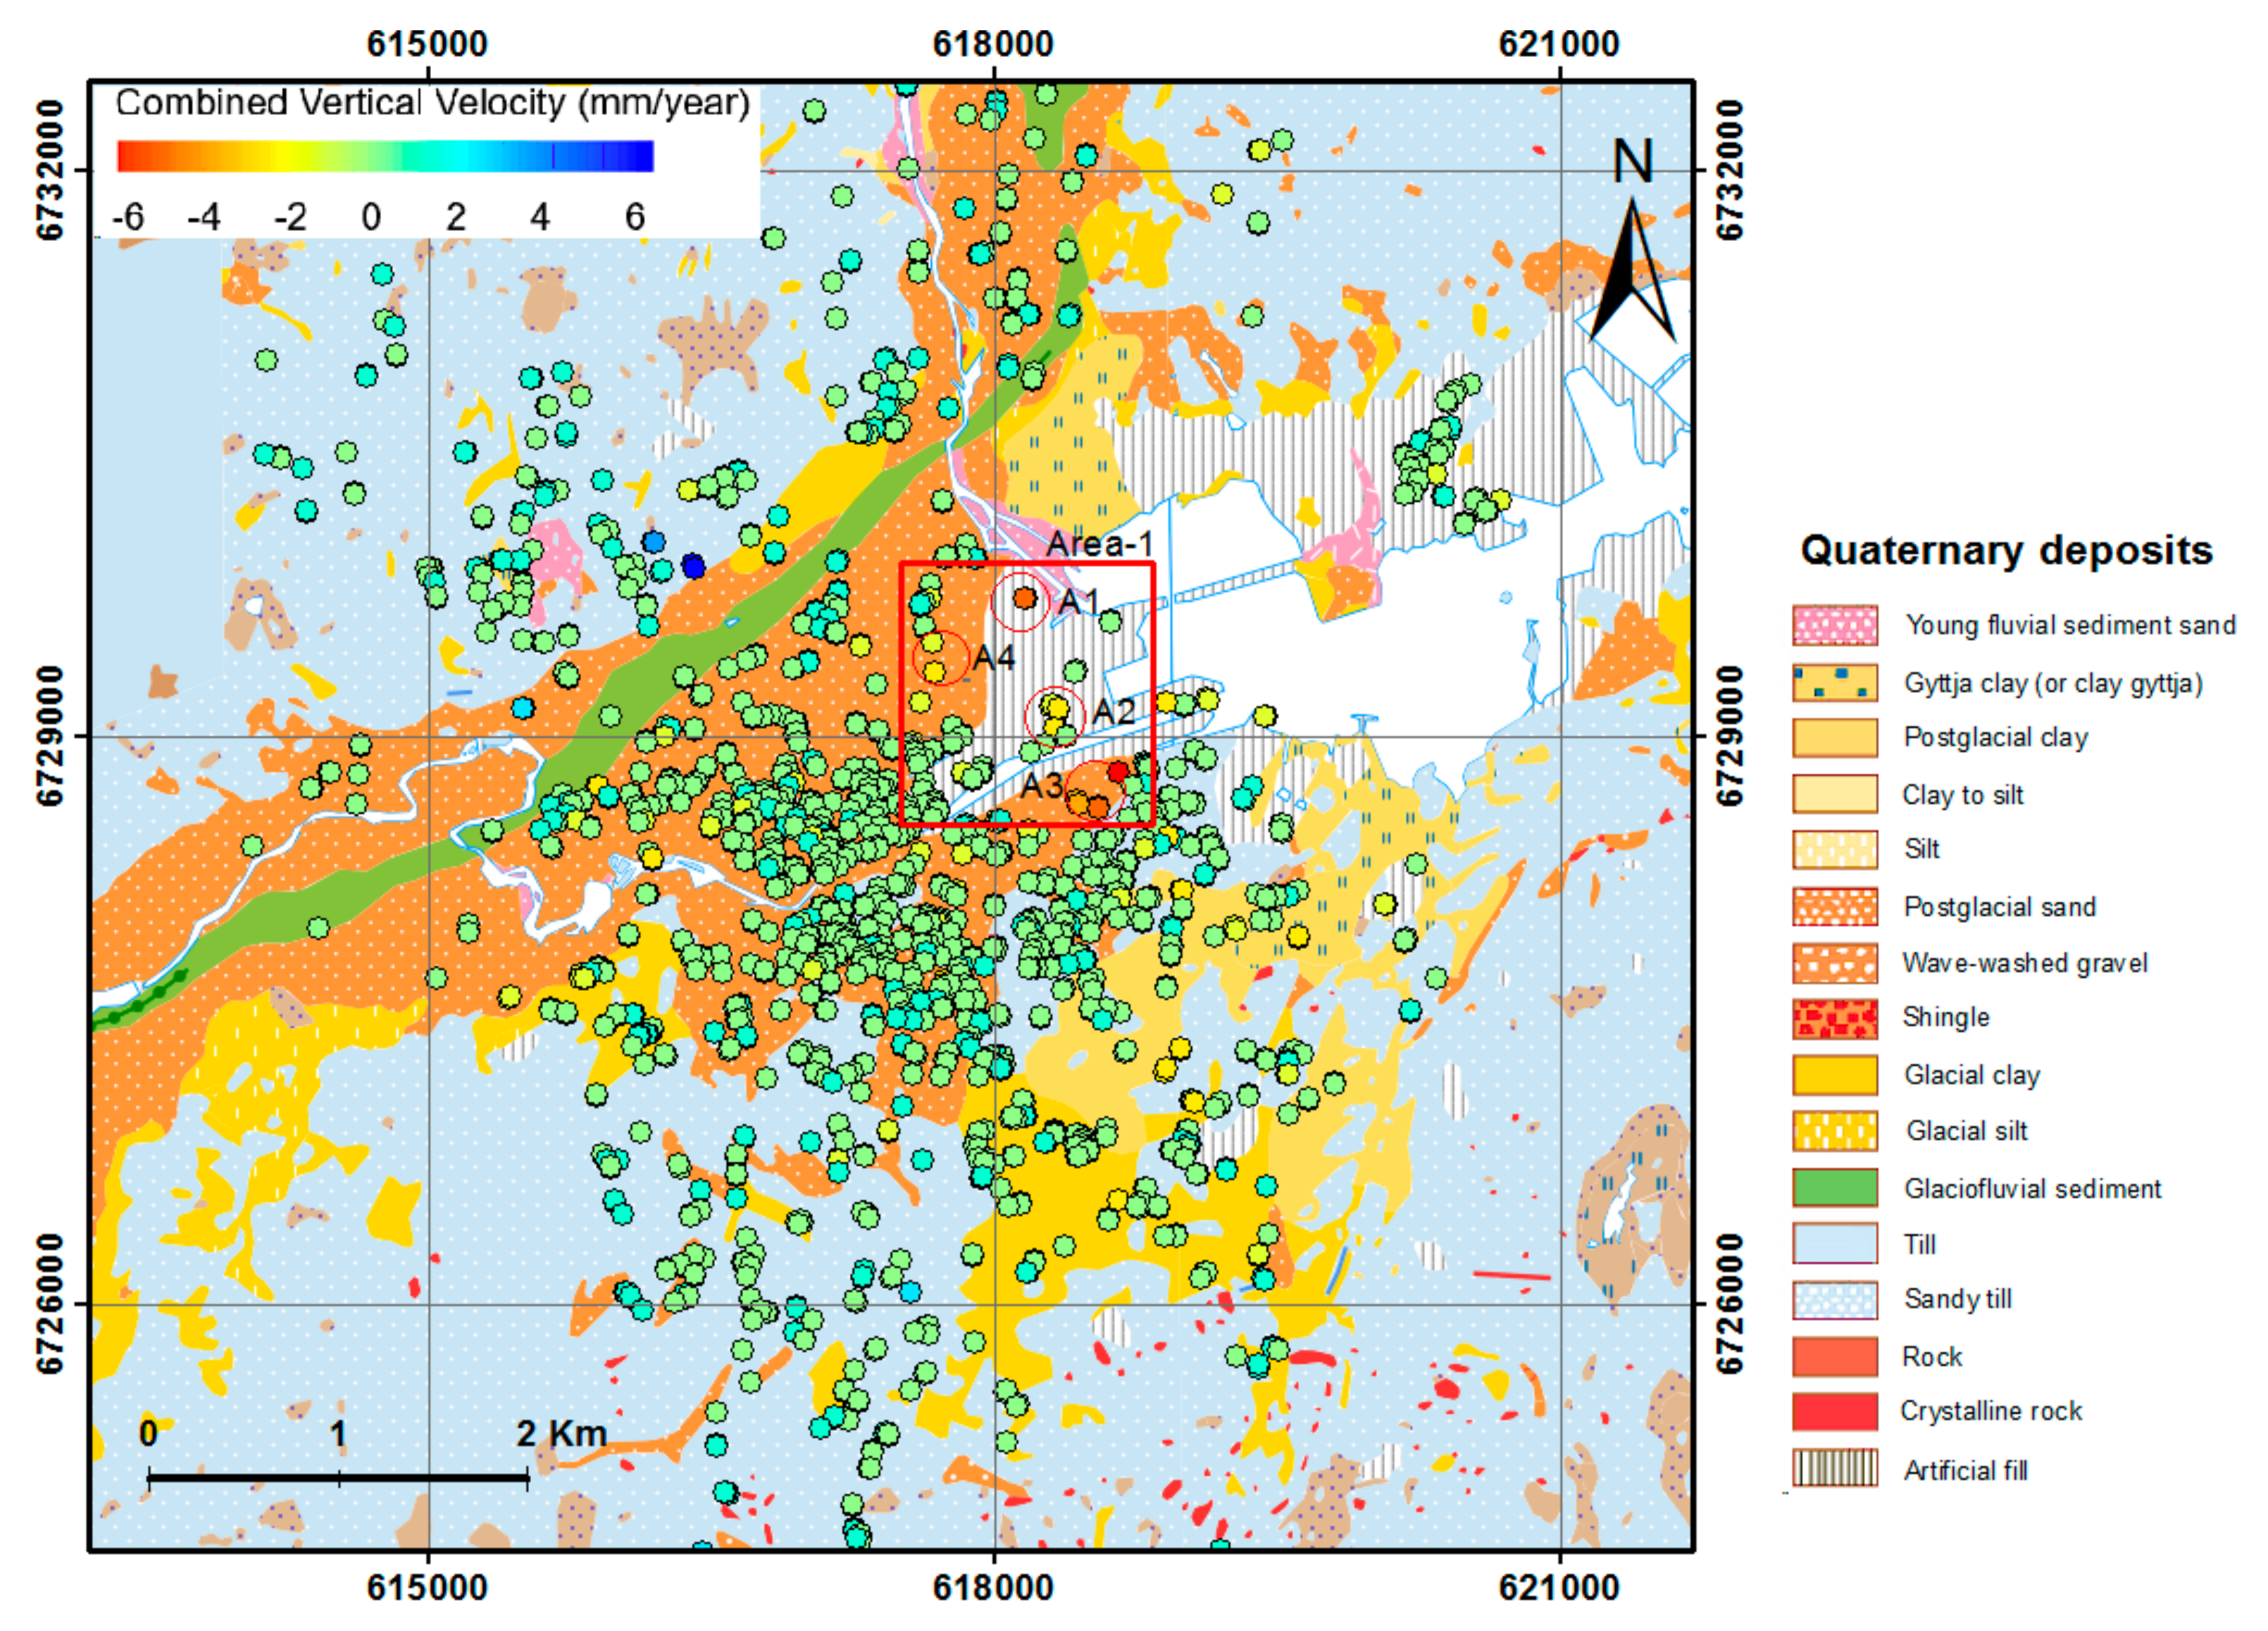
4.3. Subsidence and Subsurface Geology Effect
5. Conclusions
Author Contributions
Funding
Acknowledgments
Conflicts of Interest
References
- McGuire, W.J. National Research Council. 1991. International Global Network of Fiducial Stations. Scientific and Implementation Issues. ix + 129 pp. Washington, D.C.: National Academy Press. Price £16.50 (paperback). Marketed and distributed by John Wiley & Sons Ltd. I. Geol. Mag. 1993, 130, 860–861. [Google Scholar] [CrossRef]
- Gido, N.A.A.; Bagherbandi, M.; Sjöberg, L.E.; Tenzer, R. Studying permafrost by integrating satellite and in situ data in the northern high-latitude regions. Acta Geophys. 2019, 67, 721–734. [Google Scholar] [CrossRef]
- Haghighi, M.H.; Motagh, M. Ground surface response to continuous compaction of aquifer system in Tehran, Iran: Results from a long-term multi-sensor InSAR analysis. Remote Sens. Environ. 2019, 221, 534–550. [Google Scholar] [CrossRef]
- Stumpf, A.J. Hydrocompaction subsidence. In Encyclopedia of Earth Sciences Series; Springer: Dordrecht, The Netherlands, 2013. [Google Scholar]
- Hu, B.; Chen, J.; Zhang, X. Monitoring the land subsidence area in a coastal urban area with InSAR and GNSS. Sensors 2019, 19, 3181. [Google Scholar] [CrossRef]
- Bonì, R.; Bosino, A.; Meisina, C.; Novellino, A.; Bateson, L.; McCormack, H. A methodology to detect and characterize uplift phenomena in urban areas using Sentinel-1 data. Remote Sens. 2018, 10, 607. [Google Scholar] [CrossRef]
- Amelung, F.; Galloway, D.L.; Bell, J.W.; Zebker, H.A.; Laczniak, R.J. Sensing the ups and downs of Las Vegas: InSAR reveals structural control of land subsidence and aquifer-system deformation. Geology 1999, 27, 483–486. [Google Scholar] [CrossRef]
- Rosen, P.A.; Hensley, S.; Joughin, I.R.; Li, F.K.; Madsen, S.N.; Rodriguez, E.; Goldstein, R.M. Synthetic aperture radar interferometry-Invited paper RID A-2998-2008. Proc. IEEE 2000. [Google Scholar] [CrossRef]
- Gens, R.; Van Genderen, J.L. SAR interferometry—Issues, techniques, applications. Int. J. Remote Sens. 1996, 17, 1803–1835. [Google Scholar] [CrossRef]
- Bürgmann, R.; Rosen, P.A.; Fielding, E.J. Synthetic Aperture Radar Interferometry to Measure Earth’s Surface Topography and Its Deformation. Annu. Rev. Earth Planet. Sci. 2000, 28, 169–209. [Google Scholar] [CrossRef]
- Bamler, R.; Hartl, P. Synthetic aperture radar interferometry. Inverse Probl. 1998, 14, R1. [Google Scholar] [CrossRef]
- Bamler, R. Principles of synthetic aperture radar. Surv. Geophys. 2000, 21, 147–157. [Google Scholar] [CrossRef]
- Ferretti, A.; Prati, C.; Rocca, F. Nonlinear subsidence rate estimation using permanent scatterers in differential SAR interferometry. IEEE Trans. Geosci. Remote Sens. 2000, 38, 2202–2212. [Google Scholar] [CrossRef]
- Ferretti, A.; Prati, C.; Rocca, F. Permanent scatterers in SAR interferometry. IEEE Trans. Geosci. Remote Sens. 2001, 39, 8–20. [Google Scholar] [CrossRef]
- Osmanoğlu, B.; Sunar, F.; Wdowinski, S.; Cabral-Cano, E. Time series analysis of InSAR data: Methods and trends. ISPRS J. Photogramm. Remote Sens. 2016, 115, 90–102. [Google Scholar] [CrossRef]
- Tang, P.; Chen, F.; Guo, H.; Tian, B.; Wang, X.; Ishwaran, N. Large-area landslides monitoring using advanced multi-temporal InSAR technique over the giant panda habitat, Sichuan, China. Remote Sens. 2015, 7, 8925. [Google Scholar] [CrossRef]
- Lanari, R.; Casu, F.; Manzo, M.; Lundgren, P. Application of the SBAS-DInSAR technique to fault creep: A case study of the Hayward fault, California. Remote Sens. Environ. 2007, 109, 20–28. [Google Scholar] [CrossRef]
- Ferretti, A.; Savio, G.; Barzaghi, R.; Borghi, A.; Musazzi, S.; Novali, F.; Prati, C.; Rocca, F. Submillimeter accuracy of InSAR time series: Experimental validation. IEEE Trans. Geosci. Remote Sens. 2007, 45, 1142–1153. [Google Scholar] [CrossRef]
- Crosetto, M.; Monserrat, O.; Cuevas-González, M.; Devanthéry, N.; Crippa, B. Persistent Scatterer Interferometry: A review. ISPRS J. Photogramm. Remote Sens. 2016, 115, 78–89. [Google Scholar] [CrossRef]
- Crosetto, M.; Devanthéry, N.; Monserrat, O.; Barra, A.; Cuevas-González, M.; Mróz, M.; Botey-Bassols, J.; Vázquez-Suñé, E.; Crippa, B. A persistent scatterer interferometry procedure based on stable areas to filter the atmospheric component. Remote Sens. 2018, 10, 1780. [Google Scholar] [CrossRef]
- Hooper, A.; Segall, P.; Zebker, H. Persistent scatterer interferometric synthetic aperture radar for crustal deformation analysis, with application to Volcán Alcedo, Galápagos. J. Geophys. Res. Solid Earth 2007, 112, B7. [Google Scholar] [CrossRef]
- Gernhardt, S.; Adam, N.; Eineder, M.; Bamler, R. Potential of very high resolution SAR for persistent scatterer interferometry in urban areas. Ann. GIS 2010, 16, 103–111. [Google Scholar] [CrossRef]
- Hooper, A.; Zebker, H.; Segall, P.; Kampes, B. A new method for measuring deformation on volcanoes and other natural terrains using InSAR persistent scatterers. Geophys. Res. Lett. 2004, 31, 23. [Google Scholar] [CrossRef]
- Dai, K.; Peng, J.; Zhang, Q.; Wang, Z.; Qu, T.; He, C.; Li, D.; Liu, J.; Li, Z.; Xu, Q.; et al. Entering the Era of Earth Observation-Based Landslide Warning Systems: A Novel and Exciting Framework. IEEE Geosci. Remote Sens. Mag. 2020, 8, 136–153. [Google Scholar] [CrossRef]
- Notti, D.; Davalillo, J.C.; Herrera, G.; Mora, O. Assessment of the performance of X-band satellite radar data for landslide mapping and monitoring: Upper Tena Valley case study. Nat. Hazards Earth Syst. Sci. 2010, 10, 1865. [Google Scholar] [CrossRef]
- Cascini, L.; Fornaro, G.; Peduto, D. Advanced low- and full-resolution DInSAR map generation for slow-moving landslide analysis at different scales. Eng. Geol. 2010, 112, 29–42. [Google Scholar] [CrossRef]
- Ge, L.; Ng, A.H.M.; Li, X.; Abidin, H.Z.; Gumilar, I. Land subsidence characteristics of Bandung Basin as revealed by ENVISAT ASAR and ALOS PALSAR interferometry. Remote Sens. Environ. 2014, 154, 46–60. [Google Scholar] [CrossRef]
- Fryksten, J.; Nilfouroushan, F. Analysis of clay-induced land subsidence in Uppsala City using Sentinel-1 SAR data and precise leveling. Remote Sens. 2019, 11, 2764. [Google Scholar] [CrossRef]
- Ng, A.H.M.; Ge, L.; Zhang, K.; Li, X. Application of persistent scatterer interferometry for land subsidence monitoring in Sydney, Australia using ENVISAT ASAR data. In Proceedings of the 34th International Symposium on Remote Sensing of Environment—The GEOSS Era: Towards Operational Environmental Monitoring, Sydney, Australia, 10–15 April 2011. [Google Scholar]
- Ferretti, A.; Novali, F.; Burgmann, R.; Hilley, G.; Prati, C. Insar permanent scatterer analysis reveals ups and downs in san francisco bay area. Eos 2004, 85, 317–324. [Google Scholar] [CrossRef]
- Zhou, C.; Gong, H.; Chen, B.; Li, J.; Gao, M.; Zhu, F.; Chen, W.; Liang, Y. InSAR time-series analysis of land subsidence under different land use types in the eastern Beijing plain, China. Remote Sens. 2017, 9, 380. [Google Scholar] [CrossRef]
- Goorabi, A.; Maghsoudi, Y.; Perissin, D. Monitoring of the ground displacement in the Isfahan, Iran, metropolitan area using persistent scatterer interferometric synthetic aperture radar technique. J. Appl. Remote Sens. 2020, 14, 024510. [Google Scholar] [CrossRef]
- Dai, K.; Liu, G.; Li, Z.; Li, T.; Yu, B.; Wang, X.; Singleton, A. Extracting vertical displacement rates in Shanghai (China) with multi-platform SAR images. Remote Sens. 2015, 7, 9542–9562. [Google Scholar] [CrossRef]
- Gernhardt, S.; Bamler, R. Deformation monitoring of single buildings using meter-resolution SAR data in PSI. ISPRS J. Photogramm. Remote Sens. 2012, 73, 68–79. [Google Scholar] [CrossRef]
- Sousa, J.J.; Ruiz, A.M.; Hanssen, R.F.; Perski, Z.; Bastos, L.; Antonio, J.; Galindo-Zaldívar, J. PS-INSAR measurement of ground subsidence in Granada area (Betic Cordillera, Spain). In Proceedings of the 13th FIG International Symposium Deformation Measurement and Analysis, Lisbon, Portugal, 12–15 May 2008. [Google Scholar]
- Lan, H.; Li, L.; Liu, H.; Yang, Z. Complex urban infrastructure deformation monitoring using high resolution PSI. IEEE J. Sel. Top. Appl. Earth Obs. Remote Sens. 2012, 5, 643–651. [Google Scholar] [CrossRef]
- Dehghani, M.; Hooper, A.; Hanssen, R.; Valadan Zoej, M.J.; Saatchi, S.; Entezam, I. Hybrid Conventional and Persistent Scatterer SAR Interferometry for Land Subsidence Monitoring in Tehran Basin, Iran. ISPRS J. Photogramm. Remote Sens. 2006, 79, 157–170. [Google Scholar] [CrossRef]
- Béjar-Pizarro, M.; Guardiola-Albert, C.; García-Cárdenas, R.P.; Herrera, G.; Barra, A.; Molina, A.L.; Tessitore, S.; Staller, A.; Ortega-Becerril, J.A.; García-García, R.P. Interpolation of GPS and geological data using InSAR deformation maps: Method and application to land subsidence in the alto guadalentín aquifer (SE Spain). Remote Sens. 2016, 8, 965. [Google Scholar] [CrossRef]
- Casagli, N.; Cigna, F.; Bianchini, S.; Hölbling, D.; Füreder, P.; Righini, G.; Del Conte, S.; Friedl, B.; Schneiderbauer, S.; Iasio, C.; et al. Landslide mapping and monitoring by using radar and optical remote sensing: Examples from the EC-FP7 project SAFER. Remote Sens. Appl. Soc. Environ. 2016, 4, 92–108. [Google Scholar] [CrossRef]
- Barra, A.; Solari, L.; Béjar-Pizarro, M.; Monserrat, O.; Bianchini, S.; Herrera, G.; Crosetto, M.; Sarro, R.; González-Alonso, E.; Mateos, R.M.; et al. A methodology to detect and update active deformation areas based on Sentinel-1 SAR images. Remote Sens. 2017, 9, 1002. [Google Scholar] [CrossRef]
- Lindén, P.E.; Rosenqvist, S. Kontrollmätning av RH 2000-Höjdfixar i Delar av Gävle Stad; University of Gävle: Gävle, Sweden, 2012. [Google Scholar]
- Ottekrall, C.J.; Hedberg, A. Utvärdering av Husgrunders Sättningar i Centrala Gävle: Mätningar, Analyser Och Upprättande av Rutiner för Fortsatt Övervakning; University of Gävle: Gävle, Sweden, 2011. [Google Scholar]
- Perissin, D.; Wang, T. Repeat-pass SAR interferometry with partially coherent targets. IEEE Trans. Geosci. Remote Sens. 2012, 50, 271–280. [Google Scholar] [CrossRef]
- Hanssen, R.F. Radar Interferometry: Data Interpretation and Error Analysis (Remote Sensing and Digital Image Processing); Springer: Dordrecht, The Netherlands, 2001; ISBN 9780792369455. [Google Scholar]
- Scharroo, R.; Visser, P. Precise orbit determination and gravity field improvement for the ERS satellites. J. Geophys. Res. Oceans 1998, 103, 8113–8127. [Google Scholar] [CrossRef]
- Massonnet, D.; Feigl, K.L. Radar interferometry and its application to changes in the earth’s surface. Rev. Geophys. 1998, 36, 441–500. [Google Scholar] [CrossRef]
- Goldstein, R.M.; Werner, C.L. Radar interferogram filtering for geophysical applications. Geophys. Res. Lett. 1998, 25, 4035–4038. [Google Scholar] [CrossRef]
- Roccheggiani, M.; Piacentini, D.; Tirincanti, E.; Perissin, D.; Menichetti, M. Detection and monitoring of tunneling induced ground movements using Sentinel-1 SAR interferometry. Remote Sens. 2019, 11, 639. [Google Scholar] [CrossRef]
- Perissin, D.; Wang, Z.; Wang, T. The SARPROZ InSAR tool for urban subsidence/manmade structure stability monitoring in China. In Proceedings of the 34th International Symposium on Remote Sensing of Environment—The GEOSS Era: Towards Operational Environmental Monitoring, Sidney, Australia, 10–15 April 2011. [Google Scholar]
- Ferretti, A.; Prati, C.; Rocca, F. Analysis of Permanent Scatterers in SAR interferometry. In Proceedings of the International Geoscience and Remote Sensing Symposium (IGARSS), Honolulu, HI, USA, 24–28 July 2000. [Google Scholar]
- Colesanti, C.; Ferretti, A.; Prati, C.; Perissin, D.; Rocca, F. ERS-ENVISAT Permanent Scatterers Interferometry. In Proceedings of the International Geoscience and Remote Sensing Symposium (IGARSS), Toulouse, France, 21–25 July 2003. [Google Scholar]
- Colesanti, C.; Ferretti, A.; Novali, F.; Prati, C.; Rocca, F. SAR monitoring of progressive and seasonal ground deformation using the permanent scatterers technique. IEEE Trans. Geosci. Remote Sens. 2003, 41, 1685–1701. [Google Scholar] [CrossRef]
- Kampes, B.M.; Hanssen, R.F. Ambiguity resolution for permanent scatterer interferometry. IEEE Trans. Geosci. Remote Sens. 2004, 42, 2446–2453. [Google Scholar] [CrossRef]
- Ferretti, A.; Fumagalli, A.; Novali, F.; Prati, C.; Rocca, F.; Rucci, A. A new algorithm for processing interferometric data-stacks: SqueeSAR. IEEE Trans. Geosci. Remote Sens. 2011, 49, 3460–3470. [Google Scholar] [CrossRef]
- Milillo, P.; Bürgmann, R.; Lundgren, P.; Salzer, J.; Perissin, D.; Fielding, E.; Biondi, F.; Milillo, G. Space geodetic monitoring of engineered structures: The ongoing destabilization of the Mosul dam, Iraq. Sci. Rep. 2016, 6, 37408. [Google Scholar] [CrossRef]
- SGI Report. In Gävle Kommun-Analys av Förutsättningar för Naturolyckor Längs Kuststräckan; Statens Geotekniska Institute: Linköping, Sweden, 2012.
- Watts, K.; Charles, A. Building on Fill: Geotechnical Aspects; IHS Company: London, UK, 1993. [Google Scholar]
- Gernhardt, S. High. Precision 3D Localization and Motion Analysis of Persistent Scatterers using Meter-Resolution Radar Satellite Data; The Technical University of Munich: Munich, Germany, 2011. [Google Scholar]
- SWECO. Förstudie, Exploatering av Näringen i Gävle: Översiktlig Stabilitets-Och Grundläggningsutredning för Exploatering av Näringens Industriområde; SWECO Civil AB: Gävle, Sweden, 2020. [Google Scholar]


| Data Info | Ascending | Descending |
|---|---|---|
| Number of scenes | 41 | 50 |
| Acquisition period | 16 January 2015–13 May 2020 | 9 June 2015–19 May 2020 |
| Relative orbit | 102 | 95 |
| Central incidence angle | 38.77 degree | 38.79 degree |
| Acquisition mode | Interferometry Wide swath (IW) | |
| Product type | Single Look Complex (SLC) | |
| Polarization | VV | |
| Validation Site | Method | Track | Point ID | Relative Vertical Displacement Rate (mm/yr) | Relative Vertical Cumulative Displacement (mm) | Coherence |
|---|---|---|---|---|---|---|
| Building-1 | ||||||
| (1985–2019) | Pre. Lev | Point 7 | −1.2 | −45.0 | ||
| (2015–2020) | PSI | AD | 498 | −0.9 | −5.0 | 0.86 |
| Building-2 | ||||||
| (2000–2019) | Pre. Lev | Point 6 | −0.8 | −20.0 | ||
| (2015–2020) | PSI | AD | 430 | −0.7 | −5.0 | 0.88 |
| Building-3 | ||||||
| (1976–1982) | Pre. Lev | Point 6 | −2.0 | −10.0 | ||
| (2015–2020) | PSI | AD | 396 | −0.6 | −4.1 | 0.95 |
| Building-4 | ||||||
| (1974–1988) | Pre. Lev | Point 4 | −1.8 | −31.0 | ||
| (2015–2020) | PSI | AD | 418 | 0.0 | −1.6 | 0.97 |
© 2020 by the authors. Licensee MDPI, Basel, Switzerland. This article is an open access article distributed under the terms and conditions of the Creative Commons Attribution (CC BY) license (http://creativecommons.org/licenses/by/4.0/).
Share and Cite
Gido, N.A.A.; Bagherbandi, M.; Nilfouroushan, F. Localized Subsidence Zones in Gävle City Detected by Sentinel-1 PSI and Leveling Data. Remote Sens. 2020, 12, 2629. https://doi.org/10.3390/rs12162629
Gido NAA, Bagherbandi M, Nilfouroushan F. Localized Subsidence Zones in Gävle City Detected by Sentinel-1 PSI and Leveling Data. Remote Sensing. 2020; 12(16):2629. https://doi.org/10.3390/rs12162629
Chicago/Turabian StyleGido, Nureldin A. A., Mohammad Bagherbandi, and Faramarz Nilfouroushan. 2020. "Localized Subsidence Zones in Gävle City Detected by Sentinel-1 PSI and Leveling Data" Remote Sensing 12, no. 16: 2629. https://doi.org/10.3390/rs12162629
APA StyleGido, N. A. A., Bagherbandi, M., & Nilfouroushan, F. (2020). Localized Subsidence Zones in Gävle City Detected by Sentinel-1 PSI and Leveling Data. Remote Sensing, 12(16), 2629. https://doi.org/10.3390/rs12162629