Next Issue
Volume 11, November-1
Previous Issue
Volume 11, October-1
 
 
remotesensing-logo

Journal Browser

Journal Browser

Remote Sens., Volume 11, Issue 20 (October-2 2019) – 127 articles

Cover Story (view full-size image): 
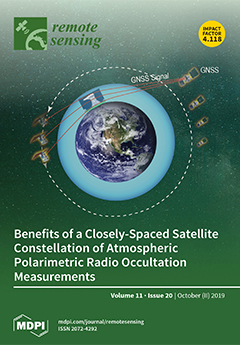
The climate and weather forecast predictive capability for precipitation intensity is limited by gaps in the understanding of cloud-convective processes. A better understanding of these processes lacks observational constraints, due to the difficulty in obtaining vertically resolved pressure, temperature, and water vapor structure inside and near convective clouds. By collecting sequential radio occultation (RO) observations from a constellation of closely spaced low Earth-orbiting satellites, the RO tangent points tend to cluster together, and the associated ray paths sample independent air mass quantities. The presence of heavy precipitation can be discerned by the use of the polarimetric RO (PRO) technique. Over time, one or more PRO intersect a region of heavy precipitation, and one or more capture the surrounding environment. View this paper.
  • Issues are regarded as officially published after their release is announced to the table of contents alert mailing list.
  • You may sign up for e-mail alerts to receive table of contents of newly released issues.
  • PDF is the official format for papers published in both, html and pdf forms. To view the papers in pdf format, click on the "PDF Full-text" link, and use the free Adobe Reader to open them.
Order results
Result details
Section
Select all
Export citation of selected articles as:
20 pages, 7953 KiB  
Article
Ultrasonic Proximal Sensing of Pasture Biomass
by Mathew Legg and Stuart Bradley
Remote Sens. 2019, 11(20), 2459; https://doi.org/10.3390/rs11202459 - 22 Oct 2019
Cited by 19 | Viewed by 3932
Abstract
The optimization of pasture food value, known as ‘biomass’, is crucial in the management of the farming of grazing animals and in improving food production for the future. Optical sensing methods, particularly from satellite platforms, provide relatively inexpensive and frequently updated wide-area coverage [...] Read more.
The optimization of pasture food value, known as ‘biomass’, is crucial in the management of the farming of grazing animals and in improving food production for the future. Optical sensing methods, particularly from satellite platforms, provide relatively inexpensive and frequently updated wide-area coverage for monitoring biomass and other forage properties. However, there are also benefits from direct or proximal sensing methods for higher accuracy, more immediate results, and for continuous updates when cloud cover precludes satellite measurements. Direct measurement, by cutting and weighing the pasture, is destructive, and may not give results representative of a larger area of pasture. Proximal sensing methods may also suffer from sampling small areas, and can be generally inaccurate. A new proximal methodology is described here, in which low-frequency ultrasound is used as a sonar to obtain a measure of the vertical variation of the pasture density between the top of the pasture and the ground and to relate this to biomass. The instrument is designed to operate from a farm vehicle moving at up to 20 km h−1, thus allowing a farmer to obtain wide coverage in the normal course of farm operations. This is the only method providing detailed biomass profile information from throughout the entire pasture canopy. An essential feature is the identification of features from the ultrasonic reflectance, which can be related sensibly to biomass, thereby generating a physically-based regression model. The result is significantly improved estimation of pasture biomass, in comparison with other proximal methods. Comparing remotely sensed biomass to the biomass measured via cutting and weighing gives coefficients of determination, R2, in the range of 0.7 to 0.8 for a range of pastures and when operating the farm vehicle at speeds of up to 20 km h−1. Full article
(This article belongs to the Special Issue Advances of Remote Sensing in Pasture Management)
Show Figures

Graphical abstract

23 pages, 3308 KiB  
Article
A Supervised Method for Nonlinear Hyperspectral Unmixing
by Bikram Koirala, Mahdi Khodadadzadeh, Cecilia Contreras, Zohreh Zahiri, Richard Gloaguen and Paul Scheunders
Remote Sens. 2019, 11(20), 2458; https://doi.org/10.3390/rs11202458 - 22 Oct 2019
Cited by 13 | Viewed by 4662
Abstract
Due to the complex interaction of light with the Earth’s surface, reflectance spectra can be described as highly nonlinear mixtures of the reflectances of the material constituents occurring in a given resolution cell of hyperspectral data. Our aim is to estimate the fractional [...] Read more.
Due to the complex interaction of light with the Earth’s surface, reflectance spectra can be described as highly nonlinear mixtures of the reflectances of the material constituents occurring in a given resolution cell of hyperspectral data. Our aim is to estimate the fractional abundance maps of the materials from the nonlinear hyperspectral data. The main disadvantage of using nonlinear mixing models is that the model parameters are not properly interpretable in terms of fractional abundances. Moreover, not all spectra of a hyperspectral dataset necessarily follow the same particular mixing model. In this work, we present a supervised method for nonlinear spectral unmixing. The method learns a mapping from a true hyperspectral dataset to corresponding linear spectra, composed of the same fractional abundances. A simple linear unmixing then reveals the fractional abundances. To learn this mapping, ground truth information is required, in the form of actual spectra and corresponding fractional abundances, along with spectra of the pure materials, obtained from a spectral library or available in the dataset. Three methods are presented for learning nonlinear mapping, based on Gaussian processes, kernel ridge regression, and feedforward neural networks. Experimental results conducted on an artificial dataset, a data set obtained by ray tracing, and a drill core hyperspectral dataset shows that this novel methodology is very promising. Full article
(This article belongs to the Special Issue Advances in Unmixing of Spectral Imagery)
Show Figures

Graphical abstract

16 pages, 3749 KiB  
Article
A Radar Radial Velocity Dealiasing Algorithm for Radar Data Assimilation and its Evaluation with Observations from Multiple Radar Networks
by Guangxin He, Juanzhen Sun, Zhuming Ying and Lejian Zhang
Remote Sens. 2019, 11(20), 2457; https://doi.org/10.3390/rs11202457 - 22 Oct 2019
Cited by 5 | Viewed by 3006
Abstract
Automated and accurate radar dealiasing algorithms are very important for their assimilation into operational numerical weather forecasting models. A radar radial velocity dealiasing algorithm aimed at radar data assimilation is introduced and assessed using from several S-band and C-band radar observations under the [...] Read more.
Automated and accurate radar dealiasing algorithms are very important for their assimilation into operational numerical weather forecasting models. A radar radial velocity dealiasing algorithm aimed at radar data assimilation is introduced and assessed using from several S-band and C-band radar observations under the severe weather conditions of hurricanes, typhoons, and deep continental convection in this paper. This dealiasing algorithm, named automated dealiasing for data assimilation (ADDA), is a further development of the dealiasing algorithm named the China radar network (CINRAD) improved dealiasing algorithm (CIDA), originally developed for China’s CINRAD (China Next Generation Weather Radar) radar network. The improved scheme contains five modules employed to remove noisy data, select the suitable first radial, preserve the convective regions, execute multipass dealiasing in both azimuthal and radial directions and conduct the final local dealiasing with an error check. This new dealiasing algorithm was applied to two hurricane cases, two typhoon cases, and three intense-convection cases that were observed from the CINRAD of China, Taiwan‘s radar network, and NEXRAD (Next Generation Weather Radar) of the U.S. with a continuous period of more than 12 h for each case. The dealiasing results demonstrated that ADDA performed better than CIDA for all selected cases. This algorithm not only produced a high success rate for the S-band radar, but also a reasonable performance for the C-band radar. Full article
(This article belongs to the Special Issue Tropical Cyclones Remote Sensing and Data Assimilation)
Show Figures

Graphical abstract

22 pages, 4670 KiB  
Article
Improving Field-Scale Wheat LAI Retrieval Based on UAV Remote-Sensing Observations and Optimized VI-LUTs
by Wanxue Zhu, Zhigang Sun, Yaohuan Huang, Jianbin Lai, Jing Li, Junqiang Zhang, Bin Yang, Binbin Li, Shiji Li, Kangying Zhu, Yang Li and Xiaohan Liao
Remote Sens. 2019, 11(20), 2456; https://doi.org/10.3390/rs11202456 - 22 Oct 2019
Cited by 33 | Viewed by 4366
Abstract
Leaf area index (LAI) is a key biophysical parameter for monitoring crop growth status, predicting crop yield, and quantifying crop variability in agronomic applications. Mapping the LAI at the field scale using multispectral cameras onboard unmanned aerial vehicles (UAVs) is a promising precision-agriculture [...] Read more.
Leaf area index (LAI) is a key biophysical parameter for monitoring crop growth status, predicting crop yield, and quantifying crop variability in agronomic applications. Mapping the LAI at the field scale using multispectral cameras onboard unmanned aerial vehicles (UAVs) is a promising precision-agriculture application with specific requirements: The LAI retrieval method should be (1) robust so that crop LAI can be estimated with similar accuracy and (2) easy to use so that it can be applied to the adjustment of field management practices. In this study, three UAV remote-sensing missions (UAVs with Micasense RedEdge-M and Cubert S185 cameras) were carried out over six experimental plots from 2018 to 2019 to investigate the performance of reflectance-based lookup tables (LUTs) and vegetation index (VI)-based LUTs generated from the PROSAIL model for wheat LAI retrieval. The effects of the central wavelengths and bandwidths for the VI calculations on the LAI retrieval were further examined. We found that the VI-LUT strategy was more robust and accurate than the reflectance-LUT strategy. The differences in the LAI retrieval accuracy among the four VI-LUTs were small, although the improved modified chlorophyll absorption ratio index-lookup table (MCARI2-LUT) and normalized difference vegetation index-lookup table (NDVI-LUT) performed slightly better. We also found that both of the central wavelengths and bandwidths of the VIs had effects on the LAI retrieval. The VI-LUTs with optimized central wavelengths (red = 612 nm, near-infrared (NIR) = 756 nm) and narrow bandwidths (~4 nm) improved the wheat LAI retrieval accuracy (R2 ≥ 0.75). The results of this study provide an alternative method for retrieving crop LAI, which is robust and easy use for precision-agriculture applications and may be helpful for designing UAV multispectral cameras for agricultural monitoring. Full article
(This article belongs to the Section Remote Sensing in Agriculture and Vegetation)
Show Figures

Graphical abstract

16 pages, 10961 KiB  
Article
Wetland Classification Based on a New Efficient Generative Adversarial Network and Jilin-1 Satellite Image
by Zhi He, Dan He, Xiangqin Mei and Saihan Hu
Remote Sens. 2019, 11(20), 2455; https://doi.org/10.3390/rs11202455 - 22 Oct 2019
Cited by 13 | Viewed by 3311
Abstract
Recent studies have shown that deep learning methods provide useful tools for wetland classification. However, it is difficult to perform species-level classification with limited labeled samples. In this paper, we propose a semi-supervised method for wetland species classification by using a new efficient [...] Read more.
Recent studies have shown that deep learning methods provide useful tools for wetland classification. However, it is difficult to perform species-level classification with limited labeled samples. In this paper, we propose a semi-supervised method for wetland species classification by using a new efficient generative adversarial network (GAN) and Jilin-1 satellite image. The main contributions of this paper are twofold. First, the proposed method, namely ShuffleGAN, requires only a small number of labeled samples. ShuffleGAN is composed of two neural networks (i.e., generator and discriminator), which perform an adversarial game in the training phase and ShuffleNet units are added in both generator and discriminator to obtain speed-accuracy tradeoff. Second, ShuffleGAN can perform species-level wetland classification. In addition to distinguishing the wetland areas from non-wetlands, different tree species located in the wetland are also identified, thus providing a more detailed distribution of the wetland land-covers. Experiments are conducted on the Haizhu Lake wetland data acquired by the Jilin-1 satellite. Compared with existing GAN, the improvement in overall accuracy (OA) of the proposed ShuffleGAN is more than 2%. This work can not only deepen the application of deep learning in wetland classification but also promote the study of fine classification of wetland land-covers. Full article
Show Figures

Graphical abstract

18 pages, 2141 KiB  
Article
A Superpixel-Based Relational Auto-Encoder for Feature Extraction of Hyperspectral Images
by Miaomiao Liang, Licheng Jiao and Zhe Meng
Remote Sens. 2019, 11(20), 2454; https://doi.org/10.3390/rs11202454 - 22 Oct 2019
Cited by 14 | Viewed by 3107
Abstract
Filter banks transferred from a pre-trained deep convolutional network exhibit significant performance in heightening the inter-class separability for hyperspectral image feature extraction, but weakening the intra-class consistency simultaneously. In this paper, we propose a new superpixel-based relational auto-encoder for cohesive spectral–spatial feature learning. [...] Read more.
Filter banks transferred from a pre-trained deep convolutional network exhibit significant performance in heightening the inter-class separability for hyperspectral image feature extraction, but weakening the intra-class consistency simultaneously. In this paper, we propose a new superpixel-based relational auto-encoder for cohesive spectral–spatial feature learning. Firstly, multiscale local spatial information and global semantic features of hyperspectral images are extracted by filter banks transferred from the pre-trained VGG-16. Meanwhile, we utilize superpixel segmentation to construct the low-dimensional manifold embedded in the spectral domain. Then, representational consistency constraint among each superpixel is added in the objective function of sparse auto-encoder, which iteratively assist and supervisedly learn hidden representation of deep spatial feature with greater cohesiveness. Superpixel-based local consistency constraint in this work not only reduces the computational complexity, but builds the neighborhood relationships adaptively. The final feature extraction is accomplished by collaborative encoder of spectral–spatial feature and weighting fusion of multiscale features. A large number of experimental results demonstrate that our proposed method achieves expected results in discriminant feature extraction and has certain advantages over some existing methods, especially on extremely limited sample conditions. Full article
Show Figures

Graphical abstract

25 pages, 11758 KiB  
Article
Integrating Stereo Images and Laser Altimeter Data of the ZY3-02 Satellite for Improved Earth Topographic Modeling
by Guo Zhang, Kai Xu, Peng Jia, Xiaoyun Hao and Deren Li
Remote Sens. 2019, 11(20), 2453; https://doi.org/10.3390/rs11202453 - 22 Oct 2019
Cited by 18 | Viewed by 3104
Abstract
The positioning accuracy is critical for satellite-based topographic modeling in cases of exterior orientation parameters with high uncertainty and scarce ground control data. The integration of multi-sensor data can help to ensure precision topographical modeling in such situations. Presently, research on the combined [...] Read more.
The positioning accuracy is critical for satellite-based topographic modeling in cases of exterior orientation parameters with high uncertainty and scarce ground control data. The integration of multi-sensor data can help to ensure precision topographical modeling in such situations. Presently, research on the combined processing of optical camera images and laser altimeter data has focused on planetary observations, especially on the Moon and Mars. This study presents an endeavor to establish a combined adjustment model with one constraint in image space for integration of ZY3-02 stereo images and laser altimeter data for improved Earth topographic modeling. The geometric models for stereo images and laser altimeter data were built first, and then, the laser ranging information was introduced to construct a combined adjustment model on the basis of the block adjustment model. One constraint that minimized the back-projection discrepancies in image space was incorporated into the combined adjustment. Datasets in several areas were collected as experimental data for the validation work. Experimental results demonstrated that the inconsistencies between stereo images and laser altimeter data for the ZY3-02 satellite can be reduced, and the elevation accuracy of stereo images can be significantly improved after applying the proposed combined adjustment. Experiments further proved that the improved height accuracy is insensitive to the number and relative position of laser altimeter points (LAPs) in stereo images. Moreover, additional plane control points (PCPs) were incorporated to achieve better planimetric accuracy. Experimental results in the Dengfeng area showed that the adjustment results derived by using LAPs and additional four PCPs were only slightly lower than those for the block adjustment with four ground control points (GCPs). Generally, the proposed approach can effectively improve the quality of Earth topographic model. Full article
(This article belongs to the Section Remote Sensing Image Processing)
Show Figures

Graphical abstract

16 pages, 7110 KiB  
Article
Impact of Urbanization and Climate on Vegetation Coverage in the Beijing–Tianjin–Hebei Region of China
by Qian Zhou, Xiang Zhao, Donghai Wu, Rongyun Tang, Xiaozheng Du, Haoyu Wang, Jiacheng Zhao, Peipei Xu and Yifeng Peng
Remote Sens. 2019, 11(20), 2452; https://doi.org/10.3390/rs11202452 - 22 Oct 2019
Cited by 23 | Viewed by 4044
Abstract
Worldwide urbanization leads to ecological changes around urban areas. However, few studies have quantitatively investigated the impacts of urbanization on vegetation coverage so far. As an important indicator measuring regional environment change, fractional vegetation cover (FVC) is widely used to analyze changes in [...] Read more.
Worldwide urbanization leads to ecological changes around urban areas. However, few studies have quantitatively investigated the impacts of urbanization on vegetation coverage so far. As an important indicator measuring regional environment change, fractional vegetation cover (FVC) is widely used to analyze changes in vegetation in urban areas. In this study, on the basis of a partial derivative model, we quantified the effect of temperature, precipitation, radiation, and urbanization represented as nighttime light on vegetation coverage changes in the Beijing–Tianjin–Hebei (BTH) region during its period of rapid resident population growth from 2001 to 2011. The results showed that (1) the FVC of the BTH region varied from 0.20 to 0.26, with significant spatial heterogeneity. The FVC increased in small cities such as Cangzhou and in the Taihang Mountains, while it decreased in megacities with populations greater than 1 million, such as Beijing and Zhangjiakou Bashang. (2) The BTH region experienced rapid urbanization, with the area of artificial surface increasing by 18.42%. From the urban core area to the fringe area, the urbanization intensity decreased, but the urbanization rate increased. (3) Urbanization and precipitation had the greatest effect on FVC changes. Urbanization dominated the FVC changes in the expanded area, while precipitation had the greatest impacts on the FVC changes in the core area. For future studies on the major influencing factors of FVC changes, quantitative analysis of the contribution of urbanization to FVC changes in urban regions is crucial and will provide scientific perspectives for sustainable urban planning. Full article
(This article belongs to the Special Issue Remote Sensing of Human-Environment Interactions)
Show Figures

Graphical abstract

18 pages, 7218 KiB  
Article
Combining Machine Learning and Compact Polarimetry for Estimating Soil Moisture from C-Band SAR Data
by Emanuele Santi, Mohammed Dabboor, Simone Pettinato and Simonetta Paloscia
Remote Sens. 2019, 11(20), 2451; https://doi.org/10.3390/rs11202451 - 22 Oct 2019
Cited by 23 | Viewed by 3851
Abstract
This research aimed at exploiting the joint use of machine learning and polarimetry for improving the retrieval of surface soil moisture content (SMC) from synthetic aperture radar (SAR) acquisitions at C-band. The study was conducted on two agricultural areas in Canada, for which [...] Read more.
This research aimed at exploiting the joint use of machine learning and polarimetry for improving the retrieval of surface soil moisture content (SMC) from synthetic aperture radar (SAR) acquisitions at C-band. The study was conducted on two agricultural areas in Canada, for which a series of RADARSAT-2 (RS2) images were available along with direct measurements of SMC from in situ stations. The analysis confirmed the sensitivity of RS2 backscattering (σ°) to SMC. The comparison of SMC with the compact polarimetry (CP) parameters, computed from the RS2 acquisitions by the CP data simulator, pointed out that some CP parameters had a sensitivity to SMC equal or better than σ°, with correlation coefficients up to R ≃ 0.4. Based on these results, the potential of machine learning (ML) for SMC retrieval was exploited by implementing and testing on the available data an artificial neural network (ANN) algorithm. The algorithm was implemented using several combinations of σ° and CP parameters. Validation results of the algorithm with in situ observations confirmed the promising capabilities of the ML techniques for SMC monitoring. Furthermore, results pointed out the potential of CP in improving the SMC retrieval accuracy, especially when used in combination with linearly polarized σ°. Depending on the considered input combination, the ANN algorithm was able to estimate SMC with Root Mean Square Error (RMSE) between 3% and 7% of SMC and R between 0.7 and 0.9. Full article
(This article belongs to the Special Issue Compact Polarimetric SAR)
Show Figures

Graphical abstract

8 pages, 3048 KiB  
Technical Note
Response to Variations in River Flowrate by a Spaceborne GNSS-R River Width Estimator
by April Warnock and Christopher Ruf
Remote Sens. 2019, 11(20), 2450; https://doi.org/10.3390/rs11202450 - 22 Oct 2019
Cited by 16 | Viewed by 3878
Abstract
In recent years, the use of Global Navigation Satellite System-Reflectometry (GNSS-R) for remote sensing of the Earth’s surface has gained momentum as a means to exploit existing spaceborne microwave navigation systems for science-related applications. Here, we explore the potential for using measurements made [...] Read more.
In recent years, the use of Global Navigation Satellite System-Reflectometry (GNSS-R) for remote sensing of the Earth’s surface has gained momentum as a means to exploit existing spaceborne microwave navigation systems for science-related applications. Here, we explore the potential for using measurements made by a spaceborne GNSS-R bistatic radar system (CYGNSS) during river overpasses to estimate its width, and to use that width as a proxy for river flowrate. We present a case study utilizing CYGNSS data collected in the spring of 2019 during multiple overpasses of the Pascagoula River in southern Mississippi over a range of flowrates. Our results demonstrate that a measure of river width derived from CYGNSS is highly correlated with the observed flowrates. We show that an approximately monotonic relationship exists between river flowrate and a measure of river width which we define as the associated GNSS-R width (AGW). These results suggest the potential for GNSS-R systems to be utilized as a means to estimate river flowrates and widths from space. Full article
(This article belongs to the Special Issue GPS/GNSS for Earth Science and Applications)
Show Figures

Graphical abstract

20 pages, 2258 KiB  
Article
Remote Sensing of the Atmosphere by the Ultraviolet Detector TUS Onboard the Lomonosov Satellite
by Pavel Klimov, Boris Khrenov, Margarita Kaznacheeva, Gali Garipov, Mikhail Panasyuk, Vasily Petrov, Sergei Sharakin, Andrei Shirokov, Ivan Yashin, Mikhail Zotov, Viktor Grebenyuk, Andrei Grinyuk, Maria Lavrova, Artur Tkachenko, Leonid Tkachev, Alla Botvinko, Oleg Saprykin, Andrei Puchkov and Alexander Senkovsky
Remote Sens. 2019, 11(20), 2449; https://doi.org/10.3390/rs11202449 - 22 Oct 2019
Cited by 14 | Viewed by 4446
Abstract
The orbital detector TUS (Tracking Ultraviolet Setup) with high sensitivity in near-visible ultraviolet (tens of photons per time sample of 0.8 μ s of wavelengths 300–400 nm from a detector’s pixel field of view) and the microsecond-scale temporal resolution was developed by the [...] Read more.
The orbital detector TUS (Tracking Ultraviolet Setup) with high sensitivity in near-visible ultraviolet (tens of photons per time sample of 0.8 μ s of wavelengths 300–400 nm from a detector’s pixel field of view) and the microsecond-scale temporal resolution was developed by the Lomonosov-UHECR/TLE collaboration and launched into orbit on 28 April 2016. A variety of different phenomena were studied by measuring ultraviolet signals from the atmosphere: extensive air showers from ultra-high-energy cosmic rays, lightning discharges, transient atmospheric events, aurora ovals, and meteors. These events are different in their origin and in their duration and luminosity. The TUS detector had a capability to conduct measurements with different temporal resolutions (0.8 μ s, 25.6 μ s, 0.4 ms, and 6.6 ms) but the same spatial resolution of 5 km. Results of the TUS detector measurements of various atmospheric emissions are discussed and compared to data from previous experiments. Full article
(This article belongs to the Section Atmospheric Remote Sensing)
Show Figures

Graphical abstract

24 pages, 11289 KiB  
Article
Assessment of Phytoecological Variability by Red-Edge Spectral Indices and Soil-Landscape Relationships
by Helena S. K. Pinheiro, Theresa P. R. Barbosa, Mauro A. H. Antunes, Daniel Costa de Carvalho, Alexis R. Nummer, Waldir de Carvalho Junior, Cesar da Silva Chagas, Elpídio I. Fernandes-Filho and Marcos Gervasio Pereira
Remote Sens. 2019, 11(20), 2448; https://doi.org/10.3390/rs11202448 - 22 Oct 2019
Cited by 5 | Viewed by 2862
Abstract
There is a relation of vegetation physiognomies with soil and geological conditions that can be represented spatially with the support of remote sensing data. The goal of this research was to map vegetation physiognomies in a mountainous area by using Sentinel-2 Multispectral Instrument [...] Read more.
There is a relation of vegetation physiognomies with soil and geological conditions that can be represented spatially with the support of remote sensing data. The goal of this research was to map vegetation physiognomies in a mountainous area by using Sentinel-2 Multispectral Instrument (MSI) data and morphometrical covariates through data mining techniques. The research was based on red-edge (RE) bands, and indices, to classify phytophysiognomies at two taxonomic levels. The input data was pixel sampled based on field sample sites. Data mining procedures comprised covariate selection and supervised classification through the Random Forest model. Results showed the potential of bands 3, 5, and 6 to map phytophysiognomies for both seasons, as well as Green Chlorophyll (CLg) and SAVI indices. NDVI indices were important, particularly those calculated with bands 6, 7, 8, and 8A, which were placed at the RE position. The model performance showed reasonable success to Kappa index 0.72 and 0.56 for the first and fifth taxonomic level, respectively. The model presented confusion between Broadleaved dwarf-forest, Parkland Savanna, and Bushy grassland. Savanna formations occurred variably in the area while Bushy grasslands strictly occur in certain landscape positions. Broadleaved forests presented the best performance (first taxonomic level), and among its variation (fifth level) the model could precisely capture the pattern for those on deep soils from gneiss parent material. The approach was thus useful to capture intrinsic soil-plant relationships and its relation with remote sensing data, showing potential to map phytophysiognomies in two distinct taxonomic levels in poorly accessible areas. Full article
(This article belongs to the Special Issue Remote Sensing of Tropical Phenology)
Show Figures

Graphical abstract

12 pages, 3756 KiB  
Technical Note
Estimating Pasture Biomass and Canopy Height in Brazilian Savanna Using UAV Photogrammetry
by Juliana Batistoti, José Marcato Junior, Luís Ítavo, Edson Matsubara, Eva Gomes, Bianca Oliveira, Maurício Souza, Henrique Siqueira, Geison Salgado Filho, Thales Akiyama, Wesley Gonçalves, Veraldo Liesenberg, Jonathan Li and Alexandre Dias
Remote Sens. 2019, 11(20), 2447; https://doi.org/10.3390/rs11202447 - 22 Oct 2019
Cited by 31 | Viewed by 4475
Abstract
The Brazilian territory contains approximately 160 million hectares of pastures, and it is necessary to develop techniques to automate their management and increase their production. This technical note has two objectives: First, to estimate the canopy height using unmanned aerial vehicle (UAV) photogrammetry; [...] Read more.
The Brazilian territory contains approximately 160 million hectares of pastures, and it is necessary to develop techniques to automate their management and increase their production. This technical note has two objectives: First, to estimate the canopy height using unmanned aerial vehicle (UAV) photogrammetry; second, to propose an equation for the estimation of biomass of Brazilian savanna (Cerrado) pastures based on UAV canopy height. Four experimental units of Panicum maximum cv. BRS Tamani were evaluated. Herbage mass sampling, height measurements, and UAV image collection were simultaneously performed. The UAVs were flown at a height of 50 m, and images were generated with a mean ground sample distance (GSD) of approximately 1.55 cm. The forage canopy height estimated by UAVs was calculated as the difference between the digital surface model (DSM) and the digital terrain model (DTM). The R2 between ruler height and UAV height was 0.80; between biomass (kg ha−1 GB—green biomass) and ruler height, 0.81; and between biomass (kg ha−1 GB) and UAV height, 0.74. UAV photogrammetry proved to be a potential technique to estimate height and biomass in Brazilian Panicum maximum cv. BRS Tamani pastures located in the endangered Brazilian savanna (Cerrado) biome. Full article
(This article belongs to the Section Remote Sensing in Agriculture and Vegetation)
Show Figures

Figure 1

24 pages, 12199 KiB  
Article
Contribution to Sandy Site Characterization: Spectro-Directional Signature, Grain Size Distribution and Mineralogy Extracted from Sand Samples
by Françoise Viallefont-Robinet, Cédric Bacour, Marc Bouvet, Malika Kheireddine, Mustapha Ouhssain, Ramzi Idoughi, Léo Grignon, Eric Munesa, François Lemaître and Thomas Rivière
Remote Sens. 2019, 11(20), 2446; https://doi.org/10.3390/rs11202446 - 21 Oct 2019
Cited by 3 | Viewed by 2940
Abstract
The characterization of sands detailed in this paper has been performed in order to support the in-flight radiometric performance assessment of space-borne optical sensors over the so-called Pseudo-Invariant Calibration Sites (PICS). Although the physical properties of PICS surface are fairly stable in time, [...] Read more.
The characterization of sands detailed in this paper has been performed in order to support the in-flight radiometric performance assessment of space-borne optical sensors over the so-called Pseudo-Invariant Calibration Sites (PICS). Although the physical properties of PICS surface are fairly stable in time, the signal measured from space varies with the illumination and the viewing geometries. Thus, there is a need to characterize the spectro-directional properties of PICS. This could be done on a broad scale, thanks to multi-spectral multi-directional space-borne sensors such as the POLDER instrument (with old data). However, interpolating or extrapolating the spectro-directional reflectance measured from space to spectral bands of another sensor is not straightforward. The hyperspectral characterization of sand samples collected within or nearby PICS could contribute to a solution. In this context, a set of 31 sand samples was compiled. The BiConical Reflectance Factor (BCRF), linked to Bidirectional Reflectance Distribution Function (BRDF), was measured between 0.4 and 2.5 µm, over a half hemisphere when the amount of sand in the sample was large enough and for only a single fixed angular configuration for small samples. These optical measurements were complemented by grain size distribution measurements and mineralogical analysis and compiled together with previously published measurements in the so-called PICSAND database, freely available online. Full article
(This article belongs to the Section Engineering Remote Sensing)
Show Figures

Graphical abstract

14 pages, 3616 KiB  
Article
Liquid Water Detection under the South Polar Layered Deposits of Mars—A Probabilistic Inversion Approach
by Sebastian Emanuel Lauro, Francesco Soldovieri, Roberto Orosei, Andrea Cicchetti, Marco Cartacci, Elisabetta Mattei, Barbara Cosciotti, Federico Di Paolo, Raffaella Noschese and Elena Pettinelli
Remote Sens. 2019, 11(20), 2445; https://doi.org/10.3390/rs11202445 - 21 Oct 2019
Cited by 7 | Viewed by 3640
Abstract
Liquid water was present on the surface of Mars in the distant past; part of that water is now in the ground in the form of permafrost and heat from the molten interior of the planet could cause it to melt at depth. [...] Read more.
Liquid water was present on the surface of Mars in the distant past; part of that water is now in the ground in the form of permafrost and heat from the molten interior of the planet could cause it to melt at depth. MARSIS (Mars Advanced Radar for Subsurface and Ionosphere Sounding) has surveyed the Martian subsurface for more than fifteen years in search for evidence of such water buried at depth. Radar detection of liquid water can be stated as an inverse electromagnetic scattering problem, starting from the echo intensity collected by the antenna. In principle, the electromagnetic problem can be modelled as a normal plane wave that propagates through a three-layered medium made of air, ice and basal material, with the final goal of determining the dielectric permittivity of the basal material. In practice, however, two fundamental aspects make the inversion procedure of this apparent simple model rather challenging: (i) the impossibility to use the absolute value of the echo intensity in the inversion procedure; (ii) the impossibility to use a deterministic approach to retrieve the basal permittivity. In this paper, these issues are faced by assuming a priori information on the ice electromagnetic properties and adopting an inversion probabilistic approach. All the aspects that can affect the estimation of the basal permittivity below the Martian South polar cap are discussed and how detection of the presence of basal liquid water was done is described. Full article
(This article belongs to the Special Issue Real-Time Radar Imaging and Sensing)
Show Figures

Graphical abstract

17 pages, 4001 KiB  
Article
Turbulence Measurements with Dual-Doppler Scanning Lidars
by Alfredo Peña and Jakob Mann
Remote Sens. 2019, 11(20), 2444; https://doi.org/10.3390/rs11202444 - 21 Oct 2019
Cited by 6 | Viewed by 3474
Abstract
Velocity-component variances can be directly computed from lidar measurements using information of the second-order statistics within the lidar probe volume. Specifically, by using the Doppler radial velocity spectrum, one can estimate the unfiltered radial velocity variance. This information is not always available in [...] Read more.
Velocity-component variances can be directly computed from lidar measurements using information of the second-order statistics within the lidar probe volume. Specifically, by using the Doppler radial velocity spectrum, one can estimate the unfiltered radial velocity variance. This information is not always available in current lidar campaigns. The velocity-component variances can also be indirectly computed from the reconstructed velocities but they are biased compared to those computed from, e.g., sonic anemometers. Here we show, for the first time, how to estimate such biases for a multi-lidar system and we demonstrate, also for the first time, their dependence on the turbulence characteristics and the lidar beam scanning geometry relative to the wind direction. For a dual-Doppler lidar system, we also show that the indirect method has an advantage compared to the direct one for commonly-used scanning configurations due to the singularity of the system. We demonstrate that our estimates of the radial velocity and velocity-component biases are accurate by analysis of measurements performed over a flat site using a dual-Doppler lidar system, where both lidars stared over a volume close to a sonic anemometer at a height of 100 m. We also show that mapping these biases over a spatial domain helps to plan meteorological campaigns, where multi-lidar systems can potentially be used. Particularly, such maps help the multi-point mapping of wind resources and conditions, which improve the tools needed for wind turbine siting. Full article
(This article belongs to the Section Atmospheric Remote Sensing)
Show Figures

Graphical abstract

20 pages, 1175 KiB  
Perspective
Measuring Marine Plastic Debris from Space: Initial Assessment of Observation Requirements
by Víctor Martínez-Vicente, James R. Clark, Paolo Corradi, Stefano Aliani, Manuel Arias, Mathias Bochow, Guillaume Bonnery, Matthew Cole, Andrés Cózar, Rory Donnelly, Fidel Echevarría, François Galgani, Shungudzemwoyo P. Garaba, Lonneke Goddijn-Murphy, Laurent Lebreton, Heather A. Leslie, Penelope K. Lindeque, Nikolai Maximenko, François-Régis Martin-Lauzer, Delwyn Moller, Peter Murphy, Lorenzo Palombi, Valentina Raimondi, Julia Reisser, Laia Romero, Stefan G.H. Simis, Sindy Sterckx, Richard C. Thompson, Konstantinos N. Topouzelis, Erik van Sebille, Joana Mira Veiga and A. Dick Vethaakadd Show full author list remove Hide full author list
Remote Sens. 2019, 11(20), 2443; https://doi.org/10.3390/rs11202443 - 21 Oct 2019
Cited by 99 | Viewed by 21711
Abstract
Sustained observations are required to determine the marine plastic debris mass balance and to support effective policy for planning remedial action. However, observations currently remain scarce at the global scale. A satellite remote sensing system could make a substantial contribution to tackling this [...] Read more.
Sustained observations are required to determine the marine plastic debris mass balance and to support effective policy for planning remedial action. However, observations currently remain scarce at the global scale. A satellite remote sensing system could make a substantial contribution to tackling this problem. Here, we make initial steps towards the potential design of such a remote sensing system by: (1) identifying the properties of marine plastic debris amenable to remote sensing methods and (2) highlighting the oceanic processes relevant to scientific questions about marine plastic debris. Remote sensing approaches are reviewed and matched to the optical properties of marine plastic debris and the relevant spatio-temporal scales of observation to identify challenges and opportunities in the field. Finally, steps needed to develop marine plastic debris detection by remote sensing platforms are proposed in terms of fundamental science as well as linkages to ongoing planning for satellite systems with similar observation requirements. Full article
(This article belongs to the Special Issue EO Solutions to Support Countries Implementing the SDGs)
Show Figures

Graphical abstract

27 pages, 9168 KiB  
Article
The Use of SMAP-Reflectometry in Science Applications: Calibration and Capabilities
by Nereida Rodriguez-Alvarez, Sidharth Misra, Erika Podest, Mary Morris and Xavier Bosch-Lluis
Remote Sens. 2019, 11(20), 2442; https://doi.org/10.3390/rs11202442 - 21 Oct 2019
Cited by 18 | Viewed by 3404
Abstract
The Soil Moisture Active Passive (SMAP) mission became one of the newest spaceborne Global Navigation Satellite System–Reflectometry (GNSS-R) missions collecting Global Positioning System (GPS) bistatic radar measurements when the band-pass center frequency of its radar receiver was switched to the GPS L2C band. [...] Read more.
The Soil Moisture Active Passive (SMAP) mission became one of the newest spaceborne Global Navigation Satellite System–Reflectometry (GNSS-R) missions collecting Global Positioning System (GPS) bistatic radar measurements when the band-pass center frequency of its radar receiver was switched to the GPS L2C band. SMAP-Reflectometry (SMAP-R) brings a set of unique capabilities, such as polarimetry and improved spatial resolution, that allow for the exploration of scientific applications that other GNSS-R missions cannot address. In order to leverage SMAP-R for scientific applications, a calibration must be performed to account for the characteristics of the SMAP radar receiver and each GPS transmitter. In this study, we analyze the unique characteristics of SMAP-R, as compared to other GNSS-R missions, and present a calibration method for the SMAP-R signals that enables the standardized use of these signals by the scientific community. There are two key calibration parameters that need to be corrected: The first is the GPS transmitted power and GPS antenna gain at the incidence angle of the measured reflections and the second is the convolution of the SMAP high gain antenna pattern and the glistening zone (Earth surface area from where GPS signals scatter). To account for the GPS transmitter variability, GPS instrument properties—transmitted power and antenna gain—are collocated with information collected from the CYclone Global Navigation Satellite System (CYGNSS) at SMAP’s range of incidence angles (37.3° to 42.7°). To account for the convolutional effect of the SMAP antenna gain, both the scattering area of the reflected GPS signal and the SMAP antenna footprint are mapped on the surface. We account for the size of the scattering area corresponding to each delay and Doppler bin of the SMAP-R measurements based off the SMAP antenna pattern, and normalize according to the size of a measurement representative to one obtained with an omnidirectional antenna. We have validated these calibration methods through an analysis of the coherency of the reflected signal over an extensive area of old sea ice having constant surface characteristics over a period of 3 months. By selecting a vicarious scattering surface with high coherency, we eliminated scene variability and complexity in order to avoid scene dependent aliases in the calibration. The calibration method reduced the dependence on the GPS transmitter power and gain from ~1.08 dB/dB to a residual error of about −0.2 dB/dB. Results also showed that the calibration method eliminates the effect of the high gain antenna filtering effect, thus reducing errors as high as 10 dB on angles furthest from SMAP’s constant 40° incidence angle. Full article
Show Figures

Graphical abstract

12 pages, 7380 KiB  
Letter
Life Signs Detector Using a Drone in Disaster Zones
by Ali Al-Naji, Asanka G. Perera, Saleem Latteef Mohammed and Javaan Chahl
Remote Sens. 2019, 11(20), 2441; https://doi.org/10.3390/rs11202441 - 21 Oct 2019
Cited by 57 | Viewed by 11789
Abstract
In the aftermath of a disaster, such as earthquake, flood, or avalanche, ground search for survivors is usually hampered by unstable surfaces and difficult terrain. Drones now play an important role in these situations, allowing rescuers to locate survivors and allocate resources to [...] Read more.
In the aftermath of a disaster, such as earthquake, flood, or avalanche, ground search for survivors is usually hampered by unstable surfaces and difficult terrain. Drones now play an important role in these situations, allowing rescuers to locate survivors and allocate resources to saving those who can be helped. The aim of this study was to explore the utility of a drone equipped for human life detection with a novel computer vision system. The proposed system uses image sequences captured by a drone camera to remotely detect the cardiopulmonary motion caused by periodic chest movement of survivors. The results of eight human subjects and one mannequin in different poses shows that motion detection on the body surface of the survivors is likely to be useful to detect life signs without any physical contact. The results presented in this study may lead to a new approach to life detection and remote life sensing assessment of survivors. Full article
(This article belongs to the Section Remote Sensing Image Processing)
Show Figures

Graphical abstract

20 pages, 5956 KiB  
Article
Guided Next Best View for 3D Reconstruction of Large Complex Structures
by Randa Almadhoun, Abdullah Abduldayem, Tarek Taha, Lakmal Seneviratne and Yahya Zweiri
Remote Sens. 2019, 11(20), 2440; https://doi.org/10.3390/rs11202440 - 21 Oct 2019
Cited by 17 | Viewed by 3871
Abstract
In this paper, a Next Best View (NBV) approach with a profiling stage and a novel utility function for 3D reconstruction using an Unmanned Aerial Vehicle (UAV) is proposed. The proposed approach performs an initial scan in order to build a rough model [...] Read more.
In this paper, a Next Best View (NBV) approach with a profiling stage and a novel utility function for 3D reconstruction using an Unmanned Aerial Vehicle (UAV) is proposed. The proposed approach performs an initial scan in order to build a rough model of the structure that is later used to improve coverage completeness and reduce flight time. Then, a more thorough NBV process is initiated, utilizing the rough model in order to create a dense 3D reconstruction of the structure of interest. The proposed approach exploits the reflectional symmetry feature if it exists in the initial scan of the structure. The proposed NBV approach is implemented with a novel utility function, which consists of four main components: information theory, model density, traveled distance, and predictive measures based on symmetries in the structure. This system outperforms classic information gain approaches with a higher density, entropy reduction and coverage completeness. Simulated and real experiments were conducted and the results show the effectiveness and applicability of the proposed approach. Full article
Show Figures

Figure 1

22 pages, 4997 KiB  
Article
Crop Growth Condition Assessment at County Scale Based on Heat-Aligned Growth Stages
by Yonglan Qian, Zhengwei Yang, Liping Di, Md. Shahinoor Rahman, Zhenyu Tan, Lei Xue, Feng Gao, Eugene Genong Yu and Xiaoyang Zhang
Remote Sens. 2019, 11(20), 2439; https://doi.org/10.3390/rs11202439 - 21 Oct 2019
Cited by 15 | Viewed by 3632
Abstract
Remotely sensed data have been used in crop condition monitoring for decades. Traditionally, crop growth conditions were assessed by comparing Normalized Difference Vegetation Index (NDVI) of the current year and past years at a pixel scale on the same calendar day. The assumption [...] Read more.
Remotely sensed data have been used in crop condition monitoring for decades. Traditionally, crop growth conditions were assessed by comparing Normalized Difference Vegetation Index (NDVI) of the current year and past years at a pixel scale on the same calendar day. The assumption of this comparison is that the different years’ crops were at the same growing stage on the same day. However, this assumption is often violated in reality. This paper proposes to combine remotely sensed data and meteorological data to assess corn growth conditions at the same growth stages at county level. The proposed approach uses the active accumulated temperature (AAT) computed from Daymet, a daily weather data product, to align different years of NDVI time series at the same growth stages estimated from AATs. The study area covers Carroll County, Iowa. The best index slope extraction (BISE) method and Savitzky–Golay filter are used to filter noise and to reconstruct 11 years of corn growing season NDVI time series from 250 m MODIS daily surface reflectance data product (MOD09GQ). The corn growth stages are identified every year with precise Julian dates from AAT time series. The corn growth conditions are assessed based on the aligned growth stages. The validation of the assessed crop conditions is performed based on National Agricultural Statistics Service (NASS) reports. The study indicates that the crop condition assessment results based on aligned growth stages are consistent with the NASS reported results and they are more reliable than the results based on the same calendar days. The proposed method provides not only crop growth condition information but also crop phenology information. Potentially, it can help improve crop yield prediction since it can effectively measure crop growth changes with NDVI and AAT data. Full article
(This article belongs to the Section Remote Sensing in Agriculture and Vegetation)
Show Figures

Graphical abstract

24 pages, 14042 KiB  
Review
Mitigation of Radio Frequency Interference in Synthetic Aperture Radar Data: Current Status and Future Trends
by Mingliang Tao, Jia Su, Yan Huang and Ling Wang
Remote Sens. 2019, 11(20), 2438; https://doi.org/10.3390/rs11202438 - 21 Oct 2019
Cited by 90 | Viewed by 7812
Abstract
Radio frequency interference (RFI) is a major issue in accurate remote sensing by a synthetic aperture radar (SAR) system, which poses a great hindrance to raw data collection, image formation, and subsequent interpretation process. This paper provides a comprehensive study of the RFI [...] Read more.
Radio frequency interference (RFI) is a major issue in accurate remote sensing by a synthetic aperture radar (SAR) system, which poses a great hindrance to raw data collection, image formation, and subsequent interpretation process. This paper provides a comprehensive study of the RFI mitigation techniques applicable for an SAR system. From the view of spectrum allocation, possible terrestrial and spaceborne RFI sources to SAR system and their geometry are analyzed. Typical signal models for various RFI types are provided, together with many illustrative examples from real measured data. Then, advanced signal processing techniques for removing RFI are reviewed. Advantages and drawbacks of each approach are discussed in terms of their applicability. Discussion on the future trends are provided from the perspective of cognitive, integrated, and adaptive. This review serves as a reference for future work on the implementation of the most suitable RFI mitigation scheme for an air-borne or space-borne SAR system. Full article
(This article belongs to the Special Issue Radio Frequency Interference (RFI) in Microwave Remote Sensing)
Show Figures

Figure 1

17 pages, 16086 KiB  
Article
A New Processing Chain for Real-Time Ground-Based SAR (RT-GBSAR) Deformation Monitoring
by Zheng Wang, Zhenhong Li, Yanxiong Liu, Junhuan Peng, Sichun Long and Jon Mills
Remote Sens. 2019, 11(20), 2437; https://doi.org/10.3390/rs11202437 - 20 Oct 2019
Cited by 11 | Viewed by 3248
Abstract
Due to the high temporal resolution (e.g., 10 s) required, and large data volumes (e.g., 360 images per hour) that result, there remain significant issues in processing continuous ground-based synthetic aperture radar (GBSAR) data. This includes the delay in creating displacement maps, the [...] Read more.
Due to the high temporal resolution (e.g., 10 s) required, and large data volumes (e.g., 360 images per hour) that result, there remain significant issues in processing continuous ground-based synthetic aperture radar (GBSAR) data. This includes the delay in creating displacement maps, the cost of computational memory, and the loss of temporal evolution in the simultaneous processing of all data together. In this paper, a new processing chain for real-time GBSAR (RT-GBSAR) is proposed on the basis of the interferometric SAR small baseline subset concept, whereby GBSAR images are processed unit by unit. The outstanding issues have been resolved by the proposed RT-GBSAR chain with three notable features: (i) low requirement of computational memory; (ii) insights into the temporal evolution of surface movements through temporarily-coherent pixels; and (iii) real-time capability of processing a theoretically infinite number of images. The feasibility of the proposed RT-GBSAR chain is demonstrated through its application to both a fast-changing sand dune and a coastal cliff with submillimeter precision. Full article
Show Figures

Figure 1

17 pages, 6181 KiB  
Letter
Sea Ice Extent Detection in the Bohai Sea Using Sentinel-3 OLCI Data
by Hua Su, Bowen Ji and Yunpeng Wang
Remote Sens. 2019, 11(20), 2436; https://doi.org/10.3390/rs11202436 - 20 Oct 2019
Cited by 16 | Viewed by 3748
Abstract
Sea ice distribution is an important indicator of ice conditions and regional climate change in the Bohai Sea (China). In this study, we monitored the spatiotemporal distribution of the Bohai Sea ice in the winter of 2017–2018 by developing sea ice information indexes [...] Read more.
Sea ice distribution is an important indicator of ice conditions and regional climate change in the Bohai Sea (China). In this study, we monitored the spatiotemporal distribution of the Bohai Sea ice in the winter of 2017–2018 by developing sea ice information indexes using 300 m resolution Sentinel-3 Ocean and Land Color Instrument (OLCI) images. We assessed and validated the index performance using Sentinel-2 MultiSpectral Instrument (MSI) images with higher spatial resolution. The results indicate that the proposed Normalized Difference Sea Ice Information Index (NDSIIIOLCI), which is based on OLCI Bands 20 and 21, can be used to rapidly and effectively detect sea ice but is somewhat affected by the turbidity of the seawater in the southern Bohai Sea. The novel Enhanced Normalized Difference Sea Ice Information Index (ENDSIIIOLCI), which builds on NDSIIIOLCI by also considering OLCI Bands 12 and 16, can monitor sea ice more accurately and effectively than NDSIIIOLCI and suffers less from interference from turbidity. The spatiotemporal evolution of the Bohai Sea ice in the winter of 2017–2018 was successfully monitored by ENDSIIIOLCI. The results show that this sea ice information index based on OLCI data can effectively extract sea ice extent for sediment-laden water and is well suited for monitoring the evolution of Bohai Sea ice in winter. Full article
(This article belongs to the Special Issue Applications of Remote Sensing in Coastal Areas)
Show Figures

Graphical abstract

21 pages, 8716 KiB  
Article
Quantifying Trends of Land Change in Qinghai-Tibet Plateau during 2001–2015
by Chao Wang, Qiong Gao and Mei Yu
Remote Sens. 2019, 11(20), 2435; https://doi.org/10.3390/rs11202435 - 20 Oct 2019
Cited by 44 | Viewed by 3579
Abstract
The Qinghai-Tibet Plateau (QTP) is among the most sensitive ecosystems to changes in global climate and human activities, and quantifying its consequent change in land-cover land-use (LCLU) is vital for assessing the responses and feedbacks of alpine ecosystems to global climate changes. In [...] Read more.
The Qinghai-Tibet Plateau (QTP) is among the most sensitive ecosystems to changes in global climate and human activities, and quantifying its consequent change in land-cover land-use (LCLU) is vital for assessing the responses and feedbacks of alpine ecosystems to global climate changes. In this study, we first classified annual LCLU maps from 2001–2015 in QTP from MODIS satellite images, then analyzed the patterns of regional hotspots with significant land changes across QTP, and finally, associated these trends in land change with climate forcing and human activities. The pattern of land changes suggested that forests and closed shrublands experienced substantial expansions in the southeastern mountainous region during 2001–2015 with the expansion of massive meadow loss. Agricultural land abandonment and the conversion by conservation policies existed in QTP, and the newly-reclaimed agricultural land partially offset the loss with the resulting net change of −5.1%. Although the urban area only expanded 586 km2, mainly at the expense of agricultural land, its rate of change was the largest (41.2%). Surface water exhibited a large expansion of 5866 km2 (10.2%) in the endorheic basins, while mountain glaciers retreated 8894 km2 (−3.4%) mainly in the southern and southeastern QTP. Warming and the implementation of conservation policies might promote the shrub encroachment into grasslands and forest recovery in the southeastern plateau. While increased precipitation might contribute to the expansion of surface water in the endorheic basins, warming melts the glaciers in the south and southeast and complicates the hydrological service in the region. The substantial changes in land-cover reveal the high sensitivity of QTP to changes in climate and human activities. Rational policies for conservation might mitigate the adverse impacts to maintain essential services provided by the important alpine ecosystems. Full article
Show Figures

Graphical abstract

27 pages, 4345 KiB  
Article
Hyperspectral Unmixing with Gaussian Mixture Model and Spatial Group Sparsity
by Qiwen Jin, Yong Ma, Erting Pan, Fan Fan, Jun Huang, Hao Li, Chenhong Sui and Xiaoguang Mei
Remote Sens. 2019, 11(20), 2434; https://doi.org/10.3390/rs11202434 - 20 Oct 2019
Cited by 15 | Viewed by 3155
Abstract
In recent years, endmember variability has received much attention in the field of hyperspectral unmixing. To solve the problem caused by the inaccuracy of the endmember signature, the endmembers are usually modeled to assume followed by a statistical distribution. However, those distribution-based methods [...] Read more.
In recent years, endmember variability has received much attention in the field of hyperspectral unmixing. To solve the problem caused by the inaccuracy of the endmember signature, the endmembers are usually modeled to assume followed by a statistical distribution. However, those distribution-based methods only use the spectral information alone and do not fully exploit the possible local spatial correlation. When the pixels lie on the inhomogeneous region, the abundances of the neighboring pixels will not share the same prior constraints. Thus, in this paper, to achieve better abundance estimation performance, a method based on the Gaussian mixture model (GMM) and spatial group sparsity constraint is proposed. To fully exploit the group structure, we take the superpixel segmentation (SS) as preprocessing to generate the spatial groups. Then, we use GMM to model the endmember distribution, incorporating the spatial group sparsity as a mixed-norm regularization into the objective function. Finally, under the Bayesian framework, the conditional density function leads to a standard maximum a posteriori (MAP) problem, which can be solved using generalized expectation-maximization (GEM). Experiments on simulated and real hyperspectral data demonstrate that the proposed algorithm has higher unmixing precision compared with other state-of-the-art methods. Full article
(This article belongs to the Special Issue Robust Multispectral/Hyperspectral Image Analysis and Classification)
Show Figures

Graphical abstract

21 pages, 3644 KiB  
Article
Assessing Legacy Effects of Wildfires on the Crown Structure of Fire-Tolerant Eucalypt Trees Using Airborne LiDAR Data
by Yogendra K. Karna, Trent D. Penman, Cristina Aponte and Lauren T. Bennett
Remote Sens. 2019, 11(20), 2433; https://doi.org/10.3390/rs11202433 - 20 Oct 2019
Cited by 28 | Viewed by 4429
Abstract
The fire-tolerant eucalypt forests of south eastern Australia are assumed to fully recover from even the most intense fires; however, surprisingly, very few studies have quantitatively assessed that recovery. The accurate assessment of horizontal and vertical attributes of tree crowns after fire is [...] Read more.
The fire-tolerant eucalypt forests of south eastern Australia are assumed to fully recover from even the most intense fires; however, surprisingly, very few studies have quantitatively assessed that recovery. The accurate assessment of horizontal and vertical attributes of tree crowns after fire is essential to understand the fire’s legacy effects on tree growth and on forest structure. In this study, we quantitatively assessed individual tree crowns 8.5 years after a 2009 wildfire that burnt extensive areas of eucalypt forest in temperate Australia. We used airborne LiDAR data validated with field measurements to estimate multiple metrics that quantified the cover, density, and vertical distribution of individual-tree crowns in 51 plots of 0.05 ha in fire-tolerant eucalypt forest across four wildfire severity types (unburnt, low, moderate, high). Significant differences in the field-assessed mean height of fire scarring as a proportion of tree height and in the proportions of trees with epicormic (stem) resprouts were consistent with the gradation in fire severity. Linear mixed-effects models indicated persistent effects of both moderate and high-severity wildfire on tree crown architecture. Trees at high-severity sites had significantly less crown projection area and live crown width as a proportion of total crown width than those at unburnt and low-severity sites. Significant differences in LiDAR -based metrics (crown cover, evenness, leaf area density profiles) indicated that tree crowns at moderate and high-severity sites were comparatively narrow and more evenly distributed down the tree stem. These conical-shaped crowns contrasted sharply with the rounded crowns of trees at unburnt and low-severity sites and likely influenced both tree productivity and the accuracy of biomass allometric equations for nearly a decade after the fire. Our data provide a clear example of the utility of airborne LiDAR data for quantifying the impacts of disturbances at the scale of individual trees. Quantified effects of contrasting fire severities on the structure of resprouter tree crowns provide a strong basis for interpreting post-fire patterns in forest canopies and vegetation profiles in Light Detection and Ranging (LiDAR) and other remotely-sensed data at larger scales. Full article
(This article belongs to the Special Issue Remote Sensing to Assess Canopy Structure and Function)
Show Figures

Graphical abstract

24 pages, 6474 KiB  
Article
Spatial Resolution Matching of Microwave Radiometer Data with Convolutional Neural Network
by Yade Li, Weidong Hu, Shi Chen, Wenlong Zhang, Rui Guo, Jingwen He and Leo Ligthart
Remote Sens. 2019, 11(20), 2432; https://doi.org/10.3390/rs11202432 - 19 Oct 2019
Cited by 13 | Viewed by 3633
Abstract
Passive multi-frequency microwave remote sensing is often plagued with the problems of low- and non-uniform spatial resolution. In order to adaptively enhance and match the spatial resolution, an accommodative spatial resolution matching (ASRM) framework, composed of the flexible degradation model, the deep residual [...] Read more.
Passive multi-frequency microwave remote sensing is often plagued with the problems of low- and non-uniform spatial resolution. In order to adaptively enhance and match the spatial resolution, an accommodative spatial resolution matching (ASRM) framework, composed of the flexible degradation model, the deep residual convolutional neural network (CNN), and the adaptive feature modification (AdaFM) layers, is proposed in this paper. More specifically, a flexible degradation model, based on the imaging process of the microwave radiometer, is firstly proposed to generate suitable datasets for various levels of matching tasks. Secondly, a deep residual CNN is introduced to jointly learn the complicated degradation factors of the data, so that the resolution can be matched up to fixed levels with state of the art quality. Finally, the AdaFM layers are added to the network in order to handle arbitrary and continuous resolution matching problems between a start and an end level. Both the simulated and the microwave radiation imager (MWRI) data from the Fengyun-3C (FY-3C) satellite have been used to demonstrate the validity and the effectiveness of the method. Full article
(This article belongs to the Special Issue Image Super-Resolution in Remote Sensing)
Show Figures

Graphical abstract

19 pages, 9615 KiB  
Article
Upper Ocean Response to Two Sequential Tropical Cyclones over the Northwestern Pacific Ocean
by Jue Ning, Qing Xu, Tao Feng, Han Zhang and Tao Wang
Remote Sens. 2019, 11(20), 2431; https://doi.org/10.3390/rs11202431 - 19 Oct 2019
Cited by 10 | Viewed by 3384
Abstract
The upper ocean thermodynamic and biological responses to two sequential tropical cyclones (TCs) over the Northwestern Pacific Ocean were investigated using multi-satellite datasets, in situ observations and numerical model outputs. During Kalmaegi and Fung-Wong, three distinct cold patches were observed at sea surface. [...] Read more.
The upper ocean thermodynamic and biological responses to two sequential tropical cyclones (TCs) over the Northwestern Pacific Ocean were investigated using multi-satellite datasets, in situ observations and numerical model outputs. During Kalmaegi and Fung-Wong, three distinct cold patches were observed at sea surface. The locations of these cold patches are highly correlated with relatively shallower depth of the 26 °C isotherm and mixed layer depth (MLD) and lower upper ocean heat content. The enhancement of surface chlorophyll a (chl-a) concentration was detected in these three regions as well, mainly due to the TC-induced mixing and upwelling as well as the terrestrial runoff. Moreover, the pre-existing ocean cyclonic eddy (CE) has been found to significantly modulate the magnitude of surface cooling and chl-a increase. With the deepening of the MLD on the right side of TCs, the temperature of the mixed layer decreased and the salinity increased. The sequential TCs had superimposed effects on the upper ocean response. The possible causes of sudden track change in sequential TCs scenario were also explored. Both atmospheric and oceanic conditions play noticeable roles in abrupt northward turning of the subsequent TC Fung-Wong. Full article
(This article belongs to the Special Issue Tropical Cyclones Remote Sensing and Data Assimilation)
Show Figures

Graphical abstract

39 pages, 22117 KiB  
Article
Landsat-8, Advanced Spaceborne Thermal Emission and Reflection Radiometer, and WorldView-3 Multispectral Satellite Imagery for Prospecting Copper-Gold Mineralization in the Northeastern Inglefield Mobile Belt (IMB), Northwest Greenland
by Amin Beiranvand Pour, Tae-Yoon S. Park, Yongcheol Park, Jong Kuk Hong, Aidy M Muslim, Andreas Läufer, Laura Crispini, Biswajeet Pradhan, Basem Zoheir, Omeid Rahmani, Mazlan Hashim and Mohammad Shawkat Hossain
Remote Sens. 2019, 11(20), 2430; https://doi.org/10.3390/rs11202430 - 19 Oct 2019
Cited by 68 | Viewed by 10012
Abstract
Several regions in the High Arctic still lingered poorly explored for a variety of mineralization types because of harsh climate environments and remoteness. Inglefield Land is an ice-free region in northwest Greenland that contains copper-gold mineralization associated with hydrothermal alteration mineral assemblages. In [...] Read more.
Several regions in the High Arctic still lingered poorly explored for a variety of mineralization types because of harsh climate environments and remoteness. Inglefield Land is an ice-free region in northwest Greenland that contains copper-gold mineralization associated with hydrothermal alteration mineral assemblages. In this study, Landsat-8, Advanced Spaceborne Thermal Emission and Reflection Radiometer (ASTER), and WorldView-3 multispectral remote sensing data were used for hydrothermal alteration mapping and mineral prospecting in the Inglefield Land at regional, local, and district scales. Directed principal components analysis (DPCA) technique was applied to map iron oxide/hydroxide, Al/Fe-OH, Mg-Fe-OH minerals, silicification (Si-OH), and SiO2 mineral groups using specialized band ratios of the multispectral datasets. For extracting reference spectra directly from the Landsat-8, ASTER, and WorldView-3 (WV-3) images to generate fraction images of end-member minerals, the automated spectral hourglass (ASH) approach was implemented. Linear spectral unmixing (LSU) algorithm was thereafter used to produce a mineral map of fractional images. Furthermore, adaptive coherence estimator (ACE) algorithm was applied to visible and near-infrared and shortwave infrared (VINR + SWIR) bands of ASTER using laboratory reflectance spectra extracted from the USGS spectral library for verifying the presence of mineral spectral signatures. Results indicate that the boundaries between the Franklinian sedimentary successions and the Etah metamorphic and meta-igneous complex, the orthogneiss in the northeastern part of the Cu-Au mineralization belt adjacent to Dallas Bugt, and the southern part of the Cu-Au mineralization belt nearby Marshall Bugt show high content of iron oxides/hydroxides and Si-OH/SiO2 mineral groups, which warrant high potential for Cu-Au prospecting. A high spatial distribution of hematite/jarosite, chalcedony/opal, and chlorite/epidote/biotite were identified with the documented Cu-Au occurrences in central and southwestern sectors of the Cu-Au mineralization belt. The calculation of confusion matrix and Kappa Coefficient proved appropriate overall accuracy and good rate of agreement for alteration mineral mapping. This investigation accomplished the application of multispectral/multi-sensor satellite imagery as a valuable and economical tool for reconnaissance stages of systematic mineral exploration projects in remote and inaccessible metallogenic provinces around the world, particularly in the High Arctic regions. Full article
Show Figures

Graphical abstract

Previous Issue
Back to TopTop