Abstract
This article determines the most suitable location for an economy-based logistics center. First of all, among all the provinces in Türkiye, 12 provinces with the most significant deficit in the 8 years covering 2013–2021 and in the estimated foreign trade volume of 2025 are determined. Among these 12 provinces, there are also provinces with logistics centers; thus, the reliability of this study is checked with real data. In this study, the criteria for the logistics center are prepared comprehensively, including 7 main criteria and 24 sub-criteria. The importance weight of the criteria is obtained using the AHP technique. The AHP, MARCOS, and TOPSIS methods are used to rank alternative provinces. Even if this study is prepared mainly on the basis of “Economy”, sensitivity analysis is carried out according to all the main criteria. The change in the ranking of the alternatives according to the criterion changes is observed with the AHP, MARCOS, and TOPSIS methods. The methods used gave results consistent with the actual data. Among the methods used in this study, the TOPSIS method is found to be more sensitive to changes in criterion weights through sensitivity analysis. At the end of this study, the Adana and Hatay provinces are suggested for the logistics center by taking into account the sensitivity analysis.
1. Introduction
Logistics has an important place in today’s world [1]. With the development of trade, the impact of logistics services in delivering goods and services to consumers is increasing [2]. Logistics is like the fuel of every economic system [3]. Efficient logistics systems support the competitiveness of cities in terms of economic development [4] and the growth of the local economy [5]. It is common knowledge that logistics centers are a key element of the entire logistics network, connecting and unifying all logistics systems, activities, and processes such as distribution, storage, transportation, consolidation, handling, customs clearance, import, export, transit processes, infrastructure services, insurance, and banking [6].
Logistics centers are structures that are considered both economic and commercial solutions in freight transportation and are distribution centers of products in international and national areas [7]. Logistics centers provide a 7–20% reduction in transportation costs and a 15–30% reduction in transportation and storage of material resources and final products [8]. When all of the logistics centers operated by TCDD, the Turkish logistics sector will gain an additional transportation opportunity of 73.2 million tons and approximately 19 million m2 of container storage and handling area [9]. Figure 1 shows all the logistics centers in Türkiye, including those in the project phase.
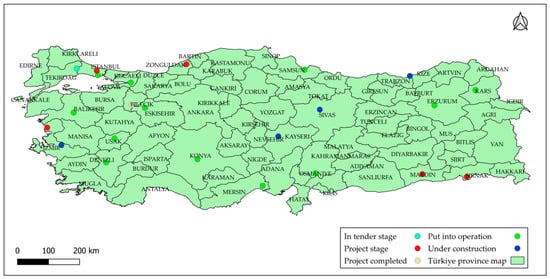
Figure 1.
Türkiye logistic center map.
When all the logistics centers planned to be established in Türkiye become operational, these important centers are expected to contribute USD 40 million to the economy, increase transport volume by 26 million tons [10].
In addition to providing economic contribution, logistics centers also provide sustainable transportation [11]. The use of fossil fuels [12] and logistics activities [13] are among the reasons for the increase in greenhouse gas emissions that cause climate change. According to the European Parliament and the European Environment Agency, transportation accounted for around 25% of total carbon dioxide emissions in the European Union in 2019. It is determined that 71% of this rate belongs to the highway approximately [14]. In Türkiye, the transportation and storage sector had the third highest CO2 emissions in 2019, with a share of around 10%. It is known that around 95% of greenhouse gas emissions in 2022 came from roads [15]. It has been reported that if greenhouse gas emissions continue at their current rate, global warming will exceed 1.5 °C between 2030 and 2052. The 1.5 °C limit is critical for sustainable development. By 2050, emissions need to be reduced to achieve net-zero emissions [16]. A study conducted to examine the impact of logistics centers on greenhouse gases concluded that the total amount of greenhouse gas emissions in provinces with logistics centers increased by 65.69%. In comparison, the amount of greenhouse gas emissions in provinces without logistics centers increased by 78.43% [17]. The change in the ratios shows that the presence of a logistics center in a place can affect the amount of greenhouse gas emissions that may occur. In addition to the launch of logistics centers, various strategies within the scope of freight planning, such as the expansion of ports, transportation, and trans-shipment of containers, are also being developed to ensure sustainability in transportation [18].
This study aims to determine the most suitable logistics center locations in Türkiye and ensure that the right projects are implemented for investments that will strengthen the Turkish economy. For this purpose, provinces with foreign trade deficits in Türkiye between 2013 and 2021 and the estimated year 2025 were selected as alternative provinces for the logistics center, regardless of whether they have any logistics centers. The importance weights of the criteria, which were created by determining 7 main and 24 sub-criteria in line with expert opinion, were determined with AHP. In line with the obtained importance weights of the criteria and the data obtained from the relevant institution for each criterion of the alternative provinces, the AHP, MARCOS, and TOPSIS methods were applied, and a ranking was made for the optimum logistics center site selection. Although this study was mainly based on the main criterion “Economy”, sensitivity analysis was applied by taking into account all the main criteria identified. Changes in criterion weights and alternatives were analyzed using the AHP, MARCOS and TOPSIS methods according to sensitivity analysis. At the end of the study, the most suitable province was suggested by considering all the three methods. The scope of the study is included in the second part of this study, which is prepared to determine the most suitable location for a logistics center in Türkiye. In the third section, the logistics center site selection application is given; in the fourth section, the findings are given; and in the fifth section, the results and recommendations are given. Future studies on this subject are also included in the last section.
2. Study Scope
This study, which was prepared to support the economy in Türkiye, was prepared by taking into account the 81 provinces of Türkiye in line with the economy factor. In this study, where the most suitable province for the logistics center was selected, the stages of the procedure are shown in Figure 2.
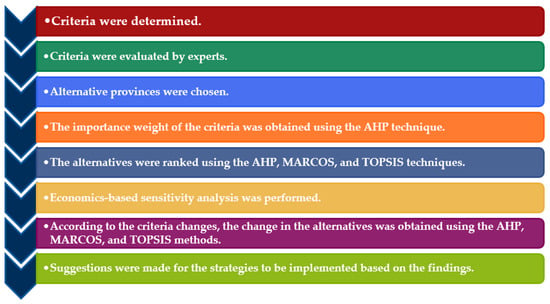
Figure 2.
Flowchart of the study.
As can be seen from Figure 2, this study is carried out through the application of eight stages. The application of logistics center site selection is included in the third part.
3. Logistics Center Site Selection
The application of this study, which was prepared to find the optimum site for the logistics center, consisted of three parts: “determination of criteria”, “determination of alternative provinces”, and “application of the methods used”. As a result of these procedures, the most suitable province was determined.
3.1. Determination of Criteria
The results of the literature research conducted to determine the criteria to be used in the study for logistics center site selection are given in Table 1.

Table 1.
Literature on logistics center site selection criteria.
As a result of the literature review given in Table 1, it is seen that seven main criteria were examined. Sub-criteria for these criteria were also created by writers and the literature and presented to expert opinion. The criteria determined from expert opinion are shown in Figure 3 and Table 2.
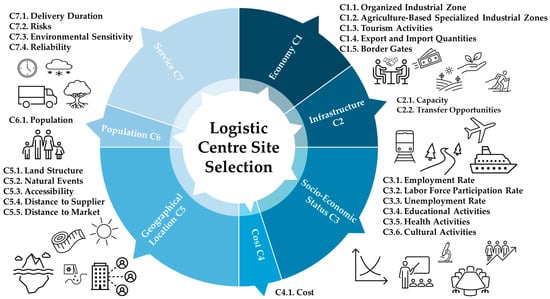
Figure 3.
Criteria identified for the logistics center site selection.
Table 2.
Sub-criteria and data sources for the logistics center.
The type of data and the source of data for the criteria determined to be used in the application of this study are given in Table 2.
The necessary data for each criterion for the alternative provinces determined in the study are obtained from the relevant institutions in Table 2.
3.2. Determination of Alternative Provinces
The development of transportation in a region can meet the needs of the economy and increase the attractiveness of the regional economy. The mechanism between transportation and economic growth forms the basis of the regional economy and development strategy [40]. The increasing importance of freight transportation in economic activities due to increasing globalization [41] and the evaluation of GDP as an index that best evaluates the economic development of a country or a region [40] were effective in determining alternative provinces in this study. Alternative provinces for the optimum logistics center site were selected by taking into account the foreign trade deficit. While determining alternative provinces for the logistics center, the foreign trade deficit was obtained based on the export and import data of the 81 provinces in Türkiye between 2013 and 2021, taking into account the General Trade System. Then, the foreign trade deficit for each province for 2025 was estimated. Provinces that have a deficit of more than USD 100,000,000 for at least 5 years randomly within a total of 9 years, including 8 years of actual (2013–2021 years) and 1 year of estimated data (estimated 2025), were determined as alternative provinces. Alternative provinces are given in Table 3.
Table 3.
Alternative provinces for logistics center site selection.
The representation of the alternative provinces in Table 3 on the map of Türkiye is given in Figure 4 using QGIS [42].
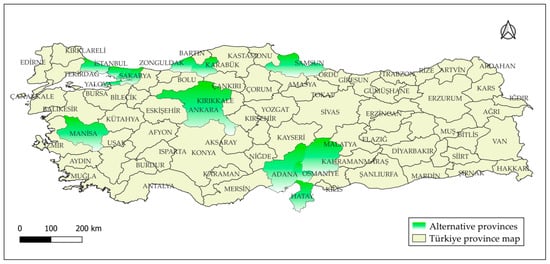
Figure 4.
Alternative provinces for logistics center.
When the alternative provinces given in Table 3 and Figure 4 are examined, it is seen that the provinces of Istanbul, Kahramanmaraş, Kocaeli, and Samsun, where there are existing logistics centers operated by TCDD [9], are among the alternative provinces. The purpose of including these provinces in this study, despite having a logistics center within their borders, is to check the reliability and consistency of the study result by comparing it with the actual data.
3.3. Application of the Methods Used
Multi-criteria decision-making (MCDM) methods are used to determine the most suitable location for the logistics center. MCDM is one of the most accurate methods of decision making and is known as a revolution in this field [43]. Multi-criteria decision-making methods are used to evaluate more than one criterion for the solution of a specific problem and to select the best alternative [44]. In these problems, expert groups provide different weights for the criteria according to the importance of the criterion [45].
MCDM methods are used in health, economics, finance, and many other fields [46]. As in many engineering disciplines, MCDM methods are also applied in the field of transportation and logistics [47]. Since the study is about logistics center site selection, only the studies conducted on the subject are included in this section. In the study prepared to evaluate the service quality of port logistics in Taiwan, the Analytical Hierarchy Process (AHP), DEcision-MAking Trial and Evaluation Laboratory (DEMATEL) and Analytic Network Process (ANP) methods were used among the MCDM methods [48]. In a study conducted in Türkiye, alternative provinces were suggested for logistics center location selection. In the study, the Entropy, MEREC, SD, and SV methods were used to obtain the criterion weights from the MCDM methods, and the TOPSIS, EDAS, WASPAS, MARCOS, MAUT, and ROV methods were used to rank the alternatives [49]. The AHP and WASPAS methods were used in the study to determine the location of the logistics distribution center in the eastern and southern regions of Serbia [50]. In a study conducted to select logistics center locations in Poland, suitable areas were ranked from best to worst using the ELECTRE III/IV methods [51]. Yang and Meng, in their study on the location of the logistics center, ranked the “Social Benefit”, “Economic Benefit”, “Technical Benefit”, and “Environmental Benefit” criteria according to the AHP method [52]. In a study conducted in Türkiye, AHP was used for the logistics center [53]. The AHP method was used to determine the importance weights of the “Cost”, “Item”, “Supply”, and “Order” criteria for logistics operations in distribution centers [54]. To select the best reverse logistics provider with the AHP method, the criteria were determined as “Quality”, “Reverse logistics cost”, “Delivery”, and “Technical ability” and ranked [55]. For emergency logistics center location selection, the “Economic”, “Technical”, “Social”, and “Nature” criteria were ranked according to the AHP method [56]. The AHP and PROMETHEE methods were used in the study on logistics center location selection in Europe [57]. In this study prepared to determine the most suitable location for the logistics center, the AHP, MARCOS, and TOPSIS techniques given in Figure 5, which are among the MCDM methods, were used.
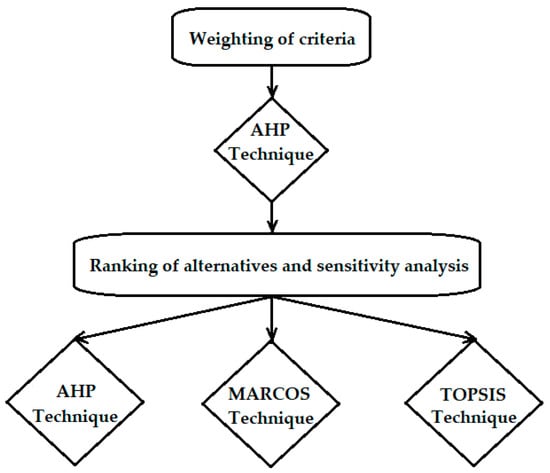
Figure 5.
MCDM methods used in this study.
AHP was used to determine the weights of the criteria, and the AHP, MARCOS, and TOPSIS methods were used to rank the alternatives and apply sensitivity analysis in this study. In the literature, the AHP–TOPSIS methods [58,59,60,61,62] and AHP and MARCOS methods were used [63,64]. The TOPSIS and MARCOS methods [65] were used together. No study was found in which three techniques, AHP–MARCOS–TOPSIS, were used together. Therefore, in this study, the traditional AHP and TOPSIS techniques were used together with the newly emerging MARCOS technique in the literature.
The methods used in this study offer many advantages. One of the biggest advantages of the AHP technique is that it can control inconsistencies [66]. The MARCOS method which establishes a relationship of all alternatives with those references and calculates the degree of utility of each alternative is a new method [67]. MARCOS has some advantages, such as convenience that allows for evaluating a large number of criteria with a consensus solution; although it is a simple solution algorithm, it can be used to solve complex problems, and it is a flexible method [67,68,69]. The TOPSIS method, which is one of the most widely used techniques in the literature, offers many advantages, such as its rationality, easy comprehensibility, and ease of calculation (simplicity) [70]. The reasons for using the AHP–MARCOS–TOPSIS techniques in this study are the advantages of these techniques and the fact that there is no study in the literature where these methods are used together among the MCDM methods. The application stages of the methods used are included in this section.
3.3.1. Application of Analytical Hierarchy Process (AHP)
Analytical Hierarchy Process (AHP), one of the MCDM methods [71], is an effective approach in problem solving [3]. AHP is a technique that determines the superiority of criteria and sub-criteria based on their pairwise comparison. It is a general measurement theory developed by T. L. Saaty in 1971–1975 [72]. Being practical and easy to apply are among the advantages of the AHP method [32]. The biggest advantage of AHP is its ability to control inconsistencies [73]. The stages of the AHP method are listed below [72].
Step 1: The problem is defined.
Step 2: A hierarchical structure is created. The hierarchical structure created is the most critical part of the decision-making process. At the top of this structure are the purpose of the question, the criteria in the next section, and the alternatives in the last section. Figure 6 shows the AHP hierarchy structure [74].
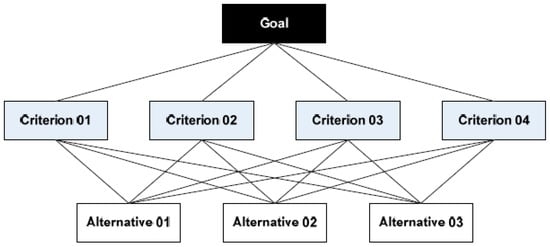
Figure 6.
AHP hierarchy table.
Step 3: In this step, pairwise comparison matrices are created to determine the importance of the criteria and sub-criteria. Pairwise comparisons between criteria are made according to Saaty’s importance scale in Table 4.
Table 4.
Saaty’s importance scale.
Step 4: At this stage, the binary comparison matrices are normalized. The weights of the criteria are calculated according to the binary comparison matrices created. For this calculation, the column sum of the binary comparison matrix is taken and divided by the column sum corresponding to each element of the binary comparison matrix, and the normalized binary comparison matrix is obtained.
Here, aij represents the ith row and jth column element of the comparison matrix; bij represents the ith row and jth column of the normalized matrix.
Step 5: Then, the values of each row are summed and divided by the matrix size to determine the importance values (wi) for each criterion. The formulation is shown below.
Step 6: Since the comparisons are subjective, the consistency ratio (CR) needs to be calculated. It is considered sufficient if the calculated ratio is below 10%. Whether the evaluation is consistent or not is determined according to the consistency ratio. The lower the consistency ratio, the more consistent the evaluation is. A consistency ratio higher than 0.1 indicates that the evaluation is not consistent. In this case, the pairwise comparison matrix is returned, and the process is repeated. After all these processes, the decision matrix is created [75]. In order to calculate the CR value, the largest eigenvector (λmax) value of the pairwise comparison matrix must first be calculated. The formulation is shown in Equations (3) and (4).
Here, i = 1, 2, ..., n and j = 1, 2, ..., n,
[aij]nxm× [wi]nx1 = [di]nx1
The Random Consistency Index (RI) is used to calculate the consistency rate, depending on the number of factors (n) included in the comparison. The RI values determined according to the “n” values are shown in Table 5.
Table 5.
Random Consistency Index values (RI).
The calculation of the CR value according to the obtained inputs is shown in Equation (5).
In the AHP process, the criterion weights are determined by group decision based on surveys conducted with experts on the subject. Accordingly, three approaches can be used. These are experts’ consensus on a specific criterion, voting on options in cases where experts cannot express a common opinion, and geometric mean approaches. In the geometric mean approach, the joint decision of n experts is reduced to a single value using the geometric mean method. Here, the comparison of the i. and j. criteria of the k. expert is expressed as kij. The geometric mean method is one of the most used approaches, as shown in Equation (6) [76].
The decision percentage distribution is obtained by multiplying the decision matrix by the column vector W. Decision options can be prioritized from the highest overall score to the lowest [76].
3.3.2. Application of Measurement of Alternatives and Ranking According to Compromise Solution (MARCOS)
The Measurement of Alternatives and Ranking according to COmpromise Solution (MARCOS) method, which was introduced to the MCDM literature by Stević et al. in 2020 [77], is one of the methods used in ranking decision alternatives. Obtaining the performance rankings of alternatives by defining the relationship between alternatives and reference values (ideal and anti-ideal alternatives) constitutes the main idea of the MARCOS method. Utility functions, which allow the definition of decision preferences, represent the position of an alternative with respect to an ideal and anti-ideal solution. The alternative that is closest to the ideal and at the same time farthest from the anti-ideal reference point is considered the best. The implementation process of MARCOS is given as follows [77]:
Step 1: The decision matrix is created.
Step 2: In this step, the extended initial matrix in (8) is created by adding ideal (AI) and anti-ideal (AAI) solutions to the initial decision matrix. The ideal solution (AI) has the best property, while the anti-ideal solution (AAI) is the worst alternative.
Ideal values (AI) and anti-ideal values (AAI) are found with Formulas (9) and (10).
“B” in the formulas indicates benefit-oriented criteria, and “C” indicates cost-oriented criteria.
Step 3: At this stage, the normalization of the extended decision matrix is performed. The elements in the extended decision matrix should be standardized to take values in the range [0, 1] by the normalization process.
The elements of the normalized decision matrix are calculated using the formulas below for benefit-oriented (B) and cost-oriented (C) criteria.
Step 4: Weighting the extended decision matrix is performed at this stage. At this stage, the importance weights of the criteria are multiplied by the elements of the extended normalized decision matrix, and the matrix consisting of the elements of the weighted normalized decision matrix is obtained.
Step 5: The calculation of the degree of utility () of the alternatives is performed at this stage. The utility degrees of the alternatives according to the ideal () and anti-ideal () solutions are given below, respectively.
The value in the and formulas is the sum of the weighted decision matrices in (18).
Step 6: The calculation and ranking of the utility functions f() of the alternatives are performed in this step. The utility function calculated in this step indicates the compromise solution of the relevant alternative using the ideal and anti-ideal solution values, which are calculated as shown below.
f() is the utility function with respect to the ideal solution, and f() is the utility function for the anti-ideal solution. The calculation of these functions is given below.
Alternatives are ranked according to the utility function values obtained in the f() formula. The alternative with the highest f() value is determined as the best alternative.
3.3.3. Application of Technique for Order Preference by Similarity to Ideal Solution (TOPSIS)
The Technique for Order Preference by Similarity to Ideal Solution (TOPSIS) method, which is one of the MCDM methods, takes into account both the distance to the positive ideal solution and the distance to the negative ideal solution while finding the required proximity to the ideal solution. Preference ranking is made by comparing the distances found between them. The ideal solution is that after all the criteria are met, the preferred alternatives fulfill these criteria at the ideal levels that they should be. If the ideal solution is not feasible or unattainable, then the closest point to the ideal solution has to be chosen. Positive-ideal is the closest solution, while negative-ideal is the farthest [78]. The stages of the TOPSIS method, which is the other method used in the ranking of alternative provinces in this study, are as follows [79].
Step 1: A decision-making matrix is created. The rows of the decision matrix contain the alternatives to show their superiority, and the columns contain the criteria that can be used in the decision-making phase. Matrix A is the initial matrix that is created by experts. An example of a decision matrix is shown as follows:
In the Aij matrix, m is the number of alternatives to be evaluated in the problem under consideration, and n is the number of criteria to be evaluated.
Step 2: The standard decision matrix (normalized matrix) is created. It is necessary to perform the normalization operation of the matrix by taking the square root of the sum of the squares of the points or features belonging to the criteria in the decision matrix.
The elements of the standard decision matrix R are as follows:
Step 3: A weighted standard decision matrix is created. The elements of the normalized decision matrix are weighted according to the importance given to the criteria. Here, the subjective opinions of the decision maker are involved in determining the weights. First, the weight values (wimi, 1, 2, ..., = ) for the evaluation criteria are determined.
Step 4: Positive ideal and negative ideal solution values are obtained. Here, the maximum and minimum values are determined in each column of the weighted matrix.
Step 5: The distance values to the positive ideal and negative ideal solution values are obtained. The distance to the maximum ideal point and that to the minimum point are calculated using the following formula:
Step 6: The relative closeness coefficients to the ideal solution (the relative ranking and score of each alternative) are calculated according to the formula below.
The resulting is used for ranking.
In this study, the weights of the criteria were determined in accordance with the expert opinions according to the applied methods, and the ranking was made in accordance with the data of each criterion for alternative provinces. The data obtained from the relevant institutions in Table 2 were used directly for each alternative in this study.
4. Findings
In this section, the criterion weights obtained according to AHP analysis and the ranking of alternative provinces according to the AHP, MARCOS, and TOPSIS methods are given. Although this study, which was prepared to find the most suitable logistics center site, was prepared on an economic basis, sensitivity analysis was applied by taking into account the seven main criteria determined for the logistics center in the study. In this section, the importance weights of the criteria, the importance weights of the alternatives according to the criteria, the ranking of the alternatives, and the sensitivity analysis findings according to the main criteria are included.
4.1. Importance Weights of Criteria
The hierarchy of this study, prepared to determine the most suitable location for logistics center site selection, is given in Figure 7.
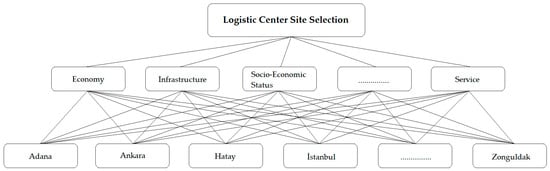
Figure 7.
Hierarchy created for logistics center site selection.
In this study, first, the importance weights of the main criteria and sub-criteria were found separately with the AHP technique. Expert opinions were utilized to obtain the importance of the weights of the criteria. Pairwise comparisons of the criteria were evaluated according to Saaty’s importance scale by academicians working in Civil Engineering, Urban and Regional Planning, and Logistics Departments at universities; relevant people working in the field of logistics at TCDD; and private company owners in the field of logistics. The stages of the AHP technique used to obtain the importance weight of the main criteria are given below. The result of the geometric means of the pairwise comparisons of the main criteria according to expert opinions is given in Table 6.
Table 6.
Pairwise comparison of main criteria.
The normalization of pairwise comparisons and the importance weights of the criteria are shown in Table 7.
Table 7.
Normalization of criteria and importance weights.
After this stage, it is necessary to calculate the eigenvectors and consistency. As a result of these operations, the result of applying Formulas (4) and (5) is shown in Table 8.
Table 8.
Normalization of criteria, importance weights and consistency ratio (CR).
According to Table 9, the weight of the main criterion “Economy” has the highest value among all the main criteria. The importance weights of the main and sub-criteria are shown in Table 9.
Table 9.
Importance weights of main and sub-criteria.
According to Table 9, each main criterion “Economy” has the highest value among all the main criteria.
It is understood from Table 9 that the main criteria “Infrastructure” and “Geographical location” have the same weight. The main criteria, “Socio-Economic Situation”, “Cost”, “Service”, and “Population”, follow in order. The most essential sub-criterion of the “Economy” main criterion is “Organized Industrial Zone”. In the main criterion “Infrastructure”, “Capacity” is found to have a higher weight than the sub-criterion “Transfer Facilities”. Among the sub-criteria of the main criterion “Socio-Economic Status”, the highest sub-criterion is “Labor Force Participation Rate”. The most crucial sub-criterion of the main criterion “Geographical Location” is “Accessibility”. The most critical sub-criterion of the main criterion “Service” is “Environmental sensitivity”.
4.2. Importance Weights of Alternative Provinces According to Criteria
According to the AHP technique, alternative provinces were ranked for all criteria in line with the data obtained from the relevant institution. Thus, the impact of the analyzed criteria on alternative provinces was evaluated separately. The data obtained from the relevant institution for the alternatives belonging to the criteria were created directly or by using different parameters together to be used in the analysis. Table 2 shows the type of data (number, area, etc.) of the criteria for the alternatives. Among the criteria determined, the “Capacity”, “Distance to Supplier”, “Distance to Market”, “Delivery Time”, and “Environmental Sensitivity” criteria were formed by combining multiple parameters, and these parameters were used in the analysis after the following processes.
Capacity: The length of the transportation systems network (road and rail), the number of ports and airports, and the airport area parameters were used.
Distance to supplier: For this criterion, the amount of cargo (kg) and distance (km) were taken into account. Cargo quantity was calculated in kg for each alternative province and for each country that this province imports from. Distance was considered equal to the distance in km between the alternative province and the capital of the importing country.
Distance to market: For this criterion, the amount of cargo (kg) and distance (km) were taken into consideration. Cargo quantity was calculated in kg for each alternative province and for each country that this province imports from. Distance was considered equal to the distance in km between the alternative province and the capital of the importing country.
Delivery time: In this study, the distance (km) between the capitals of all countries to which the alternative province exports and imports, the load carried (kg), and the transportation system used during transportation were taken into account in preparing the data for this criterion for each alternative province. The difference in the speed of transportation systems may also lead to differences in delivery time. For this reason, in the study, air transportation was evaluated with 5 points, road transportation with 4 points, railway transportation with 3 points, and sea transportation with 2 points [80]. Data for this criterion was prepared in line with the distance, load, and speed factors.
Environmental sensitivity: In the preparation of the data for this criterion for each alternative province determined in this study, the distance (km) between the capitals of all countries that the alternative province exports and imports, the freight transported (kg), and the carbon emission value of the transportation system used during transportation were taken into consideration.
The other criteria used in this study were used directly. According to expert opinions, the importance weights of the main and sub-criteria and the alternative provinces’ criteria data were used to rank the alternatives by performing separate operations for each criterion with the AHP technique. The importance weights of the criteria obtained for the alternatives are given in Table 10. The alternatives examined in this study are expressed as A1: Adana; A2: Ankara; A3: Hatay; A4: İstanbul; A5: Kahramanmaraş; A6: Karabük; A7: Kocaeli; A8: Manisa; A9: Osmaniye; A10: Samsun; A11: Yalova; and A12: Zonguldak.
Table 10.
Importance weights of alternative provinces according to the criteria.
The representation of these criteria on the map is given in Figure 8.
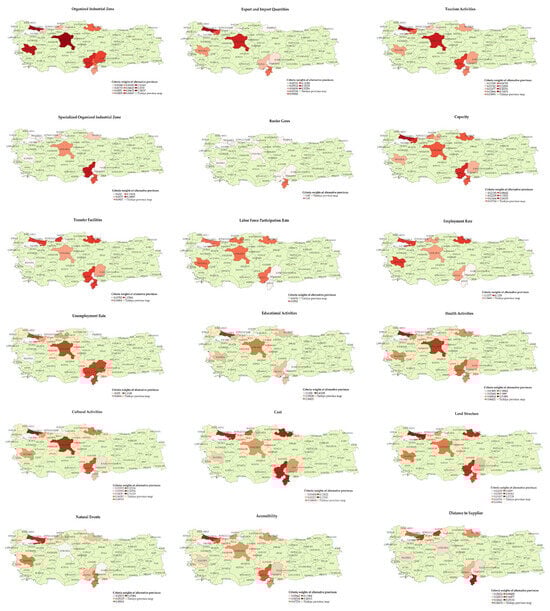
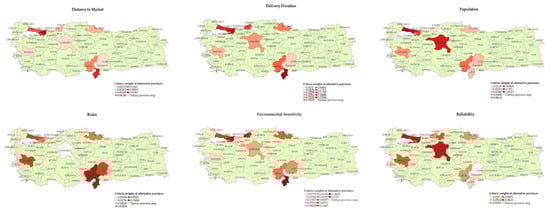
Figure 8.
Map representation of alternative provinces according to the criteria.
4.3. Ranking of Alternatives
In this study, the ranking of alternative provinces for the selection of the most suitable logistics center site was made following the importance weights of the criteria determined by the AHP technique and the data obtained from the relevant institutions belonging to alternative provinces for each criterion. The AHP, MARCOS, and TOPSIS methods were used for ranking. The importance weights of the alternative provinces according to the criteria are shown in Table 11, according to the methods used.
Table 11.
Ranking of alternative provinces according to the AHP, MARCOS, and TOPSIS methods.
When Table 11 is analyzed, it is understood that there are no major differences in the ranking. In each method, Istanbul ranks first for the logistics center, while Karabük ranks last among the alternative provinces. According to the AHP technique, Kocaeli is in second place, Hatay is in third place, and Adana is in fourth place, while in the MARCOS and TOPSIS techniques, Adana is in second place, Kocaeli is in third place, and Hatay is in fourth place.
The visual presented in Figure 9 shows the changes in the ranking of alternative provinces according to the methods used in this study. Figure 9 shows the differences in the results resulting from the procedure more clearly, despite using the same data.
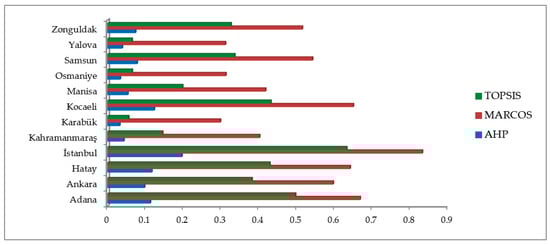
Figure 9.
Logistics center site selection ranking according to techniques.
4.4. Sensitivity Analysis
Sensitivity analysis is conducted to show the effect of the variable under consideration on other variables [81]. There are studies in the literature where changes in the criterion weight according to (−75%, +75%) ranges are observed [82]. Although this study was based on economics, the impact of changes in all main criterion weights within the range (−75% to +75%) on the alternatives was examined. The effect of the change in the main criterion weight on the other criteria was found by using Formulas (32) and (33) [81,83,84].
The reliability and robustness of MCDM methods can be determined by sensitivity analysis [85]. This process was carried out separately for the seven main criteria in this study. Taking into account Formulas (32) and (33), the effect of changes in criterion weights on the alternatives according to the range (−75%, +75%) was investigated separately by applying the AHP, MARCOS and TOPSIS methods. The criterion weights evaluated by experts are shown as “zero change” in the related tables. Changes in the alternatives depending on the criterion weights are given for each criterion as a percentage (Figure 9, Figure 10, Figure 11, Figure 12, Figure 13, Figure 14, Figure 15 and Figure 16) compared with zero change in the range of (−75%, +75%). As a result of these processes, the changes in the alternatives for each criterion were examined in line with the applied criteria, and as a result, the ranking of the alternatives regarding location selection was found.
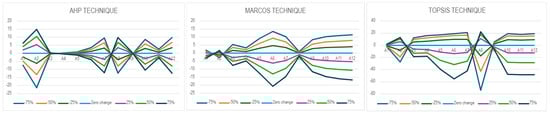
Figure 10.
The effect of the change in “Economy” criterion weights on alternatives according to the AHP, MARCOS, and TOPSIS techniques.
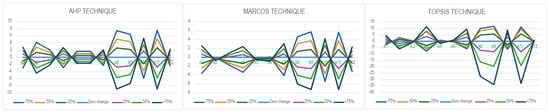
Figure 11.
The effect of the change in “Infrastructure” criterion weights on alternatives according to the AHP, MARCOS, and TOPSIS techniques.
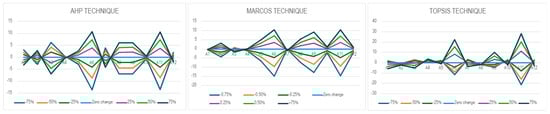
Figure 12.
The effect of the change in “Socio-Economic Status” criterion weights on alternatives according to the AHP, MARCOS, and TOPSIS techniques.
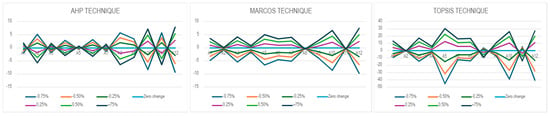
Figure 13.
The effect of the change in “Cost” criterion weights on alternatives according to the AHP, MARCOS, and TOPSIS techniques.
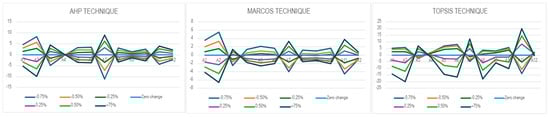
Figure 14.
The effect of the change in “Geographical Location” criterion weights on alternatives according to the AHP, MARCOS, and TOPSIS techniques.
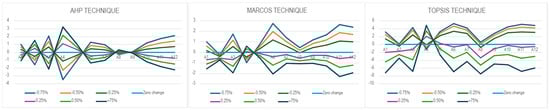
Figure 15.
The effect of the change in “Population” criterion weights on alternatives according to the AHP, MARCOS, and TOPSIS techniques.
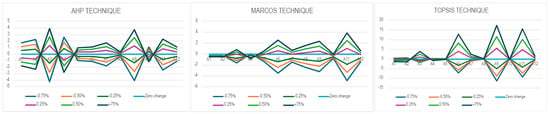
Figure 16.
The effect of the change in “Service” criterion weights on alternatives according to the AHP, MARCOS, and TOPSIS techniques.
According to Formulas (32) and (33), the effect of changes in the weight of the main criterion “Economy” in the range (−75%, +75%) on the other criteria is shown in Table 12.
Table 12.
The effect of the “Economy” main criterion on other criteria.
Taking into account the criterion weights in Table 12, the percentage changes of the alternatives according to the AHP, MARCOS and TOPSIS techniques are shown separately in Figure 10. The percentage changes in the alternatives for the “Economy” criterion are approximately in the ranges of (−21%, 15%) in the AHP technique, (−21%, 14%) in the MARCOS technique, and (−74%, 22%) in the TOPSIS technique.
According to Figure 10, the changes in all criterion weights of the A3 (Hatay), A4 (Istanbul), and A9 (Osmaniye) alternatives in the AHP technique are below 1%. It is understood that these alternatives are not much affected by the changes in the “Economy” criterion weight. The A2 (Ankara) alternative is the alternative where the most change occurred. The change in the Ankara province due to changes in the weight of the main criterion “Economy” is approximately (−21%, +15%). It is understood that Ankara is significantly affected by the change in these criterion weights compared with the AHP technique. In this technique, Manisa has similar characteristics to Ankara. In this technique, the ranking weights of the A1 (Adana), A2 (Ankara), A3 (Hatay), A8 (Manisa), and A9 (Osmaniye) provinces increase depending on the increase in the criterion weight. In the MARCOS technique, depending on the change in the “Economy” criterion weight, the alternative province with the least change among the alternatives is A8 (Manisa) with a change in the range of approximately (−2%, 1%), and the alternative province with the most change is A6 (Karabük) with a change in the range of approximately (−21%, 14%). In this case, according to the MARCOS technique, the Manisa province is least affected by the changes in the “Economy” criterion, while the Karabük province is most affected. In this technique, only the weight of the Ankara province in the ranking increases due to an increase in the weight of the “Economy” criterion. For this reason, according to the MARCOS technique, Ankara can be preferred among the alternative provinces examined for the selection of a location where the “Economy” criterion would be effective. In the TOPSIS technique, the highest change (−74%, 22%) in the criterion weight is in the A8 (Manisa) alternative, while the least change (−2%, 2%) is in the A1 (Adana) alternative. While an increase occurs in the weight of Manisa and Ankara due to the increase in the weight of the criterion, a decrease is achieved in Karabük. As can be seen from all the three methods, A2 (Ankara) can be preferred in studies regarding location selection where the increase in the efficiency of economic activities is taken into consideration.
According to Table 13, when the ranking of alternative provinces is examined according to the changes in the “Economy” criterion weight, Istanbul ranks first in all the three methods used in this study. When the second rank is examined, as the weight of the “Economy” criterion increases, there is a shift from Kocaeli to Adana in the ranking of alternative provinces. When the ranking of the top 5 alternative provinces is examined, all the three methods yield the provinces of “Istanbul”, “Kocaeli”, “Adana”, “Hatay”, “Samsun”, and “Ankara”. Consequently, it can be concluded that Adana is the preferred choice after Istanbul for location selection strategies based on the primary criterion of “Economy”.
Table 13.
Alternative ranking according to sensitivity analysis for the main criterion of “Economy” (AHP–MARCOS–TOPSIS techniques).
According to Formulas (32) and (33), the effect of changes in the weight of the main criterion “Infrastructure” in the range (−75%, +75%) on the other criteria is shown in Table 14.
Table 14.
The effect of the “Infrastructure” main criterion on other criteria.
Figure 11 shows the percentage changes for the alternatives according to the AHP, MARCOS, and TOPSIS techniques, taking into account the “Infrastructure” criterion weights in Table 14. The percentage changes for the alternatives occur approximately in the ranges of (−9%, 8%) for the AHP technique and (−7%, 6%) for the MARCOS technique. The percentage changes for the TOPSIS technique are in the ranges of (−34%, 12%).
According to Figure 11, the least percentage change is seen in the A5 (Kahramanmaraş) and A6 (Karabük) alternatives in the AHP technique, while the highest change is seen in the A11 (Yalova) alternative. As the infrastructure criterion weight increases, the weights of the A1 (Adana), A4 (Istanbul), A7 (Kocaeli), A10 (Samsun), and A12 (Zonguldak) alternatives increase. All of these provinces are port cities. Among the alternatives, only the A3 (Hatay) alternative, which has a coastline, has a decreasing weight due to the increasing weight of the infrastructure criteria. In this case, if a logistics center is planned to be established in Hatay, Hatay’s infrastructure needs to be strengthened. When the changes in alternative provinces due to the change in infrastructure criterion weight are examined in the MARCOS technique, the change in the A2 (Ankara), A5 (Kahramanmaraş), and A6 (Karabük) alternatives is less than 1%. These provinces exhibit more stability when compared with changes in infrastructure criterion weights. The alternatives with the highest change in criterion weights are A9 (Osmaniye) and A11 (Yalova). These provinces are more sensitive to changes in criterion weights, and their ranking weights decrease as the “Infrastructure” criterion weight increases. This suggests a need for infrastructure strengthening. In the ranking of alternative provinces, there is an increase in the weight of the A1 (Adana), A3 (Hatay), A4 (Istanbul), A7 (Kocaeli), A10 (Samsun), and A12 (Zonguldak) provinces due to the increase in the weight of the criteria. Infrastructure is stronger in these provinces. A11 (Yalova) is the alternative province that shows the greatest change due to criterion weight changes in the TOPSIS technique, as in both methods. Alternatives A3 (Hatay) and A6 (Karabük) show changes of less than 1% in criterion weights. Alternatives A5 (Kahramanmaraş) and A12 (Zonguldak) show changes of less than 2% in criterion weights. These provinces are less affected by changes in criterion weightings than other alternatives. Furthermore, these provinces offer rail transportation services. In the TOPSIS technique, the alternative that changes among alternative provinces based on changes in criterion weights is A11 (Yalova), as in the AHP and MARCOS techniques. The alternatives that experience a significant increase in weight due to an increase in the infrastructure criterion weight are A1 (Adana), A4 (Istanbul), A7 (Kocaeli), and A10 (Samsun). As port cities, these provinces also provide rail and air transportation.
According to Table 15, In the ranking of alternatives based on the “Infrastructure” criterion, A4 (Istanbul) ranks first in all the three methods. Kocaeli ranks second, mostly in the AHP method, while A1 (Adana) ranks second in the MARCOS and TOPSIS methods, with all criterion weight changes. When examining changes based on the “Infrastructure” criterion weight, there is no change in the first two ranks, while the third rank is shifted from “Hatay” to “Kocaeli” due to an increase in criterion weight. In this case, it can be concluded that “Kocaeli” is stronger in terms of infrastructure than “Hatay”. According to the changes in infrastructure criteria, the top 5 alternatives for the logistics center in all the three methods are “Istanbul”, “Adana”, “Kocaeli”, “Hatay”, “Ankara”, and “Samsun”. In this case, it would be a good approach to evaluate these alternative provinces in studies where infrastructure is a key consideration in site selection. These alternatives should be considered for studies where infrastructure is the dominant criterion.
Table 15.
Alternative ranking according to sensitivity analysis for the main criterion of “Infrastructure” (AHP–MARCOS–TOPSIS techniques).
According to Formulas (32) and (33), the effect of changes in the weight of the main criterion “Socio-Economic Status” in the range (−75%, +75%) on the other criteria is shown in Table 16.
Table 16.
The effect of the “Socio-Economic Status” main criterion on other criteria.
The percentage changes of the alternatives according to the AHP, MARCOS, and TOPSIS techniques, taking into account the “Socio-Economic Status” criterion weights in Table 16, are shown in Figure 12. Changes occur approximately in the AHP technique (−14%, 11%), in the MARCOS technique (−15%, 10%), and in the TOPSIS technique (−21%, 28%).
According to Figure 12, when alternative provinces are examined in terms of “Socio-Economic Status,” the change in the weights of the provinces A4 (Istanbul) and A10 (Samsun) is less than 1% based on the AHP technique based on the change in criterion weights. The alternative most sensitive to changes in criterion weights is A11 (Yalova) based on the AHP technique. When changes in the “Socio-Economic Status” criterion weights are examined in the MARCOS technique, a change of less than 1% is observed in the ranking weights of the alternatives A1 (Adana) and A7 (Kocaeli). For the alternatives A6 (Karabük), A9 (Osmaniye), and A11 (Yalova), the rankings of alternatives increase due to the change in the criterion weight, reaching a total of 25%. When examining the changes in the TOPSIS technique for this criterion, the least change among the alternatives due to changes in criterion weights belongs to the A5 (Kahramanmaraş) alternative province. The alternative province with the largest change, as found in the other two methods, is A11 (Yalova). In all the three methods, an increase occurs among the alternatives due to an increase in the criterion weight for the A6 (Karabük) province. This result can be taken into account in any location selection plan considering socio-economic status.
When examining changes in socio-economic criterion weights in Table 17, Istanbul ranks first in all the three methods. Kocaeli ranks second in the AHP technique, while Adana is the alternative obtained for all criterion weights in the MARCOS and TOPSIS techniques. The Hatay and Adana provinces may shift in rankings due to changes in criterion weights in the AHP technique, while Kocaeli ranks third in all criterion weights in the MARCOS and TOPSIS techniques. For this criterion, the top 5 rankings based on all weight changes are Istanbul, Kocaeli, Adana, Hatay, and Ankara for all three methods.
Table 17.
Alternative ranking according to sensitivity analysis for the main criterion of “Socio-Economic Status” (AHP–MARCOS–TOPSIS techniques).
According to Formulas (32) and (33), the effect of changes in the weight of the main criterion “Cost” in the range (−75%, +75%) on the other criteria is shown in Table 18.
Table 18.
The effect of the “Cost” main criterion on other criteria.
By drawing attention to the criterion weights in Table 18, the percentage changes of the alternatives according to the AHP, MARCOS, and TOPSIS techniques are shown in Figure 13. When Figure 13 is examined, it is understood that the percentage change in alternatives occurs most often in the TOPSIS technique. Approximately, the change occurs in the range of (−9%, 8%) in the AHP technique, (−10%, 7%) in the MARCOS technique, and (−45%, 30%) in the TOPSIS technique.
When the changes in the weights of alternative provinces based on the “Cost” criterion are examined, a change of less than 1% occurs in the A5 (Kahramanmaraş) alternative according to the AHP technique. The largest change is obtained in the A10 (Samsun) and A12 (Zonguldak) alternatives with this method. Compared with the other alternatives, there is a significant increase due to the increase in the criterion weights in the A10 (Samsun) and A12 (Zonguldak) alternatives. When examined using the MARCOS technique, a change of less than 1% occurs in all criterion weights in the A2 (Ankara), A8 (Manisa), and A11 (Yalova) alternatives. The largest changes are found in the A10 (Samsun) and A12 (Zonguldak) alternatives. As the criterion weights of these provinces increase, significant increases are observed in the alternative weights. In the TOPSIS method, a change of less than 1% occurs in the A2 (Ankara) alternative. The A5 (Kahramanmaraş), A10 (Samsun), and A12 (Zonguldak) alternatives show a much more sensitive change than the other alternatives, and an increase in alternative weights is achieved depending on the increase in the criterion weight.
When changes in cost criterion weights are examined in Table 19, Istanbul ranks first in all the three methods. Kocaeli ranks second for all criterion weights in the AHP technique, while Adana ranks third for the MARCOS and TOPSIS techniques. Hatay ranks third for the AHP technique, and Kocaeli ranks fourth for all criterion weights (except for the −75% criterion weight for the TOPSIS technique), while Adana ranks fourth for all criterion weights in the AHP technique, and Hatay ranks fourth for the MARCOS and TOPSIS techniques. Ankara ranks fifth for the AHP and MARCOS techniques, while Hatay ranks fifth for the TOPSIS technique, with increasing criterion weights.
Table 19.
Alternative ranking according to sensitivity analysis for the main criterion of “Cost” (AHP–MARCOS–TOPSIS techniques).
According to Formulas (32) and (33), the effect of changes in the weight of the main criterion “Geographical Location” in the range (−75%, +75%) on the other criteria is shown in Table 20.
Table 20.
The effect of the “Geographical Location” main criterion on other criteria.
The percentage changes of the alternatives according to the AHP, MARCOS, and TOPSIS techniques, based on the criterion weights in Table 20, are shown separately in Figure 14. When Figure 14 is examined, it is understood that the percentage change in the alternatives occurs most in the TOPSIS technique and least in the MARCOS technique. Changes occurred approximately in the ranges of AHP (−11%, 9%), MARCOS (−7%, 6%), and TOPSIS (−20%, 20%).
When the changes in AHP, MARCOS, and TOPSIS values are examined according to the changes depending on the “Geographical Location” criterion weight, the most obvious distribution of alternatives is found in the TOPSIS technique. In the AHP technique, the A4 (Istanbul) alternative behaves stably when it changes below 1% in all changes in the criterion weight. The A7 (Kocaeli) alternative varies in the widest range depending on the criterion weight. Apart from the A4 (Istanbul) and A7 (Kocaeli) alternatives, the alternatives whose alternative weight increases as the “Geographical Location” criterion weight increases are the A3 (Hatay), A11 (Yalova), and A12 (Zonguldak) provinces. If the MARCOS technique is examined, the alternative A12 (Zonguldak), where the least change due to an increase in the criterion weight is obtained, belongs to the alternative A2 (Ankara), where the most alternatives are obtained. Due to the increase in the criterion weight, there is an increase in the ranking weights of the A3 (Hatay), A7 (Kocaeli), A11 (Yalova), and A12 (Zonguldak) provinces. When the TOPSIS technique is examined, the province with the least change due to an increase in the criterion weight is A12 (Zonguldak), and the province with the most change is A11 (Yalova). As the criterion weights of the A3 (Hatay) and A7 (Kocaeli) alternatives increase, the weight of the alternatives in the ranking also increases.
When the rankings based on the “Geographical Location” criteria are examined in Table 21, Istanbul ranks first in all the three methods. Second place is found in Kocaeli in the AHP technique in all criterion weights, while the Adana province is obtained in the MARCOS and TOPSIS techniques. Third place is taken by the Hatay province in the AHP technique and the Adana province in the MARCOS and TOPSIS techniques. According to the AHP technique, the Adana and Ankara provinces are obtained in fourth and fifth places in all criterion weights, while the Hatay and Ankara provinces are included in the MARCOS technique. In the TOPSIS method, the Hatay province is found in fourth place in general, while fifth place shows the transition from Hatay to Ankara and from Ankara to Samsun with an increase in the weight of the criterion.
Table 21.
Alternative ranking according to sensitivity analysis for the main criterion of “Geographical Location” (AHP–MARCOS–TOPSIS techniques).
According to Formulas (32) and (33), the effect of changes in the weight of the main criterion “Population” in the range (−75%, +75%) on the other criteria is shown in Table 22.
Table 22.
The effect of the “Population” main criterion on other criteria.
Taking into account the “Population” criterion weights in Table 22, the percentage changes of alternatives according to the AHP, MARCOS, and TOPSIS techniques are shown in Figure 15. Approximately, the change occurs in the range of (−3%, 3%) in the AHP technique, (−2%, 3%) in the MARCOS technique, and (−7%, 5%) in the TOPSIS technique.
When the main population criterion is examined according to the AHP technique, A8 (Manisa) and A9 (Osmaniye) behave more stably, showing a change of less than 1%. A4 (Istanbul) exhibits the widest range of changes compared with the other alternatives. As the criterion weight increases, Istanbul’s weight also increases. In the MARCOS technique, the A2 (Ankara), A4 (Istanbul), and A5 (Kahramanmaraş) alternatives show changes of less than 1% depending on the change in criterion weight. In this method, changes in alternatives are closer to each other as a result of changes in the criterion weight. There is a slight increase in the A4 (Istanbul) alternative due to an increase in the criterion weight. For all other alternatives, increasing the criterion weight results in a decrease in the change in alternative weights. In the TOPSIS technique, although the change is more dispersed, the changes between the alternatives are close. This method, as in the MARCOS method, only yields an increase in alternative weights due to an increase in the criterion weight in the A4 (Istanbul) alternative.
When the changes in the population criterion weight are examined in Table 23, Istanbul ranks first in all the three methods. While Kocaeli is in the AHP technique in all criterion weights in second place, Adana province is in the MARCOS and TOPSIS techniques. In third place, there is a transition from Hatay to Adana due to an increase in the criterion weight in the AHP technique, while the Kocaeli province is included in all the criterion weights in the MARCOS and TOPSIS techniques. In fourth place, there is a shift from Adana to Hatay due to an increase in the criterion weight in the AHP technique, while the Hatay province is included in all the criterion weights of MARCOS and TOPSIS techniques. In fifth place, the Ankara province is obtained in all the three methods.
Table 23.
Alternative ranking according to sensitivity analysis for the main criterion of “Population” (AHP–MARCOS–TOPSIS techniques).
According to Formulas (32) and (33), the effect of changes in the weight of the main criterion “Service” in the range (−75%, +75%) on the other criteria is shown in Table 24.
Table 24.
The effect of the “Service” main criterion on other criteria.
The percentage changes of the alternatives according to the AHP, MARCOS, and TOPSIS techniques, taking into account the “Service” criterion weights in Table 24, are shown in Figure 16. Changes occurred approximately in the ranges of AHP (−4%, 4%), MARCOS (−5%, 4%), and TOPSIS (−11%, 15%).
For changes in the “Service” criterion, less than 1% change is achieved in the A8 (Manisa) alternative using the AHP technique. The alternative with the largest change as a result of the change in criterion weight is the A3 (Hatay) alternative. For the A1 (Adana), A2 (Ankara), A4 (Istanbul), and A10 (Samsun) alternatives, the weights in the ranking increase due to the increase in criterion weights. For the MARCOS technique, changes of less than 1% are achieved in all criterion weights for the A1 (Adana), A2 (Ankara), A4 (Istanbul), and A10 (Samsun) alternatives. These provinces are less affected by changes in criterion weights. Even if the change in criterion weights increases in the alternatives, the changes are similar. The largest change is achieved in the A11 (Yalova) alternative. In the TOPSIS technique, changes of less than 1% occur in the A5 (Kahramanmaraş), A8 (Manisa), and A10 (Samsun) alternatives. In the A6 (Karabük) and A11 (Yalova) alternatives, more sensitive changes can occur depending on the criterion weight. Changes of approximately 20% and 25% are achieved, respectively.
When examining changes in “Service” criterion weights in Table 25, Istanbul ranks first in all the three methods. Kocaeli ranks second in all criterion weights in the AHP technique, while Adana ranks second in the MARCOS and TOPSIS techniques. In the AHP technique, there is a shift from Adana to Hatay due to the increase in criterion weights, while Kocaeli ranks third in all criterion weights in the MARCOS and TOPSIS techniques (except for the +75% criterion weight for the TOPSIS technique). Hatay ranks fourth in the TOPSIS technique, while there is a shift from Hatay to Adana due to the increase in criterion weights in the AHP technique, and Hatay ranks fourth in all criterion weights in the MARCOS and TOPSIS techniques (except for the +75% criterion weight for the TOPSIS technique). Kocaeli ranks fifth in the TOPSIS technique, while Ankara ranks fifth in all the three methods.
Table 25.
Alternative ranking according to sensitivity analysis for the main criterion of “Service” (AHP–MARCOS–TOPSIS techniques).
5. Conclusions and Recommendations
Logistics centers positively affect foreign trade [86]. For this reason, the main purpose of this study is to find the most suitable location for an economy-based logistics center. In this context, this study has been prepared in detail in terms of both criteria and method. In method selection, MCDM used in many areas, such as health [87], transportation [88], energy [89], location selection [90], logistics [91], was preferred. The criteria for determining the most suitable site for an economy-based logistics center were determined as 7 main criteria, namely, “Economy”, “Infrastructure”, “Population”, “Cost”, “Socio-Economic Status”, “Geographical Location”, and “Service”, and 24 sub-criteria depending on these main criteria. Alternative provinces were determined according to the 2013–2021 General Trade System export and import data, and the estimated year 2025 was considered among all the provinces. Twelve provinces were selected as alternative provinces in this study. In this study, the criterion weights were found by using the AHP technique. The ranking was made for finding the most suitable location for the logistics center site in line with the found criterion weights. Using data obtained from relevant institutions regarding alternative provinces, alternatives were ranked using the AHP, MARCOS, and TOPSIS methods, and the results were compared. In addition, Although this study was prepared on an economic basis, sensitivity analysis was applied by taking into account the 7 main criteria determined in this study. Sensitivity analysis was applied using these three methods. In the application of sensitivity analysis with the AHP, MARCOS, and TOPSIS methods, the changes in the weight of the 7 criteria and the percentage weights change of the criteria related to it according to the range (−75%, +75%) and the ranking of alternative provinces for all the three methods depending on these changes were examined.
According to the findings of this study, the highest share in the weights of the criteria obtained according to the AHP method was found to belong to the main criterion “Economy”. In the ranking of the most suitable logistics center location using the AHP, MARCOS, and TOPSIS techniques, “Istanbul” was found to be first in all the three methods. In the AHP, MARCOS, and TOPSIS techniques, respectively, “Kocaeli”, “Adana”, and “Adana” ranked second; “Hatay”, “Kocaeli”, and “Kocaeli” ranked third; “Adana”, “Hatay”, and “Hatay” ranked fourth; and “Ankara” ranked fifth for all the methods. Considering all logistics centers in Türkiye, the busiest logistics centers are in the provinces of “Istanbul” and “Kocaeli” [9]. The fact that the “Istanbul” alternative is in first place and the “Kocaeli” alternative is in the first three places in the study results shows the consistency of this study with real data and increases its reliability. For this reason, it is thought that taking this study into consideration in the implementation of strategic plans and site selection studies will yield healthy results.
Since there are logistics centers in the provinces of “Istanbul” and “Kocaeli” among the first five provinces in this study, it is more appropriate to choose the logistics center planned to be established among the provinces of “Adana”, “Hatay”, and “Ankara”. In the analysis results, “Ankara” is ranked fifth, while the “Adana” and “Hatay” provinces are ranked higher than the “Ankara” province. In addition, while there are railway, air, and road transportation systems in the province of Ankara, in addition to these transportation types, maritime transportation is also available in the provinces of Adana and Hatay. The use of maritime transport in international trade is around 90% [32]. For this reason, connecting the logistics center location to the sea can contribute more to international transportation in terms of time and economy. For all these reasons, the most suitable locations for a logistics center are considered to be the provinces of Adana and Hatay. The study results show that the Adana and Hatay provinces ranked second and third, respectively, in both the MARCOS and TOPSIS techniques. When selecting the more suitable of the two alternatives, the distance between the alternatives and the nearest logistics centers can be taken into consideration. In this case, the distances of the nearest logistics centers to the provinces of “Adana” and “Hatay” are “69 km” (Adana–Mersin) and “174 km” (Hatay–Kahramanmaraş), respectively [92,93]. Considering the distance between the alternative province determined for the logistics center and the nearest logistics center, although “Adana” ranks second according to the analysis results in this study, the logistics center for the “Hatay” province is considered to be more greatly needed. In addition, the distance between the nearest logistics center in the region and the planned logistics center is “250 km” between “Adana” and “Kahramanmaraş” and “150 km” between “Hatay” and “Kahramanmaraş”. It is expected that the logistics center of Kahramanmaraş, which does not have a coastline, will contribute to the facilitation of international trade by connecting with the port city of “Hatay”. In addition, great destruction occurred in the province of “Hatay” during the earthquakes of 6 February 2023 [94], which are described as the catastrophe of the century [95]. A logistics center that could be established here could revitalize the city’s economy and increase employment.
In this study, differences were obtained when the changes in the weights and rankings of the alternatives depending on the change in the criterion weights were examined according to the seven main criteria and the three methods applied. Among the three methods, the widest range in changing the criterion weights was obtained in the TOPSIS technique. In this section, “Istanbul” and “Kocaeli” were among the top 5 alternatives. Since there are logistics centers in these provinces, other alternatives were taken into consideration in the recommendations for the logistics center.
As a result of the changes in the “Economy” criterion weight, only the weight of the “Ankara” province increased due to the increase in the criterion weight according to all the three methods applied. This result shows that Ankara was positively affected by economic activities. In this criterion, the province of “Adana” was found suitable in the ranking of the most suitable alternatives for the logistics center. Due to the increase in the weight of the “Infrastructure” criterion, the ranking weights of the provinces “Adana”, “Istanbul”, “Kocaeli”, “Samsun”, and “Zonguldak” increased. All of these provinces are coastal and have airports. They have more developed infrastructure than other alternatives. In the ranking of alternative provinces for infrastructure, the province of “Adana” can be suggested depending on the weighting of this criterion. Due to the increase in the weight of the “Socio-Economic Status” criterion, there is an increase in the ranking weights of the provinces of “Istanbul”, “Karabük”, “Osmaniye”, and “Yalova” in all the three methods. In the ranking of alternative provinces, the province of “Adana” can be suggested depending on the weighting of this criterion. In all the three methods, the ranking weights of the Manisa and Yalova provinces decrease as the weight of the “Cost” criterion increases. In site selection studies, choosing these alternatives has a negative impact compared with all the three methods. Improvement can be achieved by developing infrastructure in these cities. In the ranking of alternative provinces, the provinces of “Adana” and “Hatay” can be recommended as a priority, depending on the weighting of this criterion. Due to the increase in the weight of the “Geographical Location” criterion, the ranking weights of the provinces “Hatay”, “Kocaeli”, and “Yalova” increase in all the three methods. In the ranking of alternative provinces, the “Adana” and “Hatay” provinces can be suggested depending on the weighting of this criterion. Due to the increase in the weight of the “Population” criterion, there is an increase in the ranking weight of the “Istanbul” province in all the three methods. Istanbul is Türkiye’s most populous province. The results obtained from all the three analyses were supported by real data. Considering this criterion, the province of “Adana” is recommended because it ranks higher than the other alternatives in the ranking of alternatives. Due to the increase in the weight of the “Service” criterion, there is a decrease in the ranking weight of the provinces of “Adana”, “Ankara”, and “Istanbul” in all the three methods. Strategies should be determined to improve the “Service” criterion, which includes sub-criteria such as “Environmental Sensitivity” and “Delivery Time”. In this context, practices that will reduce carbon emissions in industrialized and densely populated areas can be prioritized. In this criterion, the province of “Adana” is ranked higher than the other alternatives in the ranking of alternatives.
In summary, the following results are obtained from this study:
- The “Economy” criterion has the highest weight among the main criteria.
- Among the alternatives, the provinces of “Adana” and “Hatay” are suggested for the logistics center. Although the analysis results show the province of Adana being the most common, establishing a logistics center in Hatay may be more preferable than in Adana due to its distance from the nearest logistics centers, the need for economic vitality due to having experienced disasters such as earthquakes.
- Differential changes in criterion weights are observed in sensitivity analysis depending on the applied methods. The TOPSIS technique yielded the highest percentage change. This result suggests that the TOPSIS technique is more sensitive to changes in criterion weights.
- The methods used gave results consistent with the actual data. However, in the sensitivity analysis results applied for each criterion, similarities and differences were obtained in the alternatives. In case of such results, studies on location selection may use more than one method and not rely on a single analysis result. Thus, by using more than one MCDM method in studies on location selection, comparisons can be made and more accurate results can be achieved. Additionally, transportation efficiency can be analyzed by using different techniques such as simulation [96], Data Envelopment Analysis [97] and MCDM [98].
It is known that logistics services also positively affect the green supply chain [99,100]. In this study, it is understood that the “Environmental Sensitivity” criterion, which is among the sub-criteria of the “Service” main criterion, has the highest level of importance and that the studies aimed at ensuring sustainability are supported. In this direction, this study overlaps with the green logistics concept [14], which encourages the reduction in CO2 emissions and the sustainable development of the transportation sector due to environmental concerns caused by transportation. In this context, studies on sustainable transportation are necessary for future generations.
Author Contributions
Conceptualization, S.E., M.K.Ç. and B.P.; methodology, S.E. and B.P.; investigation, S.E. and M.K.Ç. and B.P.; writing—original draft preparation, B.P.; writing—review and editing, S.E. and B.P.; visualization, S.E. and B.P.; supervision, S.E. and M.K.Ç.; funding acquisition, B.P. All authors have read and agreed to the published version of the manuscript.
Funding
This research received no external funding.
Institutional Review Board Statement
Not applicable.
Informed Consent Statement
Not applicable.
Data Availability Statement
The data presented in this study are available on request from the corresponding author.
Conflicts of Interest
The authors declare no conflicts of interest.
References
- Erkan, B. The importance and determinants of logistics performance of selected countries. J. Emerg. Issues Eco. Fin. Bank. 2014, 3, 1237–1254. [Google Scholar]
- Rondinelli, D.; Berry, M. Multimodal transportation, logistics, and the environment: Managing interactions in a global economy. Eur. Manag. J. 2000, 18, 398–410. [Google Scholar]
- Stević, Ž.; Vesković, S.; Vasiljević, M.; Tepić, G. The selection of the logistics center location using AHP method. In Proceedings of the 2nd Logistics International Conference, Serbia, Belgrade, 21–23 May 2015; pp. 86–91. [Google Scholar]
- Viana, M.S.; Delgado, J.P.M. City logistics in historic centers: Multi-criteria evaluation in GIS for city of Salvador (Bahia–Brazil). Case Stud. Trans. Policy 2019, 7, 772–780. [Google Scholar]
- Guerrero, P.; Lucenti, K.; Galarza, S. Trade Logistics and Regional Integration in Latin America and the Caribbean. Asian Dev. Bank Inst. 2010. Available online: https://publications.iadb.org/en/publications/english/viewer/Trade-Logistic-and-Regional-Integration-in-Latin-America--the-Caribbean.pdf (accessed on 14 September 2025).
- Önden, İ.; Acar, A.Z.; Eldemir, F. Evaluation of the logistics center locations using a multi-criteria spatial approach. Transport 2018, 33, 322–334. [Google Scholar] [CrossRef]
- Ors, H.; Mammadov, T. An evaluation on logistic village marketing and the logistic potential of villages in Turkey. Press. Procedia 2016, 2, 269–280. [Google Scholar] [CrossRef][Green Version]
- Gafurov, I.; Panasyuk, M.; Pudovik, E. Interregional logistic center as the growth point of regional economics. Procedia Econ. Fin. 2014, 15, 474–480. [Google Scholar] [CrossRef][Green Version]
- Lojistik Merkezler. Available online: https://static.tcdd.gov.tr/webfiles/userfiles/files/istrapor/2023sektor.pdf (accessed on 14 September 2025).
- Şirin, B. Development of freight villages and evaluation of freight villages in Turkey. Ph.D. Thesis, İstanbul University, Istanbul, Türkiye, 2019. [Google Scholar]
- Gungor, H.C.; Uray, K. The Importance of logistics villages in providing environmental sustainability. J. Innov. Civ. Eng. Tech. 2021, 3, 41–54. [Google Scholar]
- Şerbetci, B. Awareness of teacher candidates about global warming. Master’s Thesis, Hacettepe University, Ankara, Türkiye, 2023. [Google Scholar]
- Gan, M.; Li, D.; Wang, M.; Zhang, G.; Yang, S.; Liu, J. Optimal urban logistics facility location with consideration of truck-related greenhouse gas emissions: A case study of Shenzhen city. Math. Prob. Eng. 2018, 1, 8439582. [Google Scholar] [CrossRef]
- Popescu, C.-A.; Ifrim, A.M.; Silvestru, C.I.; Dobrescu, T.G.; Petcu, C. An evaluation of the environmental impact of logistics activities: A case study of a logistics centre. Sustainability 2024, 16, 4061. [Google Scholar] [CrossRef]
- TUIK. Available online: https://data.tuik.gov.tr/Kategori/GetKategori?p=Ulastirma-ve-Haberlesme-112 (accessed on 5 March 2024).
- IPCC 1,5°C Report. Available online: https://www.birbucukderece.com/bilimsel-kaynaklar/ipcc-1-5-c-raporu (accessed on 30 April 2025).
- Dündar, A.O. Comparative analysis of the greenhouse gas emissions from road transport in the metropolitan cities of Turkey. J. Nat. Hazards Envir. 2021, 7, 318–337. [Google Scholar]
- Baykasoğlu, A.; Subulan, K. A new mathematical programming model for load planning problems in intermodal logistics networks. J. Fac. Eng. Archit. Gazi Univ. 2016, 31, 383–394. [Google Scholar]
- Xie, Y.; Lu, W.; Wang, W.; Quadrifoglio, L. A multimodal location and routing model for hazardous materials transportation. J. Hazard. Mat. 2012, 227, 135–141. [Google Scholar] [CrossRef]
- Wang, M.H.; Lee, H.S.; Chu, C.W. Evaluation of logistic distribution center selection using the fuzzy MCDM approach. Int. J. Innov. Com. Info. Cont. 2010, 6, 5785–5796. [Google Scholar]
- Orjuela-Castro, J.A.; Sepulveda-Garcia, D.A.; Ospina-Contreras, I.D. Effects of using multimodal transport over the logistics performance of the food chain of uchuva. In Proceedings of the Applied Computer Sciences in Engineering: Third Workshop on Engineering Applications, WEA 2016, Bogotá, Colombia, 21–23 September 2016; Revised Selected Papers 3. pp. 165–177. [Google Scholar]
- Zhou, X.; Du, J. Research on optimization of logistics transportation mode based on multimodal transportation. In Proceedings of the Third International Conference on Economic and Business Management, Hohhot, China, 20–22 December 2018; pp. 320–322. [Google Scholar]
- Pamucar, D.S.; Pejcic Tarle, S.; Parezanovic, T. New hybrid multi-criteria decision-making DEMATELMAIRCA model: Sustainable selection of a location for the development of multimodal logistics centre. Eco. Res.-Eko. Ist. 2018, 31, 1641–1665. [Google Scholar]
- Făgărăşan, M.; Cristea, C. Logistics center location: Selection using multicriteria decision making. An. Oradea Uni. Fas. Man. Tech. Eng. 2015, 157–162. [Google Scholar] [CrossRef]
- Bouhana, A.; Fekih, A.; Abed, M.; Chabchoub, H. An integrated case-based reasoning approach for personalized itinerary search in multimodal transportation systems. Transp. Res. Part C Emerg. Tech. 2013, 31, 30–50. [Google Scholar] [CrossRef]
- Smilowitz, K.R.; Daganzo, C.F. Continuum approximation techniques for the design of integrated package distribution systems. Networks 2007, 50, 183–196. [Google Scholar] [CrossRef]
- Cristea, M.; Cristea, C. A multicriteria decision-making approach used for the selection of a logistics center location. Ann. Uni. Oradea 2016, 25, 47–52. [Google Scholar] [CrossRef]
- Muravev, D.; Hu, H.; Zhou, H.; Pamucar, D. Location optimization of CR express international logistics centers. Symmetry 2020, 12, 143. [Google Scholar] [CrossRef]
- Hao, C.; Yue, Y. Optimization on combination of transport routes and modes on dynamic programming for a container multimodal transport system. Procedia Eng. 2016, 137, 382–390. [Google Scholar] [CrossRef]
- Vilko, J.P.; Hallikas, J.M. Risk assessment in multimodal supply chains. Int. J. Prod. Eco. 2012, 140, 586–595. [Google Scholar] [CrossRef]
- de Bok, M.; de Jong, G.; Tavasszy, L.; Van Meijeren, J.; Davydenko, I.; Benjamins, M.; Groot, N.; Miete, O.; Van den Berg, M. A multimodal transport chain choice model for container transport. Trans. Res. Pro. 2012, 31, 99–107. [Google Scholar] [CrossRef]
- Paçacı, B. AHP and GIS aplication for sector based logistic centerlocation selection in Turkey. Doctorate Thesis, Gazi University, Ankara, Türkiye, 2023. [Google Scholar]
- Sürmeli, G.; Kaya, İ.; Erdoğan, M. A fuzzy multi-criteria decision making approach for choosing a logistics center location in Turkey. In Proceedings of the 2015 6th International Conference on Modeling, Simulation, and Applied Optimization (ICMSAO), Istanbul, Turkey, 1–6 May 2015. [Google Scholar]
- Ulutaş, A.; Balo, F.; Sua, L.; Demir, E.; Topal, A.; Jakovljević, V. A new integrated grey MCDM model: Case of warehouse location selection. Facta Uni., Ser. Mech. Eng. 2021, 19, 515–535. [Google Scholar] [CrossRef]
- Afandizadeh, S.; Lashaki, S.A. Technical and economic analysis and evaluation of multimodal terminals with a focus on performance of port (Case Study of Noshahr Port). Helix 2017, 7, 1438–1444. [Google Scholar]
- Bennani, M.; Jawab, F.; Hani, Y.; ElMhamedi, A.; Amegouz, D. A hybrid MCDM for the location of urban distribution centers under uncertainty: A case study of Casablanca, Morocco. Sustainability 2022, 14, 9544. [Google Scholar] [CrossRef]
- Grine, F.Z.; Kamach, O.; Sefiani, N. Developing a Multi-Criteria Decision Making model for identifying factors influencing the location of logistic hubs: A case study of Morocco. In Proceedings of the International Conference on Industrial Engineering and Operations Management, Paris, France, 26–27 July 2018; pp. 32178–33225. [Google Scholar]
- Khongkan, T.; Suthikarnnarunai, N.; Rattanawong, W. A location analysis of the distribution center and logistics hub in the Greater Mekong Subregion. Rev. Integr. Bus. Econ. Res. 2014, 3, 136. [Google Scholar]
- Alam, S.A. Evaluation of the Potential Locations for Logistics Hubs: A case Srudy for a Logistics Company. Master’s Thesis, KTH Royal Institute of Technology, Stockholm, Sweden, 2013. [Google Scholar]
- Ma, Y.; Zhu, J.; Gu, G.; Chen, K. Freight transportation and economic growth for zones: Sustainability and development strategy in China. Sustainability 2020, 12, 10450. [Google Scholar] [CrossRef]
- Kelle, P.; Song, J.; Jin, M.; Schneider, H.; Claypool, C. Evaluation of operational and environmental sustainability tradeoffs in multimodal freight transportation planning. Int. J. Prod. Eco. 2019, 209, 411–420. [Google Scholar] [CrossRef]
- QGIS. Available online: https://qgis.org/ (accessed on 14 September 2025).
- Aruldoss, M.; Lakshmi, M.T.; Venkatesan, V.P. A survey on multi criteria decision making methods and its applications. Am. J. Inf. Syst. 2013, 1, 31–43. [Google Scholar]
- Aydoğan, E.K.; Özmen, M. Two new method for multi criteria stochastic decision making: Smaa-gra and smaa-dematel-gra. J. Fac. Eng. Archit. Gazi Univ. 2015, 30, 624–640. [Google Scholar]
- Taherdoost, H.; Madanchian, M. Multi-criteria decision making (MCDM) methods and concepts. Encyclopedia 2023, 3, 77–87. [Google Scholar] [CrossRef]
- Sahoo, S.K.; Goswami, S.S. A comprehensive review of multiple criteria decision-making (MCDM) methods: Advancements, applications, and future directions. Decis. Making Adv. 2023, 1, 25–48. [Google Scholar] [CrossRef]
- Stojčić, M.; Zavadskas, E.K.; Pamučar, D.; Stević, Ž.; Mardani, A. Application of MCDM methods in sustainability engineering: A literature review 2008–2018. Symmetry 2019, 11, 350. [Google Scholar] [CrossRef]
- Tsai, J.Y.; Ding, J.F.; Liang, G.S.; Ye, K.D. Use of a hybrid MCDM method to evaluate key solutions influencing service quality at a port logistics center in Taiwan. Brodogr. Int. J. Nav. Archit. Ocean. Eng. Res. Dev. 2018, 69, 89–105. [Google Scholar] [CrossRef]
- Şahin, M. Ensemble decision making for logistics center location. Environ. Dev. Sustain. 2024, 26, 30527–30561. [Google Scholar] [CrossRef]
- Mihajlović, J.; Rajković, P.; Petrović, G.; Ćirić, D. The selection of the logistics distribution center location based on MCDM methodology in southern and eastern region in Serbia. Oper. Res. Eng. Sci. Theory Appl. 2019, 2, 72–85. [Google Scholar] [CrossRef]
- Żak, J.; Węgliński, S. The selection of the logistics center location based on MCDM/A methodology. Trans. Res. Pro. 2014, 3, 555–564. [Google Scholar] [CrossRef]
- Yang, Q.; Meng, L. Analytic hierarchy process (AHP) in the application of logistics center location selection process. In Proceedings of the 4th International Conference on Mechanical Materials and Manufacturing Engineering, Wuhan, China, 15–16 October 2016; pp. 120–122. [Google Scholar]
- Paçacı, B.; Erol, S.; Çubuk, K. AHP Application for Logistics Center Location Selection According to Criteria. Bitlis Eren Uni. J. Sci. 2022, 11, 943–952. [Google Scholar]
- Vieira, J.G.V.; Toso, M.R.; da Silva, J.E.A.R.; Ribeiro, P.C.C. An AHP-based framework for logistics operations in distribution centres. Int. J. Prod. Econ. 2017, 187, 246–259. [Google Scholar] [CrossRef]
- Divahar, S.R.; Sudhahar, C. Selection of reverse logistics provider using AHP. Pro. Eng. 2012, 38, 2005–2008. [Google Scholar] [CrossRef][Green Version]
- Hong, L.; Xiaohua, Z. Study on location selection of multi-objective emergency logistics center based on AHP. Procedia Eng. 2011, 15, 2128–2132. [Google Scholar] [CrossRef]
- Fabry, J.; Zapletal, F.; Machacova, T. Location selection for logistics centre using PROMETHEE method. Acta Logist. 2024, 11, 409–419. [Google Scholar] [CrossRef]
- Chakladar, N.D.; Chakraborty, S. A combined TOPSIS-AHP-method-based approach for non-traditional machining processes selection. Proc. Inst. Mech. Eng. Part B J. Eng. Manuf. 2008, 222, 1613–1623. [Google Scholar] [CrossRef]
- Tran, N.T.; Trinh, V.L.; Chung, C.K. An integrated approach of fuzzy AHP-TOPSIS for Multi-Criteria Decision-Making in industrial robot selection. Processes 2024, 12, 1723. [Google Scholar] [CrossRef]
- Samhouri, M.; Abualeenein, M.; Al-Atrash, F. Enhancing supply chain resilience through a Fuzzy AHP and TOPSIS to mitigate transportation disruption. Sustainability 2025, 17, 7375. [Google Scholar] [CrossRef]
- Howari, H.; Parvez, M.; Khan, O.; Alhodaib, A.; Mallah, A.; Yahya, Z. Multi-objective optimization for ranking waste biomass materials based on performance and emission parameters in a pyrolysis process—An AHP–TOPSIS approach. Sustainability 2023, 15, 3690. [Google Scholar] [CrossRef]
- Ccatamayo-Barrios, J.H.; Huamán-Romaní, Y.L.; Cruz Yupanqui, G.M.; Seminario-Morales, M.V.; Flores-Castillo, M.M.; Gutiérrez-Gómez, E.; Maricielo Nole-Jaramillo, J.; de la Cruz-Girón, K.A. Comparative Analysis of AHP and TOPSIS Multi-Criteria Decision-Making Methods for Mining Method Selection. Math. Model. Eng. Prob. 2023, 10, 1665. [Google Scholar] [CrossRef]
- Varghese, B.; Karande, P. AHP-MARCOS, a hybrid model for selecting gears and cutting fluids. Mater. Today Proc. 2022, 52, 1397–1405. [Google Scholar] [CrossRef]
- Karaaslan, A.; Adar, T.; Delice, E.K. Regional evaluation of renewable energy sources in Turkey by new integrated AHP-MARCOS methodology: A real application. Int. J. Sustain. Energy 2022, 41, 103–125. [Google Scholar] [CrossRef]
- Trung, D.D.; Thinh, H.X. A multi-criteria decision-making in turning process using the MAIRCA, EAMR, MARCOS and TOPSIS methods: A comparative study. Adv. Prod. Eng. Manag. 2021, 16, 443–456. [Google Scholar] [CrossRef]
- Ho, W. Integrated analytic hierarchy process and its applications–A literature review. Eur. J. Oper. Res. 2008, 186, 211–228. [Google Scholar] [CrossRef]
- Ayçin, E.; Arsu, T. Evaluation of Countries by Social Development Index: An Application with MEREC and MARCOS. İzmir J. Manag. 2021, 2, 75–88. [Google Scholar] [CrossRef]
- Görçün, Ö.F.; Doğan, G. Mobile crane selection in project logistics operations using Best and Worst Method (BWM) and fuzzy Measurement of Alternatives and Ranking according to COmpromise Solution (MARCOS). Autom. Constr. 2023, 147, 104729. [Google Scholar] [CrossRef]
- Stanković, M.; Stević, Ž.; Das, D.K.; Subotić, M.; Pamučar, D. A new fuzzy MARCOS method for road traffic risk analysis. Mathematics. 2020, 8, 457. [Google Scholar] [CrossRef]
- Özcan, E.C.; Ünlüsoy, S.; Eren, T. Evaluation of the renewable energy investments in Turkey using ANP and TOPSIS methods. Selcuk Univ. J. Eng. Sci. Technol. 2017, 5, 204–219. [Google Scholar]
- Aziz, N.F.; Sorooshian, S.; Mahmud, F. MCDM-AHP method in decision makings. ARPN J. Eng. App. Sci. 2016, 11, 7217–7220. [Google Scholar]
- Saaty, T.L. Decision making—The analytic hierarchy and network processes (AHP/ANP). J. Syst. Sci. Syst. Eng. 2004, 13, 1–35. [Google Scholar] [CrossRef]
- Saaty, T.L.; Tran, L.T. On the invalidity of fuzzifying numerical judgments in the analytic hierarchy process. Math. Comp. Model. 2007, 46, 962–975. [Google Scholar] [CrossRef]
- Project Manage Institue (PMI). Available online: https://www.pmi.org/learning/library/analytic-hierarchy-process-prioritize-projects-6608 (accessed on 10 May 2025).
- Alkan, T.; Durduran, S.S. Analysis of House Selection Process with AHP Based TOPSIS Method. Necmettin Erbakan Univ. J. Sci. Eng. 2020, 2, 12–21. [Google Scholar]
- Arıbaş, M.; Özcan, U. Evaluation of Academic Research Projects Using AHP and TOPSIS Methods. Polytechnic 2016, 19, 163–173. [Google Scholar]
- Stević, Ž.; Pamučar, D.; Puška, A.; Chatterjee, P. Sustainable supplier selection in healthcare industries using a new MCDM method: Measurement of alternatives and ranking according to COmpromise solution (MARCOS). Comput. Ind. Eng. 2020, 140, 106231. [Google Scholar] [CrossRef]
- Özgüven, N. Kriz döneminde küresel perakendeci aktörlerin performanslarinin topsis yöntemi ile değerlendirilmesi. Atatürk Üniversitesi İktisadi ve İdari Bilim. Derg. 2011, 25, 151–162. [Google Scholar]
- Mahmoodzadeh, S.; Shahrabi, J.; Pariazar, M.; Zaeri, M.S. Project selection by using fuzzy AHP and TOPSIS technique. WASET 2007, 30, 333–338. [Google Scholar]
- Kumru, M.; Kumru, P.Y. Analytic hierarchy process application in selecting the mode of transport for a logistics company. Adv. Trans. 2014, 48, 974–999. [Google Scholar] [CrossRef]
- Kabak, M.; Dagdeviren, M. A hybrid approach based on ANP and grey relational analysis for machine selection. Tehnicki Vjesnik-Tech. Gaz. 2017, 24, 109–118. [Google Scholar][Green Version]
- Calka, B.; Siok, K.; Szostak, M.; Bielecka, E.; Kogut, T.; Zhran, M. Improvement of the reliability of urban park location results through the use of fuzzy logic theory. Sustainability 2025, 17, 521. [Google Scholar] [CrossRef]
- Jeong, J.S.; Ramírez-Gómez, Á. Optimizing the location of a biomass plant with a fuzzy-DEcision-MAking Trial and Evaluation Laboratory (F-DEMATEL) and multi-criteria spatial decision assessment for renewable energy management and long-term sustainability. Clean. Pro. 2018, 182, 509–520. [Google Scholar] [CrossRef]
- Selcuk, L. An avalanche hazard model for Bitlis Province, Turkey, using GIS based multicriteria decision analysis. Turk. J. Earth Sci. 2013, 22, 523–535. [Google Scholar] [CrossRef]
- Rashmitha, Y.; Sushma, M.B.; Roy, S. A novel multi-criteria framework for selecting optimal sites for electric vehicle charging stations from a sustainable perspective: Evidence from India. Environ. Dev. Sustain. 2024, 1–27. Available online: https://link.springer.com/article/10.1007/s10668-024-05746-4 (accessed on 14 September 2025). [CrossRef]
- Martí, L.; Puertas, R.; García, L. The importance of the Logistics Performance Index in international trade. Appl. Econ. 2014, 46, 2982–2992. [Google Scholar] [CrossRef]
- Demir, E.; Boz, E. Multi-Criteria Decision-Making Methods in the Selection of Drones to be Used for Drug Distribution in the Healthcare Sector. Necmettin Erbakan Univ. J. Sci. Eng. 2024, 6. [Google Scholar] [CrossRef]
- Ghoushchi, S.J.; Ab Rahman, M.N.; Soltanzadeh, M.; Rafique, M.Z.; Hernadewita Marangalo, F.Y.; Ismail, A.R. Assessing sustainable passenger transportation systems to address climate change based on MCDM methods in an uncertain environment. Sustainability 2023, 15, 3558. [Google Scholar] [CrossRef]
- Shu, X.; Kumar, R.; Saha, R.K.; Dev, N.; Stević, Ž.; Sharma, S.; Rafighi, M. Sustainability assessment of energy storage technologies based on commercialization viability: MCDM model. Sustainability 2023, 15, 4707. [Google Scholar] [CrossRef]
- Paçacı, B.; Çubuk, K.; Erol, S. Fuzzy logic DEMATEL-GIS-TOPSIS approach for determining electric vehicle charging station location. Polytechnic 2025, 1. Available online: https://dergipark.org.tr/en/pub/politeknik/issue/76726/1670115 (accessed on 30 April 2025).
- Arıgün, G.; Beygova, Y.; Diril, L.; Sarman, F.; Ervural, B.Ç. Evaluation of Logistics Village Location Selection in Turkey with a Two-Stage Decision Making Approach. Necmettin Erbakan Univ. J. Sci. Eng. 2024, 599–617. [Google Scholar] [CrossRef]
- Paçacı, B.; Çubuk, M.K.; Badak, S. Logistics Analysis of the Mediterranean Region in Turkey, Architectural Sciences and Recent Approaches and Trends in City and Regional Planning; IKSAD Publications: Golbasi, Turkey, 2023; Chapter 8; pp. 266–299. ISBN 978-625-367-442-7. [Google Scholar]
- General Directorate of Highways. Inter-City Distance Query. Available online: https://www.kgm.gov.tr/sayfalar/kgm/sitetr/uzakliklar/illerarasimesafe.aspx (accessed on 14 September 2025).
- Oliveira, C.S.; Ferreira, M.A.; O’Neill, H. The role of video cameras and emerging technologies in disaster response to increase sustainability of societies: Insights on the 2023 Türkiye–Syria earthquake. Sustainability 2024, 16, 7618. [Google Scholar] [CrossRef]
- Paçacı, B.; Ataseven, H.; Çubuk, K.; Erol, S. Evaluation of emergency preparedness of airports located in Türkiye. Turk. J. Eng. 2025, 9, 560–570. [Google Scholar] [CrossRef]
- Xue, D.; Yao, Y. Cushion packaging design for maritime transportation: A new model based on stress-strain curves. Int. J. Ocean. Syst. Manag. 2025, 2, 19–34. [Google Scholar] [CrossRef]
- Stević, Ž.; Miškić, S.; Vojinović, D.; Huskanović, E.; Stanković, M.; Pamučar, D. Development of a model for evaluating the efficiency of transport companies: PCA–DEA–MCDM model. Axioms 2022, 11, 140. [Google Scholar] [CrossRef]
- Büyüközkan, G.; Mukul, E. Evaluation of smart city logistics solutions with fuzzy MCDM methods. Pamukkale Uni. J. Eng. Sci. 2019, 25, 1033–1040. [Google Scholar] [CrossRef]
- Evangelista, P.; Huge-Brodin, M.; Isaksson, K.; Sweeney, E. The impact of 3PL’s green initiatives on the purchasing of transport and logistics services: An exploratory study. Preparing today for tomorrow’s challenges. In Proceedings of the 20th International Purchasing and Supply Education and Research Association (IPSERA) Conference, Maastricht, The Netherlands, 10–13 April 2011. [Google Scholar]
- Laari, S.; Töyli, J.; Ojala, L. The effect of a competitive strategy and green supply chain management on the financial and environmental performance of logistics service providers. Bus. Strtg. Envir. 2018, 27, 872–883. [Google Scholar] [CrossRef]


Disclaimer/Publisher’s Note: The statements, opinions and data contained in all publications are solely those of the individual author(s) and contributor(s) and not of MDPI and/or the editor(s). MDPI and/or the editor(s) disclaim responsibility for any injury to people or property resulting from any ideas, methods, instructions or products referred to in the content. |
© 2026 by the authors. Licensee MDPI, Basel, Switzerland. This article is an open access article distributed under the terms and conditions of the Creative Commons Attribution (CC BY) license.