Article

Study on the Impact and Mechanism of Cultivated Land Transfer on Grain Green Total Factor Productivity in China


1
School of Economics, Inner Mongolia University of Finance and Economics, Hohhot 010070, China
2
School of Economics and Management, Beijing Forestry University, Beijing 100083, China
3
School of Public Management, Tianjin University of Commerce, Tianjin 300134, China
*
Authors to whom correspondence should be addressed.
Sustainability 2026, 18(1), 441; https://doi.org/10.3390/su18010441
Submission received: 12 May 2025 / Revised: 8 September 2025 / Accepted: 23 September 2025 / Published: 1 January 2026

Abstract

Exploring the impact of cultivated land transfer on grain green total factor productivity is of great significance in promoting efficient and low-carbon utilization of arable land and green and high-quality development of grain production in China. Based on the panel data of 30 provincial-level administrative regions in China from 2006 to 2022, this study employed the EBM model, Tobit model and mediation effect model to measure grain green total factor productivity across provinces, analyze its spatiotemporal evolution trends, and explore the influence and mechanisms of cultivated land transfer on the grain green total factor productivity. The findings revealed that: (i) The overall level of China’s grain green total factor productivity was relatively low, though it exhibited some improvement and regional differences during the sample period, with the highest level in grain-producing areas, followed by production-marketing balance areas, and the lowest level in grain-marketing areas. (ii) Cultivated land transfer had a significant positive impact on grain green total factor productivity. However, an excessively large scale of transferred cultivated land may also inhibit efficiency improvements. (iii) The impact of cultivated land transfer on grain green total factor productivity showed notable regional heterogeneity. In terms of coefficient magnitude, the impact was greater in production-marketing balance areas than in grain-producing areas, while it was not significant in major grain-marketing areas. The effect was stronger in the western region compared to the eastern and central regions. (iv) Cultivated land transfer could improve grain green total factor productivity through large-scale management of cultivated land, large-scale management of services and green production technology. Further analysis indicated a synergistic interaction between scale management and technological progress in green production within these pathways. To enhance grain green total factor productivity, it is essential to implement region-specific policies for cultivated land transfer and scale operations that account for local geographical and agricultural conditions. Specifically, policymakers should facilitate the integration of land scale management with service scale operation, while simultaneously promoting the coordinated advancement of scale operation and green production technology.

1. Introduction

Food security represents a cornerstone of global sustainable development, with the transition toward green agricultural productivity emerging as a critical imperative in contemporary agricultural transformation. The global agricultural sector currently faces a tripartite challenge encompassing climate change impacts, resource constraints, and ecological degradation, with significant heterogeneity observed in national mitigation strategies and their efficacy. The United States’ industrialized agriculture model, characterized by large-scale mechanization and genetically modified crops, has achieved remarkable productivity gains while facing criticism regarding soil health deterioration and biodiversity loss [1]. The European Union’s Farm to Fork Strategy prioritizes organic farming and carbon-neutral practices, though its implementation encounters economic viability challenges within smallholder-dominated structures [2]. Developing economies like India grapple with the dual constraints of traditional farming inefficiencies and acute water stress [3], exemplifying the productivity-sustainability trade-off. As the world’s largest agricultural producer and consumer, China’s pursuit of sustainable intensification must reconcile yield security with environmental protection, addressing systemic challenges of resource use inefficiency and non-point source pollution.
According to statistics, China’s crop fertilizer application rate of 506 kg/ha is 3.6 times that of the United States, and pesticide application intensity of 10.3 kg/ha is 2.8 times that of the European Union. At the same time, the effective utilization rate of fertilizers and pesticides for the main crops in China is only about 40%, which is far from the 60–70% effective utilization rate in developed countries [4]. Excessive and inefficient application of fertilizers and pesticides not only increases the cost of grain production, but also the unused fertilizers and pesticides remain in the soil, water and atmosphere, causing environmental problems such as soil compaction and water eutrophication [5,6]. In addition, the Intergovernmental Panel on Climate Change (IPCC) report pointed out that agriculture is the second largest source of greenhouse gases, and agricultural greenhouse gas emissions account for 13.5% of global anthropogenic emissions. Increased agricultural greenhouse gas emissions will exacerbate global warming [7], which will in turn change the Earth’s climate and precipitation patterns, increase the frequency of extreme weather events [8], cause crop yields to decline, and affect the sustainable development of food production.
To this end, high-quality food development requires a simultaneous increase in the level of food production and the level of green food development, that is, grain green total factor productivity (GGTFP). Total Factor Productivity was first proposed by Solow [9], i.e., Solow’s Residual Value (SRV), which was developed on the basis of the concept of efficiency. This indicator can comprehensively measure the allocation effectiveness of various types of factors and is usually used as the core basis for measuring the comprehensive performance of decision-making subjects in efficiency assessment studies. Grain total factor productivity is a comprehensive indicator that measures the degree of contribution to output growth caused by technological progress, organizational efficiency optimization and management innovation, in addition to the traditional inputs of factors of production such as capital and labor. In this study, the GGTFP is defined as a measure of agricultural production efficiency based on the comprehensive consideration of various factors of production (such as land, labor, capital, etc.) inputs in the process of food production, and at the same time incorporating the resource and environmental constraints (such as fertilizers, pesticides, and environmental pollution emissions). The indicator not only reflects the efficiency of the allocation of traditional factors of production but also emphasizes the improvement of food production efficiency under the premise of ecological sustainability, reflecting the dual objectives of economic growth and environmental protection.
There is a wealth of existing research on GGTFP, mainly focusing on efficiency measurement [10,11] and influencing factors [12]. Existing efficiency measurement methods mainly include stochastic frontier analysis (SFA) [13,14] and data envelopment analysis (DEA) [15]. In comparison, data envelopment analysis does not require dimensionless processing of various indicators, nor does it require setting the function form and parameter values in advance [16], so the measurement results are more objective. In addition, data envelopment analysis is constantly expanding and updating. The existing SBM model [17], super-efficiency Slack Based Measure (SBM) model [18,19] and Epsilon-Based-Measure (EBM) model [20] can effectively solve the problem of “unexpected output” and are mostly used to measure GGTFP. In terms of research on influencing factors, scholars have identified positive drivers such as the level of economic development, environmental regulation, and urbanization [10,12], as well as negative influencing factors such as the degree of disaster and machinery density [21].
As an important carrier of grain production, changes in the management rights of arable land will also have an important impact on the GGTFP. China’s rural arable land transfer system has gone through an important change from ‘separation of two rights’ to ‘separation of three rights’, and has realized the independent transfer of management rights. In this study, the transfer of arable land refers to the transfer of arable land management rights from farmers (contractors) to other business entities (e.g., large-scale farmers, cooperatives, and agribusinesses) by means of subcontracting, leasing, swapping, transferring, and share-holding in accordance with the law, without changing the collective ownership of rural land and the contracting rights of the farming households [22]. According to statistics from the Ministry of Agriculture and Rural Development (MARD), from 2006 to 2022, the total area of arable land under family contract operation in China that has been transferred has grown from 3.703 million hectares to 38.434 million hectares, and the proportion of the area of arable land under family contract operation has also risen from 4.57% to 36.73%. During this period, the Decision of the Central Committee of the Communist Party of China on Several Major Issues Concerning Comprehensively Deepening Reform, adopted in 2013, was a landmark policy document in the history of land transfer in China. The document clarifies the rights and benefits of both parties to land transfer, proposes the establishment of a regulated transfer market, and promotes the openness and transparency of land transfer transactions.
With the increase in the area of arable land flow, the study of arable land flow on agricultural total factor productivity and production environment has triggered the attention of scholars. At present, there is no unanimous conclusion on the impact of arable land flow on GGTFP. Some scholars have found that cropland transfer can significantly promote GGTFP [23], while other studies have pointed out that it may have a negative impact [24] or show a nonlinear relationship [25]. In recent years, as the scale of arable land transfer expands and China’s grain production environment deteriorates, increasing academic attention has focused on examining how arable land transfer affects agricultural ecosystems. Current studies investigating the environmental effects of arable land transfer primarily concentrate on three aspects. The first is how the transfer of cultivated land affects farmers’ pro-environmental practices, including how they use pesticides and fertilizers [26,27] and the adoption of green production technologies [28,29]. The second is how cultivated land transfer affects the single source of pollution in agricultural production, including how it affects carbon emissions [30,31] and non-point source pollution [32,33]. The third is how the transfer of cultivated land affects the macroenvironment of agricultural production, specifically how it affects agricultural sustainable development [34,35].
In summary, most existing studies on the impact of arable land transfer on grain production have separated the aspects of output quantity and quality, unilaterally examining either the efficiency or the environmental effects of grain production. This approach is inconsistent with China’s current high-quality development concept, which emphasizes green and efficient grain production. Moreover, few studies have explored the mediating mechanisms through which arable land transfer affects GGTFP. Based on this, the present study contributes in the following aspects: (i) This paper constructed a GGTFP measurement system that integrated carbon sinks, carbon emissions, and surface source pollution, and employed the EBM model to conduct a more comprehensive efficiency assessment. (ii) It systematically analyzed the direct impact of arable land transfer on GGTFP and its spatial heterogeneity using a panel Tobit model, instrumental variable approach and Difference-in-Differences model. (iii) The study introduced a mediation effect model to thoroughly examine two critical transmission pathways—scale operation and green production technology adoption—along with their synergistic mechanisms.

2. Theory and Hypothesis

(1)
Direct impact
Enhancing GGTFP can effectively reduce carbon emissions from grain production activities, mitigate non-point source pollution in the grain production process, and decrease the consumption of carbon-emitting inputs such as diesel, fertilizers, and pesticides for a given level of output [36]. The transfer of farmland directly affects GGTFP from two perspectives: “people” and “land.” On the one hand, diversification of agricultural operators is facilitated by the transfer of cultivated land from inefficient farmers to efficient operators [37], including family farms, farmers’ cooperatives, and agricultural corporations. This reallocation of arable land resources facilitates intensive and large-scale grain production by high-efficiency operators [38], thereby increasing both grain yield and quality. On the other hand, the phenomena of abandoned farmland can be successfully reduced and the utilization of abandoned farmland can be realized through farmland transfer [39,40]. Expanding the total area under centralized cultivation can enhance both grain output and carbon sequestration in croplands. Furthermore, the transfer of cultivated land supports continuous cultivated land management, encourage plot mergers, and slow down the fragmentation of cultivated land [41]. Continuous farming creates favorable conditions for mechanized operations throughout all stages of grain production, which can improve the efficiency of input factor utilization, reduce the intensity of chemical application, and lessen non-point source pollution. This leads to the proposal of Hypothesis 1a:
Hypothesis 1a. 
The transfer of cultivated land had a positive impact on the GGTFP.
Existing research indicates that the impact of farmland transfers on GGTFP follows a distinct inverted U-shaped pattern. This relationship suggests a critical threshold beyond which further expansion of transfer scale may inhibit both agricultural productivity and environmental improvement [42,43]. Two primary factors may explain this nonlinear effect. First, China’s land transfer market remains underdeveloped, characterized by a low rate of formalized contracts. Although transfers accelerated and became more standardized after 2013—providing a favorable policy context—the overall system still lacks stability and regulation. In the absence of effective long-term constraints, some large-scale operators tend to prioritize short-term profits by adjusting crop structures, intensifying land use, and altering cultivation methods [44]. These practices often lead to increased carbon emissions and non-point source pollution. Second, in less developed regions, agricultural conditions are relatively backward, and productivity remains low. Expanding operational scale under such circumstances often fails to receive adequate resource support, limiting the realization of economies of scale and hindering GGTFP growth. Furthermore, in topographically constrained areas where mechanization is difficult and production relies heavily on manual labor, scaling up may exacerbate labor shortages [45]. This can lead to greater dependence on chemical inputs such as fertilizers and pesticides, further intensifying environmental pollution. Based on these observations, Hypothesis 1b was proposed:
Hypothesis 1b. 
There may be a nonlinear, inverted ‘U’-shaped relationship between a cultivated land and GGTFP.
(2)
The intermediary role of scale operation
Scale operations encompass both cultivated land scale management and service scale operation [46]. These approaches enable specialized production and services, minimize the use of pesticides and fertilizers, optimize resource allocation, and enhance efficiency, all of which contribute to the constant improvement of GGTFP. They represent an important pathway for producing green grains and advancing high-quality development in China. Specifically, the cultivated land scale management model is characterized by significant horizontal integration. Through land transfer and centralized management, it restructures the allocation pattern of agricultural production factors, fully activates the potential effectiveness of labor, capital and other production factors, and aims of the benefits of agricultural production. In contrast, the service scale operation model exhibits typical features of vertical integration. By subdividing property rights and promoting specialization and outsourcing of services within the agricultural production chain, this model drives agriculture toward scale, intensification, specialization, and socialization, thereby achieving a synergistic enhancement of both economic and social benefits.
The following illustrates how cultivated land scale management contributes to GGTFP: First, large-scale arable land operators can enhance GGTFP by improving factor allocation efficiency, reducing redundancy and efficiency loss in inputs, and integrating resources such as land, labor, capital, technology, and knowledge [47]. Second, the transfer of farmed land has led to land concentration and large-scale management, which may effectively decrease the frequency of farmers traveling about, saving farmers’ time and energy [48], and facilitate mechanized operations. Continuous and scaled operations enable more precise and proficient application of fertilizers and pesticides, thereby reducing waste and environmental leakage. Last, large-scale cultivation promotes a more specialized division of labor [47]. It helps differentiate farmers in China into diverse groups with varying resource endowments and accelerates the development of professional grain producers and new agricultural entities that “specialize in grain production.” Specialized grain production can improve ecological environment, enhance cooperation and labor division, deepen technical expertise, and consistently elevate GGTFP. Based on the above, Hypothesis 2a was proposed:
Hypothesis 2a. 
The transfer of cultivated land indirectly improved the GGTFP by expanding the scale of cultivated land management.
The following illustrates how service scale operation supports GGTFP: First, service scale operation integrates diverse resource factors involved in grain production [49]. The introduction of modern elements such as material and human capital has transformed the traditional factor input structure. By replacing the earlier overreliance on low-skilled labor with material capital and high-skilled human capital, it facilitates an optimal reallocation of resources. Second, driven by cost pressures, service scale operation seeks innovative ways to reduce pressure [50]. A key approach is the rational and scientific reduction in chemical inputs, which decreases the volume of pesticides and fertilizers applied while improving their efficiency. This not only maintains grain output and quality, but also lowers operational costs and mitigates environmental pollution in the production process [51]. Additionally, it helps service providers reduce service fees, accumulate reputation capital, and enhance brand image and product competitiveness. Finally, service providers can promote standardized plating of the same crops across scattered plots [52], deliver more specialized services, and reduce both costs and pollutant emissions associated with small-scale, diversified crop production. Through these mechanisms, service scale operation continuously enhances GGTFP. It fosters vertical specialization and division of labor across the grain production chain, while also injecting advanced human, knowledge, material, and other types of capital into activities such as sowing, spraying, fertilizing, irrigation, drainage, transportation, and harvesting. Thus, Hypothesis 2b was proposed:
Hypothesis 2b. 
Cultivated land transfer indirectly improved GGTFP by expanding service scale operation.
(3)
The intermediary role of green production technology
Farmers who transfer their cultivated land can attain more stable management rights and be motivated to adopt green production technologies through the mutually reinforcing processes of land transfer and agricultural land rights confirmation [29]. The adoption of green technologies—such as formula fertilization, water-saving irrigation, straw return, soil testing—can effectively reduce carbon emissions and non-point source pollution in grain production, thereby enhancing GGTFP [53]. Specifically, as arable land is consolidated into large—scale operations, these entities can introduce cost-sharing mechanisms and continuous cropping systems to overcome barriers in accessing green production technologies [24]. This leads to improved agricultural product quality and a steady rise in GGTFP—contrasting with the fragmented management patterns of smallholder farmers. Moreover, although the adoption of new green technologies may involve certain risks, large-scale operators who have invested in cultivated land possess stronger financial capacity to implement advanced low-carbon agricultural technologies. This helps mitigate risks and enables partial substitution of chemical inputs with eco-friendly alternatives. As the same time, expanding cultivated land transfer and scale operations can raise the awareness of green production among large-scale operators [53], spur the adoption of environmentally friendly technologies in neighboring areas, and ultimately reduce carbon emissions across the grain production sector. It further support the synchronous green growth of regional agriculture by enhancing GGTFP [54]. In light of this, Hypothesis 3 was proposed:
Hypothesis 3. 
Cultivated land transfer improved GGTFP by promoting the adoption of green production technologies.
(4)
The synergy between scale operation and green production technology
Studies have shown that the synergy between economies of scale and technological progress can effectively promote the coordinated development of economic and environmental systems [55]. In the mechanism through which cultivated land transfer affects GGTFP, the pathways of scale operation and green production technology are highly interdependence rather than operating in isolation. First, as economic development surpasses the Lewis turning point, the rural demographic dividend diminishes, driving grain production toward specialization [56]. The transfer cultivated land facilitates the concentration of land resources, promoting the large-scale grain cultivation. Such scale operation not only reduces the per-unit cost of adopting green technologies through cost-sharing—enhancing their economic feasibility—but also enables standardized management and precise input application, thereby improving the effectiveness of green technology implementation. Second, progress in green production technologies significantly enhances the divisibility and specialization of grain production [57]. These technologies optimize agricultural processes by reducing resource consumption and environmental pollution, while simultaneously increasing production efficiency. Such advancements promote finer segmentation of production activities and clearer labor division, thereby supporting both land scale management and service scale operation. For example, green technologies like water-saving irrigation and precision fertilization improve the efficiency of land and resource use, enhancing the sustainability of large-scale operations. Furthermore, the diffusion of green technologies has spurred the emergence of specialized service providers, further advancing the development of service scale operation [58]. Therefore, a bidirectional reinforcing interaction exists between scale operation and green technology advancement. Large-scale operations provide an economic and operational foundation for green technology adoption, while green technologies ensure the ecological and economic sustainability of scaled production. Based on this, Hypotheses 4a and 4b were proposed:
Hypothesis 4a. 
The transfer of cultivated land improved the GGTFP through the synergy of land scale operation and green production technology.
Hypothesis 4b. 
The transfer of cultivated land improved the GGTFP through the synergy of service scale operation and green production technology.
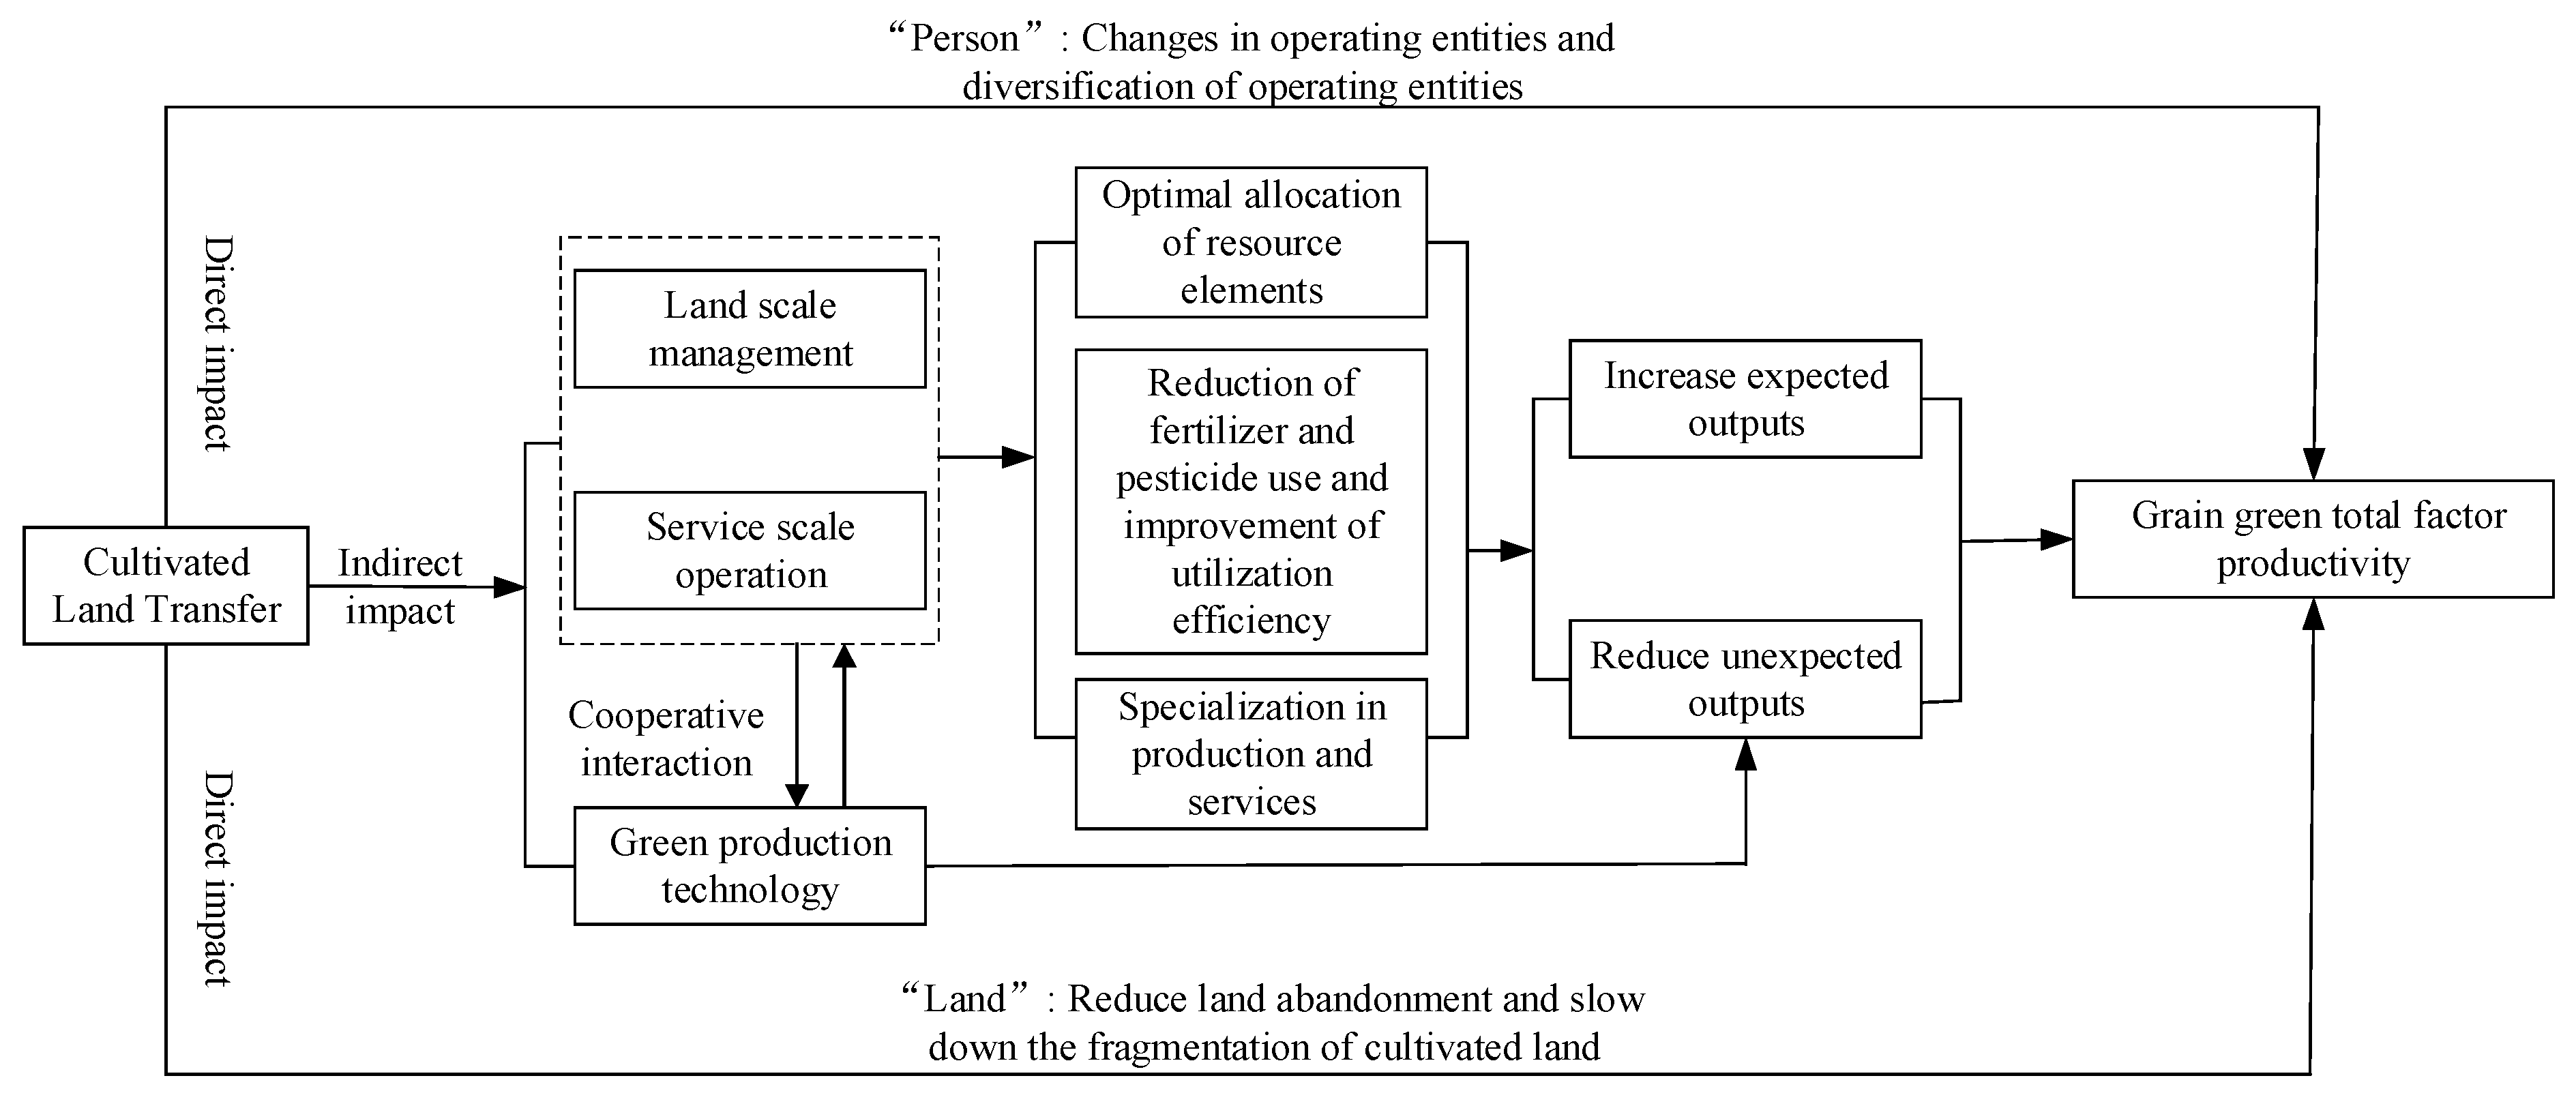
The theoretical framework for analyzing the impact of cultivated land transfer on the GGTFP is shown in Figure 1.

3. Model, Variables and Data Description

3.1. Model Settings

3.1.1. EBM Model

The EBM model was a development of the classic DEA model, which was used to evaluate hybrid efficiency and fully took into account both radial and SBM distance functions [59]. Its advantages included the ability to accurately assess the efficiency level of grain production units, adapt to both radial and non-radial measurements approaches, and comprehensively account for multiple inputs and outputs across diverse decision-making units. Thus, the EBM model was used in this work to determine the GGTFP in 30 provinces using input indicators, expected output indicators, and non-expected output indicators. This was the model formula:
G G T F P = min ε η i m = 1 M ω m s m i m k ϕ + η O A n = 1 N ω n + s n + O A n k + η O B z = 1 Z ω z s z O B z k s . t . I λ + s m = η i k ,   m = 1 ,   2 ,   ,   M O A λ s j + = ϕ o A k ,   n = 1 ,   2 ,   ,   N O B λ + s z = ϕ o B k ,   z = 1 ,   2 ,   ,   Z λ 0 ,   s m ,   s n + ,   s z 0
where I , O A , and O B represented the undesirable outputs, respectively; k was the number of decision-making units; G G T F P ( 0 G G T F P 1 ) represented the optimal efficiency value; s m , s n + , s z and ω m , ω n + , ω z represented the slack variable and weight coefficient, respectively; ε was the planning parameter of the radial part; η 0 , 1 was an important parameter of the non-radial part; ϕ represented the proportion of output expansion.

3.1.2. Tobit Model

The EBM model’s calculation of the GGTFP fell under the estimate of restricted dependent variables because it was between 0 and 1, and deviations might be caused by the classic least squares regression. The maximum likelihood estimation technique was employed by the panel Tobit model to successfully address this issue and guarantee the reliability of the regression findings. The specific model specification was as follows:
G G T F P i t = α 0 + α 1 C T R i t + α 2 X i t + μ i + τ t + ε i t
In the formula, i and t represented the province where the sample was located and the corresponding year, respectively; G G T F P i t was the explained variable, GGTFP; C T R i t represented the area of cultivated land transfer and was the core explanatory variable; X i t was the control variable; α 0 was the intercept term; α 1 was the coefficient of cultivated land transfer; α 2 was the coefficient of the control variable; μ i was the individual fixed effect; τ t was the time fixed effect; ε i t was the random error term.

3.1.3. Mediation Effect Model

To further investigate the mediating effects of scale operation and green production technology in the impact of cultivated land transfer on GGTFP, this study constructs mechanism models for scale operation, green production technology and their synergistic, drawing existing research [57,60].
(1)
Scale management mechanism testing model
Based on the theoretical analysis above, cultivated land transfer may enhance GGTFP through both cultivated land scale management and service scale management. Accordingly, this section constructed a mechanism test model for scale operation, building upon the benchmark model. The specific model was specified as follows:
S C A L E i t = δ 0 + δ 1 C T R i t + δ 2 X i t + μ i + τ t + ε i t
E F F i t = ρ 0 + ρ 1 C T R i t + ρ 2 S C A L E i t + ρ 3 X i t + μ i + τ t + ε i t
(2)
Green production technology mechanism testing model
In addition to scale operation, advances in green production technology may also contribute to improvement of GGTFP. This is primarily manifested through the adoption of environmentally friendly technologies that enhance the efficient use of production resources and reduce pollution. To examine the mediating role of green production technology in the relationship between cultivated land transfer and GGTFP, the following model was constructed:
G P T i t = η 0 + η 1 C T R i t + η 2 X i t + μ i + τ t + ε i t
E F F i t = λ 0 + λ 1 C T R i t + λ 2 G T C i t + λ 3 X i t + μ i + τ t + ε i t
(3)
Synergistic mechanism testing model
If both scale operation and green production technology contribute to enhancing GGTFP, it is pertinent to examine whether a synergistic effect exists between them. To explore this interactive relationship, the following two mechanism test models were constructed:
G P T i t = σ 0 + σ 1 S C A L E i t + σ 2 X i t + μ i + τ t + ε i t
S C A L E i t = β 0 + β G P T i t + β 2 X i t + μ i + τ t + ε i t
In all the above mechanism models, S C A L E i t was scale operation, including farmland scale operation and service scale operation; G P T i t was green production technology; the meanings of other parameters were the same as those in Formula (2).

3.2. Variable Selection

(1) The explained variable was the GGTFP. Based on the theory of sustainable development, this study constructed a theoretical analytical framework integrating the trinity of “resource input–economic growth–environmental effects.” This framework incorporated resource and environmental factors into the economic growth analysis system, expanding the applicability of the traditional total factor productivity analysis framework and providing theoretical support for clarifying the interaction mechanism between grain production economic activities and the resource environment. The innovation of this framework lied in its full consideration of the rationality of resource consumption and the controllability of environmental pollution while pursuing the economic benefits of grain production [36]. In terms of theoretical connotation, GGTFP primarily encompassed three dimensions: first, at the resource level, it emphasized the optimal allocation and efficient utilization of production factors, aiming to reduce resource depletion; second, at the economic level, it sought to maximize output under resource and environmental constraints; and finally, at the environmental level, it focused on the coordinated development of grain production and the ecological environment. Furthermore, it should be noted that the optimization of factor allocation would lead to changes in the structure of economic output and environmental effects, while changed in economic and environmental outputs will in turn influence the adjustment of factor input structures and the transformation of production relations. Through the synergistic interaction and dynamic cycle of these three subsystems, the continuous optimization of the input-output structure in grain production was ultimately achieved, driving the sustained improvement of GGTFP. Land, labor, machinery, fertilizers, pesticides, agricultural films, and water resources were the primary input components for grain production that were chosen for this article based on the research findings of pertinent literature [20,61] and the real circumstances of grain production. However, given that current statistics did not break down the various elements of grain production, this study extracted grain production inputs from agricultural elements by constructing weighting indicators. Specifically, a and b were designated as weighting coefficients, where a represented the ratio of the area sown for grain to the area sown for crops, and b was calculated as the product of the ratio of the value of agricultural output to the total value of agricultural, forestry, animal husbandry and fishery output multiplied by coefficient a.
Desired outputs included grain output and the total carbon sink generated by grain crops. As a crucial economic outcome of agricultural production, grain output directly reflected both the efficiency and scale of grain production, serving as one of the core indicators for evaluating GGTFP. Eco-efficiency was primarily manifested through the carbon sink function of grain crops, which was characterized in this study by the carbon sequestration occurring over the entire life cycle of these crops. The calculation of carbon sequestration took into account not only the fixation of atmospheric carbon dioxide during crop growth but also the potential contribution of grain production to mitigating climate change. GGTFP required consideration of not only economic and ecological benefits but also the negative environmental impacts associated with grain production. Therefore, this study selected two non-desired output indicators from the perspective of pollutant emissions: carbon emissions generated during the grain production process, and non-point surface pollution resulting from the use of chemical fertilizers, pesticides, and agricultural film. The specific measurement indicator system and detailed descriptions were provided in Table 1.
Among these, the carbon sink of grain crops encompassed the carbon absorption throughout their entire life cycle. The following was the precise calculating formula:
C S = i = 1 n C S i = i = 1 n i Q i ( 1 Λ i ) / H i
In the formula, C S represented the total carbon sink of various food crops; C S i represented the carbon absorption of the i -th grain crops; i represented the type of grain crops (including corn, wheat, rice, potatoes and beans); i represented the carbon absorption rate of the i -type food crop; Q i , Λ i , and H i represent the yield, moisture content, and economic coefficient of each type of grain crop, respectively.
Agricultural films, diesel, fertilizers, pesticides, irrigation, tillage, and rice field methane were identified as the seven primary sources contributing directly or indirectly to carbon emissions during the grain production process [62]. The formula for calculating carbon emissions was as follows:
C E = i = 1 n c e i × π i
In the formula, C E represented the total carbon emissions from grain crop production; ce i represented the carbon emissions of various carbon sources; π i represented the emission coefficient of various carbon sources. The carbon emission coefficients were from Oak Ridge National Laboratory (ORNL), Intergovernmental Panel on Climate Change (IPCC), and Institute of Agriculture and Ecological Resources (IREEA) of Nanjing Agricultural University.
Agricultural model residues, pesticide losses, and fertilizer nitrogen and phosphorus loss were the main non-point sources of grain contamination. The nitrogen and phosphorus pollution intensity produced by nitrogen fertilizer, phosphorus fertilizer, and compound fertilizer (the ratio of nitrogen, phosphorus, and potassium nutrients was 1:1:1) was one of the fertilizer non-point source pollutants. The pollution coefficients for nitrogen fertilizer were 1.00, 0, and 0.33, respectively, while those for phosphorus fertilizer were 0, 0.44, and 0.15 [20],. In accordance with existing research [63], the loss rates for fertilizer, pesticide, and agricultural film residue were set at 10%, 50%, and 65%, respectively.
(2) The core explanatory variable was the area of cultivated land transfer. According to previous studies [30], the total area of cultivated land that households in each province contracted each year served as a proxy for the degree of cultivated land transfer. This included land transferred to farmers, specialized cooperatives, agribusinesses, and other new agricultural entities. The transferred area could occur through various forms such as leasing (subcontracting), transfer, exchange, shareholder cooperation, and other means.
(3) The mediating variables included scale operation and green production technology. Scale operation comprised both cultivated land scale management and service scale operation. Drawing on previous studies [30,46], cultivated land scale management was measured as the ratio of the total sown area of crops to the number of agricultural workers in each province. Scale operation was represented by the ratio of the output value of agricultural services to the number of agricultural workers. Green production technology was proxied by the total number of agricultural green patent applications, which was logarithmically transformed in accordance with established methodologies [64]. Although both patent applications and grants could reflect regional technological progress, patent applications are considered a more timely and accurately indicator of current technological activity levels compared to patent grants. The primary rationale is that patent applications more directly capture the vitality of innovation efforts and provide a more responsive measure of ongoing research and development dynamics. In contrast, patent grants are influenced by external factors such as examination timelines and authorization criteria, introducing delays and uncertainties. This is especially relevant in the field of agricultural green technology, where innovation tends to be foresight-driven and application-oriented. Thus, the number of green patent applications offers a more sensitive reflection of regional investments and achievements in green agricultural technology R&D.
(4) Drawing on the research of Ji et al. (2023) [30], the instrumental variable was constructed by multiplying the proportion of households in each province that adopted the household contract responsibility system in 1983 by the percentage of cultivated land transferred to households under contract in each province during each year. The share of the household contract responsibility system in 1983 was a historical variable that exhibited strong exogeneity relative to GGTFP during the sample period. Furthermore, the progression of the household contract responsibility system’s implementation in 1983 reflected the prevailing land policy orientation at that time, which subsequently influenced contemporary arable land transfer policy reforms. Unlike the panel data used in this study, the 1983 adoption rate of the household contract responsibility system is cross-sectional in nature. To adapt this measure into an instrumental variable suitable for panel data analysis, it was multiplied by the annual transfer ratio of household-contracted cultivated land in each province.
(5) To better explain the impact of cultivated land transfer on GGTFP, drawing on relevant research [25,30,46], selected the following control variables: the proportion of affected area, multiple cropping index, agricultural machinery density, effective irrigation rate, agricultural planting structure, regional economic development level, and the level of agricultural openness.
Specifically, the proportion of affected areas and the multiple cropping index reflected the natural resource endowments of a region. Grain production was highly dependent on climatic conditions, and natural disasters can dampen farmers’ incentives for grain cultivation and reduced output. An increase in the replanting index implied more intensive use of arable land, which raised the demand for material inputs such as fertilizers and machinery, exacerbated non-point source pollution in grain production, and may consequently lower GGTFP. Agricultural machinery density served as an indicator of agricultural modernization. The substitution of machinery for manual labor in activities such as plowing, sowing, and harvesting became increasingly common in China’s grain production. While this mechanization enhanced efficiency, it also contributed to higher carbon emissions during production processes. The effective irrigation rate was a key measure of regional agricultural water infrastructure. Regions with well-developed irrigation systems were better able to meet grain production needs, mitigate the effects of droughts and natural disasters, and improve production efficiency. However, inefficient irrigation practices can also lead to water waste. The agricultural planting structure reflected the degree of regional agricultural specialization. A higher proportion of land devoted to grain cultivation indicated greater material and labor inputs into grain production, which potentially enhanced efficiency. At the same time, expanded planting areas can increase the use of agricultural chemicals, potentially worsening environmental pollution if utilization efficiency remains low. Economic development level promoted innovation in green agricultural technology. GDP per capita was a commonly used indicator of regional economic development, reflecting the economic scale, production efficiency and living standards of a region. Agricultural openness significantly influenced regional agricultural production by facilitating technology transfer, knowledge sharing, and improved resource allocation. However, increased agricultural trade may also introduce additional resources and environmental pressures, which could constrain gains in GGTFP. Explanatory variables were described in detail in Table 2.

3.3. Data Source

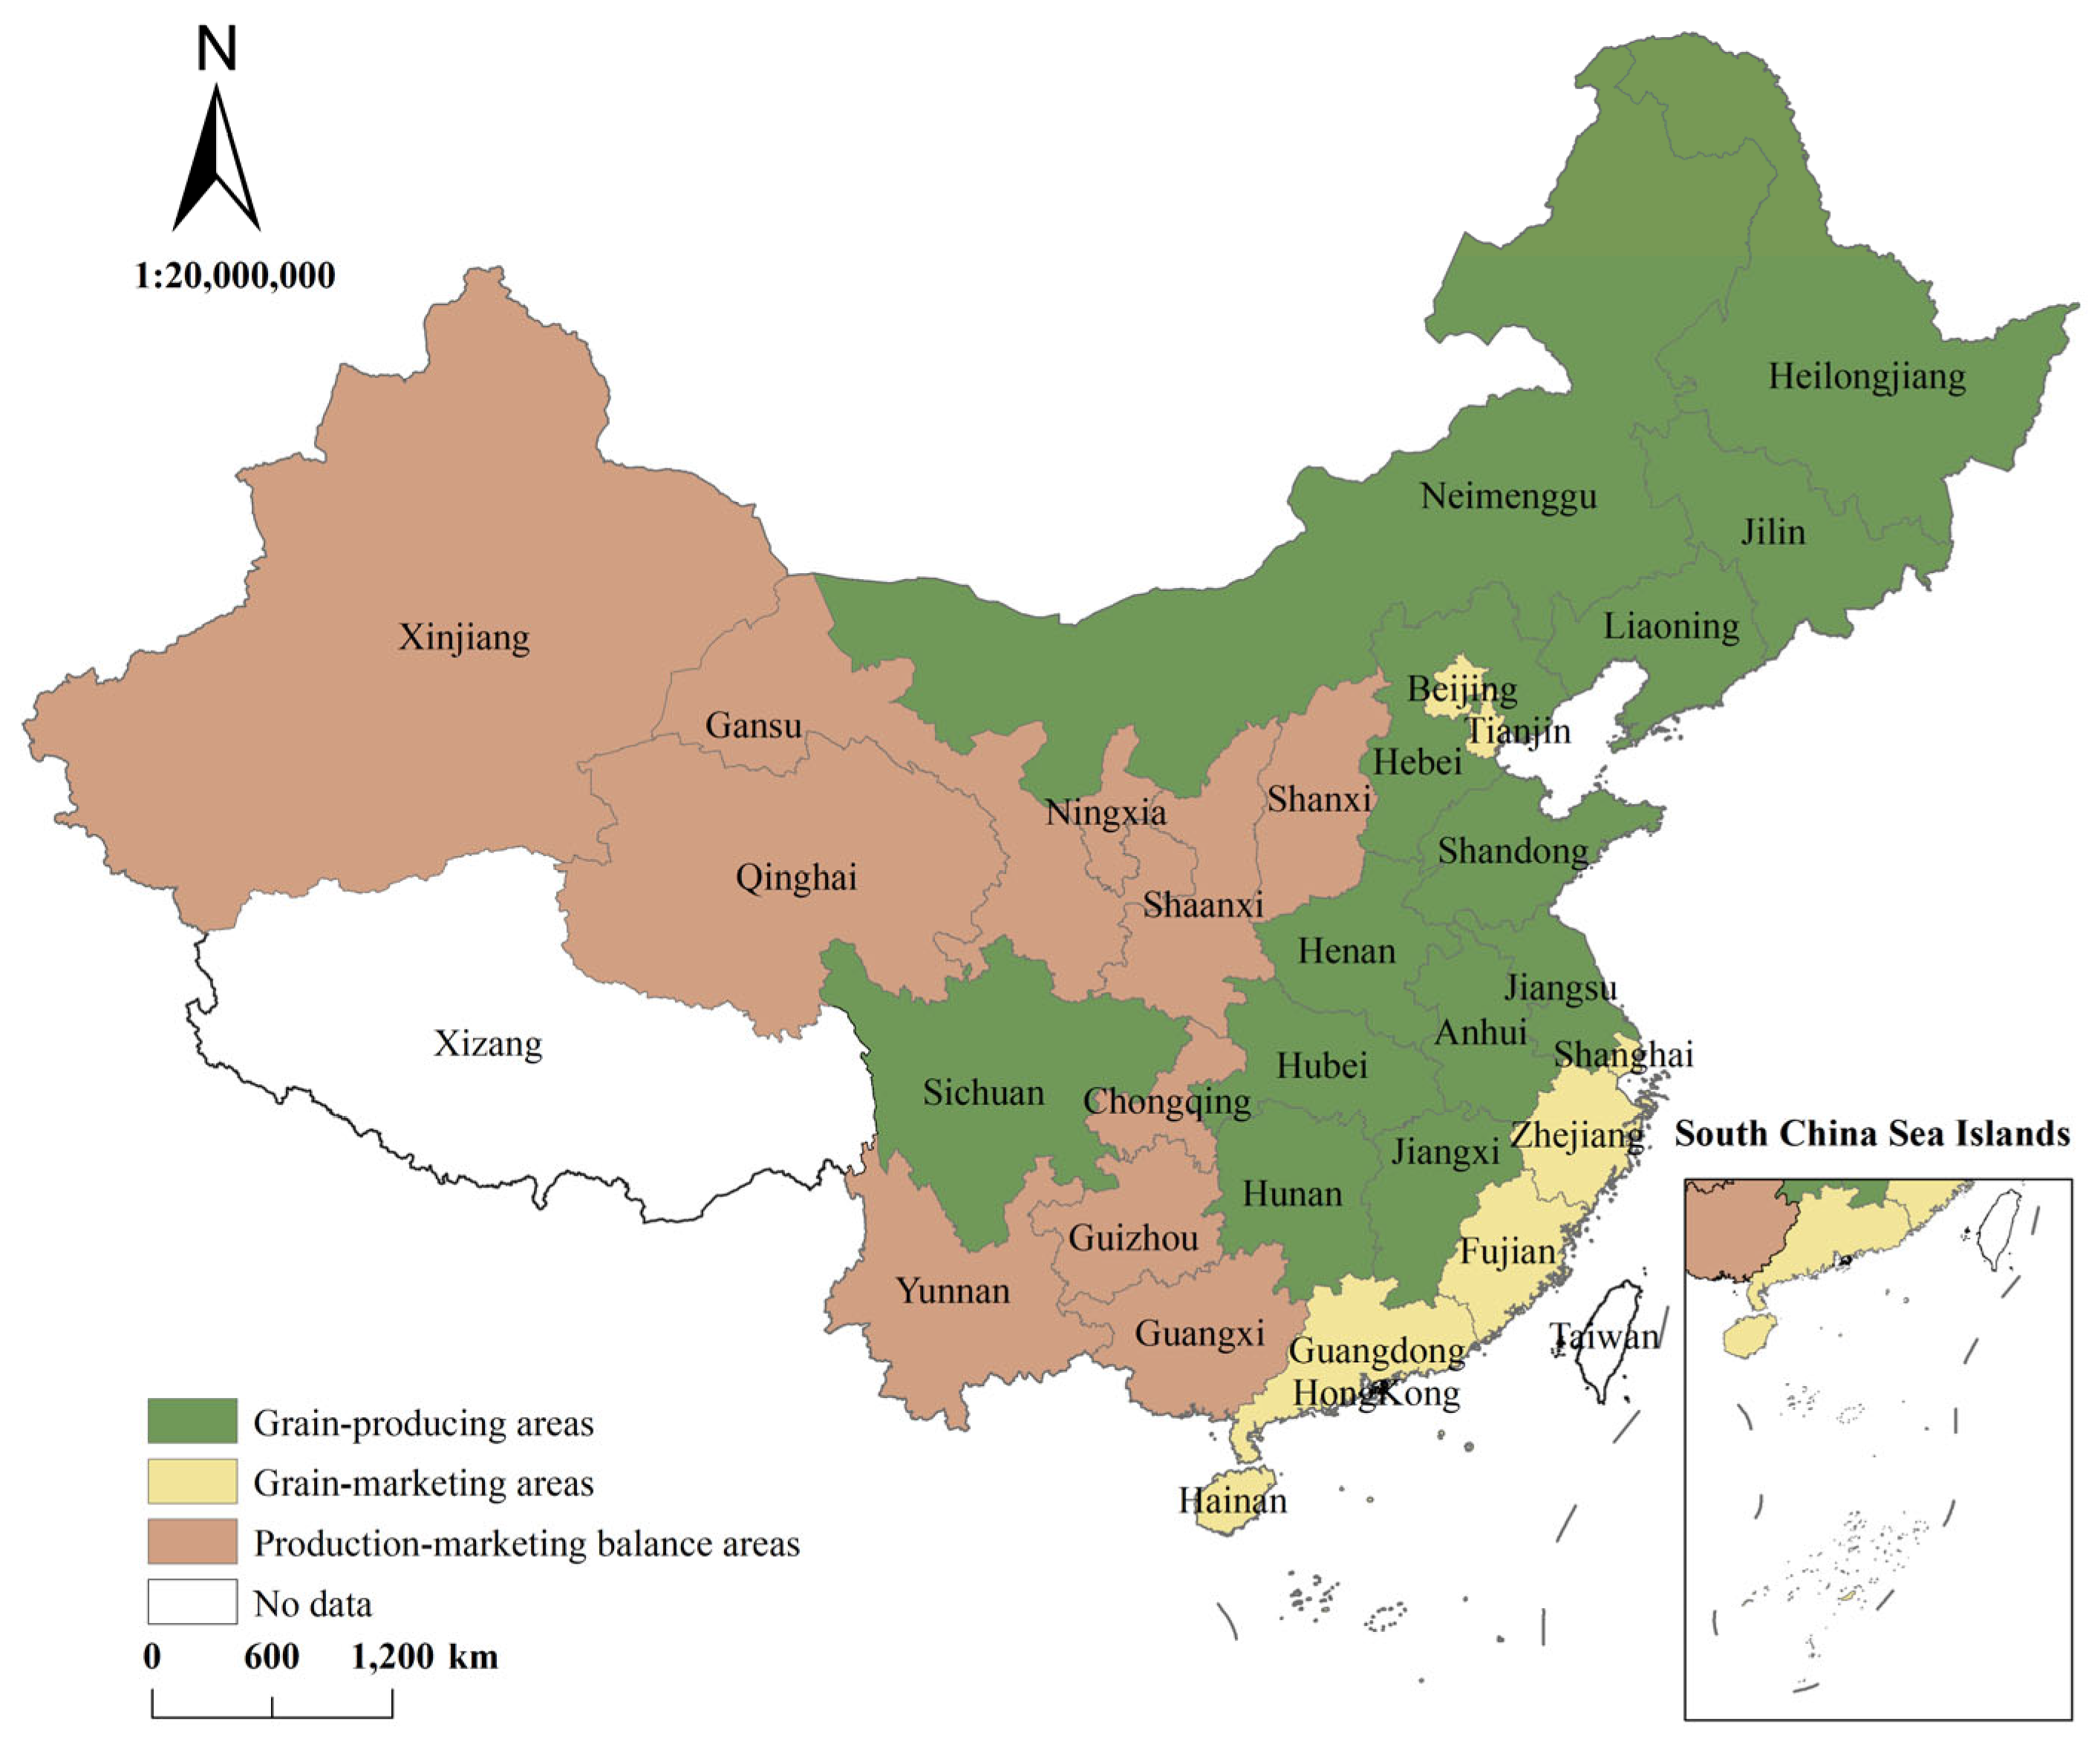
Panel data from 30 Chinese provinces (cities, autonomous areas, and municipalities) between 2006 and 2022 used as the research sample for this empirical analysis. Taiwan, Hong Kong, Macao, and Xizang were excluded due to severe data limitations. The year 2006 was selected as the starting point primarily because it marks the introduction of the legally binding “1.8 billion mu (120 million hectares) cultivated land red line” in the Outline of the Eleventh Five-Year Plan. This policy milestone signified that cultivated land protection and food security had become major priorities in China’s policy agenda. This study specifically examines the measurement results of GGTFP across grain functional zones. In accordance with the State Council’s Guidelines for Establishing Grain Production Functional Zones and Important Agricultural Product Protection Zones, China’s 31 provincial administrative regions are categorized into three distinct zones: grain-producing areas (GPAs), grain-marketing areas (GMAs), and production-marketing balance areas (PMBAs) (Figure 2). GPAs possess optimal geographical, edaphic, and climatic conditions for grain cultivation, characterized by high yields and significant planting ratios. These regions not only ensure local self-sufficiency but also supply substantial commercial grain surpluses for interregional transfer. In contrast, GMAs exhibit higher levels economic development but face constraints from dense populations and limited arable land, resulting in significant grain supply-demand gaps. PMBAs maintain basic self-sufficiency while making relatively modest contributions to national grain output.
The data for relevant variables were primarily sourced from the following: (i) The China Statistical Yearbook, China Rural Statistical Yearbook, China Agricultural Yearbook, China Environmental Statistical Yearbook, and the statistical yearbooks of other provinces provided the majority of the input-output and control variable data used in the grain production process. Grain crops encompass cereal crops (wheat, rice, maize), tuber crops (including sweet potatoes, potatoes, etc.), and legume crops (including soybeans, broad beans, peas, mung beans, etc.). (ii) The “China Rural Management Statistical Yearbook” (which was replaced in 2019 by the “China Rural Policy and Reform Statistical Yearbook”) provided the data on the transfer of cultivated land. (iii) Green production technology was measured by the number of agricultural green patent applications in each province, which were collected from the China Intellectual Property Office based on IPC classification codes. (iv) Instrumental variables were constructed using data from the 1984 China Agricultural Yearbook, which reported the total number of rural households and the number of households adopting the household contract responsibility system in each province in 1983. Since Hainan and Chongqing were not yet established as separate provincial-level administrative regions in 1983, their data were derived from Guangdong and Sichuan, respectively.

4. Results

4.1. Measurement Results Analysis

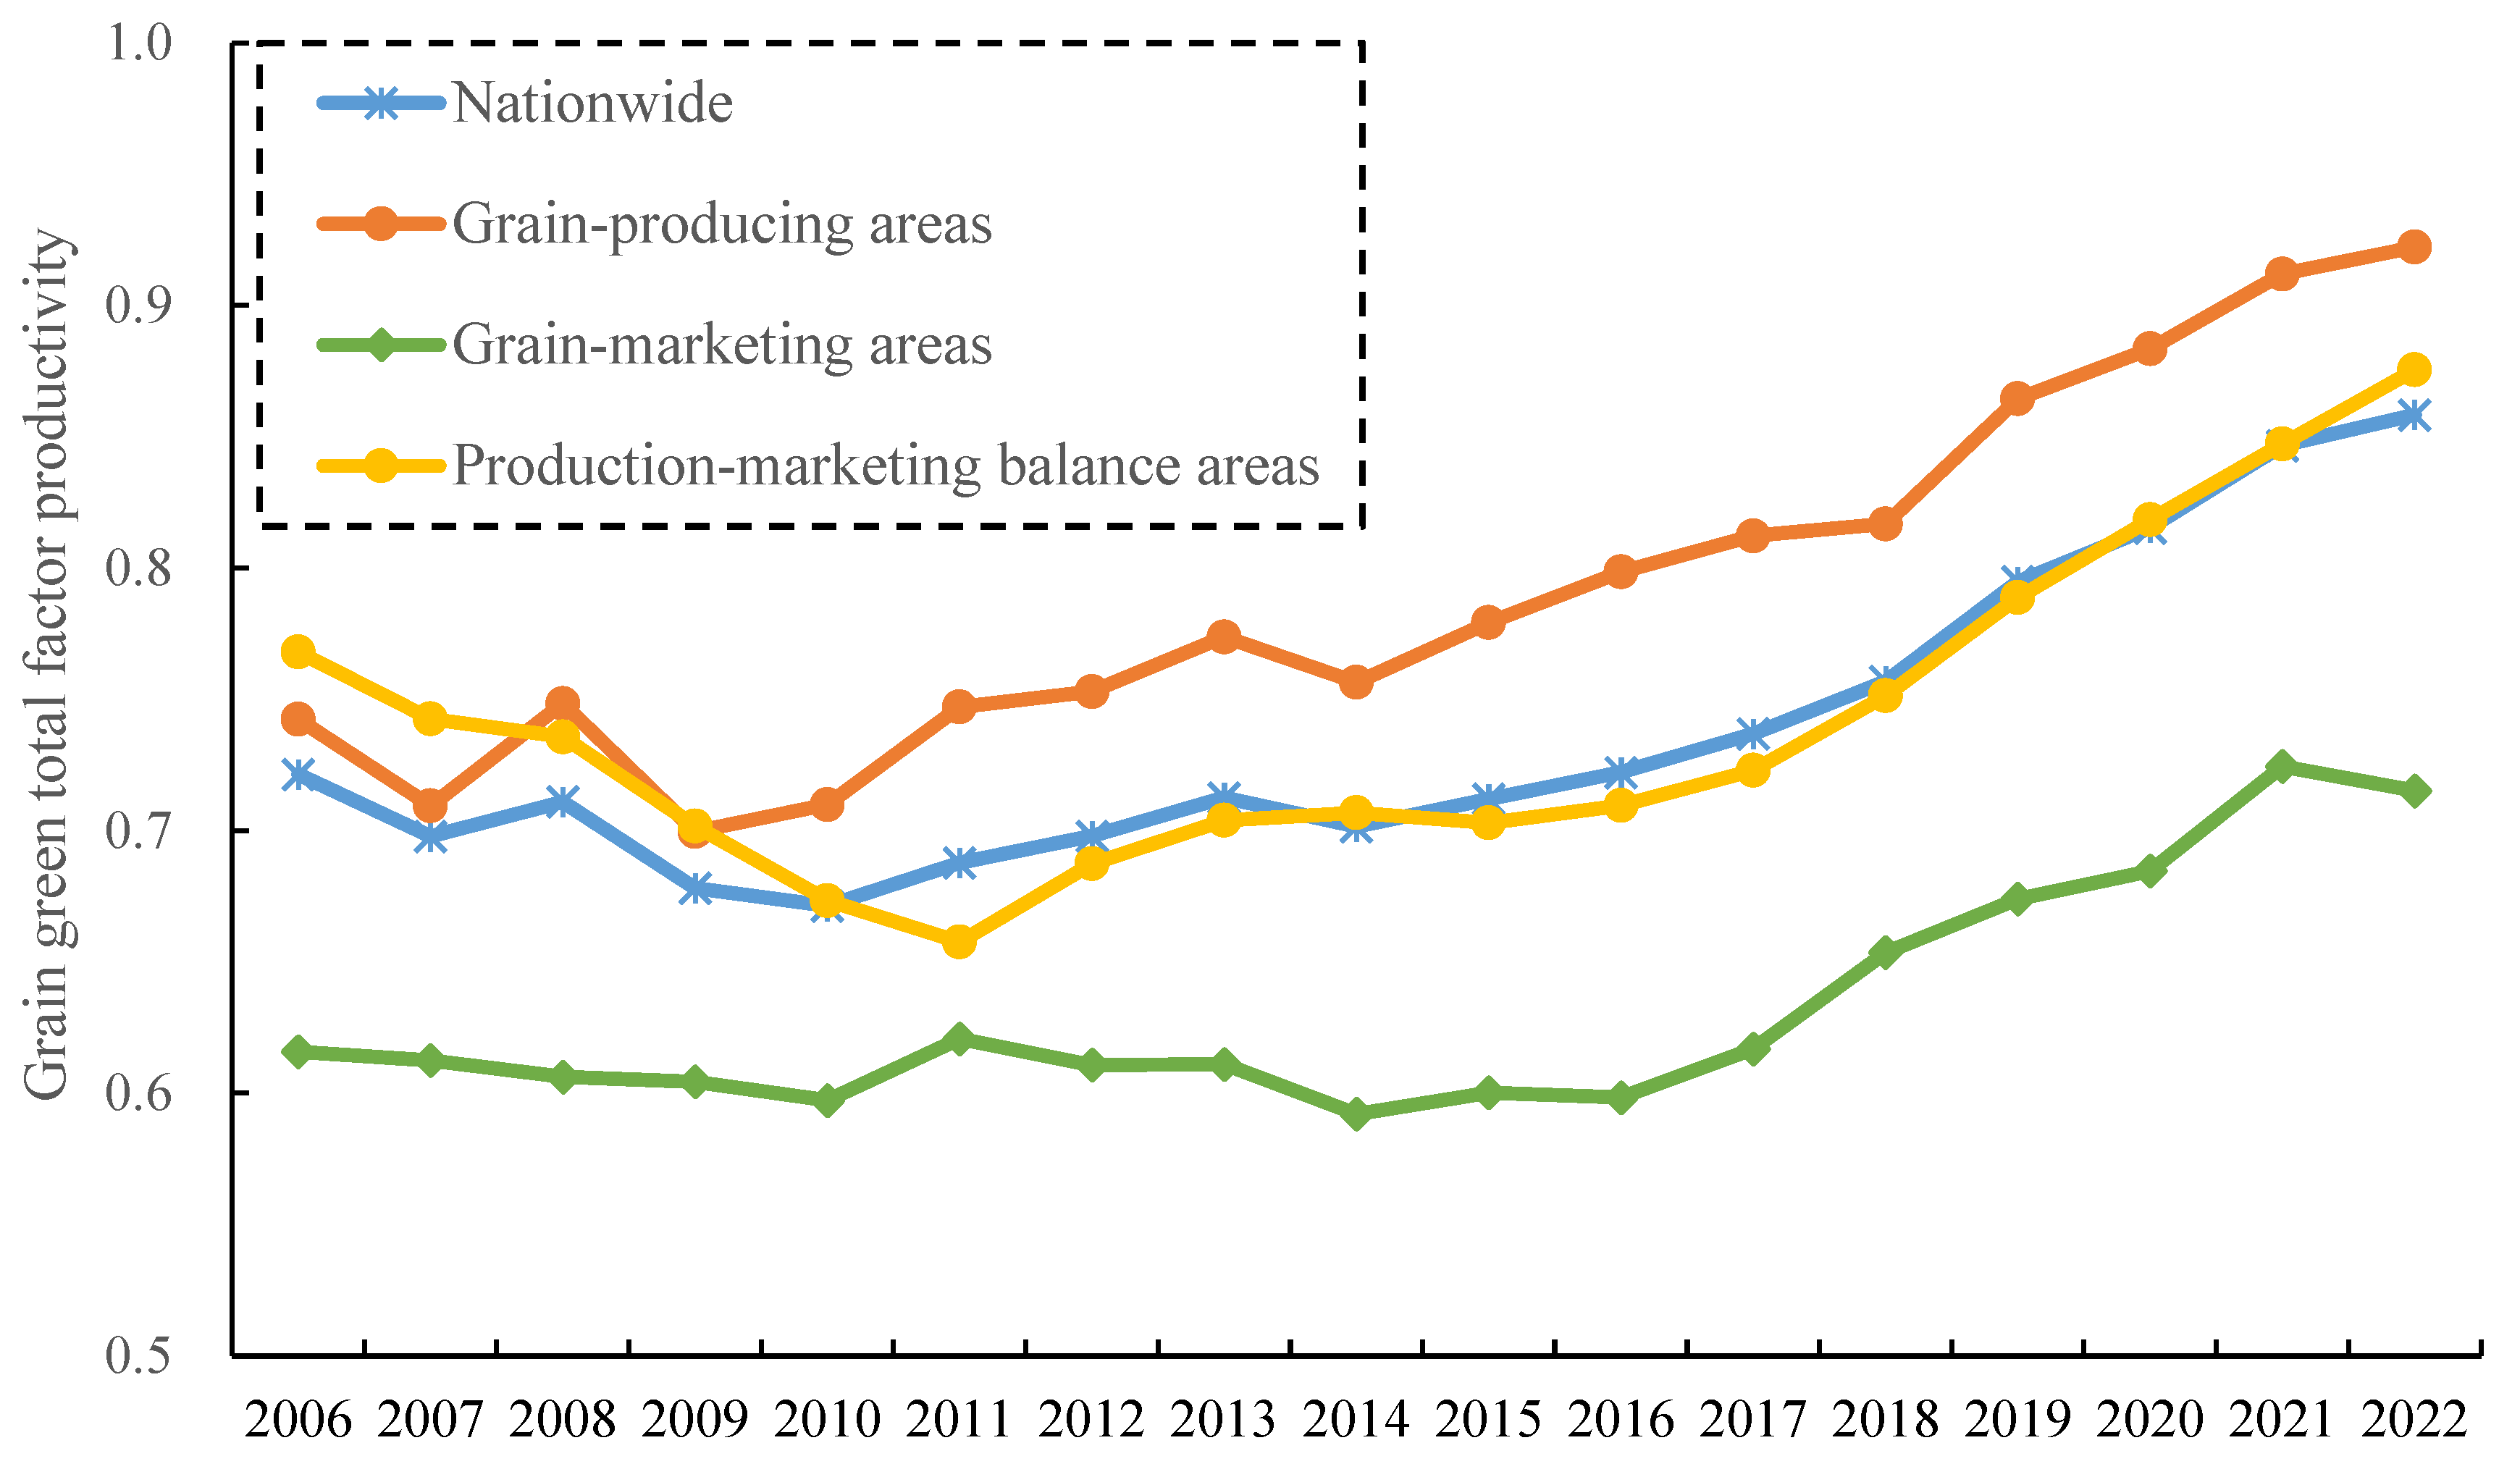
Based on the EBM model, this study computed the GGTFP for 30 Chinese provinces (municipalities and autonomous) from 2006 to 2022 using MATLAB 2022b software. As illustrated in Figure 3, China’s GGTFP generally exhibited a trend of steady increase after a slight decline during the initial years of the study period. Between 2006 and 2010, the GGTFP experienced a fluctuating decrease, reaching its lowest value of 0.671 in 2010. From 2010 onward, China’s GGTFP showed significant and sustained growth. Over the entire period, the efficiency value increased at an average annual rate of 1.092%, rising from 0.721 in 2006 to 0.856 in 2022.
From the perspective of grain production functional areas (Figure 3), the changes in GGTFP within GPAs were largely consistent with the national trend, characterized by an initial slight decline followed by a gradual increase. Moreover, the efficiency values of this region consistently exceeded the national average. Specifically, the GGTFP in the GPAs grew at an average annual growth rate of 1.365% from 2006 to 2022, increasing from 0.749 to 0.919. In the PMBAs, the efficiency value declined between 2006 and 2011, reaching its lowest point in 2011. From 2012 to 2016, GGTFP experienced a gradual recovery, and after 2017, it demonstrated a clear and steady upward trend. Overall, the GGTFP in the PMBAs grew at a relatively slow average annual rate of 0.821%, rising from 0.768 in 2006 to 0.875 in 2022. This region experienced fluctuating declines from 2006 to 2016, followed by a substantial increase between 2017 and 2021, and a slight decline in 2022. Over the entire period, the GGTFP in the GMAs increased at an average annual rate of 0.939%, from 0.616 in 2006 to 0.715 in 2022.
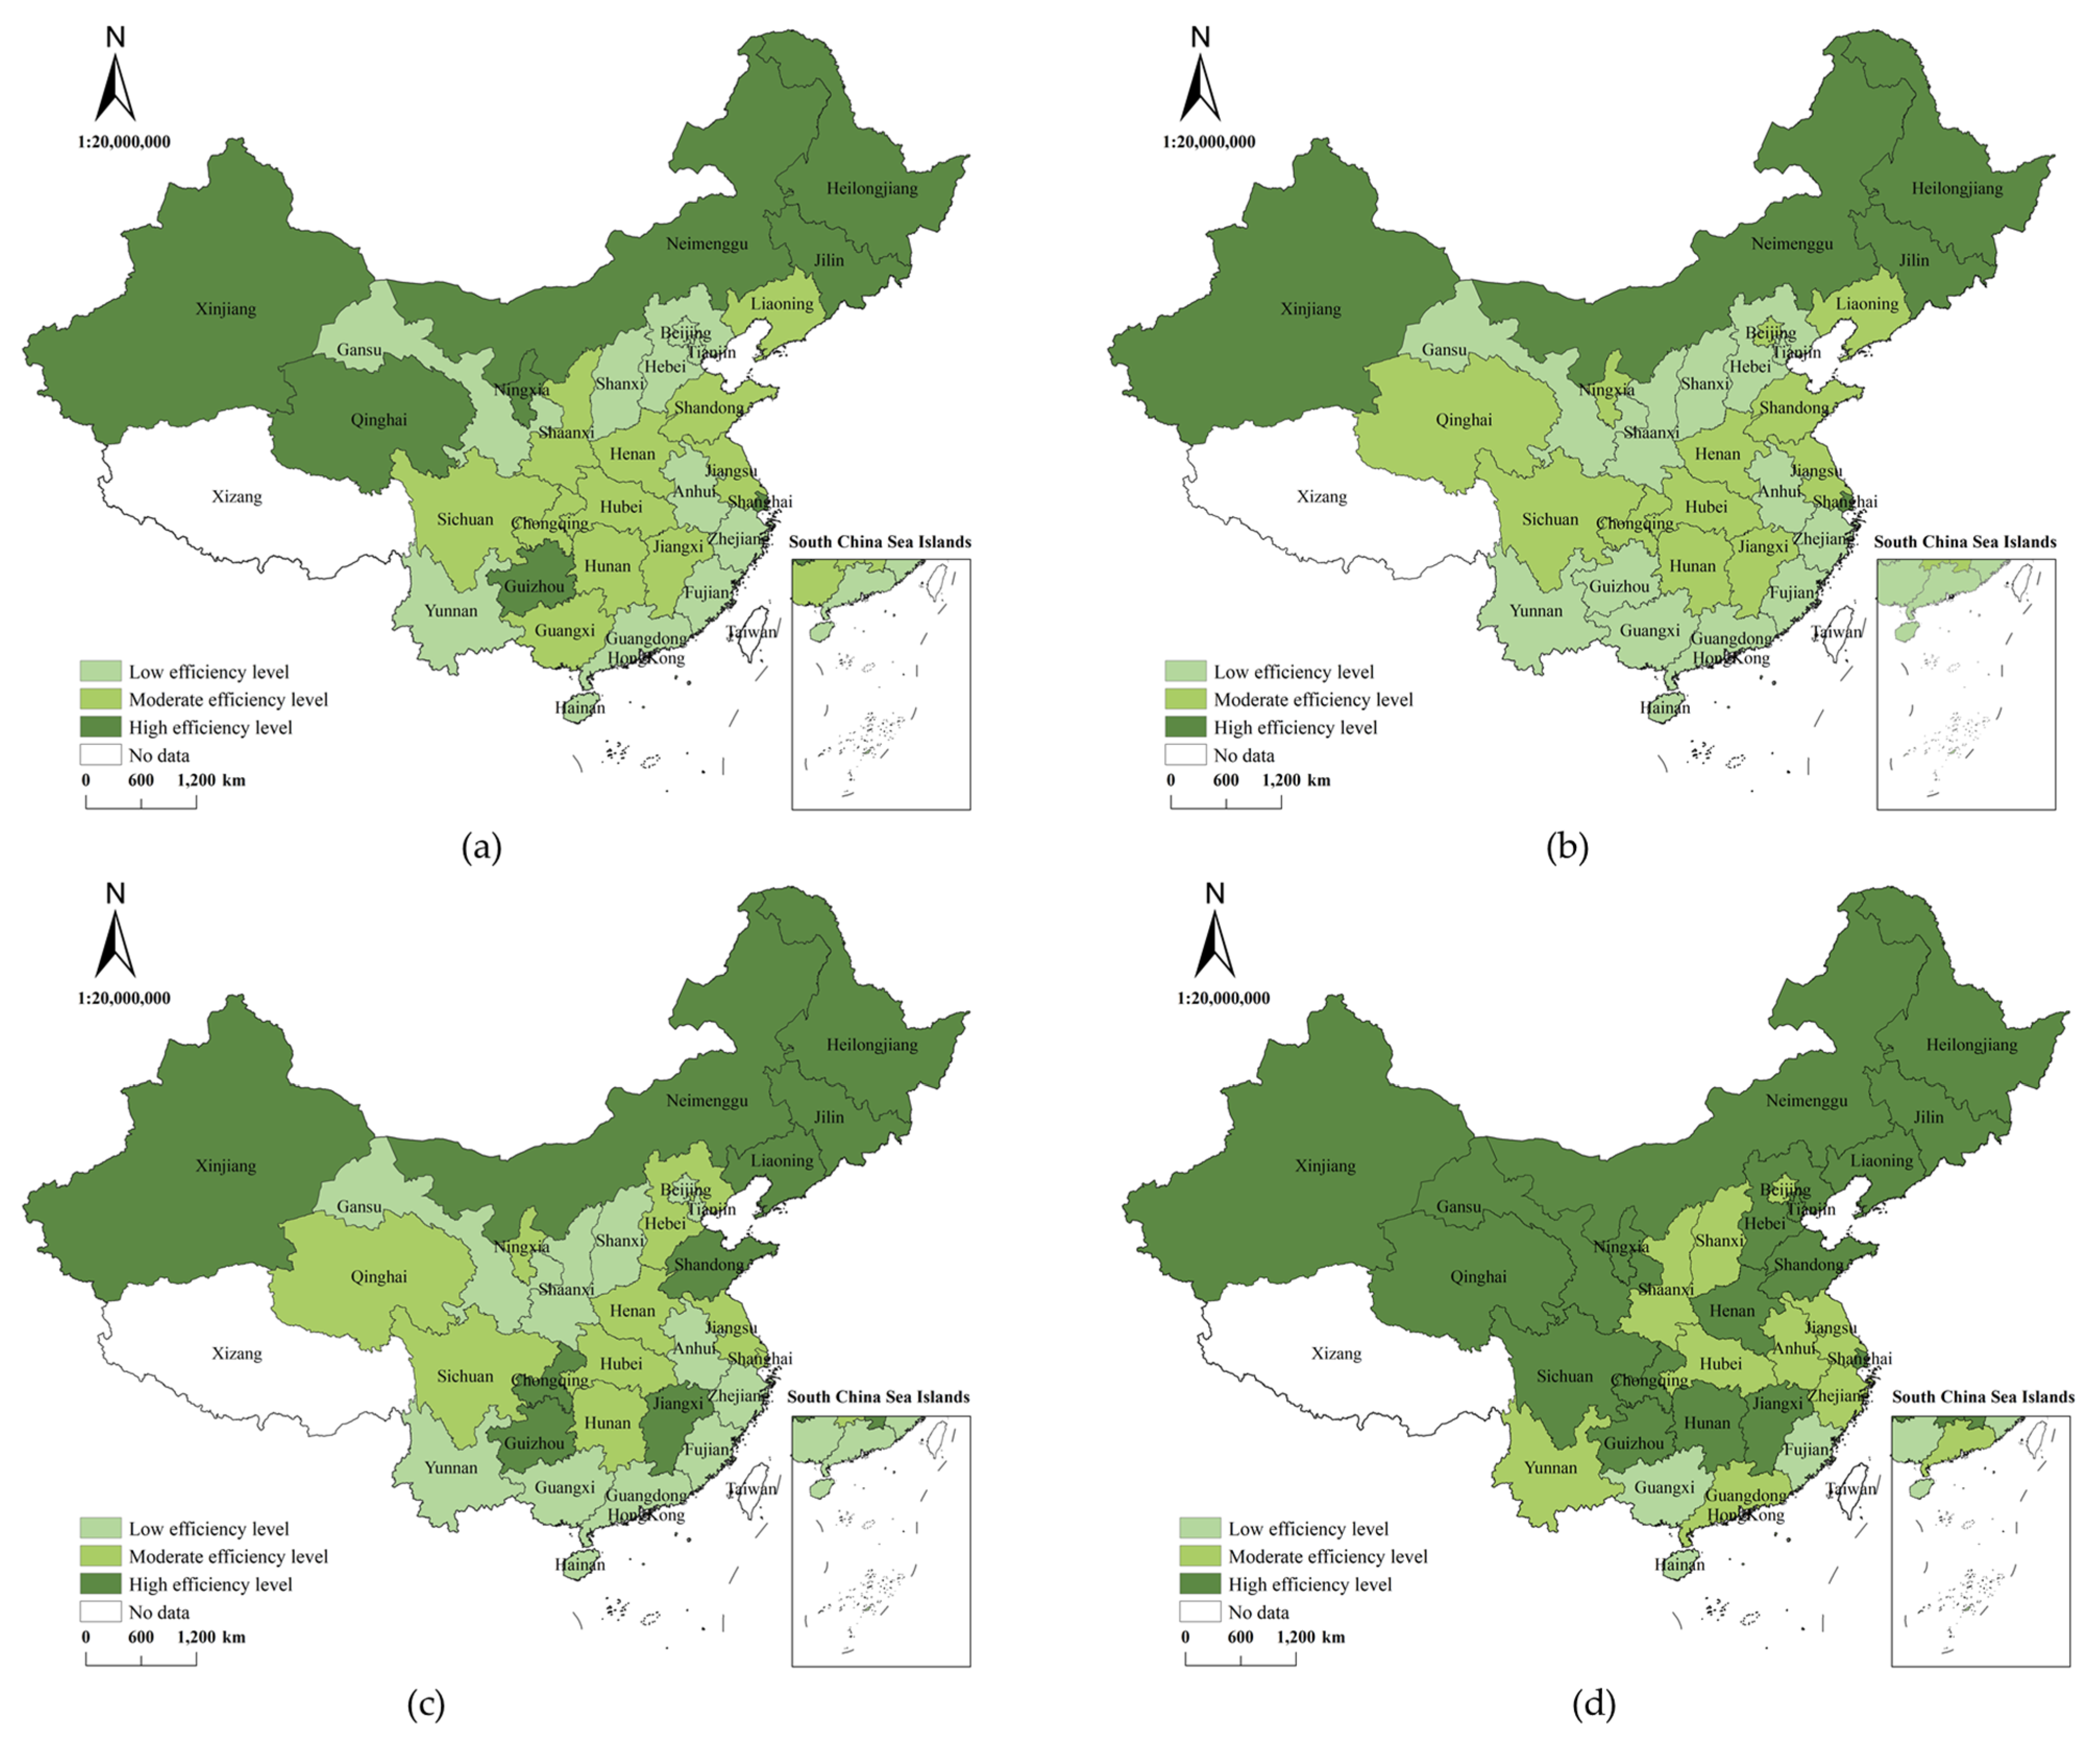
This study employed the tercile method to categorize GGTFP into three tiers—low, medium, and high—based on the 33.3% and 66.6% percentiles. The spatial distribution of these tiers was visualized using ArcGIS 10.8.2 software. This classification approach facilitates an intuitive understanding of regional disparities, supports the formulation of targeted policies, promotes optimal resource allocation and agricultural green transformation, and provides a scientific basis for sustainable development. Due to space limitations, only selected years—specifically the initial years of each “Five-Year Plan” period, namely 2006, 2011, 2016, and 2021—are presented in the spatial distribution maps (Figure 4). Analysis of the spatial distribution reveals a general upward trend in China’s overall GGTFP increased during the study period, though significant interprovincial disparities persisted. In 2006, eight provinces were classified as high-efficiency regions: Inner Mongolia, Jilin, Heilongjiang, Shanghai, Guizhou, Qinghai, Ningxia, and Xinjiang. Eleven provinces fell into the low-efficiency category, and another eleven were rated as medium efficiency. In 2011, the number of provinces of high-efficiency provinces decreased to five. Guizhou dropped from high to low-efficiency, while Qinghai and Ningxia were reclassified as medium efficiency. In 2016, the number of high-efficiency provinces rebounded to nine. Liaoning, Jiangxi, Shandong and Chongqing joined the high-efficiency group. Guizhou also improved from low to high-efficiency, whereas Shanghai was downgraded to medium efficiency. By 2022, the number of provinces with high-efficiency provinces increased markedly to 18, with only three provinces with low efficiency levels, namely Guangxi, Hainan and Fujian. Beijing, Shanxi, Jiangsu, Zhejiang, Anhui, Hubei, Guangdong, Yunnan and Shaanxi were categorized medium efficiency, while the rest achieved high efficiency.

4.2. Empirical Results Analysis

4.2.1. Benchmark Regression Results Analysis

Data and model testing were required prior to panel empirical model regression. Each variable in this study was initially subjected to a variance inflation factor test (VIF), which revealed that there was no multicollinearity issue amongst the variables. The variable’s highest VIF value was 3.53 < 10. To ensure the robustness of the benchmark regression results, a stepwise regression approach was adopted, with control variables sequentially to examine the impact of cultivated land transfer on GGTFP. The GGTFP was significantly boosted by cultivated land transfer, as indicated by the regression findings of column (1) of Table 3 without the addition of control variables. The regression results of progressively adding control variables were shown in columns (2) through (8). The 1% significance level was met by all of the regression coefficients for the primary explanatory variable, transferred cultivated land. This shown that the transfer of farmed land in China significantly improved the GGTFP, confirming Hypothesis 1a. Among the control variables, the proportion of affected area, multiple cropping index, agricultural machinery density, and the level of agricultural openness were found to have significantly negative effects on GGTFP.

4.2.2. Endogeneity Test

(1)
Instrumental Variables (IV) Method
GGTFP and cultivated land transfer may be causally related; that is, an increase in the area of cultivated land transfer may encourage the growth of GGTFP, while an improvement in GGTFP may also, to some extent, accelerate cultivated land transfer. To address this endogeneity concern, this study employed an IV approach and conducted a Two-Stage Least Squares (2SLS) regression using the selected instrumental variables. As shown in columns (1) and (2) of Table 4, a strong positive correlation was observed between the area of cultivated land transfer and the IV. Furthermore, the fitted values of transfer area derived from the IV had a significant positive impact on GGTFP at the 1% level. These results indicate that even after accounting for endogeneity, cultivated land transfer continues to significantly enhance GGTFP.
The first-stage regression results further validated the strength and relevance of the instrumental variables. The null hypothesis of “instrumental variable under-identification” was rejected at the 1% significance level, with an F-statistic of 93.680 (well above the conventional threshold of 10) and a p-value of less than 0.01, confirming that the instruments are strong and not weakly identified.
(2)
Difference-in-Differences (DID) Model
The last two columns of Table 4 reported regression results examining the impact of cultivated land transfer policies on GGTFP. The term Treati × postt represented the DID instrument variable, whose coefficient reflected the effect of cultivated land transfer policies on GGTFP. As shown in columns (3) and (4) of Table 4, the implementation of farmland transfer policies had a statistically significant positive effect on GGTFP at the 1% level, both with and without the inclusion of control variables. This result indicated that the farmland transfer policy has produced a favorable impact on GGTFP.
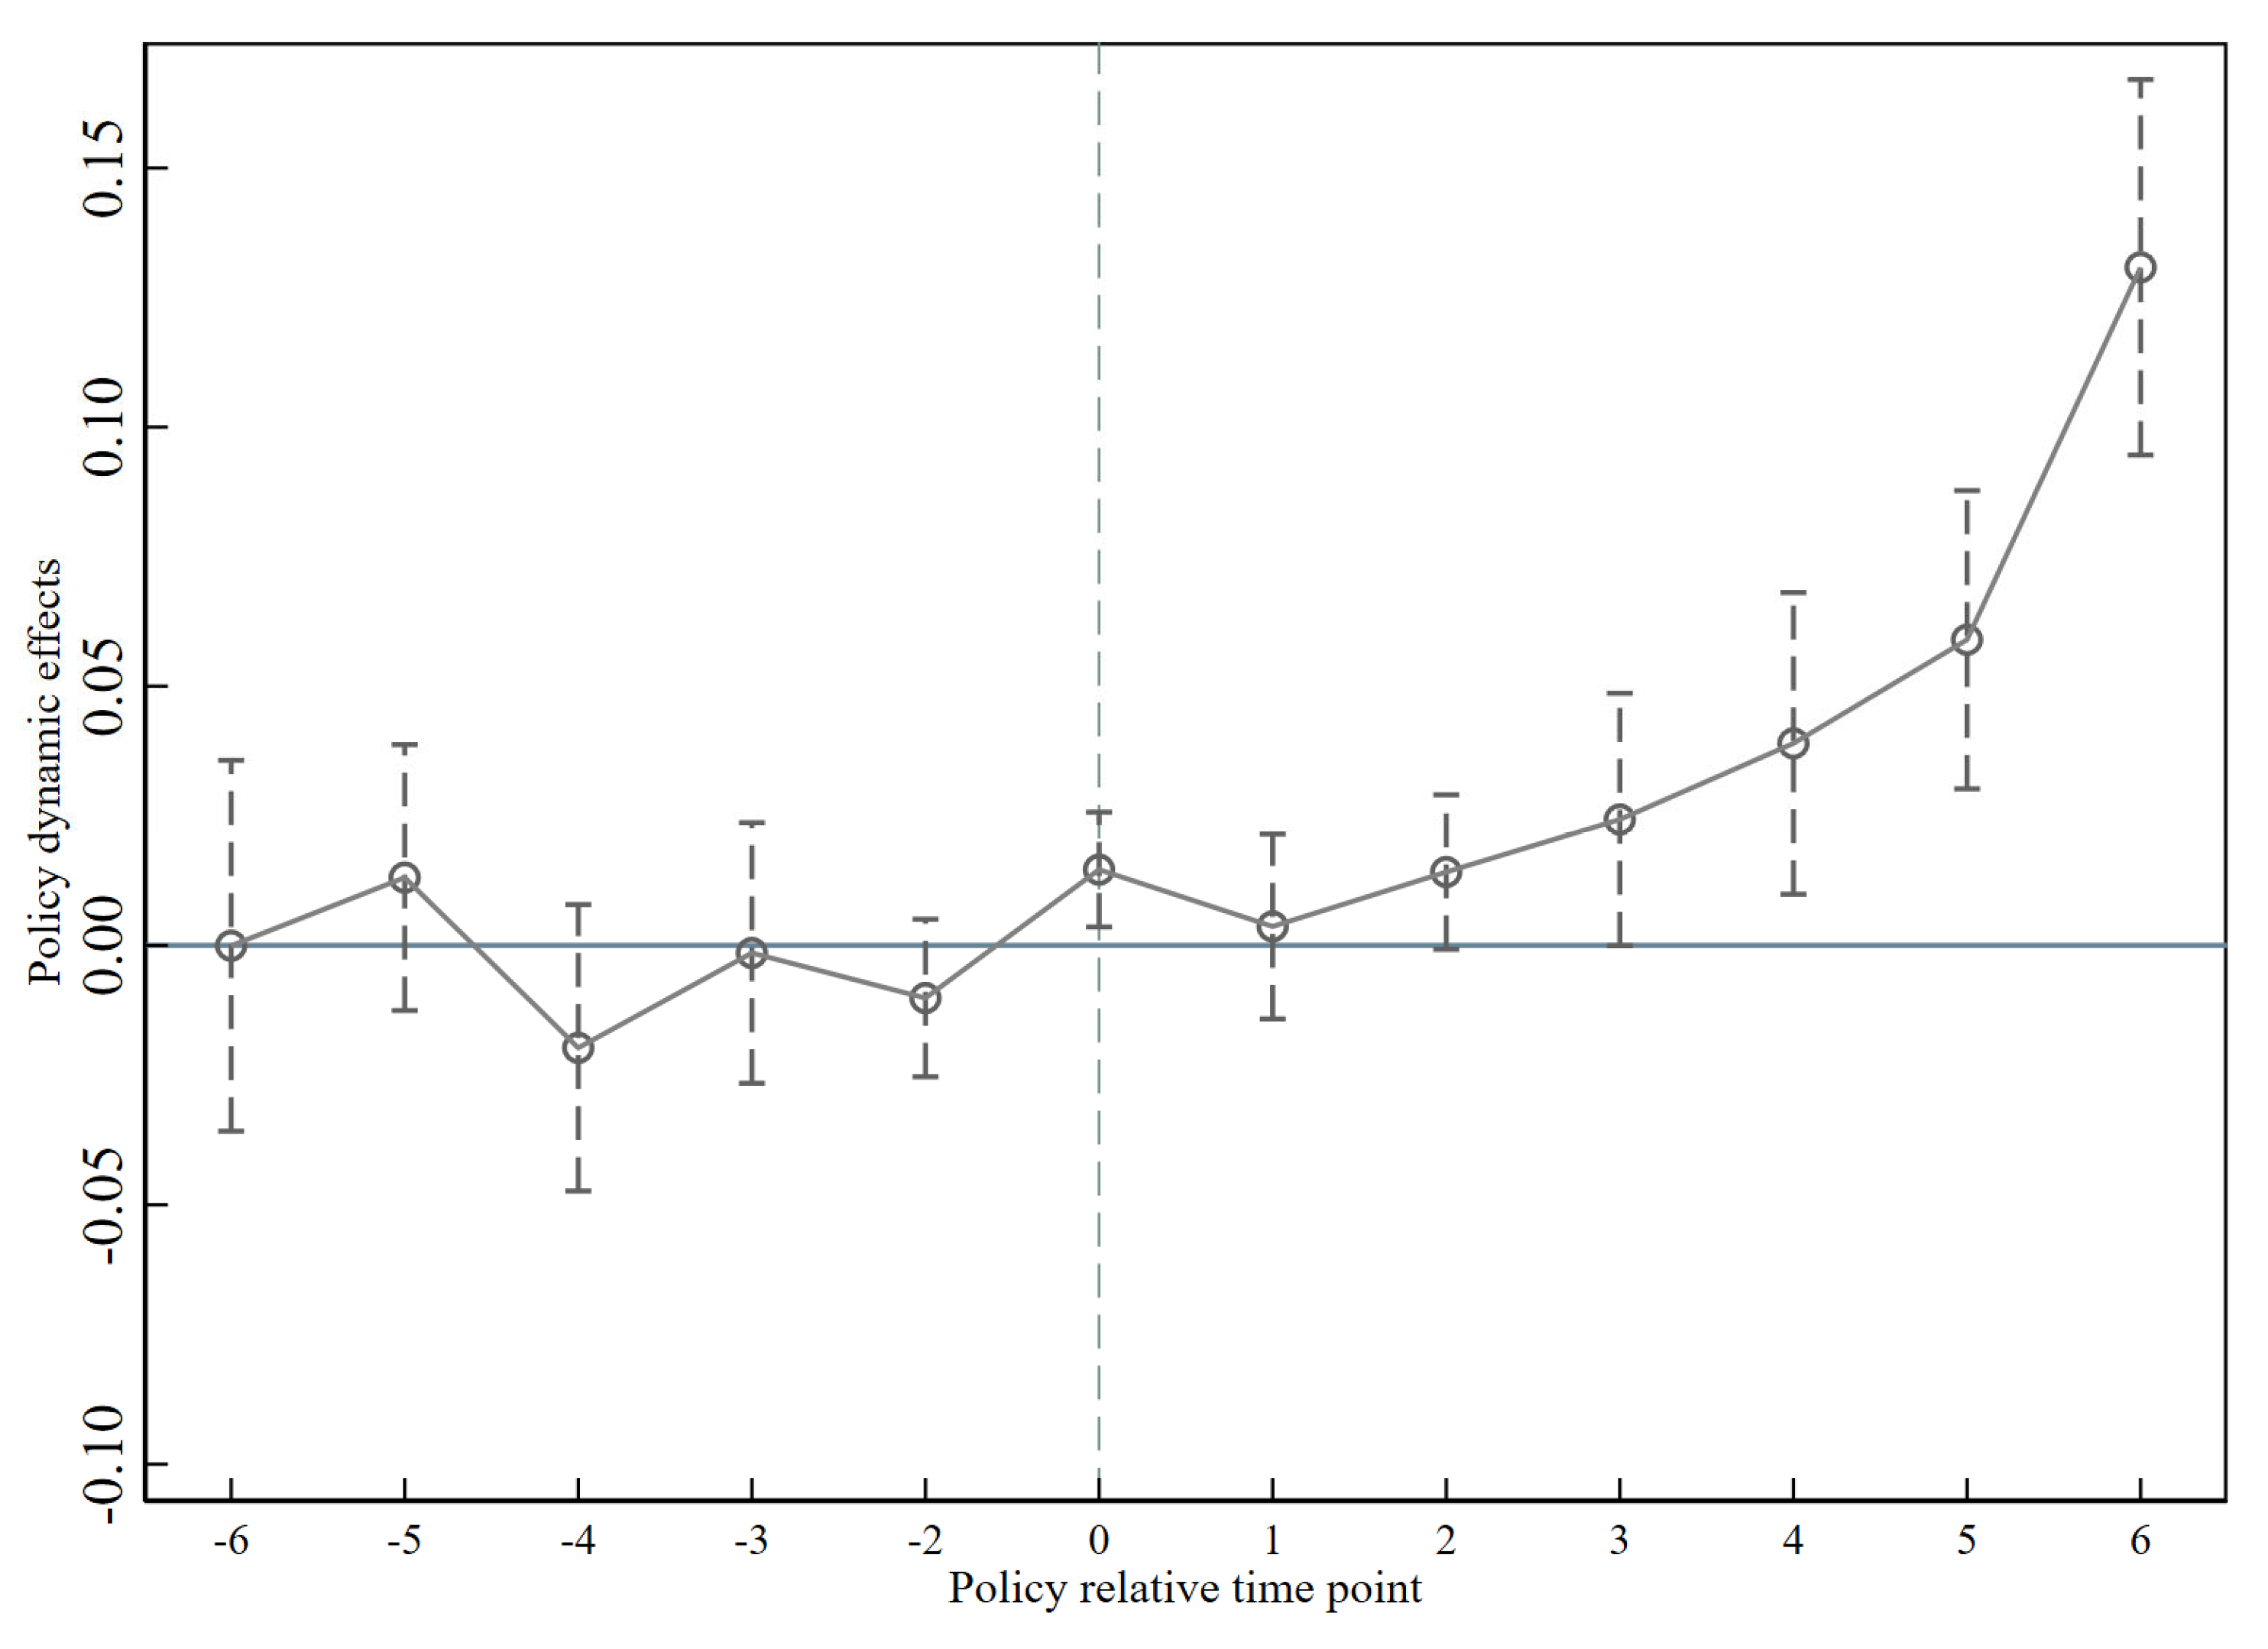
To mitigate potential biases in estimating the effects of the cultivated land transfer policy using the difference-in-differences (DID) model, a parallel trends test was conducted prior to the policy impact analysis. This test ensures that the treatment and control groups followed similar development trajectories before the policy intervention.
The study examined a twelve-year window centered around the implementation of the cultivated land transfer policy (2007–2019). By analyzing the dynamic changes in the interaction coefficients between the policy dummy variable and time-point dummies, the test assessed whether the parallel trends assumption held for the treatment and control groups around the critical policy year (2013).
As shown in Table 5 and Figure 5, the interaction coefficients fluctuated within the range [–0.02, 0.02] and were statistically insignificant during the pre-policy period. After the policy took effect, however, the coefficients exhibited significant changes. These results confirm that the parallel trends assumption was satisfied and indicate that the policy had a meaningful promotional effect on GGTFP, with its impact demonstrating clear dynamic evolution characteristics over time.

4.2.3. Robustness Test

To further verify the robustness of the regression results, this study employed three testing strategies: incorporating lagged effects, adjusting the study period, and modifying the sample area, as summarized in Table 6. First, to account for potential delayed impacts of cultivated land transfer on GGTFP, the regression was conducted using the transfer area lagged by one, two, and three periods. Second, the study period was adjusted in response to the disruptive effects of the initial COVID-19 outbreak in 2020 on grain production; sample data from 2020 were excluded, and the regression was re-estimated using the modified timeframe. Third, the sample composition was refined by excluding the four provincial-level municipalities—Beijing, Shanghai, Tianjin, and Chongqing—due to their relatively small grain planting areas and distinct characteristics compared to other provinces. The regression was repeated using only data from major grain-producing provinces.
The results of these robustness check consistently showed that the estimated coefficient of cultivated land transfer area remained positive and statistically significant across all specifications, confirming that the promoting effect of cultivated land transfer on GGTFP is reliable and robust.

4.2.4. Heterogeneity Analysis

Given China’s vast territory, significant variations exist in geographical conditions, economic development levels, agricultural technology, and farming practices across regions. These differences are reflected in both the input-output structure of grain production and the extent of cultivated land transfer. To better understand the regional heterogeneity in the relationship between cultivated land transfer and GGTFP, this study re-estimated the effects based on functional grain zones—GPAs, GMAs, and PMBAs—as well as on the eastern, central, and western regions, taking into account current grain production and marketing patterns and regional socioeconomic conditions. The regression results were presented in Table 7. From the perspective of grain functional area heterogeneity, the impact coefficient of cultivated land transfer on GGTFP was significantly positive and in both GPAs and PMBAs were at the 5% and 1% levels, respectively, with a higher effect observed in PMBAs. In contrast, the coefficient for GMAs was negative and statistically insignificant.
In terms of regional economic development heterogeneity, the estimated coefficients of cultivated land transfer were positive and statistically significant in the eastern (at the 10% level), central (at the 1% level), and western (at the 5% level) regions. The western region exhibited the highest impact coefficient among the three.

4.3. Further Analysis

To further explore the dynamic impact mechanism of cultivated land transfer on GGTFP, A quadratic term of transferred land area was incorporated into the baseline model. As shown in Model (2) of Table 8, the squared term of transferred cultivated land area exhibited a statistically significant negative coefficient at the 1% level (α2 = 0.009; p < 0.01), indicating a significant nonlinear relationship between the variables. Using the inflection point formula of the quadratic function, x* = −α1/2α2, the critical value was calculated to be 0.4222 million hectares. This value lies within the actual sample distribution range (minimum: 0.0787 million hectares; maximum: 0.4601 million hectares), confirming a statistically significant inverted U-shaped relationship between cultivated land transfer and GGTFP. These results provide support for Hypothesis 1b.

4.4. Mechanism Analysis

(1)
Test results of the scale management mechanism
The regression results for Model 1 (Table 9) indicated that the area of cultivated land transfer showed a statistically significant positive coefficient at the 1% level, indicating that expanded land transfer promoted regional-scale farm operations. The results of Model 2 confirmed that cultivated land transfer enhanced GGTFP through improved land-scale management, thereby supporting Hypothesis 2a. Model 3 revealed that the cultivated land transfer variable maintained a positive coefficient significant at the 5% level, suggesting that increased land transfer also facilitated the development of service-scale management. Combined with the results of Model 4, these findings verified that cultivated land transfer improved GGTFP through service-scale management, providing empirical for Hypothesis 2b.
(2)
Test results of green production technology mechanism
Relying solely on scale operation perspectives proved inadequate to fully explain the impact of cultivated land transfer on GGTFP. Therefore, this study further investigated the potential mediating role of green production technology progress. The regression results for Model 1 (Table 10) revealed that the cultivated land transfer variable had a statistically significant positive effect (at the 1% level) on the progress of green production technology, indicating that land transfer facilitates technological advancement in grain production. When considered together with the results Model 2, these findings confirmed that cultivated land transfer enhanced GGTFP through promoting progress in green production technology, thereby validating Hypothesis 3.
(3)
Test results of the synergistic mechanism
The preceding mechanism analysis established that cultivated land transfer enhanced GGTFP through both scale operation and the advancement of green production technology. This section further investigated their potential synergistic effects. The regression results revealed bidirectional positive relationships:
Model 1 (Table 11) indicated green production technology significantly positively influenced cultivated land scale operations (at the 10% significance level). Model 2 showed cultivated land scale operations significantly promoted green technology adoption (also at 10% significance level). These results confirmed a synergistic interaction between land scale operations and green technologies in enhancing GGTFP, thereby validating Hypothesis 4a.
Similarly, Models 3 and 4 demonstrated reciprocal effects between service scale operations and green technology: Green technology significantly improved service scale operations (at the 1% level), and service scale operations substantially enhanced green technology adoption (at the 1% level). This evidence supported their synergistic role in boosting GGTFP, confirming Hypothesis 4b.
Collectively, these findings establish that scale operations and green production technologies interact synergistically to mediate the positive impact of cultivated land transfer on GGTFP.

5. Discussion

This study explored the relationship between cultivated land transfer and GGTFP, along with the mediating roles of scale operation and green production technology. Based on the findings, in-depth cause analysis and corresponding policy recommendations were proposed.
First, China’s GGTFP showed a modest increase during the 12th Five-Year Plan (2011–2015), followed by more significant growth in the 13th Five-Year Plan (2016–2020). These results align with the research of Yang et al. (2022) [20]. The earlier improvement can be attributed to policies promoting resource-efficient and environmentally friendly “two-oriented” agriculture, as well as measures to control agricultural non-point source pollution during the 12th Five-Year Plan. These initiatives effectively mitigated the negative environmental impacts of grain production and enhanced resource use efficiency. During the 13th Five-Year Plan period, the Chinese government continued to implement strategies such as the low-carbon circular agriculture plan and the “zero growth” target for fertilizer and pesticide use. These efforts further reduced carbon emissions and chemical inputs in grain production, supporting more sustainable and environmentally sound growth in total factor productivity. Furthermore, distinct regional disparities were observed in GGTFP improvements. The average efficiency rankings were as follows: GPAs > PMBAs > GMAs. GPAs achieved significant gains in production efficiency through robust policy support and technological innovation. In contrast, GMAs and PMBAs experienced relatively slower progress, which may be attributed to delayed policy implementation and insufficient incentives for green production practices.
Secondly, the relationship between cultivated land transfer and GGTFP demonstrates a significant positive impact. This effect became more pronounced following the introduction of the landmark policy on farmland transfer in 2013, indicating that the policy’s influence exhibits distinct dynamic evolution characteristics. Further analysis reveals an inverted U-shaped nonlinear relationship between the two variables, with an inflection point at 0.422 million hectares. Notably, 98.43% of the sample observations fall to the left of this threshold. This finding aligns with the research of Kuang and Yang (2021) [25] on farmland transfer and agricultural production efficiency, indicating that the effect of cultivated land transfer on GGTFP is distinctly phased. This suggests that, under the current policy framework, most Chinese provinces can still achieve Pareto improvements in GGTFP through moderate advancement of farmland transfer. When the scale of transfer remains below the critical threshold, increasing the area of transferred farmland per unit enhances GGTFP. However, beyond this inflection point, the marginal effect turns negative. Therefore, blindly expanding the scale of transferred farmland should be avoided, as it may lead to a mismatch between the growth rates of production factors and the transferred land area. This would reduce the marginal utility of farmland factors and weaken the promotional effect of farmland transfers on GGTFP.
Thirdly, from the perspective of regional heterogeneity, the effect of cultivated land transfer on GGTFP varies significantly across different grain functional zones. The impact is most pronounced in PMBAs, with a coefficient of 0.218, which can be attributed to this region’s favorable balance between grain production and ecological conservation. In contrast, in GPAs, which face greater yield pressures, the improvement in GGTFP from cultivated land transfers is relatively limited (0.024). Conversely, in GMAs, where the role of agriculture has diminished, cultivated land transfers even show a negative impact (−0.081). These findings present an intriguing contrast to the implementation outcomes of the EU’s Common Agricultural Policy. In Europe, mandatory measures such as ecological direct payments often tightly integrate farmland transfers with ecological conservation [65]. In comparison, practices in China’s major grain-producing regions highlight the ongoing tension between food security and green development. Meanwhile, western regions, characterized by favorable ecological conditions and relatively abundant land resources, exhibit the most substantial green productivity gains from farmland transfers (0.159), diverging from the trajectories of economically advanced eastern regions (0.033) and traditional agricultural central regions (0.019). These disparities underscore the importance of fully considering regional resource endowments and developmental specificities when formulating related policies.
Fourth, in terms of mechanism, service-based scale operations demonstrated the strongest promotional effect on GGTFP, with a coefficient of 0.293, significantly exceeding the contributions of farmland scale operations (0.144) and the direct application of green production technologies (0.041). This finding aligns with the experience of Japan’s agricultural cooperatives, underscoring the pivotal role of specialized services in facilitating the green transition of smallholder agriculture [66]. A plausible explanation is that service-based scale operations enhance grain production efficiency and reduce factor resource wastage through professional services such as mechanized operations, pest and disease control, and technical guidance, thereby substantially boosting green total factor productivity. In contrast, farmland scale management may encounter challenges such as increased administrative complexity and rising labor costs. Moreover, insufficient land consolidation or short-term lease agreements often result in diseconomies of scale, which can impede the enhancement of GGTFP [67]. Further analysis demonstrates that service-scale operations play a more substantial role in advancing green production technologies by effectively integrating them throughout the production process. This allows farmers to benefit without needing to master complex technical details, thereby reducing learning costs and technical risks while accelerating adoption. Service providers also leverage their extensive technical networks and market intelligence to rapidly introduce and disseminate advanced green technologies. For example, Quan et al. (2024) [28] found that when cultivated land is transferred to new business entities, the promotion effect on green production technology becomes more significant. In contrast, land-scale operations primarily focus on optimizing land use efficiency and exhibit a more limited capacity for promoting green technology. In conclusion, it is essential to establish and refine a sustainable mechanism that systematically coordinates three critical elements—land resources, technological innovation, and service systems—to achieve continuous improvement in GGTFP.
Finally, synthesizing the findings of this study from an international comparative perspective, the environmental benefits of China’s cultivated land transfers are profoundly shaped by its unique institutional context. Unlike the long-term leasehold systems common in Europe [68], cultivated land transfers in China typically involve shorter contract durations, which may substantially inhibit operators’ long-term investments in green technologies. At the same time, compared to the mature agricultural service systems in countries such as Japan and South Korea [69], China’s service-scale operation market is still in its developmental stages, which may introduce uncertainties regarding the actual effectiveness of service-led pathways. These institutional differences underscore the necessity of adapting international experiences to China’s specific national conditions.
Nevertheless, this study has several limitations that warrant attention. Constraints in data availability precluded distinguishing between the differential impacts of land inflow and outflow, potentially obscuring important micro-level mechanisms. For example, while large-scale land inflows may significantly promote the adoption of green technologies, the outflow of smallholders could increase the risk of land abandonment—a phenomenon observed in studies from countries such as the Netherlands [70]. Furthermore, the use of provincial-level data may fail to capture finer-scale spatial heterogeneity. Future research could incorporate micro-level data, such as from the Ministry of Agriculture and Rural Affairs’ direct reporting system for new agricultural entities, or integrate remote sensing techniques, to enable more granular and mechanistic analyses.

6. Conclusions and Recommendations

Based on panel data from 30 Chinese provinces from 2006 to 2022, this study measured GGTFP using the EBM model and applied a Tobit regression model to empirically analyze the impact of cultivated land transfer on GGTFP, as well as its regional heterogeneity. The mediating roles of scale operation and green production technology were also examined. The main findings were as follows:
First, China’s GGTFP during the sample period exhibited a trend of initial slight decline followed by gradual increase, with a mean value of 0.737. Although the overall level remained relatively low, some improvement was observed over time. Significant regional disparities were identified among the three major functional grain zones. GPAs showed the highest annual average annual GGTFP, followed by PMBAs, while GMAs recorded the lowest performance. This result highlighted the significant challenge in China’s current grain production green transition: achieving synergistic optimization of production efficiency and ecological environment.
Second, cultivated land transfer had a statistically significant positive effect on GGTFP. Each one-standard-unit increase in transferred cultivated land area was associated with a 0.041-unit improvement in GGTFP. This finding remained robust after accounting for endogeneity and conducting multiple robustness tests. Further analysis revealed an inverted U-shaped nonlinear relationship between the two variables, with an inflection point at 0.422 million hectares. Notably, 98.43% of the sample observations fell to the left of this inflection point, indicating that the current scale of cultivated land transfer had not yet reached the stage of diminishing marginal returns. This pattern aligns with the current phase of market-oriented reform of land factors in China.
Third, the impact of cultivated land transfer exhibited significant regional heterogeneity. In the PMBAs, significantly higher than in the GPAs. The GMAs showed a negative but statistically insignificant coefficient. Furthermore, the western region exhibited the strongest positive effect, outperforming both eastern and central regions. This spatial heterogeneity profoundly reflected differential policy responsiveness and implementation effects across regions with diverse resource endowments and development levels.
Fourth, mechanism analysis indicated that service scale operation had the strongest mediating effect, followed by cultivated land scale management and green production technology. Synergy effect analysis further revealed that scale operation—particularly service scale operation—significantly promoted advances in green technology, which in turn facilitated the expansion of scale operations. This bidirectional reinforcement created a virtuous cycle that enhanced the positive impact of cultivated land transfer on GGTFP.
These findings not only enrich the theoretical framework for green agricultural development by constructing an analytical model that links “cultivated land transfer—scale operation/green production technology—GGTFP”, but also provide a scientific basis for the formulation of practical policies.
First, deepen the reform of cultivated land transfer to enhance green production efficiency. Empirical evidence indicates that cultivated land transfers significantly boost GGTFP, necessitating further refinement of transfer market mechanisms. Specifically, efforts should be made to standardize the operation of rural property rights trading platforms and introduce digital technologies to reduce transaction costs. New types of business entities adopting green production methods after land transfers should be granted policy support such as low-interest loans and tax relief. Concurrently, ecological requirements like soil remediation and crop rotation/fallow periods should be incorporated into transfer contract clauses. An ecological constraint list for arable land transfers should be established to ensure transfer activities align with green transition objectives.
Second, implement targeted measures to address regional heterogeneity. GPAs and PMBAs exhibit more pronounced responses to farmland transfer policies, warranting prioritized resource allocation. Within PMBAs, adopt incentive-based policies substituting subsidies with rewards, providing additional incentives to operators achieving large-scale transfers with marked improvements in GGTFP. In GMAs, explore capital-plus-technology feedback models to channel industrial and commercial capital towards supporting green transformation in primary production areas. Establish green agriculture demonstration zones in the western region to strengthen high-standard farmland construction and promote soil-tested fertilizer application. Concurrently, foster technological collaboration across eastern, central and western regions to disseminate innovations such as drone crop protection and smart agriculture to less developed areas, thereby enhancing overall green production efficiency.
Third, enhance synergies between large-scale operations and green technologies. Service scale operation constitutes the core pathway for elevating GGTFP, necessitating strengthened policy support. Provide specialized subsidies to cooperatives offering services such as unified pest control and straw incorporation; incentivize large-scale operators to adopt green technologies through tax relief and low-interest loans; establish ‘Green Agricultural Technology Extension Centers’ to integrate resources from research institutions and enterprises, delivering tailored green production solutions to farmers. Regularly organize technology matchmaking events to foster collaboration between large-scale operators and agricultural enterprises, creating a virtuous cycle of ‘technology dissemination—large-scale adoption—efficiency enhancement’ to bolster the sustainable development capacity of green agriculture.

Author Contributions

Conceptualization, P.Z.; methodology, P.Z.; software, J.Z. and P.Z.; validation, J.Z. and P.Z.; formal analysis, P.Z.; investigation, S.H. and P.Z.; resources, P.Z.; data curation, C.M. and P.Z.; writing—original draft preparation, P.Z.; writing—review and editing, S.L.; visualization, X.L. and P.Z.; supervision, S.L. and X.L.; project administration, P.L. and S.L.; funding acquisition, P.L. and S.L. All authors have read and agreed to the published version of the manuscript.

Funding

This research was funded the 2023 Central-University Basic Research and Business Fund Special Project (Action Plan for High-quality Development of Philosophy and Social Sciences) [grant number 2023SKQ02]; National Natural Science Foundation of China [grant number 42371212]; the Beijing Social Science Foundation [grant number 22SRB010]; the Beijing Natural Science Foundation [grant number 9222022]; the Central University’s Basic Research Business Fee Project [grant number GK122301187]; the Beijing Forestry University Outstanding Young Talent Cultivation Project [grant number 2019JQ03011]; and the Sino-Mongolian-Russian Economic Corridor Research Collaborative Innovation Center Project 2025, Inner Mongolia University of Finance and Economics [grant number ZMEYJ202507].

Data Availability Statement

The data presented in this study are available on request from the first author.

Conflicts of Interest

The authors declare no conflicts of interest.

References

  1. Price, B. The Political Economy of Mechanization in U.S. Agriculture; CRC Press: Boca Raton, FL, USA, 2019; ISBN 978-0-429-31367-7. [Google Scholar]
  2. Gomiero, T. Soil Degradation, Land Scarcity and Food Security: Reviewing a Complex Challenge. Sustainability 2016, 8, 281. [Google Scholar] [CrossRef] [Scilit]
  3. Biswas, A.; Sarkar, S.; Das, S.; Dutta, S.; Choudhury, M.R.; Giri, A.; Bera, B.; Bag, K.; Mukherjee, B.; Banerjee, K.; et al. Water Scarcity: A Global Hindrance to Sustainable Development and Agricultural Production—A Critical Review of the Impacts and Adaptation Strategies. Camb. Prism. Water 2025, 3, e4. [Google Scholar] [CrossRef] [Scilit]
  4. Guo, J.; Li, C.; Xu, X.; Sun, M.; Zhang, L. Farmland Scale and Chemical Fertilizer Use in Rural China: New Evidence from the Perspective of Nutrient Elements. J. Clean. Prod. 2022, 376, 134278. [Google Scholar] [CrossRef] [Scilit]
  5. Abler, D. Economic evaluation of agricultural pollution control options for China. J. Integr. Agric. 2015, 14, 1045. [Google Scholar] [CrossRef] [Scilit]
  6. Trimpler, K.; Stockfisch, N.; Märländer, B. The Relevance of N Fertilization for the Amount of Total Greenhouse Gas Emissions in Sugar Beet Cultivation. Eur. J. Agron. 2016, 81, 64–71. [Google Scholar] [CrossRef] [Scilit]
  7. Yang, Y.; Tilman, D.; Jin, Z.; Smith, P.; Barrett, C.B.; Zhu, Y.-G.; Burney, J.; D’Odorico, P.; Fantke, P.; Fargione, J.; et al. Climate Change Exacerbates the Environmental Impacts of Agriculture. Science 2024, 385, eadn3747. [Google Scholar] [CrossRef] [Scilit] [PubMed]
  8. Yuan, X.; Li, S.; Chen, J.; Yu, H.; Yang, T.; Wang, C.; Huang, S.; Chen, H.; Ao, X. Impacts of Global Climate Change on Agricultural Production: A Comprehensive Review. Agronomy 2024, 14, 1360. [Google Scholar] [CrossRef] [Scilit]
  9. Solow, R.M. Technical Change and the Aggregate Production Function. Rev. Econ. Stat. 1957, 39, 312. [Google Scholar] [CrossRef] [Scilit]
  10. Song, J.; Chen, X. Eco-Efficiency of Grain Production in China Based on Water Footprints: A Stochastic Frontier Approach. J. Clean. Prod. 2019, 236, 117685. [Google Scholar] [CrossRef] [Scilit]
  11. Xu, H.; Ma, B.; Gao, Q. Assessing the Environmental Efficiency of Grain Production and Their Spatial Effects: Case Study of Major Grain Production Areas in China. Front. Environ. Sci. 2021, 9, 774343. [Google Scholar] [CrossRef] [Scilit]
  12. Shen, L.; Sun, R.; Liu, W. Examining the Drivers of Grain Production Efficiency for Achieving Energy Transition in China. Environ. Impact Assess. Rev. 2024, 105, 107431. [Google Scholar] [CrossRef] [Scilit]
  13. Aigner, D.; Lovell, C.A.K.; Schmidt, P. Formulation and Estimation of Stochastic Frontier Production Function Models. J. Econom. 1977, 6, 21–37. [Google Scholar] [CrossRef] [Scilit]
  14. Zheng, D.; An, Z.; Yan, C.; Wu, R. Spatial-Temporal Characteristics and Influencing Factors of Food Production Efficiency Based on WEF Nexus in China. J. Clean. Prod. 2022, 330, 129921. [Google Scholar] [CrossRef] [Scilit]
  15. Zhan, X.; Shao, C.; He, R.; Shi, R. Evolution and Efficiency Assessment of Pesticide and Fertiliser Inputs to Cultivated Land in China. Int. J. Environ. Res. Public Health 2021, 18, 3771. [Google Scholar] [CrossRef] [Scilit]
  16. Hjalmarsson, L.; Kumbhakar, S.C.; Heshmati, A. DEA, DFA and SFA: A Comparison. J. Prod. Anal. 1996, 7, 303–327. [Google Scholar] [CrossRef] [Scilit]
  17. Wang, R.; Deng, X.; Gao, Y.; Chen, J. Does Regional Economic Development Drive Sustainable Grain Production Growth in China? Evidence from Spatiotemporal Perspective on Low-Carbon Total Factor Productivity. Socio-Econ. Plan. Sci. 2025, 98, 102129. [Google Scholar] [CrossRef] [Scilit]
  18. Lei, S.; Yang, X.; Qin, J. Does Agricultural Factor Misallocation Hinder Agricultural Green Production Efficiency? Evidence from China. Sci. Total Environ. 2023, 891, 164466. [Google Scholar] [CrossRef] [Scilit]
  19. Liu, D.; Zhu, X.; Wang, Y. China’s Agricultural Green Total Factor Productivity Based on Carbon Emission: An Analysis of Evolution Trend and Influencing Factors. J. Clean. Prod. 2021, 278, 123692. [Google Scholar] [CrossRef] [Scilit]
  20. Yang, Q.; Si, X.; Wang, J. The Measurement and Its Distribution Dynamic Evolution of Grain Production Efficiency in China under the Goal of Reducing Pollution Emissions and Increasing Carbon Sink. J. Nat. Resour. 2022, 37, 600. [Google Scholar] [CrossRef] [Scilit]
  21. Zhang, H.; Qin, Y.; Xu, J.; Ren, W. Analysis of the Evolution Characteristics and Impact Factors of Green Production Efficiency of Grain in China. Land 2023, 12, 852. [Google Scholar] [CrossRef] [Scilit]
  22. Zhou, Y.; Li, X.; Liu, Y. Rural Land System Reforms in China: History, Issues, Measures and Prospects. Land Use Policy 2020, 91, 104330. [Google Scholar] [CrossRef] [Scilit]
  23. Ma, G.; Dai, X.; Luo, Y. The Effect of Farmland Transfer on Agricultural Green Total Factor Productivity: Evidence from Rural China. Int. J. Environ. Res. Public Health 2023, 20, 2130. [Google Scholar] [CrossRef] [Scilit]
  24. Helfand, S.M.; Taylor, M.P.H. The Inverse Relationship between Farm Size and Productivity: Refocusing the Debate. Food Policy 2021, 99, 101977. [Google Scholar] [CrossRef] [Scilit]
  25. Kuang, Y.; Yang, J.; Abate, M.-C. Farmland Transfer and Agricultural Economic Growth Nexus in China: Agricultural TFP Intermediary Effect Perspective. China Agric. Econ. Rev. 2021, 14, 184–201. [Google Scholar] [CrossRef] [Scilit]
  26. Cao, A.; Guo, L.; Li, H. How Does Land Renting-in Affect Chemical Fertilizer Use? The Mediating Role of Land Scale and Land Fragmentation. J. Clean. Prod. 2022, 379, 134791. [Google Scholar] [CrossRef] [Scilit]
  27. Li, B.; Shen, Y. Effects of Land Transfer Quality on the Application of Organic Fertilizer by Large-Scale Farmers in China. Land Use Policy 2021, 100, 105124. [Google Scholar] [CrossRef] [Scilit]
  28. Quan, T.; Jia, W.; Quan, T.; Xu, Y. Impact of Farmers’ Participation in the Transformation of the Farmland Transfer Market on the Adoption of Agricultural Green Production Technologies. Agriculture 2024, 14, 1677. [Google Scholar] [CrossRef] [Scilit]
  29. Zou, Q.; Zhang, Z.; Yi, X.; Yin, C. The Direction of Promoting Smallholders’ Adoption of Agricultural Green Production Technologies in China. J. Clean. Prod. 2023, 415, 137734. [Google Scholar] [CrossRef] [Scilit]
  30. Ji, X.; Li, Z.; Zhang, Y. Influence of Rural Land Transfer on Agricultural Carbon Emissions and Its Spatial Characteristics. Resour. Sci. 2023, 45, 77–90. [Google Scholar] [CrossRef] [Scilit]
  31. Zhang, R.; Yang, R.; Huang, Y. Does the Marketization of Land Transfer Have an Impact on Carbon Emissions? Evidence from China. Front. Environ. Sci. 2022, 10, 1034273. [Google Scholar] [CrossRef] [Scilit]
  32. Bai, Z.; Zhang, X.; Xu, J.; Li, C. Can Farmland Transfer Reduce Fertilizer Nonpoint Source Pollution? Evidence from China. Land 2024, 13, 798. [Google Scholar] [CrossRef] [Scilit]
  33. Lu, H.; Xie, H. Impact of Changes in Labor Resources and Transfers of Land Use Rights on Agricultural Non-Point Source Pollution in Jiangsu Province, China. J. Environ. Manag. 2018, 207, 134–140. [Google Scholar] [CrossRef] [Scilit]
  34. Huo, C.; Chen, L. The Impact of Land Transfer Policy on Sustainable Agricultural Development in China. Sci. Rep. 2024, 14, 7064. [Google Scholar] [CrossRef] [Scilit]
  35. Xu, Y.; Huang, X.; Bao, H.X.H.; Ju, X.; Zhong, T.; Chen, Z.; Zhou, Y. Rural Land Rights Reform and Agro-Environmental Sustainability: Empirical Evidence from China. Land Use Policy 2018, 74, 73–87. [Google Scholar] [CrossRef] [Scilit]
  36. Gong, S.; Wang, B.; Yu, Z.; Cui, Z. Does Seed Industry Innovation in Developing Countries Contribute to Sustainable Development of Grain Green Production? Evidence from China. J. Clean. Prod. 2023, 406, 137029. [Google Scholar] [CrossRef] [Scilit]
  37. Sodoma, R.; Shmatkovska, T.; Dziamulych, M.; Vavdiiuk, N.; Kutsai, N.; Polishchuk, V. Economic Efficiency of the Land Resource Management and Agricultural Land-Use by Agricultural Producers. Manag. Theory Stud. Rural Bus. Infrastruct. Dev. 2021, 43, 524–535. [Google Scholar] [CrossRef] [Scilit]
  38. Deininger, K.; Byerlee, D. The Rise of Large Farms in Land Abundant Countries: Do They Have a Future? World Dev. 2012, 40, 701–714. [Google Scholar] [CrossRef] [Scilit]
  39. Shao, J.; Zhang, S.; Li, X. Effectiveness of Farmland Transfer in Alleviating Farmland Abandonment in Mountain Regions. J. Geogr. Sci. 2016, 26, 203–218. [Google Scholar] [CrossRef] [Scilit]
  40. He, X.; Liu, W. Coupling Coordination Analysis Between Farmland Transfer and Agricultural Eco-Efficiency in China. Agriculture 2024, 14, 2172. [Google Scholar] [CrossRef] [Scilit]
  41. Ntihinyurwa, P.D.; de Vries, W.T. Farmland Fragmentation, Farmland Consolidation and Food Security: Relationships, Research Lapses and Future Perspectives. Land 2021, 10, 129. [Google Scholar] [CrossRef] [Scilit]
  42. Wu, Y.; Zhang, W. The Impact of Land Transfer on Sustainable Agricultural Development from the Perspective of Green Total Factor Productivity. Sustainability 2024, 16, 7076. [Google Scholar] [CrossRef] [Scilit]
  43. Zang, D.; Yang, S.; Li, F. The Relationship between Land Transfer and Agricultural Green Production: A Collaborative Test Based on Theory and Data. Agriculture 2022, 12, 1824. [Google Scholar] [CrossRef] [Scilit]
  44. Wang, X. Managing Land Carrying Capacity: Key to Achieving Sustainable Production Systems for Food Security. Land 2022, 11, 484. [Google Scholar] [CrossRef] [Scilit]
  45. Chapagain, T.; Raizada, M.N. Agronomic Challenges and Opportunities for Smallholder Terrace Agriculture in Developing Countries. Front. Plant Sci. 2017, 8, 331. [Google Scholar] [CrossRef] [Scilit]
  46. Song, Y.; Fan, X.; Geng, P. Scale Operation and Green Development of Agriculture-Observations on Agricultural Green Total Factor Productivity. J. Huazhong Agri. Univ. (Soc. Sci. Ed.) 2024, 4, 57–70. [Google Scholar]
  47. Zhou, M.; Zhang, H.; Ke, N. Cultivated Land Transfer, Management Scale, and Cultivated Land Green Utilization Efficiency in China: Based on Intermediary and Threshold Models. Int. J. Environ. Res. Public Health 2022, 19, 12786. [Google Scholar] [CrossRef] [Scilit]
  48. Latruffe, L.; Piet, L. Does Land Fragmentation Affect Farm Performance? A Case Study from Brittany, France. Agric. Syst. 2014, 129, 68–80. [Google Scholar] [CrossRef] [Scilit]
  49. Qing, C.; Zhou, W.; Song, J.; Deng, X.; Xu, D. Impact of Outsourced Machinery Services on Farmers’ Green Production Behavior: Evidence from Chinese Rice Farmers. J. Environ. Manag. 2023, 327, 116843. [Google Scholar] [CrossRef] [Scilit] [PubMed]
  50. Liang, Y.; Wang, Y.; Sun, Y.; Ruan, J. Study on the Influence of Agricultural Scale Management Mode on Production Efficiency Based on Meta-Analysis. Land 2024, 13, 968. [Google Scholar] [CrossRef] [Scilit]
  51. Zhao, L.; Liu, Y.; Shi, J. The Environmental Performance of Agricultural Production Trusteeship from the Perspective of Planting Carbon Emissions. China Agric. Econ. Rev. 2023, 15, 853–870. [Google Scholar] [CrossRef] [Scilit]
  52. Kremen, C.; Miles, A. Ecosystem Services in Biologically Diversified versus Conventional Farming Systems: Benefits, Externalities, and Trade-Offs. Ecol. Soc. 2012, 17, 40. [Google Scholar] [CrossRef] [Scilit]
  53. Yang, X.; Zhou, X.; Deng, X. Modeling Farmers’ Adoption of Low-Carbon Agricultural Technology in Jianghan Plain, China: An Examination of the Theory of Planned Behavior. Technol. Forecast. Soc. Change 2022, 180, 121726. [Google Scholar] [CrossRef] [Scilit]
  54. Gao, Y.; Zhao, D.; Yu, L.; Yang, H. Influence of a New Agricultural Technology Extension Mode on Farmers’ Technology Adoption Behavior in China. J. Rural Stud. 2020, 76, 173–183. [Google Scholar] [CrossRef] [Scilit]
  55. Kwack, S.Y.; Sun, L.Y. Economies of Scale, Technological Progress, and the Sources of Economic Growth: Case of Korea, 1969–2000. J. Policy Model. 2005, 27, 265–283. [Google Scholar] [CrossRef] [Scilit]
  56. Zhang, Y.; Shao, T.; Dong, Q. Reassessing the Lewis Turning Point in China: Evidence from 70,000 Rural Households. China World Econ. 2018, 26, 4–17. [Google Scholar] [CrossRef] [Scilit]
  57. Wei, M.; Yan, T.; Luo, S. The lmpacts of Scale Management and Technological Progress on Green and Low-carbon Development of Agriculture: A Quasi-natural Experiment Based on the Establishment of Major Grain-producing Areas. Chin. Rural Econ. 2023, 41–65. [Google Scholar]
  58. Luo, X.; Feng, S.; Liu, H.; Zhao, B. Large-Scale Grain Producers’ Application of Land Conservation Technologies in China: Correlation Effects and Determinants. Sustainability 2019, 11, 441. [Google Scholar] [CrossRef] [Scilit]
  59. Tone, K.; Tsutsui, M. An Epsilon-Based Measure of Efficiency in DEA Revisited-A Third Pole of Technical Efficiency. GRIPS Discuss. Pap. 2010, 207, 1554–1563. [Google Scholar]
  60. Zhonglin, W.E.N.; Baojuan, Y.E. Analyses of Mediating Effects: The Development of Methods and Models. Adv. Psychol. Sci. 2014, 22, 731. [Google Scholar] [CrossRef] [Scilit]
  61. Fang, L.; Hu, R.; Mao, H.; Chen, S. How Crop Insurance Influences Agricultural Green Total Factor Productivity: Evidence from Chinese Farmers. J. Clean. Prod. 2021, 321, 128977. [Google Scholar] [CrossRef] [Scilit]
  62. Zhang, J.; Zhang, P.; Liu, Y.; Lu, S.; Wu, G. An Analysis of the Spatiotemporal Evolution and Driving Force of Cultivated Land Green Utilization in Karst Region of Southwest China. J. Clean. Prod. 2024, 434, 140002. [Google Scholar] [CrossRef] [Scilit]
  63. Fang, Y.-L.; Zeng, X.-L. Evaluation and Improvement of Agricultural Eco-Efficiency in China. J. Agric. Resour. Environ. 2021, 38, 135–142. [Google Scholar]
  64. Du, K.; Li, P.; Yan, Z. Do Green Technology Innovations Contribute to Carbon Dioxide Emission Reduction? Empirical Evidence from Patent Data. Technol. Forecast. Soc. Change 2019, 146, 297–303. [Google Scholar] [CrossRef] [Scilit]
  65. Hodge, I.; Hauck, J.; Bonn, A. The alignment of agricultural and nature conservation policies in the European Union. Conserv. Biol. 2015, 29, 996–1005. [Google Scholar] [CrossRef] [Scilit]
  66. Fuhrmann-Aoyagi, M.B.; Miura, K.; Watanabe, K. Sustainability in Japan’s Agriculture: An Analysis of Current Approaches. Sustainability 2024, 16, 596. [Google Scholar] [CrossRef] [Scilit]
  67. Jiang, X.; Lu, X.; Gong, M. Assessing the Effects of Land Transfer Marketization on Green Total Factor Productivity from the Perspective of Resource Allocation: Evidence from China. Front. Environ. Sci. 2022, 10, 1–15. [Google Scholar] [CrossRef] [Scilit]
  68. Adenuga, A.H.; Jack, C.; McCarry, R. The Case for Long-Term Land Leasing: A Review of the Empirical Literature. Land 2021, 10, 238. [Google Scholar] [CrossRef] [Scilit]
  69. Kim, P.H. The East Asian Welfare State Debate and Surrogate Social Policy: An Exploratory Study on Japan and South Korea. Socioecon. Rev. 2010, 8, 411–435. [Google Scholar] [CrossRef] [Scilit]
  70. Fayet, C.M.J.; Reilly, K.H.; Van Ham, C.; Verburg, P.H. The Potential of European Abandoned Agricultural Lands to Contribute to the Green Deal Objectives: Policy Perspectives. Environ. Sci. Policy 2022, 133, 44–53. [Google Scholar] [CrossRef] [Scilit]
Figure 1. Theoretical Framework.
Sustainability 18 00441 g001
Figure 2. Delineation of Grain Functional Areas in China.
Sustainability 18 00441 g002
Figure 3. Evolution trend of GGTFP in China and at regional level.
Sustainability 18 00441 g003
Figure 4. Spatial distribution of GGTFP at the provincial level in China: (a) 2006 year; (b) 2011 year; (c) 2016 year; (d) 2021 year.
Sustainability 18 00441 g004
Figure 5. Changes in the regression coefficient of the interaction term before and after the key nodes of the cultivated transfer policy.
Sustainability 18 00441 g005
Table 1. Index system for calculating GGTFP.
Indicator SystemSpecific IndicatorsVariable DescriptionUnit
InputsLandSown area of grain crops103 hm2
LaborEmployees in the primary industry *b104 person
MechanicalTotal labor force for agricultural machinery *a104 kW
FertilizerAgricultural fertilizer pure amount *at
PesticidePesticide application rate *at
Agricultural filmAgricultural plastic film usage *at
Water ResourcesEffective irrigation area *a103 hm2
Expected outputsGrain outputsTotal grain production104 t
Environmental OutputCarbon sink104 t
Unexpected outputsCarbon emissions from grain productionTotal carbon emissions104 t
Non-point source pollutionNitrogen and phosphorus loss in fertilizers, pesticide losses and agricultural film residues104 t
Note: a = grain sowing area/crop sowing area, b = (agricultural output value/total output value of agriculture, forestry, animal husbandry and fishery), * (grain sowing area/crop sowing area).
Table 2. Variable definitions and descriptive statistics.
Variable TypesVariable NameVariable DescriptionMeanStd
Explained variableGGTFPEBM measured0.7370.161
Explanatory variablesCultivated land transfer areaThe total area of household contracted farmland transferred each year in each province (105 hm2)0.7870.871
Mediating variablesLand scale managementCrop planting area/Agricultural employees (hm2·person−1)0.7270.398
Service scale operationOutput value of agricultural services/Number of people employed in agriculture (104 yuan·person−1)0.1060.096
Green production technologyTotal number of agricultural green patent applications (logarithm)4.3851.312
Control variablesProportion of affected areaAffected area/crop planting area0.1820.145
Multiple cropping indexCrop sowing area/arable land area1.2990.407
Agricultural machinery densityTotal power of agricultural machinery/crop planting area (kw/hm2)6.2352.511
Effective irrigation rateEffective irrigation area/cultivated land area0.5500.246
Agricultural planting structureGrain sowing area/crop sowing area0.6590.142
Regional economic development levelGDP per capita, deflated to 2006 base year (104 yuan)4.0662.553
The level of agricultural opening upTotal import and export of agricultural products (104 yuan)0.0400.057
Instrumental variablesInstrumental variables for cultivated land transfer(Number of households implementing the household contract responsibility system in each province in 1983/Total number of farm households in each province in 1983) × (Total area of farmland contracted by households in each province/Total area of farmland contracted by households in each province)0.2520.170
Table 3. Regression results of the impact of cultivated land transfer on GGTFP.
(1)(2)(3)(4)(5)(6)(7)(8)
Cultivated land transfer area0.045 ***0.046 ***0.046 ***0.049 ***0.048 ***0.041 ***0.040 ***0.041 ***
(5.701)(6.006)(6.052)(7.055)(7.032)(5.197)(5.063)(5.194)
Proportion of affected area −0.143 ***−0.147 ***−0.148 ***−0.148 ***−0.153 ***−0.152 ***−0.148 ***
(−5.139)(−5.286)(−5.933)(−5.923)(−6.108)(−6.030)(−5.883)
Multiple cropping index −0.035 *−0.052 ***−0.041 *−0.037 *−0.039 *−0.036 *
(−1.816)(−3.011)(−1.912)(−1.740)(−1.780)(−1.671)
Agricultural machinery density −0.027 ***−0.027 ***−0.024 ***−0.024 ***−0.024 ***
(−10.335)(−10.000)(−8.016)(−8.022)(−7.833)
Effective irrigation rate −0.039−0.051−0.048−0.037
(−0.916)(−1.177)(−1.078)(−0.827)
Agricultural planting structure 0.184 *0.192 **0.151
(1.945)(1.978)(1.534)
Regional economic development level −0.0020.006
(−0.370)(1.077)
The level of agricultural opening up −0.341 **
(−2.162)
_cons0.639 ***0.672 ***0.712 ***0.976 ***0.991 ***0.854 ***0.858 ***0.847 ***
(33.569)(34.210)(24.251)(26.494)(24.672)(10.551)(10.493)(10.378)
Individual fixed effectsControlControlControlControlControlControlControlControl
Year fixed effectsControlControlControlControlControlControlControlControl
N510510510510510510510510
Note: Standard errors are shown in brackets, *, **, and *** indicate significance at the 10%, 5%, and 1% levels, respectively.
Table 4. Endogeneity test results.
(1)(2)(3)(4)
Phase 1Phase 2GGTFPGGTFP
Instrumental variables4.344 ***
(0.263)
Cultivated land transfer area 0.062 ***
(0.014)
Treati × postt 0.069 ***0.069 ***
(2.649)(2.953)
_cons−1.586 ***0.853 ***
(0.204)(0.053)
Control variableControlControl Control
Individual fixed effectsControlControlControlControl
Year fixed effectsControlControlControlControl
N510510510510
Note: Standard errors are shown in brackets, *** indicates significance at the 1% levels.
Table 5. Evolution of regression trend of cultivated transfer policy effects.
CoefSt. Errt-Valuep-Value95% Conf. Interval
Before60.0000.0170.0000.998−0.0360.036
Before50.0130.0131.0400.305−0.0130.039
Before4−0.0200.014−1.4600.155−0.0470.008
Before3−0.0010.012−0.1200.907−0.0270.024
Before2−0.0100.007−1.3700.182−0.0250.005
Current0.0150.0052.7000.0110.0040.026
After10.0040.0090.4200.678−0.0140.021
After20.0140.0071.9400.062−0.0010.029
After30.0240.0122.0400.0510.0000.049
After40.0390.0142.7400.0100.0100.068
After50.0590.0144.1900.0000.0300.088
After60.1310.0187.3900.0000.0950.167
_cons0.6980.00890.2400.0000.6820.714
Table 6. Robustness test results.
(1)
Lag (t − 1)
(2)
Lag (t − 2)
(3)
Lag (t − 3)
(4)
Modify the Study Period
(5)
Modify the Study Area
CTR0.040 ***0.032 ***0.027 ***0.042 ***0.049 ***
(5.090)(4.090)(3.367)(5.091)(5.315)
_cons0.851 ***0.879 ***0.847 ***0.824 ***1.004 ***
(10.504)(10.456)(9.689)(9.737)(8.167)
Control variableControlControlControlControlControl
Individual fixed effectsControlControlControlControlControl
Year fixed effectsControlControlControlControlControl
N480450420480442
Note: Standard errors are shown in brackets, *** indicates significance at the 1% levels.
Table 7. Heterogeneity analysis results.
(1)
GPAs
(2)
GMAs
(3)
PMBAs
(4)
Eastern Region
(5)
Central Region
(6)
Western Region
Cultivated land transfer area0.024 **−0.0810.218 ***0.033 ***0.019 *0.159 **
(2.47)(−1.46)(5.26)(3.02)(1.79)(6.25)
_cons1.060 ***0.907 ***0.557 ***0.703 ***0.657 ***1.026 ***
(7.55)(7.36)(2.54)(7.58)(3.37)(5.13)
Control variableControlControlControlControlControlControl
Individual fixed effectsControlControlControlControlControlControl
Year fixed effectsControlControlControlControlControlControl
N221119170187136187
Note: Standard errors are shown in brackets, *, **, and *** indicate significance at the 10%, 5%, and 1% levels, respectively.
Table 8. Regression results from a nonlinear connection test.
(1)(2)
Benchmark RegressionNonlinear Regression
Cultivated land transfer area0.041 ***0.076 ***
(5.194)(4.650)
The square of the cultivated land transfer area −0.009 ***
(−2.420)
_cons0.847 ***0.852 ***
(10.378)(10.506)
Control variableControlControl
Individual fixed effectsControlControl
Year fixed effectsControlControl
N510510
Note: Standard errors are shown in brackets, *** indicates significance at the 1% levels.
Table 9. Test results of the scale management mechanism.
(1)(2)(3)(4)
Land Scale ManagementGGTFPService Scale OperationGGTFP
Cultivated land transfer area0.146 ***0.024 ***0.027 **0.039 ***
(3.892)(2.653)(2.205)(4.817)
Land scale management 0.144 ***
(5.107)
Service scale operation 0.293 ***
(4.553)
_cons0.4630.766 ***−0.0320.901 ***
(1.413)(10.076)(−0.212)(9.904)
Control variableControlControlControlControl
Individual fixed effectsControlControlControlControl
Year fixed effectsControlControlControlControl
N510510510510
Note: Standard errors are shown in brackets, ** and *** indicate significance at the 5% and 1% levels, respectively.
Table 10. Test results of green production technology mechanism.
(1)(2)
Green Production TechnologyGGTFP
Cultivated land transfer area0.470 **0.041 ***
(2.702)(5.166)
Green production technology 0.015 **
(2.562)
_cons4.369 ***0.782 ***
(3.366)(9.176)
Control variableControlControl
Individual fixed effectsControlControl
Year fixed effectsControlControl
N510510
Note: Standard errors are shown in brackets, ** and *** indicate significance at the 5% and 1% levels, respectively.
Table 11. Test results of the synergistic mechanism.
(1)(2)(3)(4)
Land Scale ManagementGreen Production TechnologyService Scale OperationGreen Production Technology
Land scale management 0.869 *
(1.992)
Service scale operation 3.419 ***
(4.493)
0.045 * 0.027 ***
Green production technology(1.772) (3.363)
_cons−0.2772.505 *−0.218 *2.829 *
(−0.745)(1.724)(−1.756)(1.960)
Control variableControlControlControlControl
Individual fixed effectsControlControlControlControl
Year fixed effectsControlControlControlControl
N510510510510
Note: Standard errors are shown in brackets, * and *** indicate significance at the 10% and 1% levels, respectively.
Disclaimer/Publisher’s Note: The statements, opinions and data contained in all publications are solely those of the individual author(s) and contributor(s) and not of MDPI and/or the editor(s). MDPI and/or the editor(s) disclaim responsibility for any injury to people or property resulting from any ideas, methods, instructions or products referred to in the content.