Abstract
Land use change is a critical factor influencing regional carbon emissions, and understanding its spatiotemporal variability is essential for supporting science-based emission-reduction strategies. In this study, we constructed an improved measurement framework by integrating high-resolution land use data, gridded anthropogenic carbon emission data, multi-source remote sensing indicators, and socioeconomic variables to quantify land use carbon emissions (LUCEs) in the Chengdu–Chongqing Urban Agglomeration (CCUA) from 2000 to 2022. We analyzed the temporal trends and spatial clustering of carbon emissions using the Mann–Kendall (MK) trend test and global/local Moran’s I statistics, and further explored the driving mechanisms through the Geodetector (GD) model, including both single-factor explanatory power and two-factor interaction effects. The results show that total LUCEs in the CCEC increased continuously during the study period, with significant spatial clustering characterized by high–high emission hotspots in the core areas of Chengdu and Chongqing and low–low clusters in western mountainous regions. Socioeconomic factors played a dominant role in shaping emission patterns, with construction land proportion, nighttime light intensity, and population density identified as the strongest drivers. Interaction detection revealed nonlinear enhancement effects among key socioeconomic variables, indicating an increasing spatial lock-in of human activities on carbon emissions. These findings provide scientific evidence for optimizing land use structure and formulating region-specific low-carbon development policies in rapidly urbanizing megaregions.
1. Introduction
Since the Industrial Revolution, the combustion of fossil fuels has propelled unprecedented economic expansion while elevating atmospheric CO2 concentrations to levels unseen in human history. Over the past decade, global temperatures have risen by about 1.1 °C above pre-industrial averages, with energy and land use activities accounting for roughly 80% of the surge in greenhouse gas emissions, according to United Nations Environment Programme assessments. Land use changes represent a primary conduit for human impacts on terrestrial carbon cycles and a key modulator of regional emission profiles [1,2]. Thus, rigorous quantification of land use carbon emissions (LUCEs), coupled with a clear understanding of their spatiotemporal dynamics and underlying drivers, is essential for informed spatial planning and the design of targeted mitigation strategies [3,4].
LUCEs have long been a central topic in global climate-change research. Existing studies generally proceed at three levels. First, in carbon-emission accounting, scholars typically estimate emissions using the emission-factor method, remote-sensing inversion, or life-cycle assessment based on land use structure, vegetation cover, and energy statistics [5,6,7,8]. Second, numerous studies leverage these accounting results to analyze the spatiotemporal evolution of emissions, identify contribution pathways of land use change to regional emissions, and delineate high-emission clusters and trends through spatial analysis techniques [9,10,11,12]. Third, building on these foundations, researchers explore driving factors from natural, social, and economic dimensions, employing methods such as Logarithmic Mean Divisia Index (LMDI) decomposition, regression analysis, or Geographically and Temporally Weighted Regression (GTWR) to reveal factor importance and spatial heterogeneity [13,14,15,16]. Despite these advances, several limitations remain. In emission accounting, many studies depend on statistical data or single-source land-cover datasets, which makes it difficult to produce high-resolution emission patterns that simultaneously reflect both land use dynamics and the intensity of human activity. Although some efforts have begun integrating remote sensing with emission inventories, systematic regional-scale application of high-resolution products such as the Open-Data Inventory for Anthropogenic Carbon Dioxide (ODIAC) is still rare. In driver identification, conventional LMDI, regression and GTWR models effectively capture linear relationships and spatial variation but are less adept at detecting nonlinear enhancement and complex interaction mechanisms among multiple factors, limiting their ability to explain emission changes during rapid land use transitions [17,18,19,20]. These gaps underscore the urgent need for analytical tools that can simultaneously identify the sources of spatial heterogeneity, characterize nonlinear associations, and quantify interaction enhancement effects. The Geographical Detector (GD) model offers distinct advantages in this regard: it requires no assumption of linearity, can detect both single-factor contributions and bi-factor interaction enhancement, and readily handles discretized spatial data, rendering it particularly well-suited to disentangling driving mechanisms in complex human–environment systems [21,22]. Consequently, key research gaps persist: the absence of high-precision land use carbon-emission accounting systems based on multi-source data integration, the lack of comprehensive spatiotemporal frameworks that simultaneously capture temporal trends, spatial clustering, and statistical significance, and the insufficient systematic evaluation of multifactor interaction effects. To address these shortcomings, an empirical study in a representative region is essential to test the applicability and effectiveness of multi-source data fusion for emission accounting and interaction-based driver analysis.
The Chengdu–Chongqing Urban Agglomeration (CCUA) has experienced rapid urbanization and profound land use restructuring in recent years, characterized by substantial expansion of construction land and continuous reconfiguration of ecological land. These processes have rendered regional land use carbon emissions highly sensitive [23,24]. As China’s strategically designated “fourth growth pole”, the region is poised to encounter even more intense land use transformations in the future, which will inevitably exert greater upward pressure on carbon emissions. Consequently, high-precision accounting of land use carbon emissions, characterization of their spatiotemporal dynamics, and elucidation of underlying driving mechanisms in this region are essential for advancing China’s dual-carbon goals and informing territorial spatial planning. Accordingly, this study takes the CCUA as its focal area and proceeds as follows. First, we develop a multi-source accounting framework that integrates China’s Annual Land Cover Dataset (CLCD), the ODIAC, remote-sensing indices, and socioeconomic statistics to substantially enhance the accuracy of land use carbon-emission estimation. Second, employing Mann–Kendall (MK) trend tests and spatial autocorrelation analysis, we systematically characterize the spatiotemporal patterns of carbon emissions across three integrated dimensions: temporal trends, spatial clustering, and statistical significance. Third, we apply the Geographical Detector (GD) model to quantify the individual contributions of natural and socioeconomic factors as well as their interaction effects, thereby revealing the complex mechanisms through which land use change drives carbon emissions under rapid urbanization. The principal innovations of this study are threefold. First, we establish a high-precision LUCEs accounting system grounded in multi-source data fusion. Second, we propose an integrated “trend–clustering–significance” analytical framework for spatiotemporal evolution. Third, using the GD model, we systematically uncover nonlinear enhancement and interaction mechanisms among multiple drivers, thereby offering a novel and transferable analytical paradigm for LUCEs research in highly dynamic urbanizing regions.
2. Materials and Methods
2.1. Technical Roadmap
The technical workflow of this study is depicted in Figure 1 and comprises the following steps: 1. Data Acquisition and Preprocessing: Boundary data of the CCUA were integrated with land use data, carbon emissions data, and driving factor datasets spanning the study period. Essential preprocessing steps, including geometric correction and raster alignment, were applied to ensure spatial consistency. Driving factors encompassed elevation, temperature, population density, slope, construction land distribution, nighttime lights, and Normalized Difference Vegetation Index (NDVI), derived from multi-source remote sensing imagery to minimize data gaps and enhance analytical accuracy. 2. Spatiotemporal Patterns of LUCEs: Land use changes were mapped to reveal spatial transitions across the economic zone, while temporal dynamics of LUCEs were quantified through time-series aggregation. This step employed trend analysis to capture evolutionary patterns, providing a foundational understanding of emission hotspots and trajectories over time. 3. Changes in LUCEs: Variations in land use were assessed alongside spatial trends in carbon emissions using the Mann–Kendall (MK) test for detecting monotonic changes and significance. Spatial clustering characteristics were further explored via Moran’s I index to identify autocorrelation and aggregation patterns, elucidating the heterogeneity and concentration of emission changes within the study area. 4. GD Model: The model was applied to dissect driving factors’ influences on LUCEs. Specifically, the Factor Detector measured the explanatory power (q-value) of individual factors, while the Interaction Detector evaluated pairwise synergies or enhancements between factors. The results were visualized through q-value distributions to quantify and summarize the dominant drivers across single- and two-factor scenarios, enabling targeted insights into emission mechanisms in the CCUA.
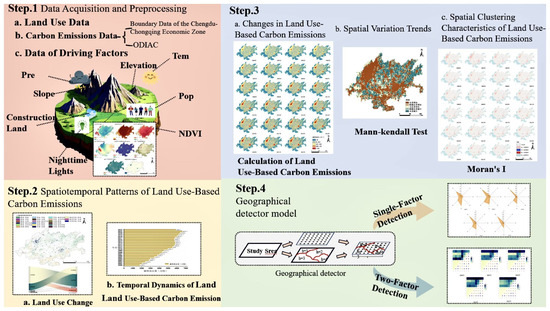
Figure 1.
Research framework diagram.
2.2. Study Area
The CCUA stands as the unique national urban cluster that bridges provincial borders in China’s western interior, positioned between latitudes 28°10′ N and 32°03′ N, and longitudes 103°30′ E and 110°12′ E. This area incorporates the complete jurisdiction of Chongqing Municipality, featuring 38 districts and counties, plus 15 municipal-level divisions in Sichuan Province, such as Chengdu, Mianyang, and Luzhou, encompassing roughly 185,000 square kilometers, as depicted in Figure 2. As of 2024, the CCUA’s gross domestic product climbed to 8.6 trillion CNY, representing approximately 6.5% of China’s overall economic output. Its economic output per unit area advanced to about 46.5 million CNY per square kilometer, reflecting a rise of over 10% since 2021 and demonstrating the powerful synergy from its paired growth hubs. As a critical nexus of the Belt and Road Initiative and the Yangtze River Economic Belt (YREB), the CCUA consistently ranks among the highest in western China for energy consumption, with a total of 487 million tons of standard coal equivalent in 2021, representing 34.6% of the region’s energy use. Industrial energy consumption, driven primarily by sectors such as electronics, information technology, and equipment manufacturing, accounts for over 60% of this total. The carbon emission intensity of the CCUA (0.82 tons CO2/10,000 CNY GDP) is 20.6% higher than the national average (0.68 tons CO2/10,000 CNY GDP). Rapid industrialization and urbanization have led to the expansion of construction land and the encroachment on ecological spaces, resulting in a distinctive pattern of “high-carbon lock-in” coexisting with efforts toward “low-carbon transition”. The selection of the CCUA as the study area provides a critical case for analyzing the carbon metabolism dynamics of human–land systems in western China’s inland urban agglomerations.
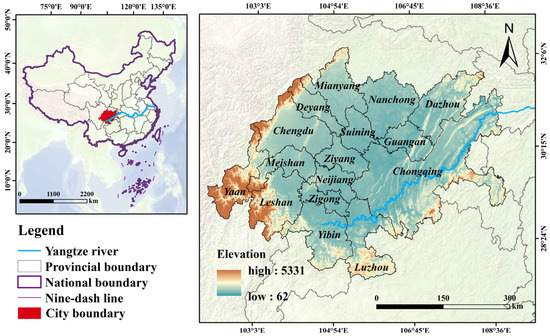
Figure 2.
Geographic location of the study area.
2.3. Research Methods
2.3.1. LUCEs Calculation
Carbon emission assessments typically encompass two dimensions: direct and indirect carbon emissions [25]. Direct carbon emissions arise from natural system carbon cycling processes, primarily associated with land use types such as cropland, forestland, grassland, water, and unused land [26]. Indirect carbon emissions stem from socioeconomic activities, particularly energy consumption linked to various land use types (e.g., construction land and cropland) [27]. This assessment framework comprehensively reflects the impact of different land use types on regional carbon budgets, providing a scientific basis for sustainable development decision-making [10].
Direct carbon emissions were calculated based on grid-scale land use classification data and corresponding carbon emission coefficients [28]. The investigated region was partitioned into 4 km by 4 km raster units, with each unit featuring diverse ratios of land cover categories. Factors for emissions per square unit across different land cover forms, derived from prior investigations, are listed in Table 1. Aggregate direct carbon outputs across the entire investigated zone were derived through the subsequent formula:
where Ed represents the total direct carbon emissions in the study area (t); Eg,i is the carbon emissions from land use type i in grid g (t); Ag,i is the area of land use type i in grid g (hm2); Ti is the carbon emission coefficient for land use type i (t hm−2 a−1); and G is the total number of grids in the study area.
Indirect carbon emissions were assessed using the ODIAC high-resolution data product [29]. This dataset integrates nighttime light remote sensing data with energy statistics to construct a global fossil fuel carbon emission spatial distribution model at a 1 km × 1 km resolution [26]. Based on grid-scale analysis, the total annual indirect carbon emissions were calculated as follows:
where Ei represents the total annual indirect carbon emissions in the study area (t); Mg,j is the carbon emissions in grid g for month j(t); and G is the total number of grids in the study area.

Table 1.
Carbon sequestration coefficients for different land use types.
Table 1.
Carbon sequestration coefficients for different land use types.
| Land Use Type | Carbon Emission Factor/t·hm2·a−1 | Reference Source |
|---|---|---|
| Cropland | 0.4220 | [30,31] |
| Forestland | −0.6440 | [32,33,34] |
| Grassland | −0.0253 | [35,36] |
| Water | −0.0210 | [13,37] |
| Unused land | −0.0050 | [38,39] |
2.3.2. MK Test
The MK test, a non-parametric statistical method, is widely used in environmental science for time-series trend analysis due to its robustness against non-normal data distributions and outliers [40,41]. This method analyzes the time-series data of LUCEs (V1, V2, …, Vₙ) to assess trend direction and statistical significance.
The test involves two core steps. First, a rank sequence is constructed through ordered comparisons of sequence elements, characterized by the cumulative statistic S. Specifically, for any time point 1 ≤ i ≤ n, the values at subsequent time points are compared, and the sign function values are summed to form a statistic representing the overall trend direction:
For sample sizes n ≥ 10, the statistic S approximates a normal distribution. A standardized test statistic Z is then constructed as follows:
The variance term Var(S) accounts for potential autocorrelation in the sequence and is calculated as follows:
where m is the number of tied groups, and tk is the number of ties in the k-th group. At a significance level of α = 0.05, the critical value is |Z| > 1.96, based on the standard normal distribution, indicating a significant trend in the time-series data. The sign of Z denotes the trend direction (positive for an increasing trend, negative for a decreasing trend), enabling the MK test to simultaneously identify trend direction and assess statistical significance.
2.3.3. Evaluation of Spatial Autocorrelation
The examination of spatial autocorrelation covers both broad-scale and fine-scale perspectives. Broad-scale spatial autocorrelation is measured through the Global Moran’s I index, which helps determine the general layout of variable values throughout the researched zone [42,43]. The formula for this is presented below:
where n is the number of spatial units; Zi and Zj represent the attribute values of spatial units i and j, respectively; Wij is the spatial weight matrix, which characterizes the adjacency relationships between spatial units; and Z is the mean of the attribute values across all spatial units.
Local spatial autocorrelation is evaluated using the Local Moran’s I statistic to identify spatial heterogeneity, enabling precise detection of local clusters, dispersed areas, and spatial outliers. The calculation is expressed as follows:
where n is the number of spatial units; Xi and Xj are the attribute values of spatial units i and j, respectively; and Wij is the spatial weight matrix.
2.3.4. GD Model
The GD framework evaluates the degree to which predictor variables account for geographic variations in outcome variables, highlighting the fundamental links among driver elements and essential metrics for achieving carbon balance, including absorption potential and emission rates, with an emphasis on their dynamics over space and time [44,45]. This study employs the factor detection module to systematically assess the influencing factors of regional land use carbon emissions from two perspectives: single-factor influence analysis and dual-factor interaction effects [44,46].
- (1)
- Single-Factor Detection
Single-factor detection assesses the consistency between influencing factors and the spatial patterns of carbon emissions, evaluating the independent explanatory power of each factor on the carbon neutrality process [47,48]. Based on the principle of stratified heterogeneity, the study area is divided into spatial strata according to the attribute values of influencing factors. The explanatory power of each factor is quantified using the q-statistic:
where L is the number of strata; Nh and σ2h are the sample size and variance of the ℎ-th stratum, respectively; and N and σ2 are the total sample size and overall variance of the study area, respectively. The q-value ranges from [0, 1], with higher values indicating greater explanatory power of the factor on the spatial differentiation of LUCEs. A q-value approaching 0 suggests negligible explanatory power.
- (2)
- Dual-Factor Interaction Detection
Dual-factor interaction detection examines the nonlinear enhancement effects of pairwise driving factors on carbon neutrality [49]. By comparing the q-value of the interaction between two factors (X1 and X2) with the q-values of their individual effects, the interaction type is determined as follows:
- Nonlinear Enhancement: If q(X1∩X2) > q(X1) + q(X2), the interaction of the two factors significantly amplifies their combined explanatory power beyond the sum of their individual contributions. For example, the synergistic effect of urban expansion and economic agglomeration markedly intensifies carbon emissions.
- Synergistic Enhancement: If q(X1∩X2) > max(q(X1), q(X2)), the two factors exhibit complementary driving effects.
- Independent or Linear Superposition: In other cases, the factors show no significant interaction or only linear additive effects.
2.4. Information Origins and Handling
This research incorporates datasets covering terrain utilization, fundamental spatial details, CO2 output records, and elements affecting these, as all outlined in Table 2. Based on prior studies and data availability, variables relevant to LUCEs in the study area were selected to evaluate their influence mechanisms [50,51]. For the GD analysis, influencing factors were classified into five categories using the natural breaks method. All raster data were standardized to a 1 km resolution, and the coordinate system was unified to WGS_1984_UTM_Zone_48N. The spatial distribution of influencing factors is presented in Figure 3.
Table 2.
Data types and sources.
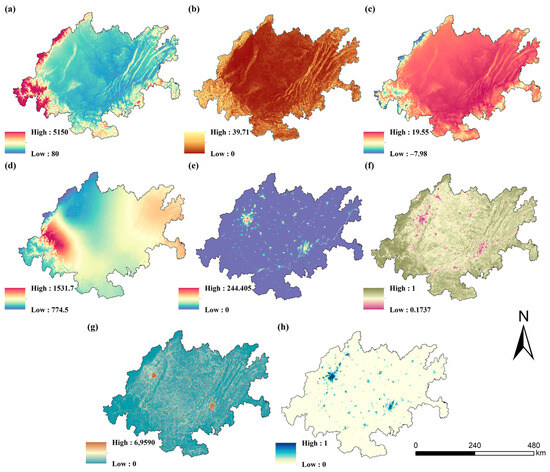
Figure 3.
Spatial distribution map of influencing factors: (a) elevation, (b) slope, (c) annual mean temperature, (d) annual precipitation, (e) nighttime light intensity, (f) NDVI, (g) population density, and (h) proportion of construction land.
3. Results
3.1. Spatiotemporal Characteristics of LUCEs
3.1.1. Land Use Change
Spanning 2000 through to 2022, the primary land cover forms within the CCUA included arable fields, wooded areas, and urbanized zones, which combined to represent over 94% of the overall territory, as depicted in Figure 4. Over this 22-year period, the areas of different land use types exhibited a dynamic interplay, characterized by an overall pattern of continuous cropland loss, an initial decline in forest land followed by recovery, and a rapid expansion of construction land. The period from 2000 to 2010 experienced the most intense land use changes. Cropland area declined from 11.79 × 10⁴ km2 in 2000 to 10.83 × 10⁴ km2 in 2010, resulting in a cumulative net loss of approximately 0.96 × 10⁴ km2. Approximately 56.55% of this lost cropland was converted to forest land, amounting to a transfer of 8.32 × 10⁴ km2, largely attributable to the large-scale implementation of the Grain-for-Green Program at the start of the century. During the same period, construction land expanded rapidly from 0.20 × 10⁴ km2 to 0.35 × 10⁴ km2, representing an increase of 75.17%. Cropland served as the primary source, contributing a transfer area of 4.84 × 10⁴ km2 concentrated in the outward expansion zones of the built-up areas of Chengdu and Chongqing. From 2010 to 2019, the intensity of land use change moderated. Cropland area continued to decrease to 10.18 × 10⁴ km2, with an average annual reduction of approximately 0.07 × 10⁴ km2. Forest land recovered from 9.71 × 10⁴ km2 in 2010 to 9.97 × 10⁴ km2 in 2019, an increase of approximately 2.7%, reflecting the sustained effects of the Grain-for-Green policy. Construction land maintained strong growth, rising from 0.35 × 10⁴ km2 to 0.51 × 10⁴ km2, equivalent to an increase of 45.71%, with cropland remaining the dominant source and contributing approximately 1.08 × 10⁴ km2. After 2019, under the combined constraints of the permanent basic farmland protection redline and a new phase of the Grain-for-Green initiative, the conversion of cropland to construction land was effectively restrained. Construction land increased only slightly from 0.51 × 10⁴ km2 in 2019 to 0.53 × 10⁴ km2 in 2022, with the annual growth rate dropping below 1.3%. Forest land expanded further to 10.12 × 10⁴ km2, with most new forest area derived from the conversion of cropland and grassland in the mountainous regions of northeast Sichuan and northeast Chongqing.
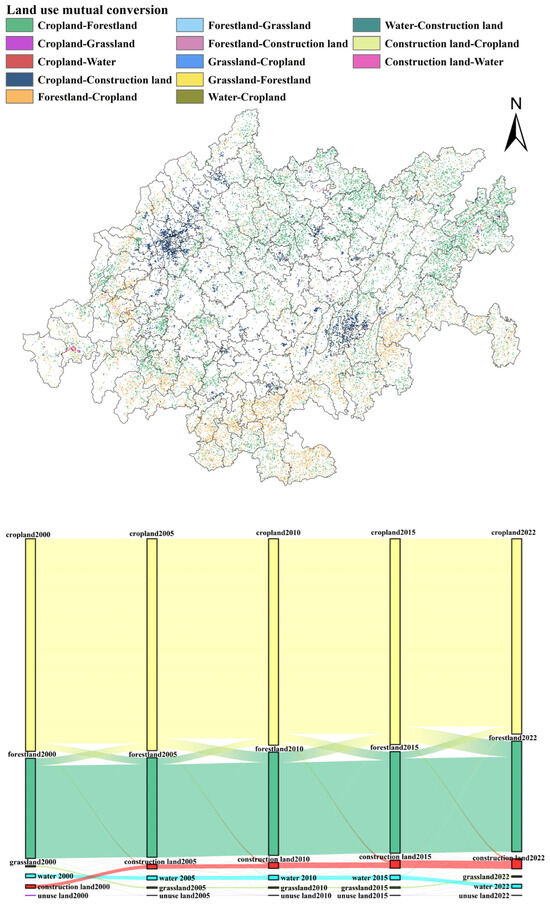
Figure 4.
Land use change in CCUA from 2000 to 2022.
Overall, between 2000 and 2022, the CCUA recorded a cumulative net loss of 1.61 × 10⁴ km2 of cropland, a net gain of 0.41 × 10⁴ km2 of forest land, and a net increase of 0.33 × 10⁴ km2 of construction land. Spatially, the conversion of cropland to forest land was concentrated primarily in the hilly and mountainous areas of northeast Sichuan and the Wanzhou–Zhongxian region of Chongqing, whereas conversion of cropland to construction land was highly concentrated on the Chengdu Plain and the periphery of Chongqing’s main metropolitan area. This resulted in a pronounced spatial differentiation pattern whereby ecological restoration through afforestation occurred predominantly in mountainous regions, while urban and construction expansion was largely confined to the plains.
3.1.2. Temporal Trends in LUCEs
As shown in Figure 5, the total LUCEs in the CCUA exhibited an overall increasing trend from 2000 to 2022, rising from 17.951 million tons in 2000 to 59.037 million tons in 2022. However, the growth rate decelerated, with the annual average growth rate of total carbon emissions dropping significantly from 10.2% during 2000–2012 to 1.5% during 2012–2022. This slowdown may be attributed to the accelerated establishment of pollution prevention systems and energy infrastructure, as outlined in the CCUA Regional Plan [52,53]. Notably, carbon emission growth rebounded between 2017 and 2021, peaking at 66.251 million tons in 2021, likely driven by accelerated urban built-up area expansion and increased energy consumption. A significant decline of 10.9% in 2022 suggests the effectiveness of the implemented carbon reduction policies [54,55,56].
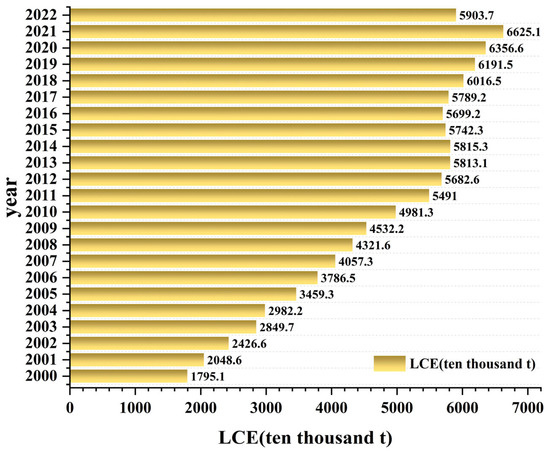
Figure 5.
The temporal variations in land carbon emissions in the CCUA from 2000 to 2022.
3.1.3. Spatial Patterns of LUCEs
Based on the actual conditions of the study area, the natural breaks method, and relevant studies, LUCEs in the CCUA were classified into five categories: carbon absorption zones (<0 t), low-carbon emission zones (0–0.3 million t), medium-carbon emission zones (0.3–0.8 million t), high-carbon emission zones (0.8–1.8 million t), and ultra-high-carbon emission zones (>1.8 million t) (Figure 6) [57,58]. From 2000 to 2022, the overall spatial distribution of LUCEs remained relatively stable, with the area of ultra-high emission zones continuously expanding [59,60]. Ultra-high carbon emission zones formed dual polarization centers in the main urban areas of Chengdu and Chongqing. Spatially, these zones expanded outward from urban construction land, spreading along the Chengdu–Chongqing midline transportation corridor and the YREB. This expansion transformed adjacent medium-carbon emission zones into high or ultra-high emission zones, aligning closely with the trend of construction land expansion [61,62,63].
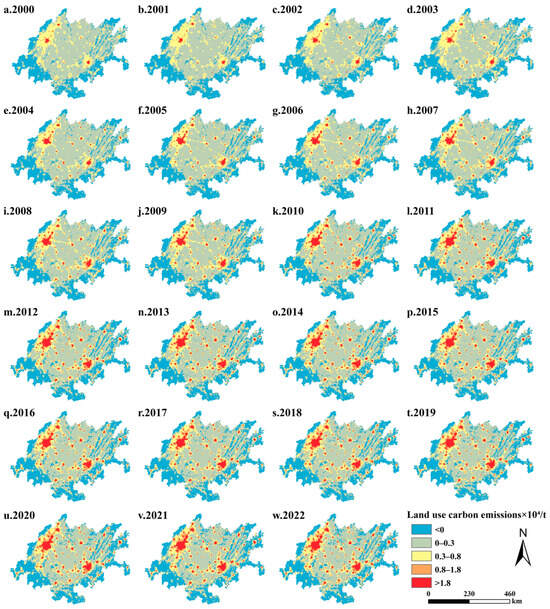
Figure 6.
The spatial variations in land carbon emissions in the CCUA from 2000 to 2022.
The significance test results for LUCEs in the study area are shown in Figure 7. From 2000 to 2022, 55.93% of the study area exhibited an increasing trend in LUCEs, with 44.3% showing a significant increase, primarily concentrated in the core areas of Chengdu and Chongqing and along major transportation corridors. An additional 11.63% of the area displayed a slightly significant increase, mostly located in suburban zones near cities. No significant change was observed in 8.79% of the study area, while 35.27% exhibited a decreasing trend. Of this, 22.43% showed a significant decrease, predominantly in the western mountainous regions and river basins, likely associated with the Grain-for-Green policy and natural reserve management measures. A further 12.84% of the area exhibited a slightly significant decrease.
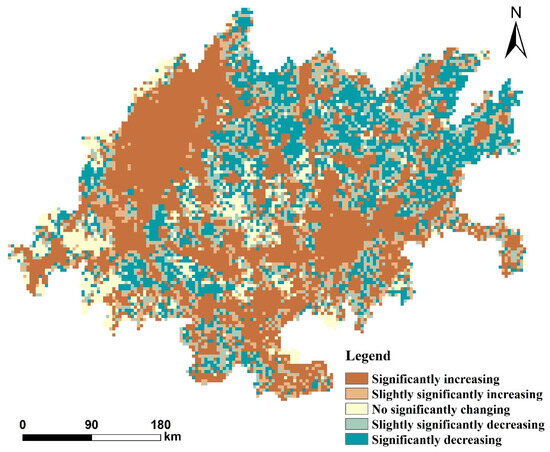
Figure 7.
The spatial variation trend of land carbon emissions in the CCUA from 2000 to 2022.
3.2. Spatial Correlation Analysis
3.2.1. Global Spatial Autocorrelation Analysis
Moran’s I index was used to quantify the spatial autocorrelation characteristics of carbon emissions in the study area from 2000 to 2022. As shown in Table 3, Moran’s I values ranged from 0.028 to 0.09, indicating positive spatial autocorrelation in LUCEs in the CCUA, with all Z-values passing the significance test. Moran’s I values exhibited an overall upward trend, potentially driven by the accelerated integration policies of the CCUA, which promoted the concentration of industrial factors in core areas.
Table 3.
Moran’s I statistics of ESV in CCUA.
3.2.2. Local Spatial Autocorrelation Analysis
To further investigate local spatial autocorrelation, evolution maps of spatial clustering were generated using ArcGIS 10.7 (Figure 8). During the study period, the spatial clustering patterns in the study area remained relatively stable. High–high and low–low clustering units were prevalent and exhibited distinct characteristics, confirming the overall positive spatial autocorrelation of land use carbon emissions. High–high clusters were primarily observed in ultra-high carbon emission zones, dominated by construction land, while low–low clusters were mainly located in negative carbon emission zones, predominantly forestland. Notably, high–high clusters displayed a trend of gradual contraction from central urban areas inward.
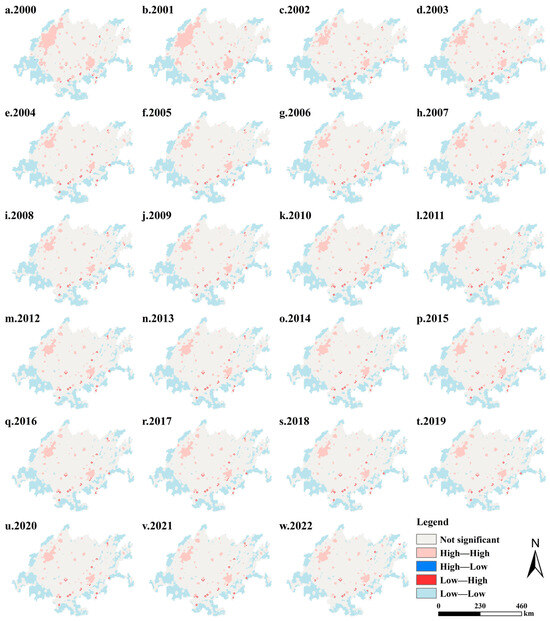
Figure 8.
Spatial clustering features of land carbon emissions in the CCUA from 2000 to 2022.
3.3. Analysis of Influencing Factors
3.3.1. Single-Factor Detection Analysis
The single-factor detection results for LUCEs in the CCUA from 2000 to 2022 are shown in Figure 9. Except for annual precipitation (X4) in 2000 (Figure 9a), 2005 (Figure 9b), and 2016 (Figure 9d), which did not pass the significance test, all factors in other years exhibited statistical significance (p = 0). Socioeconomic factors were the dominant drivers of LUCEs in the study area, with their influence increasing over time. In 2000 (Figure 9a), the explanatory power of factors, ranked from strongest to weakest, was as follows: nighttime light intensity (X5) > proportion of construction land (X8) > normalized difference vegetation index (NDVI, X6) > population density (X7) > elevation (X1) > annual mean temperature (X3) > slope (X2) > annual precipitation (X4). Nighttime light intensity (X5), proportion of construction land (X8), and NDVI (X6) were the dominant factors. By 2022 (Figure 9e), the dominant factors had shifted to the proportion of construction land (X8), nighttime light intensity (X5), and population density (X7).
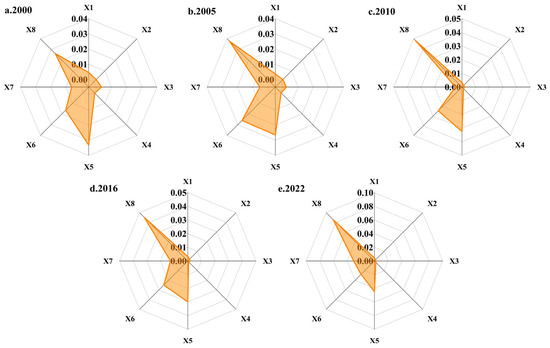
Figure 9.
GD factor identification results of Land carbon emissions in the CCUA: (a) 2000, (b) 2005, (c) 2010, (d) 2016, (e) 2022. Each radar chart displays the explanatory power (q-values, ranging from 0 to approximately 0.10) of eight influencing factors on the axes: X1 = elevation, X2 = slope, X3 = annual mean temperature, X4 = annual precipitation, X5 = nighttime light intensity, X6 = NDVI, X7 = population density, X8 = proportion of construction land. Higher q-values indicate stronger explanatory power of the factor on spatial differentiation of carbon emissions.
3.3.2. Dual-Factor Interaction Detection
The results of the interaction detection analysis indicate that the combined effects of influencing factors on LUCEs are more significant than the effects of any single factor, manifesting as nonlinear enhancement or synergistic strengthening effects (Figure 10). Across five time periods, the highest interaction q-values were observed for the following pairs: slope (X2) ∩ nighttime light intensity (X5), normalized difference vegetation index (NDVI, X6) ∩ proportion of construction land (X8), NDVI (X6) ∩ proportion of construction land (X8), annual precipitation (X4) ∩ proportion of construction land (X8), and population density (X7) ∩ proportion of construction land (X8). The interaction pattern shifted from “natural factors ∩ socioeconomic factors” to “internal interactions among socioeconomic factors,” reflecting the increasing composite impact of human activities and land use transitions on carbon emissions. In summary, land use carbon emissions represent a complex system driven by the synergistic effects of multiple factors, rather than simple linear relationships driven by single factors. Formulating carbon reduction policies requires comprehensive consideration of these interaction effects.
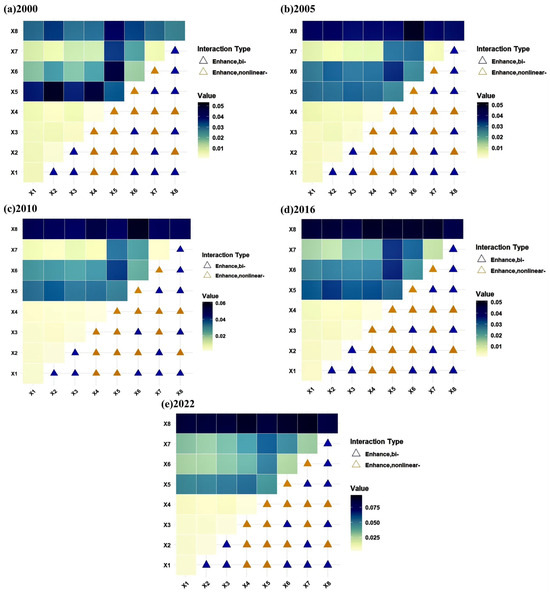
Figure 10.
The result of the interaction detector of land carbon emissions in the CCUA.
4. Discussion
4.1. Spatiotemporal Evolution of Carbon Emissions
From 2000 to 2022, LUCEs in the CCUA exhibited pronounced spatiotemporal evolution characteristics. Temporally, total carbon emissions increased substantially from 17.951 million tons in 2000 to 59.037 million tons in 2022, albeit with varying growth rates across different periods. Notably, during 2000–2012, the average annual growth rate reached 10.2%, reflecting the high-carbon intensity of rapid industrialization and urbanization in the region. In contrast, the growth rate slowed to 1.5% between 2012 and 2022, culminating in a marked 10.9% decline in 2022, which may be closely linked to regional green development policies and optimizations in energy structure. Compared with the findings of Liu et al. (2023) [64] on the Yellow River Basin, the deceleration in carbon emission growth within the CCUA was more pronounced, potentially attributable to the region’s early policy responses under China’s national “dual-carbon” strategy.
Spatially, carbon emissions displayed a pattern of “dual-core polarization and corridor sprawl,” with high-emission zones centered on the urban cores of Chengdu and Chongqing expanding outward and diffusing along the central Chengdu–Chongqing transportation corridor and the YRBE, resulting in a significant increase in area accounting for 44.3% of the total. Conversely, the western mountainous areas formed low-carbon or even negative-carbon regions due to the implementation of afforestation policies, such as returning farmland to forests, and ecological conservation measures. This spatial configuration aligns with the results of Peng et al. (2025) [52] on the upper Yangtze River Basin, yet the corridor effects in the CCUA are more prominent, highlighting the unique influence of regional integration on the spatial distribution of carbon emissions.
4.2. Influencing Factors and Innovative Application of the GD Model
In this study, the GD model was employed to systematically identify the driving factors of land use carbon emissions in the CCUA and to elucidate their interaction effects. By comparing the GD model with conventional approaches such as the LMDI, regression models, GTWR, and the STIRPAT framework, this research not only validates the consistency of macroscopic patterns but also uncovers structural characteristics at the micro-level that traditional models fail to detect.
First, with respect to the overall trends in single-factor driving forces, this study further confirms the dominant role of socioeconomic factors. The results demonstrate that the proportion of construction land, nighttime light intensity, and population density exert significant explanatory power on regional carbon emissions. These findings corroborate previous conclusions by Cai and Li [65] and Meng et al. [66] that the pace of economic development, the intensity of urban expansion, and the level of population agglomeration consistently serve as primary drivers of regional carbon emissions. However, compared with those studies, the GD model exhibits superior explanatory capability in quantifying nonlinear associations and detecting interaction effects, thereby addressing the limitations of traditional linear models in revealing deeper mechanisms.
Second, the GD model overcomes the constraints of linear assumptions and precisely captures “nonlinear enhancement” effects among factors. Previous studies, predominantly based on LMDI or STIRPAT frameworks, have focused on linear contributions of individual factors [66,67]. Although such approaches can identify “key factors,” they often fail to quantify the multiplicative effects arising from factor coupling. In the present study, the q values derived from the GD model are substantially higher than the explanatory coefficients obtained from conventional linear methods. Notably, strong “nonlinear enhancement” or “bi-factor enhancement” relationships are observed among variables such as construction land proportion, population density, and nighttime light intensity. Interaction detector results reveal that the explanatory power of the interaction between population density and construction land proportion exceeds the independent effects of either factor alone in multiple years. In contrast, studies employing GTWR or multivariate regression, such as those by He and Yang [14], tend to attenuate such composite mechanisms due to smoothing procedures. These results indicate that, against the backdrop of rapid land use change, the coupling of natural and socioeconomic factors is not a simple linear superposition but involves complex spatial reinforcement and mutual amplification effects. The GD model provides robust quantitative evidence for these phenomena.
Third, compared with spatial econometric models, the GD model more intuitively reconstructs the evolving driving structure underlying spatial heterogeneity. Although GTWR excels in addressing spatial non-stationarity, its parameter estimates struggle to fully capture complex interaction mechanisms [14,68]. By directly quantifying the enhancement effects between natural background conditions and socioeconomic variables, the GD model clearly delineates the evolutionary trajectory of driving mechanisms: a transition from an early stage characterized by “dual constraints of natural and socioeconomic factors” to a later stage dominated by “internal coupling reinforcement among socioeconomic factors.” This structural evolution is difficult to systematically capture using traditional parametric models and represents a key innovative contribution that distinguishes the present study from existing literature.
Furthermore, the stage-specific analysis enabled by the GD model profoundly reveals the temporal sensitivity of driving mechanisms. Whereas conventional models typically emphasize continuity in time-series analysis, the GD model is particularly adept at dissecting spatial heterogeneity within specific developmental phases. The five critical time nodes selected in this study precisely correspond to periods of policy adjustment, land use restructuring, and economic transformation. Compared with the inter-annual regression analyses conducted by Pan et al. [10], the present research demonstrates that the GD model is more sensitive to structural reconfiguration of driving mechanisms across different developmental stages, thereby offering a more targeted perspective for understanding the spatial dynamics of carbon emissions.
In summary, the application of the GD model in this study markedly enhances both the explanatory power and comprehensiveness of driving mechanism analysis. By yielding higher q values, the GD model improves the transparency of spatial differentiation attribution, while its interaction detector effectively corrects the oversimplification of human–environment coupling inherent in traditional linear assumptions by revealing nonlinear enhancement effects. From a methodological standpoint, as regional human activities become increasingly intertwined with natural environments, the formation mechanisms of carbon emissions will exhibit increasingly pronounced nonlinear and multifactorial characteristics. With its acute sensitivity to complex spatial relationships, the GD model offers a generalizable analytical paradigm for disentangling intricate issues in regional carbon emissions, ecosystem services, and territorial spatial governance, thereby holding substantial academic reference value.
4.3. Research Limitations and Future Directions
Even with the strides taken in evaluating the spatial-temporal attributes and causal processes behind carbon discharges, our work exhibits certain drawbacks relative to preceding investigations. First, the carbon emission coefficients used in the accounting process were primarily drawn from existing studies and did not fully account for the regional uniqueness of land use types in the CCUA, potentially leading to estimation biases. This aligns with the issue of coefficient localization raised by Li [69] in their study of Shanxi Province. Second, the analysis of influencing factors relied on static data, failing to dynamically capture the lagged effects of policy implementation, market mechanisms, and technological advancements, echoing the limitations in dynamic scenario modeling noted by Lyu et al. [70] Additionally, the 1 km resolution of the raster data limited the precision in reflecting microscale carbon emission changes, constraining support for fine-scale governance strategies. Huang et al. [71] have already explored higher-resolution data to improve simulation accuracy.
Future research directions will deepen the investigation in the following areas: First, developing a localized carbon emission coefficient system tailored to the natural and socioeconomic characteristics of the CCUA, integrating field surveys and remote sensing data to enhance accounting accuracy, akin to the approach attempted by Cai et al. [72] in urban-level process-based emission studies; second, incorporating dynamic panel models or time-series analyses to quantify the dynamic impacts of policy interventions and economic activities, similar to the recommendations of Chen et al. [73]; third, assimilating higher-resolution multisource data to improve the precision of spatial distribution simulations, consistent with the outlook proposed by Liu et al. [74]; fourth, exploring coupled predictive models for carbon emissions in relation to regional economic-ecological systems, combined with scenario analyses to provide long-term planning support for the CCUA’s low-carbon transition, as exemplified by the multi-scenario forecasting framework advanced by Liu et al. [75]. These enhancements will further elevate the scientific rigor and practical value of the research, offering more comprehensive support for the Chengdu–Chongqing region in achieving its “dual-carbon” objectives.
5. Conclusions
This study developed a multi-source measurement framework to quantify land use carbon emissions in the CCUA from 2000 to 2022 and combined trend analysis, spatial autocorrelation, and the GD model to explain their spatiotemporal patterns and driving mechanisms. The results show that land use carbon emissions increased substantially over the study period, but the pace of growth slowed in the more recent decade. High-emission areas became highly concentrated in the main urban districts of Chengdu and Chongqing and along the transport corridors that connect them, while many mountainous and river basin areas in the west evolved towards low or even negative net emissions under large-scale ecological restoration. At the same time, spatial clustering of emissions intensified, indicating that high- and low-emission zones are increasingly organized into stable regional patterns rather than scattered randomly.
The analysis of influencing factors demonstrates that socioeconomic forces play a much stronger role in shaping land use carbon emissions than natural background conditions. The expansion of construction land, the intensity of human activities reflected by nighttime lights, and the concentration of population consistently emerge as the most important contributors. More importantly, the GD model results reveal that the combined influence of these factors is greater than the effect of any single factor. The joint action of dense populations and rapidly expanding built-up areas has become the dominant driver of the regional carbon footprint, and the overall driving structure has gradually shifted from a pattern in which natural and socioeconomic factors jointly constrain emissions to one in which interactions among socioeconomic factors prevail. These findings suggest that optimizing land use structure, guiding compact and efficient urban development, and better coordinating population distribution with ecological protection and infrastructure planning are key levers for reducing land use-related carbon emissions in the CCUA and in other rapidly urbanizing regions.
Author Contributions
Conceptualization, Y.D. and D.J.; methodology, D.J. and Z.G.; software, M.Z. (Miao Zhang) and A.M.; validation, M.Z. (Miao Zhang), X.M. and A.M.; formal analysis, W.W., P.H. and D.J.; resources, J.L., M.P. and M.Z. (Mei Zhang); data curation, P.W., M.P. and M.Z. (Miao Zhang); writing—original draft preparation, M.Z. (Miao Zhang) and P.H.; writing—review and editing, Y.D.; supervision, J.L. and M.Z. (Mei Zhang); funding acquisition, Y.D. and D.J. All authors have read and agreed to the published version of the manuscript.
Funding
This research was funded by the Upper Yangtze River Shipping and Logistics Coinnovation Center (XTCX2023A01) and the National College Student Innovation and Entrepreneurship Training Program (Grant No. 202510622017) and the Sichuan Provincial College Student Innovation and Entrepreneurship Training Program (Grant No. S202510622068).
Institutional Review Board Statement
Not applicable.
Informed Consent Statement
Not applicable.
Data Availability Statement
Data are available from the corresponding author (Yuanjie Deng) upon reasonable request.
Conflicts of Interest
The authors declare no conflicts of interest.
Abbreviations
The following abbreviations are used in this manuscript:
| CCUA | Chengdu–Chongqing Urban Agglomeration |
| LUCEs | Land use carbon emissions |
| YREB | Yangtze River Economic Belt, |
| GTWR | Geographically and Temporally Weighted Regression |
| ODIAC | Open-Data Inventory for Anthropogenic Carbon Dioxide |
| LMDI | Logarithmic Mean Divisia Index |
| GENAI | generative artificial intelligence |
| MK | Mann–Kendall |
| GD | Geodetector |
References
- Houghton, R.A.; Castanho, A. Annual Emissions of Carbon from Land Use, Land-Use Change, and Forestry from 1850 to 2020. Earth Syst. Sci. Data 2023, 15, 2025–2054. [Google Scholar] [CrossRef]
- Feng, X.; Wang, S.; Li, Y.; Yang, J.; Lei, K.; Yuan, W. Spatial Heterogeneity and Driving Mechanisms of Carbon Emissions in Urban Expansion Areas: A Research Framework Coupled with Patterns and Functions. Land Use Policy 2024, 143, 107209. [Google Scholar] [CrossRef]
- Xiong, Y.; Sun, Y.; Yang, Y. Impact of Urban Green Space Patterns on Carbon Emissions: A Gray BP Neural Network and Geo-Detector Analysis. Sustainability 2025, 17, 7245. [Google Scholar] [CrossRef]
- Tan, D.; Cheng, J.; Yu, J.; Wang, Q.; Chen, X. Spatiotemporal Evolution and Influencing Factors of Carbon Emission Efficiency of Apple Production in China from 2003 to 2022. Agriculture 2025, 15, 1680. [Google Scholar] [CrossRef]
- Zhao, R.Q.; Huang, X.J. Carbon emissions and carbon footprints of land use based on energy consumption in Jiangsu Province, China. Geogr. Res. 2010, 29, 1639–1649. [Google Scholar]
- Yi, D.; Ou, M.H.; Guo, J.; Han, Y.; Yi, J.L.; Ding, G.Q.; Wu, W.J. Research progress and prospects of land use carbon emissions and low-carbon optimization. Resour. Sci. 2022, 44, 1545–1559. [Google Scholar] [CrossRef]
- Lai, L.; Huang, X.; Yang, H.; Chuai, X.; Zhang, M.; Zhong, T.; Chen, Z.; Chen, Y.; Wang, X.; Thompson, J.R. Carbon Emissions from Land-Use Change and Management in China between 1990 and 2010. Sci. Adv. 2016, 2, e1601063. [Google Scholar] [CrossRef] [PubMed]
- Houghton, R.A.; House, J.I.; Pongratz, J.; van der Werf, G.R.; DeFries, R.S.; Hansen, M.C.; Le Quéré, C.; Ramankutty, N. Carbon Emissions from Land Use and Land-Cover Change. Biogeosciences 2012, 9, 5125–5142. [Google Scholar] [CrossRef]
- Pu, X.; Cheng, Q.; Chen, H. Spatial–Temporal Dynamics of Land Use Carbon Emissions and Drivers in 20 Urban Agglomerations in China from 1990 to 2019. Environ. Sci. Pollut. Res. 2023, 30, 107854–107877. [Google Scholar] [CrossRef]
- Pan, L.; Yu, J.; Lin, L. The Temporal and Spatial Pattern Evolution of Land-Use Carbon Emissions in China Coastal Regions and Its Response to Green Economic Development. Front. Environ. Sci. 2022, 10, 1018372. [Google Scholar] [CrossRef]
- Yuan, S.F.; Tang, Y.Y. Spatial differentiation of land-use carbon emissions in the Yangtze River Economic Belt from a low-carbon perspective. Econ. Geogr. 2019, 39, 190–198. [Google Scholar] [CrossRef]
- Sun, H.; Liang, H.M.; Chang, X.L.; Cui, Q.C.; Tao, Y. Land use carbon emissions and their spatial correlation in China. Econ. Geogr. 2015, 35, 154–162. [Google Scholar] [CrossRef]
- Chen, L.; Hang, Y.; Li, Q. Spatial-Temporal Characteristics and Influencing Factors of Carbon Emissions from Land Use and Land Cover in Black Soil Region of Northeast China Based on LMDI Simulation. Sustainability 2023, 15, 9334. [Google Scholar] [CrossRef]
- He, J.; Yang, J. Spatial–Temporal Characteristics and Influencing Factors of Land-Use Carbon Emissions: An Empirical Analysis Based on the GTWR Model. Land 2023, 12, 1506. [Google Scholar] [CrossRef]
- Ji, X.Q.; Zhang, Y.S. Spatial correlation network structure and motivation of carbon emission efficiency in planting industry in the Yangtze River Economic Belt. J. Nat. Resour. 2023, 38, 675–693. [Google Scholar] [CrossRef]
- Ma, Y.; Liu, Z.Z. Spatiotemporal evolution and influencing factors of land use carbon emissions in the Yellow River Basin. Ecol. Econ. 2021, 37, 35–43. [Google Scholar]
- Yuan, D.; Zhang, L.; Fan, Y.; Yang, R. Investigating Spatio-Temporal Variations and Contributing Factors of Land Use-Related Carbon Emissions in the Beijing-Tianjin-Hebei Region, China. Sci. Rep. 2024, 14, 18976. [Google Scholar] [CrossRef] [PubMed]
- Ji, X.Q.; Liu, H.M.; Zhang, Y.S. Evolution and driving factors of spatial correlation network structure of inter-provincial land use carbon emissions in China. Econ. Geogr. 2023, 43, 190–200. [Google Scholar] [CrossRef]
- Li, J.; Mao, D.H.; Jiang, Z.L.; Li, K. Factor decomposition and decoupling effect of land use carbon emissions in Changsha-Zhuzhou-Xiangtan urban agglomeration. Ecol. Econ. 2019, 35, 28–34,66. [Google Scholar]
- Chuai, X.; Huang, X.; Lu, Q.; Zhang, M.; Zhao, R.; Lu, J. Spatiotemporal Changes of Built-Up Land Expansion and Carbon Emissions Caused by the Chinese Construction Industry. Environ. Sci. Technol. 2015, 49, 13021–13030. [Google Scholar] [CrossRef] [PubMed]
- Wang, J.; Li, X.; Christakos, G.; Liao, Y.; Zhang, T.; Gu, X.; Zheng, X. Geographical Detectors-Based Health Risk Assessment and Its Application in the Neural Tube Defects Study of the Heshun Region, China. Int. J. Geogr. Inf. Sci. 2010, 24, 107–127. [Google Scholar] [CrossRef]
- Wang, J.; Xu, C. Geodetector: Principle and Prospective. Acta Geogr. Sin. 2017, 72, 116–134. [Google Scholar] [CrossRef]
- Zeng, C.; He, J.; He, Q.; Mao, Y.; Yu, B. Assessment of Land Use Pattern and Landscape Ecological Risk in the Chengdu-Chongqing Economic Circle, Southwestern China. Land 2022, 11, 659. [Google Scholar] [CrossRef]
- Wang, C.; Li, T.; Guo, X.; Xia, L.; Lu, C.; Wang, C. Plus-InVEST Study of the Chengdu-Chongqing Urban Agglomeration’s Land-Use Change and Carbon Storage. Land 2022, 11, 1617. [Google Scholar] [CrossRef]
- Li, Y.; Zhang, Y.; Li, X. Insight into Carbon Emissions in Economically Developed Regions Based on Land Use Transitions: A Case Study of the Yangtze River Delta, China. Land 2024, 13, 1968. [Google Scholar] [CrossRef]
- Yang, Y.; Li, H. Monitoring Spatiotemporal Characteristics of Land-Use Carbon Emissions and Their Driving Mechanisms in the Yellow River Delta: A Grid-Scale Analysis. Environ. Res. 2022, 214, 114151. [Google Scholar] [CrossRef]
- Boton, X.; Nitschelm, L.; Juillard, M.; van der Werf, H.M.G. Modelling Greenhouse Gas Emissions of Land Use and Land-Use Change Using Spatially Explicit Land Conversion Data for French Crops. Int. J. Life Cycle Assess. 2025, 30, 285–300. [Google Scholar] [CrossRef]
- Yang, S.; Wang, X.; Ge, Z.; Dong, G.; Ma, M.; Han, X. Global Per Capita CO2 Emission Trends. Atmosphere 2023, 14, 1797. [Google Scholar] [CrossRef]
- Wang, Y.; Wang, M.; Teng, F.; Ji, Y. Remote Sensing Monitoring and Analysis of Spatiotemporal Changes in China’s Anthropogenic Carbon Emissions Based on XCO2 Data. Remote Sens. 2023, 15, 3207. [Google Scholar] [CrossRef]
- Wei, Z.Y.; Tu, J.J.; Xiao, L.; Yang, Y.; Li, Y. Fine accounting and driving factor monitoring of territorial space carbon budget in Chengdu-Chongqing urban agglomeration. J. Nat. Resour. 2025, 40, 1294–1311. [Google Scholar] [CrossRef]
- Zhang, J.; Lu, H.; Peng, W.; Zhang, L. Analyzing Carbon Emissions and Influencing Factors in Chengdu-Chongqing Urban Agglomeration Counties. J. Environ. Sci. 2025, 151, 640–651. [Google Scholar] [CrossRef]
- Deng, Y.; Chen, H.; Hai, Y.; Zhou, J.; Jizeding, D.; Luo, J.; Li, L. Spatial pattern and carbon balance zoning of land use carbon emissions in Chengdu-Chongqing Economic Circle. Soil Water Conserv. Bull. 2024, 44, 337–346. [Google Scholar] [CrossRef]
- Qiu, A.-Y.; Yue, H.; You, Z.; An, H. Forecasting of Factors Influencing Carbon Emission from Land-Use in Liaoning Province, China, under the “Double Carbon” Target. Ecol. Model. 2025, 509, 111255. [Google Scholar] [CrossRef]
- Wu, R.; Lan, H.; Cao, Y.; Li, P. Optimization of Low-Carbon Land Use in Chengdu Based on Multi-Objective Linear Programming and the Future Land Use Simulation Model. Front. Environ. Sci. 2022, 10, 989747. [Google Scholar] [CrossRef]
- Xie, X.J.; Huang, A. Spatiotemporal relationship between carbon emissions and ecosystem service value based on LUCC in Sichuan Province. Resour. Environ. Yangtze Basin 2025, 34, 2352. [Google Scholar]
- Zhao, L.; Yang, C.; Zhao, Y.; Wang, Q.; Zhang, Q. Spatial Correlations of Land Use Carbon Emissions in Shandong Peninsula Urban Agglomeration: A Perspective from City Level Using Remote Sensing Data. Remote Sens. 2023, 15, 1488. [Google Scholar] [CrossRef]
- Huang, H.Y.; Tang, Y.Q.; Gong, Z.W.; Chen, X.J. Dynamic evolution and influencing factors of land-use carbon emissions in Chongqing based on STIRPAT-GWR model. J. Environ. Eng. Technol. 2024, 14, 1195–1205. [Google Scholar] [CrossRef]
- Zheng, Y.; Su, L.; Zeng, Q.; Zhou, S.; Li, S.; Hong, H.; Deng, H.; Li, W. Spatiotemporal Assessment of Land Use Carbon Emission in the Guangdong-Hong Kong-Macao Greater Bay Area:A Hybrid Static-Dynamic Model Integrated with PLUS. Urban Clim. 2025, 63, 102574. [Google Scholar] [CrossRef]
- Yang, L.; Wang, C.; Liu, Y.; Wang, T.; Tian, Z.; Ding, L.; Liu, Z.; Feng, T.; Niu, Q.; Mao, X.; et al. The Change Pattern and Spatiotemporal Transition of Land Use Carbon Emissions in China’s Three-North Shelterbelt Program Region. Ecol. Eng. 2025, 219, 107680. [Google Scholar] [CrossRef]
- Saha, P.; Amitab, K.; Nath, A. Assessing CO2 Emission Trend and Its Impact on Agricultural Crop Health Using Machine Learning Technique. Procedia Comput. Sci. 2025, 258, 1506–1516. [Google Scholar] [CrossRef]
- Kliengchuay, W.; Mingkhwan, R.; Kiangkoo, N.; Suwanmanee, S.; Sahanavin, N.; Kongpran, J.; Aung, H.W.; Tantrakar-napa, K. Analyzing Temperature, Humidity, and Precipitation Trends in Six Regions of Thailand Using Innovative Trend Analysis. Sci Rep 2024, 14, 7800. [Google Scholar] [CrossRef] [PubMed]
- Ge, K.; Wang, Y.; Liu, X.; Hu, L.; Ke, S.; Jiang, X.; Zhang, W. Spatial Effects and Influence Mechanisms of Urban Land Use Green Transition on Urban Carbon Emissions. Ecol. Indic. 2025, 172, 113261. [Google Scholar] [CrossRef]
- Niu, J.; Xin, B.; Xin, B.; Zhang, Y.; Wang, M. Research on the Coordinated Development of Provincial Urbanization and Carbon Emission Efficiency of Construction Industry in China. Carbon Balance Manag. 2024, 19, 12. [Google Scholar] [CrossRef]
- Huang, W.; Deng, Y.; Chen, H.; Hai, Y.; Ma, A.; Duan, M.; Ming, L. Spatiotemporal Changes in Land Use and Identification of Driving Factor Contributions in the Chengdu-Chongqing Economic Circle Based on the Random Forest Model. Environ. Sci. Pollut. Res. 2025, 32, 18975–18994. [Google Scholar] [CrossRef]
- Dang, H.; Deng, Y.; Hai, Y.; Chen, H.; Wang, W.; Zhang, M.; Liu, X.; Yang, C.; Peng, M.; Jize, D.; et al. Integrating Geodetector and GTWR to Unveil Spatiotemporal Heterogeneity in China’s Agricultural Carbon Emissions Under the Dual Carbon Goals. Agriculture 2025, 15, 1302. [Google Scholar] [CrossRef]
- Wang, Z.; Ou, L.; Chen, M. Evolution Characteristics, Drivers and Trends of Rural Residential Land in Mountainous Economic Circle: A Case Study of Chengdu-Chongqing Area, China. Ecol. Indic. 2023, 154, 110585. [Google Scholar] [CrossRef]
- Wang, M.; Wang, L. Study on Land Use Change and Driving Force in Chengdu-Chongqing Urban Agglomeration. ITM Web Conf. 2022, 47, 03037. [Google Scholar] [CrossRef]
- Chen, L.; Li, X.; Kang, X.; Liu, W.; Wang, M. Analysis of the Cooperative Development of Multiple Systems for Urban Economy-Energy-Carbon: A Case Study of Chengdu-Chongqing Economic Circle. Sustain. Cities Soc. 2024, 108, 105395. [Google Scholar] [CrossRef]
- Liu, Y.; Zhu, J.; He, T.; Liu, H. Quantifying the Impacts of Grain Plantation Decline on Domestic Grain Supply in China During the Past Two Decades. Land 2025, 14, 1283. [Google Scholar] [CrossRef]
- Li, L.; Zhang, X.; Yu, L.; Xiao, H. Spatial-Temporal Evolution of Land Use Carbon Emissions and Influencing Factors in Zibo, China. Front. Environ. Sci. 2024, 12, 1472558. [Google Scholar] [CrossRef]
- Liu, L.; Qu, J.; Gao, F.; Maraseni, T.N.; Wang, S.; Aryal, S.; Zhang, Z.; Wu, R. Land Use Carbon Emissions or Sink: Research Characteristics, Hotspots and Future Perspectives. Land 2024, 13, 279. [Google Scholar] [CrossRef]
- Peng, M.; Yang, Y.; Deng, Y.; Jize, D.; Chen, H.; Hai, Y.; Liu, G.; Wang, H.; Xie, T.; Li, H.; et al. The Impact of the Grain-for-Green Programme on Carbon Storage in the Upper Yangtze River Basin Based on the PLUS-InVEST Model. Carbon Balance Manag. 2025, 20, 24. [Google Scholar] [CrossRef]
- Hu, Y.; Zhang, S.; Shi, Y.; Guo, L. Quantifying the Impact of the Grain-for-Green Program on Ecosystem Service Scarcity Value in Qinghai, China. Sci. Rep. 2023, 13, 2927. [Google Scholar] [CrossRef] [PubMed]
- Duan, P.; Wu, K. Afforestation Through Sand Control: Farmer Participation Under China’s New Round of Grain-for-Green Compensation Policy. Agriculture 2025, 15, 671. [Google Scholar] [CrossRef]
- Wu, Q.; Zhou, P.; Dai, Y. When Farmers Walk Away: A Mixed-Methods Investigation of Farmland Abandonment through Land-Use Change and Farmer Interviews in the Chengdu-Chongqing Economic Circle, Southwestern China. Front. Environ. Sci. 2025, 13, 1650689. [Google Scholar] [CrossRef]
- Zhong, Q.; Li, Z.; He, Y. Coupling Evaluation and Spatial–Temporal Evolution of Land Ecosystem Services and Economic–Social Development in a City Group: The Case Study of the Chengdu–Chongqing City Group. Int. J. Environ. Res. Public Health 2023, 20, 5095. [Google Scholar] [CrossRef] [PubMed]
- Hu, L.; Wang, G.; Huang, Q.; Xie, J. Policy-Driven Land Use Optimization for Carbon Neutrality: A PLUS-InVEST Model Coupling Approach in the Chengdu–Chongqing Economic Circle. Sustainability 2025, 17, 5831. [Google Scholar] [CrossRef]
- Ma, D.; Hu, C.; Yan, Y.; Zhang, F.; Zhang, J.; Deng, P.; Chang, R. A Comprehensive Analysis of the Spatiotemporal Dynamics and Determinants of Carbon Emission Efficiency in China’s Manufacturing Sector. J. Environ. Manag. 2025, 381, 125269. [Google Scholar] [CrossRef]
- Gui, D.; He, H.; Liu, C.; Han, S. Spatio-Temporal Dynamic Evolution of Carbon Emissions from Land Use Change in Guangdong Province, China, 2000–2020. Ecol. Indic. 2023, 156, 111131. [Google Scholar] [CrossRef]
- Che, L.; Guo, S.; Li, Y.; Zhu, Y. Exploring the Dynamics and Trends of Carbon Emission Spatiotemporal Patterns in the Chengdu–Chongqing Economic Zone, China, from 2000 to 2020. Sci. Rep. 2024, 14, 16341. [Google Scholar] [CrossRef]
- Liu, C.; Xu, R.; Xu, K.; Lin, Y.; Cao, Y. Carbon Emission Effects of Land Use in Chaobai River Region of Beijing–Tianjin–Hebei, China. Land 2023, 12, 1168. [Google Scholar] [CrossRef]
- Rong, T.; Zhang, P.; Zhu, H.; Jiang, L.; Li, Y.; Liu, Z. Spatial Correlation Evolution and Prediction Scenario of Land Use Carbon Emissions in China. Ecol. Inform. 2022, 71, 101802. [Google Scholar] [CrossRef]
- Huang, H.; Yang, X. Spatiotemporal Evolution Mechanism and Dynamic Simulation of the Urban Resilience System in the Chengdu–Chongqing Economic Circle. Sustainability 2025, 17, 3448. [Google Scholar] [CrossRef]
- Liu, J.; Shi, T.; Hou, Z.; Huang, L.; Pu, L. Analysis of Spatiotemporal Patterns and Determinants of Energy-Related Carbon Emissions in the Yellow River Basin Using Remote Sensing Data. Front. Energy Res. 2023, 11, 1231322. [Google Scholar] [CrossRef]
- Cai, Y.; Li, K. Spatiotemporal Dynamic Evolution and Influencing Factors of Land Use Carbon Emissions: Evidence from Jiangsu Province, China. Front. Environ. Sci. 2024, 12, 1368205. [Google Scholar] [CrossRef]
- Meng, Q.; Zheng, Y.; Liu, Q.; Li, B.; Wei, H. Analysis of Spatiotemporal Variation and Influencing Factors of Land-Use Carbon Emissions in Nine Provinces of the Yellow River Basin Based on the LMDI Model. Land 2023, 12, 437. [Google Scholar] [CrossRef]
- Yang, X.; Liu, X. Path Analysis and Mediating Effects of Influencing Factors of Land Use Carbon Emissions in Chang-Zhu-Tan Urban Agglomeration. Technol. Forecast. Soc. Chang. 2023, 188, 122268. [Google Scholar] [CrossRef]
- Tian, C.; Cheng, L.; Yin, T. Spatial Heterogeneity of Driving Forces in Response to Carbon Emissions from Land Use at County-Level in Beijing-Tianjin-Hebei Region. Pol. J. Environ. Stud. 2023, 32, 267–279. [Google Scholar] [CrossRef]
- Li, J.; Hu, J.; Kang, J.; Shu, W. Spatio-temporal variation and prediction of land use and carbon storage based on PLUS-InVEST model in Shanxi Province, China. Landsc. Ecol. Eng. 2024. [Google Scholar] [CrossRef]
- Lyu, K.; Li, Z. Scenario based assessment of carbon storage and habitat quality under land use change in Shandong Province China. Sci. Rep. 2025, 15, 38098. [Google Scholar] [CrossRef]
- Huang, C.; Zhuang, Q.; Meng, X.; Zhu, P.; Han, J.; Huang, L. A fine spatial resolution modeling of urban carbon emissions: A case study of Shanghai, China. Sci. Rep. 2022, 12, 9345. [Google Scholar] [CrossRef] [PubMed]
- Cai, S.; Xu, J.; Guan, Y.; Liu, M.; Tan, C.; Bi, J.; Shan, Y. City-Level Process-Related CO2 Emissions in China 2000–2021. Sci. Data 2025, 12, 1435. [Google Scholar] [CrossRef] [PubMed]
- Chen, D.; Li, S. Exploring the Pathway to Carbon Neutrality in China Based on a Dynamic Spatial Durbin Quantile Regression Model. Sci. Rep. 2025, 15, 17442. [Google Scholar] [CrossRef] [PubMed]
- Liu, Z.; Han, L.; Liu, M. High-Resolution Carbon Emission Mapping and Spatial-Temporal Analysis Based on Multi-Source Geographic Data: A Case Study in Xi’an City, China. Environ. Pollut. 2024, 361, 124879. [Google Scholar] [CrossRef]
- Liu, C.; Zhang, Y. China’s Carbon Emission Prediction from the Perspective of Shared Socioeconomic Pathways and Machine Learning. Energy Strategy Rev. 2025, 60, 101778. [Google Scholar] [CrossRef]
Disclaimer/Publisher’s Note: The statements, opinions and data contained in all publications are solely those of the individual author(s) and contributor(s) and not of MDPI and/or the editor(s). MDPI and/or the editor(s) disclaim responsibility for any injury to people or property resulting from any ideas, methods, instructions or products referred to in the content. |
© 2025 by the authors. Licensee MDPI, Basel, Switzerland. This article is an open access article distributed under the terms and conditions of the Creative Commons Attribution (CC BY) license (https://creativecommons.org/licenses/by/4.0/).