Abstract
This study examines spatial patterns and self-reported user experiences within the Balkan Campus of Trakya University as a single, context-specific case. The aim is to describe how campus-scale spatial configuration and user perceptions appear within this setting, without pursuing broader generalization. Methods: Space Syntax metrics (integration, connectivity, visibility) and a cross-sectional survey were used to document campus-level spatial characteristics and participants’ experiences. Spatial measures were not matched to individual movement paths; thus, all patterns reflect descriptive co-occurrences rather than causal or generalizable relationships. Results: The campus displayed a center–periphery structure shaped by its historical and linear development. Higher integration, connectivity, and visibility values occurred in areas respondents described as either clear or unclear for navigation, showing context-specific overlaps between spatial structure and perception. Regression analyses indicated associations between user satisfaction and wayfinding difficulty, availability of social spaces, and cleanliness–hygiene conditions. Positive evaluations appeared to occur somewhat more often near social and green areas, consistent with observations in previous campus-based studies but only within this site. Conclusions: All findings are limited to the physical and institutional characteristics of the Balkan Campus. The study provides a strictly context-bound, exploratory description of how spatial configuration and reported experiences appear within this single campus setting.
1. Introduction
University campuses are not merely settings where academic activities take place; they are complex spatial environments that must simultaneously support users’ physical, social, and psychological needs [1]. Beyond their educational and research functions, campuses include facilities for recreation, accommodation, sports, and social interaction, all of which play a significant role in shaping users’ spatial experiences [1,2]. Despite this, studies that systematically examine how spatial organization relates to user experience—particularly those integrating both quantitative and qualitative approaches—remain limited [3]. Existing research has discussed spatial organization as being associated with patterns of mobility, wayfinding, accessibility, social interaction, and spatial perception [4].
In the literature, university campuses are typically categorized into five spatial typologies, as described in previous research:
- Urban-integrated campuses (e.g., Sorbonne, New York University), which merge with the surrounding urban fabric;
- Centralized campuses (e.g., Harvard, Oxford), which cluster academic and social functions around a core;
- Linear campuses (e.g., MIT), organized along a primary circulation axis;
- Dispersed campuses (e.g., University of London, University of California), composed of spatially separated units; and
- Cluster campuses (e.g., Stanford, Bilkent), structured around discipline-based clusters [5].
These typologies have been reported in previous studies to be associated with variations in accessibility, wayfinding, social interaction, and spatial perception [6]. Prior research has also identified relationships between spatial structures and patterns of social interaction and walkability, while fragmented or peripheral layouts have been noted as being linked to reduced spatial legibility and weaker social engagement in earlier studies [7,8]. Environmental cues such as signage, landscape elements, and spatial layout have likewise been noted to contribute to the formation of mental maps and wayfinding strategies [6]. Similarly, locating functional units within walkable distances has been described in previous research as supporting campus usability and socially sustainable mobility patterns [9,10,11].
Sustainability-oriented campus design has increasingly emphasized spatial attributes such as access to green spaces, restorative environmental quality, energy-efficient building configurations, and walkable pedestrian routes [9]. Prior studies have reported that well-designed green and open spaces are associated with psychological well-being and user satisfaction [9,10,11,12], while sustainability indicators—including land-use efficiency, environmental comfort, and active mobility—have been described as central considerations in contemporary campus planning [13]. The literature further suggests that interactions between spatial configuration and user experience need to be examined across physical, cognitive, social, and perceptual dimensions, as such an approach has been noted to provide a more comprehensive understanding of campus settings in previous research [3,13,14].
Within this context, integrative approaches combining spatial analysis with user-oriented data have been highlighted as valuable for interpreting how individuals perceive, navigate, and engage with campus environments. However, studies adopting such a comprehensive and context-specific lens remain limited. Building on this background, the present study examines how spatial organization, accessibility, wayfinding, and user experience interact within the Balkan Campus by combining Space Syntax analyses (axial, segment, and VGA) with empirical user data.
Based on this aim, the research addresses the following questions:
- How is the campus-scale spatial organization descriptively associated with users’ overall spatial experience within the Balkan Campus?
- How do spatial accessibility and wayfinding-related features correspond to users’ aggregated perceptual tendencies in this specific campus context?
- Does the Space Syntax method provide useful descriptive insight into structural accessibility patterns within the Balkan Campus?
- To what extent do aggregated user-reported experiences and campus-wide Space Syntax patterns show descriptive correspondence within this specific case?
- What campus-level spatial tendencies can be identified through Space Syntax analyses in the existing layout of the Balkan Campus?
Based on these questions, the following relational hypotheses were formulated:
H1.
Because syntactic metrics represent campus-level configurational properties rather than individual movement paths, higher global integration and connectivity values are expected to show statistically identifiable associations with aggregated user-reported accessibility, environmental comfort, safety, and spatial satisfaction.
H2.
Given the campus-scale nature of the spatial metrics, areas with higher integration values (Rn and local radius measures) are expected to be statistically associated with lower reported wayfinding difficulty and higher overall spatial satisfaction at the aggregated level.
H3.
Lower connectivity and reduced visual integration (VGA) values at the campus scale are expected to be statistically associated with lower aggregated evaluations of environmental comfort and perceived safety, acknowledging that these perceptions are not linked to individual path-level exposure.
H4.
Within the limits of campus-level configurational analysis, higher integration and visibility values are expected to be statistically associated with higher aggregated user-reported accessibility and overall spatial satisfaction, without implying explanatory or causal mechanisms.
These hypotheses were developed to explore potential relationships between Space Syntax metrics, accessibility, wayfinding, and social interaction [4,7,15].
Importantly, the spatial indicators used in this study represent campus-level configurational properties and were not matched to individual participants’ specific locations or movement paths. Accordingly, syntactic metrics describe environmental structure rather than individual spatial exposure. The ‘correspondence’ or ‘overlap’ discussed in this study therefore reflects only descriptive alignment between aggregated perceptual tendencies and campus-wide spatial patterns, rather than person-level relationships. This scale mismatch limits the interpretability and precludes any causal inference. All findings should thus be understood strictly as campus-level tendencies shaped by the environmental structure of the Balkan Campus.
Integrating these datasets enables spatial organization to be interpreted simultaneously as a measurable system and as a human-centered experience, supporting a context-specific analytical lens for examining campus-level spatial tendencies and perceptual patterns.
Literature Review
Studies on spatial organization have generally been approached through two major perspectives: analytical–structural methods and user-oriented frameworks. Analytical–structural approaches investigate the systematic properties of spatial environments using tools such as modular design, spatial geometry, and mathematical configuration [16,17]. In contrast, user-oriented research focuses on subjective dimensions, including spatial perception, environmental cognition, user experience, and human–environment interaction. Early studies examined how cognitive and perceptual processes influence individuals’ understanding of space [18,19,20], while subsequent research has suggested that cognitive mapping, accessibility, and mobility patterns [21]. Further studies have noted relationships between spatial organization and patterns of function, form, creative performance, and movement behavior [22,23]. Prior research also suggests that variations in spatial configuration may be associated with differences in navigation, social interaction, and sustainability-related outcomes—particularly walkability and mobility efficiency [24,25]. Visibility has additionally been described in earlier studies as a factor associated with wayfinding performance and spatial legibility [26].
A substantial body of literature examining relationships between spatial configuration and user experience has relied on the Space Syntax methodology. Foundational studies have reported that spatial configuration is associated with social relations, movement patterns, and spatial cognition [27]. More recent research has suggested that Space Syntax metrics can serve as useful indicators for evaluating accessibility, pedestrian flows, spatial integration, and visibility fields in built environments [27,28]. Collectively, these studies indicate that syntactic properties such as integration and connectivity have been associated with patterns of user mobility and spatial experience in previous work [11].
Recent studies have continued to expand the scope of Space Syntax applications in campus and urban environments, including analyses of spatial characteristics [29], accessibility-based optimization [30] and campus-scale spatial quality assessments [31]. These works demonstrate the growing relevance of configurational approaches in understanding campus morphology and user experience. Additional studies have explored the use of Space Syntax in digital and multi-agent simulation environments, noting its relevance for evidence-based design and post-occupancy evaluation in complex indoor settings, particularly in hospital environments [32,33,34]. Research on healthcare facilities has similarly reported associations between wayfinding performance, spatial organization, and levels of accessibility [35,36,37].
Within educational environments—and particularly in university campuses—Space Syntax research has contributed to the understanding of spatial–behavioral relationships. Several studies have reported that spatial configuration is associated with variations in students’ and academics’ mobility patterns, wayfinding strategies, and social interaction zones [38,39,40]. In campus design studies, Space Syntax has been used to support data-informed assessments by identifying spatial constraints and potential movement tendencies. Other research has examined the functional and formal characteristics of campus layouts in relation to their spatial organization [39,40], while additional studies have explored associations between spatial accessibility, perceptual tendencies, and navigation behavior [3,41,42]. Previous work has also noted the importance of addressing poorly connected spaces, as such areas have been associated with reduced walkability and weakened sustainable mobility in earlier studies [41,42]. Evidence further suggests that wayfinding behavior may differ between multi-story and single-level buildings, underscoring the complex relationship between spatial cognition and vertical circulation [43,44].
Overall, existing literature approaches spatial organization through both systematic and user-centered perspectives [44,45]. However, methodological studies that integrate Space Syntax metrics with user experience data remain limited [28,41]. Three major components typically appear in interdisciplinary studies of this kind:
- Identifying accessibility patterns and spatial structures through syntactic analyses [15,39,46];
- Collecting user-experience data through surveys and observational methods [47,48,49]; and
- Comparing these datasets to examine perceptual and functional dimensions of spatial organization [50].
Within the context of sustainability, previous studies have suggested that spatial configuration may be associated with walkability, social interaction, mobility efficiency, and overall spatial comfort—factors frequently discussed in research on sustainable campus environments [24,32,42,51]. Furthermore, recent contributions have highlighted the role of configurational analysis in sustainable campus planning, such as spatial–temporal optimization strategies for mobility infrastructure [52]. Meta-analyses have further indicated that spatial integration and connectivity metrics correspond with campus walkability and low-carbon mobility patterns in earlier research [53,54].
Recent reviews of Space Syntax research have additionally demonstrated the methodological diversification and expanding thematic scope of the field, particularly in relation to sustainability, user experience, and environmental performance assessments [55]. At the same time, architectural research has emphasized that spatial configurations acquire meaning through contextual, cultural, and regional conditions, cautioning against universal or decontextualized interpretations of spatial structure [56]. Evidence from environmental psychology likewise suggests that perceptual attributes of the built environment—such as visual access and environmental views—can significantly influence well-being and experiential outcomes, underscoring the importance of perceptual dimensions alongside analytical spatial metrics [57]. Accordingly, the literature suggests that integrating user perceptions with analytical spatial metrics can provide a more comprehensive basis for interpreting how built environments perform from spatial and environmental sustainability perspectives [54].
In line with this literature, the present study integrates Space Syntax analyses with user-experience data within a comparative and multidisciplinary framework. By combining human-centered insights with quantitative spatial analyses, the study evaluates spatial organization as both a measurable system and an experiential environment. All interpretations are strictly limited to the conditions of the Balkan Campus, and the analytical approach is intended to offer a context-specific perspective rather than a generalizable framework beyond this particular setting.
2. Materials and Methods
This research employed a mixed-methods design to document campus-scale spatial configuration and aggregated user-reported experiences within the Balkan Campus. This approach enables descriptive comparison of spatial patterns and perceptual tendencies. Integrating quantitative and qualitative approaches enabled the examination of spatial configuration alongside users’ perceptual and sustainability-related evaluations. An overview of the methodological workflow applied in this study is presented in Figure 1.
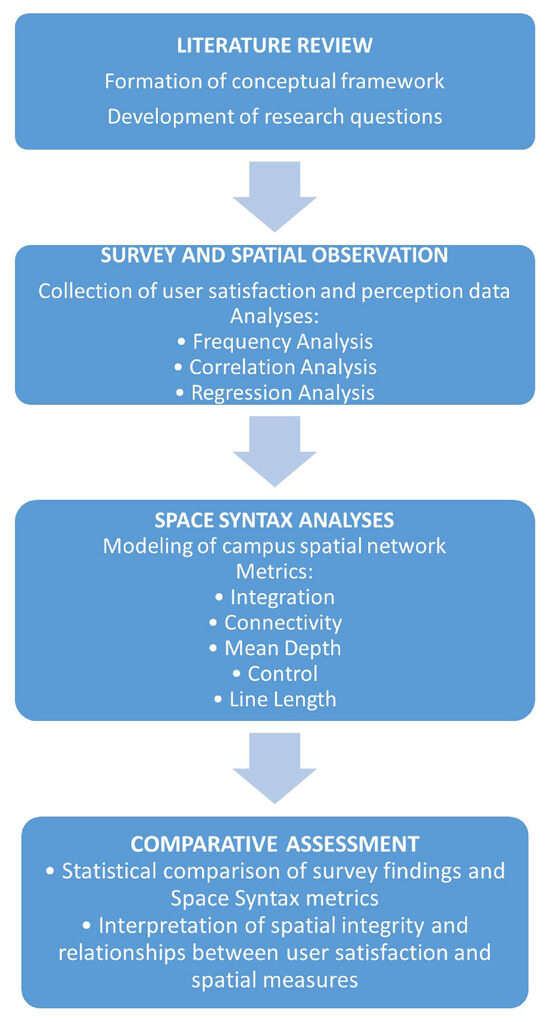
Figure 1.
Schematic representation of research stages.
- (1)
- Research questions and spatial data documentation
Research questions were formulated based on gaps identified in the literature concerning spatial configuration, accessibility, wayfinding, and perceived environmental quality. Spatial data—including building footprints, pathways, open spaces, and circulation networks—were documented through on-site observations, GIS-based mapping, and photographic records.
- (2)
- Survey data collection and field observations
A structured questionnaire was administered in both online and face-to-face formats. The survey collected demographic characteristics and user perceptions related to accessibility, wayfinding, spatial satisfaction, environmental comfort, safety, and sustainability awareness. Field observations were used to document general spatial conditions—including circulation patterns, visibility characteristics, and environmental comfort—at the campus scale.
Sampling frame and response characteristics
Simple random sampling procedures were initially attempted within the accessible campus population. However, due to the mixed distribution methods (online and face-to-face), the practical sampling frame consisted of students, academic staff, and administrative personnel who were either present on campus or reachable through institutional communication channels during the data-collection period.
No stratification or quota procedures were applied. The final sample reflects voluntary participation, and invalid questionnaires were excluded based on predefined criteria (e.g., missing more than 10% of mandatory items, patterned responses, or contradictory answers). During the data collection process, approximately 1150 individuals were contacted through institutional e-mail invitations and 420 individuals were approached on campus through random intercept sampling. A total of 612 responses were received (overall contact–response ratio ≈ 38.1%). After applying exclusion criteria, 398 surveys remained valid for analysis (valid-case ratio ≈ 65%). Although this number is adequate for descriptive and correlational analysis, the absence of refusal-rate documentation limits the assessment of potential non-response bias and further restricts the ability to evaluate how non-response patterns may have shaped the final sample composition.
These factors introduce potential forms of sampling bias, and the resulting sample should therefore be interpreted as context-specific rather than generalizable beyond the conditions of the Balkan Campus. Additionally, because the sample is predominantly composed of 18–24-year-old undergraduate students the findings may reflect the perceptual tendencies of this demographic group more strongly than those of older staff or long-term campus users. This age-skewed composition represents an important limitation when considering the generalizability of perceptual evaluations across all campus populations.
- (3)
- Spatial analysis using Space Syntax techniques
Spatial metrics were calculated at the campus scale and were not linked to individual movement paths or specific locations reported by participants. Therefore, the study does not attempt to establish person-level associations between configuration and perception; all results reflect campus-level descriptive tendencies.
Spatial configuration was analyzed using DepthmapX (version 0.50), University College London, London, UK. Axial and segment-based analyses were performed to compute Integration, Connectivity, Choice (betweenness), Mean Depth, Line Length, and Control values. Visibility Graph Analysis (VGA) was carried out using a 2 m grid resolution and an eye height of 1.6 m, with both global (Rn) and local (R3) radii.
Mathematical and Conceptual Basis of Space Syntax
Space Syntax is a graph-based analytical framework that models spatial configuration using axial lines, segments, or visibility cells. Its mathematical basis relies on representing spatial systems as graphs in which spaces (nodes) are connected through lines of movement or visibility (edges). DepthmapX 0.50 computes syntactic variables through topological and metric graph operations.
Integration (Rn, R3) represents how close a space is to all other spaces in the system. It is derived from the mean depth (MD) of each node:
MD formula:
where d(i,j) denotes the shortest topological distance between nodes i and j.
Lower MD values indicate higher spatial centrality and stronger configurational accessibility.
Integration is normalized using Real Relative Asymmetry (RRA):
RRA formula:
This normalization reduces graph-size bias and expresses integration on a standardized scale.
Connectivity represents the number of directly connected neighbors of each node and reflects its immediate spatial accessibility.
Choice (betweenness centrality) evaluates how often a node lies on the shortest paths between all pairs of spaces, expressing its control over movement flow:
Choice formula:
where σ_jk is the number of shortest paths from j to k, and σ_jk(i) is the subset of those paths that pass through node i.
Visibility Graph Analysis (VGA) produces a cell-based graph in which each grid cell is represented as a node, and edges are formed when two cells are mutually visible. Depth and integration in VGA are computed using the same shortest-path algorithms and RRA normalization applied to the visibility graph. VGA allows the analysis of openness, enclosure, sight-based navigability, and spatial intelligibility.
Axial, segment, and VGA computations in this study followed DepthmapX’s standardized algorithms using Dijkstra-based shortest-path calculations and syntactic normalization procedures commonly applied in campus-scale Space Syntax research.
Justification of parameter and processing choices
The selected parameters reflect established practice in campus-scale Space Syntax research.
- A 2 m VGA grid provides a balance between computational efficiency and pedestrian-scale visibility.
- An eye height of 1.6 m represents the average adult visual horizon used widely in syntax studies.
Spatial data were processed in WGS84/UTM Zone 35N, and building footprints and pathways were topologically cleaned prior to analysis.
Vegetation handling:
Seasonal vegetation (trees, shrubs, foliage) was excluded from obstruction modeling to avoid short-term variability; only built structures were treated as occluding elements, consistent with outdoor VGA conventions. This decision follows common campus-scale visibility research, where vegetation is excluded because its occlusion properties vary seasonally and do not represent long-term structural barriers.
To generate the VGA layer, high-resolution satellite imagery was obtained via Google Earth (Google LLC., Mountain View, CA, USA), with an approximate spatial resolution of 0.5–1.0 m. The acquisition date and season were checked to ensure minimal interference from temporary foliage. Only permanent built structures were retained as visibility obstacles. Sensitivity tests with 1 m and 3 m grids yielded stable spatial hierarchies, supporting the robustness of selected parameters.
Visibility analysis was extended southward only to the main vehicular corridor forming the functional boundary of the campus. Areas beyond this threshold were excluded because they fall outside pedestrian-accessible zones. Accordingly, the visibility results and center–periphery distinctions should be interpreted as reflecting only the pedestrian-accessible areas within the Balkan Campus. Although vegetation can influence visibility during leaf-on periods, visual comparisons of leaf-on and leaf-off imagery indicated that major visibility corridors and primary spatial barriers on the Balkan Campus are determined mainly by permanent buildings. For this reason, the effect of excluding vegetation is expected to be limited in magnitude and localized rather than systematic. Any vegetation-related bias is therefore unlikely to alter the overall spatial hierarchy observed in the VGA distribution.
Normalization and metric scaling
All Space Syntax metrics were normalized following standard syntactic conventions as implemented in DepthmapX:
Integration values were normalized using RRA (Real Relative Asymmetry).
Connectivity values represent raw counts of directly connected segments.
Choice values were normalized using the standard DepthmapX choice formula.
Mean Depth and Control values reflect DepthmapX-normalized outputs.
Metric ranges (e.g., Integration ≈ 0.50–1.60; Connectivity ≈ 1–14; Choice ≈ 0–1 normalized) are provided in Table 1 support interpretability. Building-level integration values correspond to RRA-normalized global integration metrics.

Table 1.
Balkan Campus Space Syntax Results (All metrics in normalized DepthmapX units except Connectivity = degree and Line Length = meters).
- (4)
- Qualitative analysis of open-ended responses
Open-ended responses were analyzed using an inductive qualitative content analysis approach. Two independent coders conducted open coding to identify recurring concepts related to accessibility, wayfinding, environmental comfort, social spaces, and sustainability. The coding framework was refined through axial coding until thematic categories were established.
Intercoder reliability was assessed using Cohen’s Kappa (κ = 0.82), indicating a high level of agreement between coders. Any discrepancies were resolved through discussion, after which the finalized codes were applied to the full dataset.
Frequency summaries and representative excerpts were used to illustrate key themes. All qualitative interpretations were treated as descriptive insights rather than quantifiable effects, and their relevance should be understood strictly within the contextual conditions of the Balkan Campus.
- (5)
- Statistical analysis integrating user-based and spatial metrics
Survey data were analyzed using descriptive statistics, correlations, and regressions to explore descriptive correspondence between user-reported perceptions and campus-scale spatial metrics. Diagnostic checks were conducted for normality, heteroscedasticity, and multicollinearity to assess the suitability of the regression models.
Open-ended responses were examined using descriptive content analysis to identify recurring themes related to accessibility, environmental quality, and sustainability awareness.
Regression diagnostics included:
- Residual normality (Shapiro–Wilk test, Q–Q plots),
- Heteroscedasticity (Breusch–Pagan and White tests),
- Multicollinearity (Variance Inflation Factors, tolerance values, and condition indices),
- Influence diagnostics (Cook’s distance, leverage values, standardized residuals).
No severe violations were detected within the limits of the dataset, allowing the regression models to be interpreted within acceptable diagnostic thresholds. However, all statistical associations are interpreted cautiously and are not assumed to imply causation.
Missing data handling
The dataset was screened for missing values. Cases with more than 10% missing responses were excluded to maintain data quality, and item-level missingness remained below 3% across all variables. This 10% threshold was applied consistently across all stages of data cleaning, and earlier references to a 20% threshold were corrected as drafting errors.
Little’s MCAR test indicated no systematic missingness (p > 0.05). Accordingly, listwise deletion was used. Sensitivity checks using pairwise deletion produced similar coefficient directions and significance patterns, suggesting that the chosen missing-data procedure did not materially influence the results. The original dataset included N = 398 responses. After applying the 10% missingness exclusion criterion and listwise deletion in regression models, the final analytic sample consisted of N = 392 participants.
No correction for multiple comparisons was applied; therefore, p-values in the 0.05–0.10 range are interpreted with caution and not treated as evidence of statistical significance.
2.1. Study Area: Trakya University Balkan Campus
The study was conducted on the Balkan Campus of Trakya University, located in Edirne, Türkiye. Covering approximately 221.5 hectares, it is the university’s largest and most functionally diverse campus. It hosts 14 faculties, 1 conservatory, 5 institutes, 4 schools, 10 vocational schools, and a range of social and administrative facilities [58]. Buildings constructed over different periods since the 1970s contribute to a spatial structure in which certain areas exhibit discontinuities between buildings, interruptions along pedestrian axes, and variability in the availability of social interaction spaces, as observed during field documentation. Green spaces are present throughout the campus; however, landscape and open-space arrangements show differing levels of cohesion and do not consistently reflect a unified sustainability-oriented planning strategy. Major shared facilities such as the library, dining halls, and social areas function as prominent activity nodes, while some faculty zones show lower levels of spatial interaction, possibly due to limited gathering areas and variations in spatial legibility.
The campus accommodates approximately 35,000 students, 2500 academic and administrative staff, and numerous daily visitors, representing diverse demographic and experiential profiles. Although the campus is accessible by public transportation and private vehicles, previous assessments and institutional reports have noted that discontinuous pedestrian routes, limited signage, and peripheral parking areas may challenge accessibility and sustainable mobility (Figure 2). As outlined in the TR21 Regional Development Plan, the Balkan Campus is identified as an area where improvements in functional integration, pedestrian continuity, and environmentally sustainable spatial planning are recommended [59]. These conditions make the campus a suitable context for examining user-centered parameters such as accessibility, wayfinding, environmental comfort, safety perception, social interaction, spatial satisfaction, and sustainability awareness.
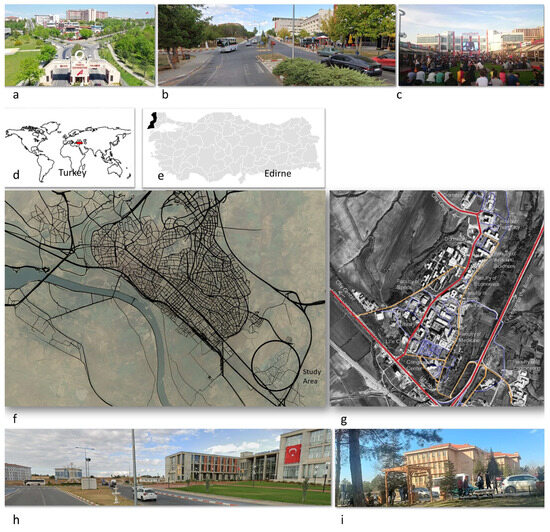
Figure 2.
(a) Campus entrance from the south and the Faculty of Medicine, (b) Main axis extending northward, with the Faculty of Theology on the right, (c) Delta Life Center, (d) Türkiye’s location on the world map, (e) Edirne’s location on the map of Türkiye, (f) Map showing the relationship between the study area and the road network of Edirne Central District, (g) Campus satellite image and transportation road axes, red lines denote primary routes, while yellow and blue lines represent secondary and tertiary routes. (h) At the northern end of the main axis: Faculty of Pharmacy on the right and student dormitories on the left, (i) Central Library.
2.2. Data Collection
A structured questionnaire was administered between March and May 2025 using both face-to-face and online formats. Simple random selection procedures were initially attempted using the institutional registry; however, the final sample reflects voluntary participation rather than a fully representative or stratified sample. To reduce potential selection bias associated with the mixed distribution method (online and in-person), individuals were randomly contacted through institutional e-mails and approached at multiple on-campus locations. Because the study employed a cross-sectional, non-experimental design, no causal inference was attempted, and all analytical interpretations focus on associations rather than cause–effect relationships.
Sampling procedure and response rate
Institutional records did not include the total number of individuals who received the survey link; therefore, a precise response rate and refusal count could not be calculated. The survey was distributed through class email lists and departmental announcements, and participation was voluntary. All participants who completed the questionnaire and met the inclusion criteria were retained in the analytic sample (N = 398). Although the absence of refusal counts limits the ability to compute a formal response rate, the sampling strategy followed a simple random selection within the available student population, and both online and face-to-face data collection applied the same randomization principle.
The survey included sections on demographics, wayfinding, accessibility, spatial satisfaction, social interaction, safety, environmental comfort, and sustainability-related perceptions. It consisted of multiple-choice, open-ended, and 5-point Likert-type items. A pilot study with 50 participants yielded a Cronbach’s Alpha of 0.85, indicating acceptable internal consistency for the instrument.
Scale reliability and construct validity
Cronbach’s Alpha values for the multi-item perception scales in the full sample ranged from 0.78 to 0.88, which is generally considered indicative of acceptable to good internal consistency for survey-based research. Exploratory Factor Analysis (EFA) was conducted using principal axis factoring with oblimin rotation. Across the retained components, item loadings exceeded 0.40 and did not exhibit substantial cross-loadings, suggesting an interpretable factor structure within the limits of an exploratory design. Because the study did not employ predefined latent constructs, confirmatory factor analysis (CFA) was not conducted. A summary of key survey items and descriptive results is provided in the Supplementary Tables to support transparency in reporting and to assist readers in evaluating the survey findings.Following the pilot study, three items were refined for clarity. Ethical approval for all procedures was obtained from the Trakya University Ethics Committee (Approval No. 2025.03.19).
Spatial data were collected through field observations, photography, and digital mapping. Analyses were conducted using DepthmapX 0.50, applying axial and segment analyses, as well as Visibility Graph Analysis (VGA). The VGA grid size (2 m) and eye height (1.6 m) were selected based on parameters commonly used in previous syntactic studies of outdoor campus settings and to balance spatial resolution with computational efficiency. Global (Rn) and local (R3) radii were used to compute Integration, Connectivity, Choice (betweenness), Control, Mean Depth, and Line Length. In this study, these metrics were employed to characterize configurational properties of the Balkan Campus, with interpretations limited to general structural tendencies rather than direct predictions of movement patterns.
2.3. Statistical Analysis
Survey data were analyzed using SPSS 27.0. Descriptive statistics (frequencies, means, standard deviations) were computed, and Pearson correlations were used to examine associations between spatial integration and wayfinding-related perceptions. Multiple linear regression analyses were conducted to explore how accessibility, environmental comfort, and sustainability-related perceptions were statistically associated with user satisfaction. Consistent with the cross-sectional and non-experimental design, all analytical results were interpreted strictly as correlational, not causal.
Model diagnostics were performed to assess analytical assumptions. Residual normality was evaluated using Q–Q plots and the Shapiro–Wilk test; homoscedasticity was examined through residual–fitted value plots and the Breusch–Pagan test; and multicollinearity was assessed using Variance Inflation Factors (VIF < 3). Additional indicators such as ANOVA F-statistics and Durbin–Watson values were reviewed to confirm model adequacy. Open-ended responses were examined using descriptive content analysis. A two-stage coding procedure was applied, with two independent coders developing the coding framework; intercoder reliability, assessed through Cohen’s Kappa (κ = 0.81), indicated strong agreement.
Because the Space Syntax methodology does not account for material, environmental, or socio-psychological variables, interpretations of syntactic outputs were treated with caution. To provide contextual grounding, syntactic results were compared with survey responses and qualitative field observations. This triangulation was used to support a more nuanced, context-specific interpretation of spatial conditions within the Balkan Campus, rather than to establish generalizable methodological claims [54].
3. Results
This section presents the findings from the Space Syntax analyses (Integration, Connectivity, Choice, Mean Depth, Line Length, Control, and VGA) together with the results of the user survey. These datasets are reported side by side to describe spatial patterns, accessibility conditions, and visibility structures within the Balkan Campus. The combined presentation is intended solely to show how spatial metrics and user-reported perceptions appear within this particular campus context, without implying causal or generalizable relationships beyond the scope of the study.
3.1. Spatial Integration Analysis
The axial and segment-based Space Syntax analyses showed a differentiated spatial hierarchy within the Balkan Campus based on the syntactic model. Global Integration (Rn) values were highest along the central north–south spine connecting the Rectorate, Library, and the main pedestrian boulevard (Figure 3). In the syntactic output, these segments exhibited higher values relative to other parts of the campus, indicating their position within the calculated configurational structure. These results reflect properties of the analytical model only and do not represent observations of actual user movement.
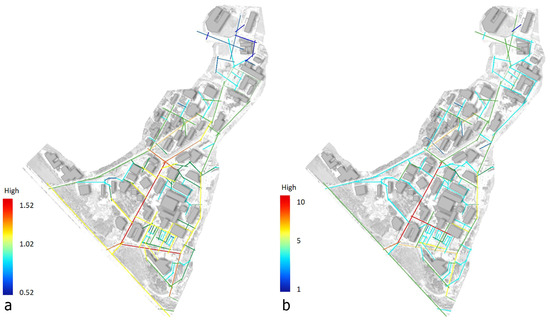
Figure 3.
Integration and Connectivity maps of Balkan Campus. (a) Integration. (b) Connectivity. Note: Red tones indicate higher metric values, while blue tones represent lower values. The Rectorate area exhibits the highest values within the campus network, whereas the dormitory clusters and the Engineering Faculty correspond to zones with consistently lower values.
In contrast, the peripheral faculties—particularly the Engineering Faculty, Faculty of Pharmacy, and the dormitory clusters—showed lower integration values in the syntactic model (Figure 3), indicating their relatively less central positions within the calculated spatial configuration. Connectivity outputs displayed a similar distribution: segments with higher connectivity appeared around centrally located academic and administrative buildings (Figure 3), while peripheral buildings were associated with lower connectivity values in the model. These patterns represent configurational properties of the Space Syntax analysis and do not imply functional or behavioral isolation.
The connectivity map showed an uneven distribution of intersecting pathways within the syntactic model, indicating variations in the number of direct links between segments rather than a uniform pattern across the campus. Local Integration (R3) values displayed a similar distributional pattern, with higher values calculated around centrally located facilities and lower values toward peripheral units. These results reflect differences in configurational properties within the analytical model, with central areas receiving higher computed values and peripheral areas receiving lower ones.
Choice (betweenness) values, shown in Figure 4, indicated that the central spine received the highest computed choice values within the syntactic model. Only a limited number of other segments exhibited relatively elevated values, reflecting the distribution of calculated route-based measures within the model. Line Length variations (Figure 4) showed differences across the campus, with some peripheral areas displaying longer linear segments that transitioned into shorter or narrower segments in the syntactic representation. These transitions correspond to zones that participants described in the survey as areas where navigation felt less clear; however, this correspondence reflects a descriptive comparison rather than any directional or causal relationship. The syntactic results and user-reported perceptions are therefore presented as parallel observations without implying any functional or behavioral conclusions.
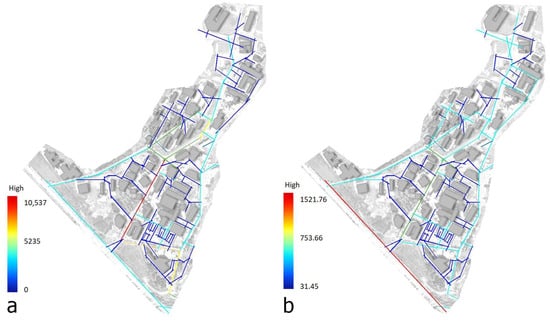
Figure 4.
Choice and Line Length maps of Balkan Campus. (a) Choice. (b) Line Length. Note: Yellow–red areas represent segments with higher centrality and greater syntactic accessibility, whereas blue tones indicate more peripheral zones with lower accessibility values.
The Mean Depth metric, which represents the average number of steps required to reach a segment from all other segments in the syntactic model, showed clear variations across the campus. As presented in Figure 5, lower depth values (5/5) were calculated around the Rectorate and Library area, while higher depth values (1–2/5) appeared along the northwestern axis, including the Engineering Faculty, Pharmacy Faculty, and dormitory clusters. These computed depth differences reflect configurational distinctions within the model. Although some of these locations were also described by participants as areas where navigation felt less clear, this correspondence is presented solely as a descriptive comparison and does not imply any behavioral, functional, or predictive relationship. No broader interpretive or sustainability-related inferences are drawn from the depth results.
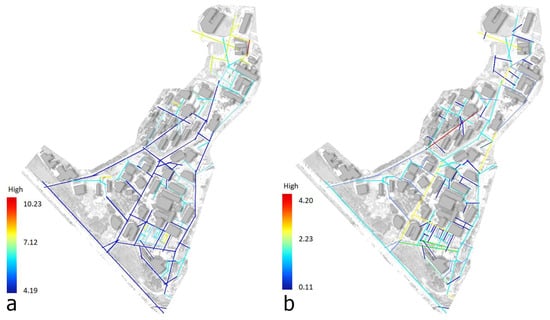
Figure 5.
Mean Depth and Control maps of the Balkan Campus. (a) Mean depth. (b) Control.
The Control metric represents the extent to which a segment within the syntactic model is connected to and has immediate access to adjacent segments. As shown in Figure 5, the central north–south spine displays higher calculated control values, while peripheral roads show lower values. These differences reflect localized configurational properties within the model. Although participants described some central areas as easier to navigate, this comparison is presented solely as a descriptive alignment between syntactic outputs and reported perceptions, without implying any functional, behavioral, or causal relationship. No sustainability-related or activity-based interpretations are derived from the control-value distribution.
Overall, the Mean Depth and Control analyses showed variations in computed syntactic values across different parts of the campus. These results describe differences in configurational characteristics within the model only and do not indicate movement patterns, functional conditions, or prescriptive implications. The observed distributions are presented as model-based outputs specific to the Balkan Campus and are not interpreted beyond this context. No sustainability-related, behavioral, or system-wide planning inferences are drawn from these metrics.
3.2. VGA (Visibility Graph Analysis)
The Visibility Graph Analysis (VGA) showed variations in calculated visual connectivity across the Balkan Campus. As displayed in Figure 6, the central pedestrian axis and adjacent open areas received the highest computed VGA values (top 20–10%) within the model. These areas include segments surrounding the Rectorate, Library, and the main pedestrian corridor. In contrast, peripheral academic units—particularly those toward the northern and northwestern edges—received lower VGA values in the syntactic output.
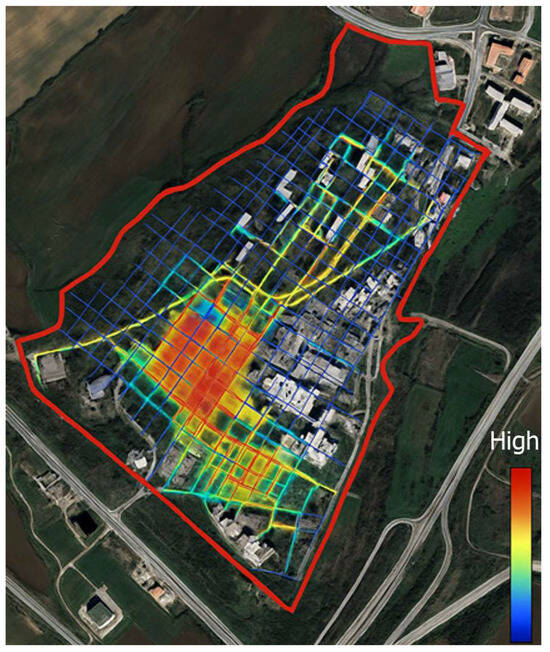
Figure 6.
Visual Graph Analysis (VGA) map of Balkan Campus. Note: Red areas indicate zones with higher visual accessibility, whereas blue tones represent areas with lower visual accessibility.
The comparison between VGA outputs and survey findings is presented only at a descriptive level: some zones with higher or lower model-based visibility values were also mentioned by participants in their responses. This correspondence is not interpreted as explanatory or causal.
VGA results also show that segments with higher computed visibility values occur in locations where other syntactic metrics (such as Integration and Connectivity) also produce relatively higher values. Conversely, segments with low VGA values coincide with areas where higher Mean Depth and lower Connectivity values were calculated. These observations reflect overlaps between different syntactic measures within the analytical model and are not interpreted as indicating functional, behavioral, or performance-related characteristics.
Sustainability-oriented interpretive statements were not derived from the VGA results. Because VGA produces model-based measures of visual connectivity, its outputs were evaluated strictly within the syntactic framework and not linked to any behavioral, perceptual, or sustainability-related constructs. Although participants reported different experiences in various parts of the campus, these reports are treated independently from the VGA values and are not compared for explanatory or interpretive purposes. No social, environmental, or mobility-related conclusions are drawn from the VGA patterns in this study.
- Design-related Interpretations
No planning or design-related interpretations were derived from the VGA results. The VGA outputs identify areas with higher or lower computed visibility values within the syntactic model, but these findings are presented solely as model-based measurements. Although some peripheral areas showed lower VGA values, these results are not interpreted in terms of centrality, connectivity, design resilience, spatial coherence, or circulation usability. Mentions of participant perceptions are treated independently of the VGA metrics and are not linked for explanatory or evaluative purposes.
Taken together, the VGA findings indicate variations in calculated visual connectivity across the campus. These values are reported descriptively and reflect only the configurational characteristics of the analytical model. No conclusions are drawn regarding user experience, perceived environmental conditions, safety, spatial quality, or sustainability. The VGA results are therefore presented strictly within the syntactic framework and without broader interpretive extensions.
The distribution of Space Syntax metrics for specific buildings is presented in Table 1, and their spatial patterns are illustrated in Figure.6 The heatmap shows variations in computed integration, connectivity, and visibility values across different campus zones (Figure 7). These variations represent configurational distinctions within the syntactic model. Although participants mentioned differences in their experiences across campus areas, these reports are treated independently from the syntactic outputs and are not linked for explanatory, predictive, or interpretive purposes. Higher or lower syntactic values are reported solely as model-based calculations, without implying differences in use, activity levels, movement patterns, or perceptual conditions. No sustainability-, mobility-, or safety-related interpretations are drawn from these spatial patterns.
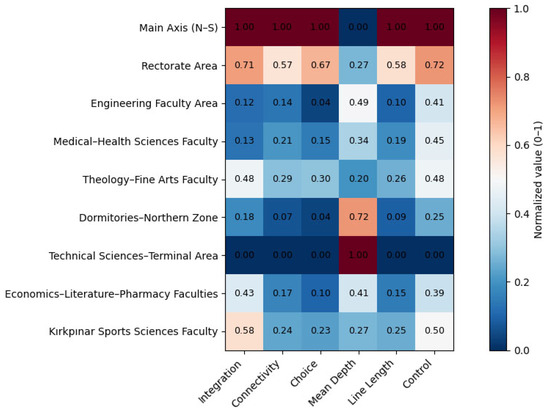
Figure 7.
Heatmap of Space Syntax Metrics of the Buildings in the Balkan Campus.
Overall, the syntactic analyses showed variations in computed accessibility, visibility, and other configurational measures across different parts of the Balkan Campus. These values reflect model-based differences only. Although participants reported varying experiences in different campus areas, these perceptions are treated separately from the syntactic metrics and are not linked for explanatory or interpretive purposes. The distinctions observed in the model are presented solely as analytical outputs specific to the Balkan Campus. No inferences are made regarding user behavior, perceived accessibility, safety, mobility, or sustainability-related planning considerations.
The Space Syntax analyses produced variations in computed Integration, Connectivity, and Choice values across the campus. Higher values were calculated around the Rectorate, Library, and the main circulation spine, while lower values appeared in peripheral areas such as the Engineering Faculty, Faculty of Pharmacy, and the dormitory clusters. These results represent configurational distinctions within the analytical model only and do not imply differences in use, activity levels, or movement patterns.
Control and Choice analyses showed that segments along the main spine received relatively higher computed values within the syntactic outputs. These findings are reported solely as structural characteristics of the model.
The VGA results indicated differences in calculated visual connectivity, with higher values around the Rectorate and Library and lower values in several peripheral areas. These VGA outputs are model-based and are not interpreted in relation to user perceptions, behavioral tendencies, or safety-related evaluations. All syntactic and visibility results are presented descriptively and are not linked to explanatory or causal interpretations.
Taken together, the syntactic results presented in this study describe variations in the computed configurational properties of the Balkan Campus. These findings are reported solely as model-based outputs and are not extended to planning, design, behavioral, perceptual, or sustainability-related interpretations. No inferences are drawn regarding spatial coherence, accessibility, mobility, or long-term adaptability. The results are limited to describing the configurational characteristics identified within the analytical model and are not intended to inform prescriptive or evaluative frameworks beyond this specific campus context.
3.3. User Survey Findings
The user survey was completed by 398 participants. As summarized in Table 2, the sample includes individuals from different age groups, academic roles, and campus-use characteristics. The survey responses provide descriptive information about participants’ reported experiences related to accessibility, wayfinding, social interaction, and overall spatial conditions on the Balkan Campus. These findings are presented independently of the syntactic results and are not interpreted as being linked to spatial configuration or as implying any causal or explanatory relationships.
Table 2.
Demographic Characteristics of the Participants.
Participants reported different levels of satisfaction with various aspects of the campus environment. Issues mentioned by respondents included wayfinding difficulty, the availability of social spaces, and concerns related to cleanliness and hygiene. These survey responses are presented independently from the syntactic analyses and are not interpreted as being linked to spatial configuration or as reflecting any spatial contrasts.
A multiple regression analysis was conducted to examine associations among user-reported variables and overall satisfaction with the campus building layout. The dependent measure was the 5-point Likert item “How satisfied are you with the layout of the buildings on campus?” The model was statistically significant (F(10, 387) = 4.728, p < 0.001) and accounted for 10.9% of the variance (R2 = 0.109; Adj. R2 = 0.086) (see Table 3.a for ANOVA model significance). Given the limited explanatory power, the results are reported strictly as statistical associations without causal interpretation. As shown in Table 3, three survey variables displayed statistically significant associations with satisfaction: availability of social spaces, wayfinding difficulty, and cleanliness/hygiene concerns. These findings reflect patterns within the survey dataset only and are not connected to syntactic measures.
Table 3.
The Effect of Perceived Difficulties on Campus Satisfaction (Multiple Regression Analysis) and Overall Model Significance (ANOVA-F Test).
Lack of social spaces (β = 0.340, p = 0.001).
Wayfinding difficulty (β = 0.463, p = 0.003).
Cleanliness and hygiene issues (β = 0.258, p = 0.021).
Although the model explains only a modest proportion of variance, the statistically significant associations correspond to thematic dimensions frequently discussed in sustainability-oriented campus research and should be interpreted strictly within the context of the Balkan Campus:
- (1)
- Mobility-related considerations
User reports of wayfinding difficulty appeared in campus areas that also showed higher spatial depth or reduced visual continuity in the syntactic analyses. This reflects an overlap between configurational patterns and perceptual responses, without implying any causal or directional relationship.
- (2)
- Social sustainability considerations
Concerns regarding the availability of social spaces relate to user perceptions of opportunities for interaction and informal gathering across different zones of the campus. These perceptions align with sustainability discussions that emphasize the role of socially supportive environments, but the association remains context-specific.
- (3)
- Environmental quality considerations
Cleanliness and hygiene issues correspond to user comments about physical comfort and perceived environmental quality in shared outdoor spaces. These perceptions were more frequently noted in areas identified in field observations as having limited maintenance or inconsistent landscape continuity.
Variables related to transportation, parking, study spaces, dining facilities, techno-logical infrastructure, safety, and dormitory conditions were not statistically significant (p > 0.05). Within this dataset and campus context, these factors did not demonstrate strong associations with overall spatial satisfaction compared with the three variables described above.
According to the regression model, wayfinding difficulty displayed the strongest statistical association with lower satisfaction (β = 0.463, p = 0.003). This association reflects user perceptions of navigation challenges that may relate to multiple experiential factors, including the spatial arrangement of buildings, the location and distribution of social spaces, maintenance conditions, and the clarity of wayfinding elements. These tendencies parallel the configurational findings, as campus zones with lower integration values were also described by users as more difficult to navigate. This represents descriptive convergence rather than any explanatory or causal linkage. The overlap simply indicates locations where syntactic patterns and user-reported perceptions coincide, without implying directional or prescriptive implications.
Within this interpretive framework, wayfinding, the availability of social spaces, and hygiene conditions appear as perceptual dimensions that show notable associations with overall spatial satisfaction. These dimensions are also frequently referenced in sustainability-oriented campus research, particularly in relation to mobility experience, social interaction opportunities, and perceived environmental quality. The significance of these associations suggests that user satisfaction reflects a combination of experiential factors rather than building layout alone. Although the regression model is statistically significant, its modest explanatory power indicates that the findings should be interpreted as context-specific associations rather than generalizable or causal relationships.
A second multiple regression model was applied to explore the statistical associations between participants’ most appreciated campus features and their satisfaction with the overall spatial layout. The results of this model are presented in Table 4. The model was statistically significant (F(10, 387) = 4.194, p < 0.001) and accounted for 9.6% of the variance in satisfaction (R2 = 0.096, Adj. R2 = 0.073). Given its modest explanatory power, all results should be interpreted as correlational and strictly descriptive rather than causal. As shown in Table 4, two variables—social spaces (β = −0.510, p = 0.001) and green areas (β = −0.327, p = 0.013)—displayed statistically significant associations with satisfaction. The negative β coefficients reflect an inverse relationship within the model’s coding structure, indicating that higher appreciation of these features corresponds to lower scores on the dissatisfaction scale.
Table 4.
Multiple Regression Results for Preferred Campus Features Predicting Spatial Satisfaction.
These associations parallel themes frequently discussed in sustainability-oriented campus research, particularly regarding the perceptual value of social interaction areas and green/open spaces. In the present context, the statistical patterns indicate that participants who reported greater appreciation of these features also tended to report more positive evaluations of the structural layout. These tendencies should not be interpreted as evidence of direct effects or underlying causal mechanisms; instead, they represent context-specific overlaps between user perceptions and prominent spatial characteristics of the Balkan Campus.
The regression findings indicate that social spaces and green areas exhibited the strongest statistical associations with satisfaction among the variables included in the model. In sustainability-oriented literature, these features are frequently discussed as perceptual components of campus experience; however, the present interpretation remains strictly limited to the Balkan Campus context. In this study, participants rated social and green areas positively, and higher appreciation of these features corresponded to lower scores on the dissatisfaction scale within the regression structure. These descriptive associations parallel themes noted in earlier studies regarding the perceived value of open and green spaces for comfort and well-being, without implying any causal or predictive mechanisms [9,10,11].
Academic buildings and event/student club spaces displayed borderline significance, suggesting that their perceived contribution to spatial experience may vary across users in this particular setting. The negative trend associated with event and club areas may relate to user perceptions of distribution, proximity, or clustering of activity spaces, although these patterns should be interpreted cautiously due to the model’s modest explanatory power. Other variables—such as sports facilities, libraries, technological infrastructure, transportation systems, and cafeteria services—did not show statistically significant associations, indicating comparatively neutral roles within this dataset and analytical context.
The analysis also identified several statistically significant relationships between demographic characteristics and perceived spatial challenges. Age showed the strongest correlation with parking-related difficulties (r = 0.39, p < 0.001) and a weaker but significant positive correlation with wayfinding difficulty (r = 0.12, p = 0.019). These results indicate that age groups differed in their reported experiences within these domains, without implying any directional or explanatory mechanism.
Institutional position demonstrated negative correlations with several reported difficulty areas—including cleanliness and hygiene (r = −0.24, p < 0.001), technological infrastructure (r = −0.18, p < 0.001), safety (r = −0.16, p = 0.001), parking (r = −0.25, p < 0.001), and wayfinding (r = −0.10, p = 0.039). These patterns reflect variations in reported perceptions across academic and administrative roles, and are interpreted descriptively rather than as indicating underlying causal processes.
Length of stay on campus showed low-level positive correlations with perceived issues related to cleanliness and hygiene (r = 0.10, p = 0.043), technological infrastructure (r = 0.12, p = 0.020), and parking (r = 0.14, p = 0.007), suggesting that users with longer campus exposure reported these concerns slightly more frequently within the dataset. Gender displayed minimal associations, with transportation satisfaction showing a marginal non-significant trend (r = 0.09, p = 0.060).
All correlation coefficients are presented in Supplementary Table S1 and visualized in Supplementary Figure S1. These results describe how perceptual evaluations vary across demographic groups within the Balkan Campus, without indicating any causal direction or broader generalizability beyond this specific context [59].
To explore demographic patterns related to accessibility, additional correlations were examined between age, gender, institutional position, length of stay, and key accessibility indicators—including signage, inter-building pathways, pedestrian routes, and building layout. These results are presented in Supplementary Table S2. Age showed a low-level negative correlation with satisfaction related to pedestrian routes (r = −0.15, p = 0.019). Gender exhibited a statistically significant correlation with signage satisfaction (r = −0.15, p = 0.014), indicating that reported satisfaction differed slightly between male and female participants within this dataset. These associations reflect low correlation magnitudes and are interpreted as descriptive patterns rather than explanatory mechanisms.
Length of stay demonstrated negative correlations with satisfaction regarding inter-building pathways (r = −0.12, p = 0.028), pedestrian routes (r = −0.17, p = 0.002), and building layout (r = −0.11, p = 0.038). These low-level associations indicate variability in reported perceptions across users with differing campus tenure, without suggesting any directional or underlying causal relationship.
The accessibility indicators themselves showed moderate-to-strong positive intercorrelations (r = 0.31–0.62, all p < 0.001), suggesting that signage clarity, pathway continuity, pedestrian route organization, and building layout frequently co-occurred as related perceptual components in user evaluations within this campus context. Within sustainability-oriented discussions, such co-occurring accessibility indicators are often examined to interpret perceived environmental comfort and mobility conditions; however, the relationships observed here are descriptive and limited to the specific conditions of the Balkan Campus.
3.4. Open-Ended Responses and Findings
This section presents the frequency distributions of participants’ open-ended responses regarding their campus experiences and their observations related to sustainability practices. The responses summarize features that participants mentioned positively, frequently reported challenges, expectations for improvement, and comments related to recycling and sustainability initiatives.
Participants most commonly referenced ease of transportation (24.12%), followed by events and student clubs (22.11%), and dormitory and accommodation facilities (19.35%). Green spaces and landscaping (17.59%) and academic buildings (17.09%) were also frequently mentioned. These patterns indicate that multiple campus elements were noted in participants’ descriptions of positive experiences within this dataset (see Supplementary Table S3). Mentions of green areas appeared among these elements and are thematically consistent with discussions in sustainability-oriented literature, where natural environments are often examined in relation to perceived environmental quality.
Responses regarding challenges showed that nearly half of the participants (46.48%) identified a lack of social spaces as a key concern. Transportation-related issues (37.44%), cleanliness and hygiene (33.42%), study areas (31.66%), and technological infrastructure (30.40%) were also frequently mentioned (see Supplementary Table S4). These reported concerns span both spatial and service-related aspects within the campus context. The prominence of social and service-related themes corresponds with topics commonly discussed in campus sustainability studies, where user experiences related to interaction, maintenance, and service provision are examined alongside physical design. The patterns reported here are descriptive of the present dataset and do not imply explanatory or causal relationships.
The most frequently mentioned improvement priority was the expansion of social spaces (56.78%), followed by green areas (50.75%). Study areas (46.48%), technological infrastructure (43.97%), and transportation (43.22%) were also identified as areas where participants desired improvements. Mentions of expanding green areas appeared frequently in the dataset (see Supplementary Table S5). Among suggested improvements, increasing green spaces (59.8%) was the most commonly cited item, followed by enhancements to dining services (51.26%) and additional social events (50.75%). Improvements in cleanliness and hygiene (47.74%) and technological infrastructure (46.48%) were also noted (see Supplementary Table S6). These responses outline campus features that participants highlighted in relation to their daily experience.
Most participants (59.05%) reported noticing recycling bins for paper, plastic, and glass. Awareness was lower for battery waste bins (19.60%), electronic waste bins (7.79%), oil collection (5.28%), and organic waste composting (3.52%). Additionally, 4.77% of participants reported not observing any recycling practices. These responses indicate differing levels of familiarity with sustainability-related infrastructure on the campus (see Supplementary Table S7).
Among sustainability-focused features, bicycle and pedestrian arrangements (37.44%) and sustainability education for students and staff (36.43%) were mentioned most frequently. Green area expansion (22.61%) was also cited, whereas electric charging stations (3.77%) and energy-efficient building systems (3.27%) appeared less often (see Supplementary Table S8). Within this dataset, visibly accessible sustainability measures were referenced more frequently than technologically embedded systems.
Overall, the open-ended responses describe campus users’ perceptions across physical, social, environmental, and service-related aspects of the campus. Reports of limited social spaces, transportation challenges, and hygiene concerns appeared recurrently, while positive references to green areas and social activities were also present. These patterns correspond to themes commonly discussed in sustainability-focused studies; however, the responses presented here remain descriptive of this dataset and do not imply causal or prescriptive planning outcomes. Rather, they provide contextual insight into the features that participants identified as meaningful within the Balkan Campus.
3.5. Integrated Evaluation of Spatial and User Data
The integration values calculated for the faculties and key functional buildings of the Balkan Campus are presented in Table 5. The results indicate a heterogeneous spatial structure, particularly in relation to configurational centrality and accessibility. The highest integration values were observed around the Delta Life Center (1.5158) and the Faculty of Theology (1.4153), where the syntactic measures represent relatively central positions within the campus network. In contrast, the Faculty of Engineering (0.5497) and the Faculty of Pharmacy (0.6771) displayed lower integration values, corresponding to more peripheral locations within the configurational model. These values outline a spatial distribution in which some campus areas occupy more centrally positioned segments while others remain relatively more isolated. Within the context of this study, these differences provide a descriptive basis for interpreting variations in reported movement experiences and accessibility perceptions across different parts of the Balkan Campus, without implying broader applicability or causal relationships.
Table 5.
(a) Integration Values of Buildings in the Balkan Campus and (b) Significant Correlations Between User Experience Parameters and Integration Values.
The relationships between spatial metrics and user experience were examined through correlation analyses, and the results are summarized in Table 5b. As shown in Figure 6, the correlations reflect patterns that appear within the integrated dataset. Wayfinding difficulty, directional signage, building layout organization, and integration values exhibited the clearest statistical associations with satisfaction scores. These associations outline locations where syntactic indicators and user-reported perceptions appear within similar parts of the campus. The correlations remain descriptive and do not imply causal directionality or broader generalization beyond this specific campus context.
Specifically:
- A significant negative correlation was found between wayfinding difficulty and directional signage (r = −0.28, p < 0.001). Participants who reported greater difficulty navigating the campus also tended to evaluate signage less positively. In the context of this study, these two perceptions appeared together in several campus areas, without implying any directional or explanatory relationship.
- A significant negative correlation was observed between wayfinding difficulty and building layout (r = −0.17, p = 0.001). Participants who experienced higher levels of wayfinding difficulty also tended to report lower satisfaction with the organization of buildings. These responses co-occurred within the dataset and remain descriptive of this campus context.
- A weak but statistically significant positive correlation between wayfinding difficulty and integration values (r = 0.12, p = 0.013) indicates that navigation-related perceptions varied across areas with different configurational characteristics. This pattern is limited to the spatial structure of the Balkan Campus and does not imply any causal linkage.
- Significant negative correlations were found between perceived safety and both directional signage (r = −0.13, p = 0.009) and building layout (r = −0.14, p = 0.006). Participants who evaluated signage and spatial organization less favorably also re-ported lower perceptions of safety. These associations are specific to this dataset and do not extend beyond the conditions of the study area.
These correlations illustrate how perceptions of wayfinding, signage, safety, and spatial organization vary together within the dataset, without indicating causal relations or predictive mechanisms. No significant associations were found between lack of social spaces and the spatial parameters examined (p > 0.05). This pattern indicates that evaluations of social space availability may relate to experiential or contextual factors not represented by configurational metrics alone.
The visual distribution of correlations in Figure 8 shows that areas with higher integration values are associated with more favorable evaluations of wayfinding and safety, while peripheral areas show lower ratings for several perceptual measures. These observations correspond to the spatial distinctions identified in the syntactic analyses and reflect overlapping configurational and perceptual characteristics, without implying functional effects or generalizable conclusions.
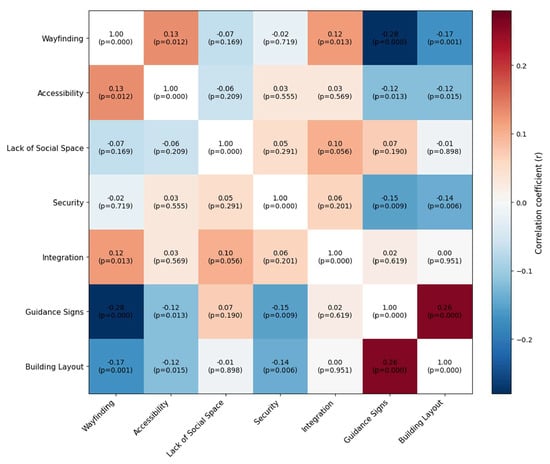
Figure 8.
Heat Map of the Correlation Between User Experience Parameters and Integration Values. Note: Red colors indicate positive correlations and blue colors indicate negative correlations; color intensity reflects correlation strength. Diagonal cells (r = 1.00) are excluded from the color scale.
Overall, the spatial analysis and user data describe patterns that appear within similar areas of the Balkan Campus. Central segments of the campus were reported more often as locations with higher accessibility, activity, and navigational clarity, while peripheral zones were more frequently associated with reports of limited connectivity, wayfinding difficulty, and lower perceived safety. These observations are descriptive and do not imply causal relationships.
In the context of this study, references to accessibility, visual clarity, building cluster organization, and the distribution of social or green areas reflect user-reported conditions that coincide with the configurational characteristics observed in the syntactic analyses. These patterns remain specific to the Balkan Campus and do not extend beyond this setting.
The associations noted here may serve to outline campus locations where spatial and perceptual conditions appear together within the dataset. They should be interpreted as contextual observations rather than functional explanations or generalizable planning implications.
3.6. Hypothesis Testing
H1: Correlation analyses identified statistically significant relationships between integration, connectivity and user-reported accessibility, environmental comfort, safety, and spatial satisfaction (p < 0.05). Higher integration and connectivity values were statistically associated with higher accessibility, comfort, safety, and satisfaction scores, while deeper/less connected areas showed lower perceived accessibility and satisfaction. These associations reflect correlational patterns within the Balkan Campus dataset and do not imply causal relationships.
Thus, H1 is supported.
H2: Regression analyses showed that wayfinding difficulty was a statistically significant predictor of overall satisfaction (p < 0.05). Areas with higher integration (Rn and R3) were statistically associated with lower reported wayfinding difficulty.
These associations are non-causal and context-specific.
Therefore, H2 is supported.
H3: Connectivity values were statistically associated with environmental comfort and perceived safety (p < 0.05). VGA analyses showed that visually enclosed or fragmented areas had significantly lower comfort and safety ratings.
These findings describe correlational relationships rather than explanatory mechanisms.
Thus, H3 is supported.
H4: Regression results indicated statistically significant associations between spatial satisfaction and wayfinding clarity, availability of social spaces, environmental comfort, and cleanliness–hygiene conditions (p < 0.05). These variables showed higher values in campus areas with higher syntactic centrality.
These associations are descriptive and non-causal in nature.
Across all four hypotheses, the observed associations align with the correlational patterns found in the Balkan Campus dataset. The findings remain non-causal, context-specific, and limited to the conditions of this particular campus environment.
4. Discussion
The findings of this study describe a spatial structure on the Balkan Campus in which central and peripheral areas differ in their configurational characteristics. The Rectorate, Library, and the main circulation spine appeared as the most centrally positioned segments within the syntactic representations. These locations also appeared more frequently in user reports describing areas with greater accessibility and clarity of movement. Similar correspondences between syntactic centrality and perceived accessibility have been noted in earlier studies, where highly integrated spatial cores were associated with improved legibility and clearer movement patterns [16,60,61]. Prior campus-based research has likewise reported that centrally configured academic and administrative areas tend to facilitate wayfinding and reduce navigational uncertainty [62,63]. This descriptive correspondence is specific to the spatial conditions of the Balkan Campus and does not imply broader theoretical alignment.
In contrast, peripheral areas—including the Engineering, Faculty of Pharmacy and the dormitory clusters—exhibited lower integration and higher mean depth values within the Space Syntax outputs. User responses from these areas more often included reports of wayfinding difficulty and lower perceived safety. Within this dataset, VGA and survey results showed that restricted sightlines or visually enclosed environments appeared in campus locations where participants reported less clarity or comfort. Similar tendencies have been documented in previous research, where spatially peripheral or poorly integrated segments were associated with reduced legibility and increased navigational difficulty [64,65]. Studies on visibility and environmental perception likewise note that visually enclosed or low-visibility areas often correspond with diminished perceived safety and reduced situational clarity [66,67]. Prior campus studies have also reported that fragmented or remotely located faculties tend to produce weaker wayfinding performance and heightened spatial uncertainty among users [62]. These observations remain descriptive and context-specific, without indicating causal relationships or implying patterns that extend beyond the present study area.
However, the strength of these associations remains limited, as the regression model accounted for only a modest proportion of variance (R2 ≈ 0.10). For this reason, the observed relationships should be interpreted as indicative patterns within the dataset rather than as explanatory findings. Despite several findings showing descriptive correspondence with previous research, a number of expected associations in this study were weak, marginal, or statistically non-significant. Comparable limitations have been noted in earlier studies reporting modest or inconsistent statistical associations between configurational metrics and perceptual outcomes, especially when analyses were conducted at broad spatial scales [60,61,62,63,64,65,66,67,68]. Prior research has emphasized that campus environments with heterogeneous development periods or fragmented pedestrian networks often produce irregular or attenuated syntactic–perceptual relationships [69]. Methodological variations—particularly differences between axial, segment-based, and VGA-derived indicators—have also been noted as influencing the strength and stability of spatial–behavioral associations in previous work [70,71]. These inconsistencies may be partly explained by the mismatch between spatial and perceptual scales: campus-level syntactic metrics describe environmental structure, whereas user perceptions reflect individual-level spatial exposure, which was not directly measured. As a result, subtle person-level variations in movement paths or building-level navigational experiences may not be captured by campus-scale indicators. Additionally, the Balkan Campus represents a context with distinctive cultural, geographic, and morphological characteristics—such as discontinuous pedestrian networks, heterogeneous building periods, and varying landscape conditions—which differ from the compact, grid-like, or highly legible environments examined in many previous Space Syntax studies. Differences in measurement approaches (e.g., axial vs. segment vs. VGA metrics), temporal conditions during data collection, and the predominantly student-based sample may also contribute to variations in the strength or direction of associations. Collectively, these factors suggest that the absence of certain expected relationships should not be interpreted as contradictory evidence but rather as indicative of the contextual and methodological boundaries within which this study was conducted.
The survey results also reflected spatial differences observed in the syntactic analyses. In the regression model, wayfinding difficulty, availability of social spaces, and cleanliness–hygiene concerns showed the strongest statistical associations with dissatisfaction. Previous studies have similarly noted that wayfinding difficulty is an important correlate of environmental satisfaction, particularly in large-scale or spatially fragmented settings [61,62,63,64]. Research on campus design has also indicated that the presence of accessible social spaces contributes to positive evaluations of environmental quality and supports users’ sense of belonging [69]. Cleanliness and maintenance-related perceptions have likewise been identified as influential components of overall satisfaction in educational environments, reflecting users’ sensitivity to operational and environmental conditions [72]. These associations describe perceptual tendencies reported by participants in specific campus areas and remain confined to the conditions of the Balkan Campus. They do not imply causal relationships or broader generalization beyond this study context [9,37]. These earlier findings provide contextual support for the descriptive tendencies observed in the Balkan Campus dataset.
Wayfinding issues were reported more frequently in zones that also exhibited lower integration values, indicating areas where configurational and perceptual characteristics appear in similar locations. This descriptive tendency parallels findings in earlier work demonstrating that low-integration or deeply structured layouts are often associated with weaker cognitive map formation and increased navigational uncertainty [63,65]. Prior studies on campus and institutional settings have similarly reported that spatial fragmentation and low legibility tend to correspond with greater wayfinding difficulty among users [62,63,64]. Research on environmental cognition also suggests that reduced visibility continuity or poorly connected circulation paths may contribute to uncertainty during route selection, particularly in large-scale environments [61]. However, these associations represent modest statistical effects and should not be interpreted as explanatory or predictive. These earlier studies provide contextual support for the descriptive alignment observed between low-integration areas and reported wayfinding challenges in this dataset.
Social and green spaces also demonstrated significant associations with user satisfaction in the regression model. Within the context of this study, respondents frequently highlighted these areas as meaningful components of their daily campus experience. These tendencies reflect participants’ perceptions of environmental comfort, opportunities for interaction, and the presence of outdoor amenities on the Balkan Campus. Similar observations have been made in prior research, where access to green and social spaces has been associated with increased satisfaction and perceived environmental quality in campus environments [69]. Studies on restorative environments have further noted that natural elements, shaded seating areas, and visually permeable outdoor settings may support psychological restoration and stress reduction [73,74]. Research on campus design also suggests that social gathering areas can foster informal interaction and enhance the overall experiential quality of academic settings [75]. The associations observed here are descriptive and remain limited to the conditions of this particular setting, without implying causal relationships or broader generalization. These patterns are also consistent with findings in environmental psychology, which demonstrate that exposure to natural elements and green spaces enhances perceived comfort, supports psychological restoration, and contributes to overall well-being in educational settings [76]. These earlier findings provide contextual support for the descriptive associations observed in this study.
Demographic analyses further revealed systematic differences in how user groups perceive spatial conditions. Older participants more frequently reported challenges related to parking and wayfinding. Participants in higher institutional positions tended to report fewer difficulties across multiple categories, which may relate to different patterns of campus use or varying levels of familiarity with the environment. Users with longer campus tenure identified more issues concerning hygiene, infrastructure, and maintenance, suggesting that prolonged exposure may coincide with greater awareness of existing spatial or operational limitations. Similar differences across user groups have been noted in previous studies, which report that spatial familiarity and length of campus experience can influence perceptions of legibility, maintenance quality, and environmental usability [61,64]. Research on environmental cognition also suggests that experienced users often develop more detailed mental representations of campus environments, making them more aware of operational or infrastructural shortcomings [63]. Studies in university settings further indicate that staff or faculty members—who typically navigate the campus with more predictable routines—tend to report fewer wayfinding difficulties compared to student groups with more variable movement patterns [62]. These observations are descriptive and limited to the present dataset. These earlier findings help contextualize the descriptive differences observed among demographic groups in this study.
Several demographic associations—particularly those with marginal p-values in the 0.05–0.10 range—should not be interpreted as statistically reliable. Such patterns do not provide a basis for theoretical claims or planning implications, especially in the absence of adjustments for multiple comparisons. Similar cautions have been emphasized in prior spatial–behavioral research, where marginal associations have been shown to fluctuate depending on sample composition, measurement timing, and contextual characteristics [60]. Studies in environmental psychology and wayfinding research likewise highlight that weak or borderline-significant effects often reflect individual differences or unmeasured confounding variables rather than stable spatial relationships [63,64]. Additionally, methodological literature notes that interpreting marginal p-values without corrections for multiple testing can inflate false-positive tendencies, particularly in exploratory, multi-variable analyses [71]. These considerations reinforce the need to interpret such demographic associations cautiously within the scope of the present dataset.
Syntactic metrics and user perceptions displayed parallel tendencies within the study context. Areas characterized by lower integration or connectivity were more frequently associated with user-reported wayfinding difficulty and lower perceived safety. Comparable descriptive alignments have been noted in earlier studies, where low-integration or weakly connected spatial segments were frequently linked with reduced legibility and challenges in cognitive mapping [16,60]. Research on visibility and perceived safety has similarly suggested that areas with lower visual integration or limited sightlines may coincide with feelings of reduced safety or spatial uncertainty in complex environments [66,67]. Prior campus-based investigations have also reported that peripheral or poorly integrated facilities are often associated with increased navigational difficulty and lower spatial satisfaction among users [62]. These correspondences reflect co-occurring configurational and perceptual patterns within the Balkan Campus and should be interpreted descriptively rather than as evidence of explanatory or causal relationships. These correspondences should be understood within the constraints of a scale mismatch, as campus-scale configurational metrics cannot be aligned with individual-level spatial exposure.
Integrating spatial metrics with user responses provides a complementary perspective for interpreting campus-wide conditions within the scope of this study. This combined approach offers a descriptive basis for understanding how configurational patterns and user-reported experiences appear together across the Balkan Campus. The interpretation of these results is limited to this specific setting, and no claims are made regarding their applicability beyond the present context.
In sustainability-oriented planning literature, themes such as transversal connectivity, circulation clarity, and the distribution of social and green spaces are often discussed. The descriptive patterns observed in this study may provide limited, context-bound reference to these themes without implying broader applicability. Similar observations have been noted in sustainability-oriented campus studies, where walkability, social interaction, and outdoor comfort were found to depend not only on configurational structure but also on micro-scale environmental features and operational conditions [69]. Prior research has also emphasized that hygiene- and comfort-related evaluations in campus settings are influenced by maintenance quality, daily use intensity, and localized environmental cues rather than global spatial metrics alone. These interpretations remain descriptive and do not imply explanatory or prescriptive relationships. While several descriptive patterns in this study align with previous Space Syntax research, some associations—particularly those involving social-space availability or hygiene-related perceptions—did not exhibit strong statistical relationships with spatial metrics. These non-significant or weak effects may reflect a scale mismatch between campus-wide configurational measures and the more localized, activity-dependent nature of social and hygienic experiences. Factors such as micro-scale spatial design (e.g., seating density, shading, furniture layout), temporal use patterns, and socio-cultural expectations of communal space may shape users’ evaluations independently of axial or VGA-based metrics. Furthermore, perceptual domains such as safety, comfort, or social interaction often emerge from psychosocial or operational conditions rather than solely from spatial configuration. These considerations indicate that the absence of robust associations in certain domains may reflect contextual or measurement-related factors rather than contradictions with previous studies.
Additionally, the exclusion of seasonal vegetation from the VGA model may introduce small, localized visibility differences during leaf-on periods, although these effects were found to be modest and non-systematic. Previous studies have noted that vegetation and seasonal foliage can affect local visibility fields in VGA models, particularly in outdoor campuses or park-like settings, although these effects are typically small and context-dependent [67,68,69,70,71]. The reduction from the initial N = 398 to the final analytic N = 392 was modest and is unlikely to have influenced coefficient stability in the regression models. Research in configurational analysis has also shown that minor sample reductions in this magnitude generally do not affect model robustness or coefficient stability in exploratory spatial–behavioral studies [60]. These observations are consistent with the modest and non-systematic effects noted in this study.
Given that this study is based on a single campus with a specific development history, morphological layout, vegetation characteristics, and climatic conditions, the findings should not be generalized to other campuses or urban environments without caution. The configurational patterns identified here serve primarily as a contextual and exploratory reference rather than a universally applicable model. Previous comparative studies have similarly emphasized that configurational properties and spatial–perceptual relationships can vary substantially across campuses with different morphological, cultural, and climatic conditions [77,78]. Research on campus morphology further suggests that spatial typologies such as grid-like, linear, or clustered layouts may produce distinct accessibility and visibility patterns, underscoring the need for context-sensitive interpretation. The applicability of Space Syntax metrics may vary across campuses with different spatial morphologies (e.g., grid-like, courtyard-based, fragmented, or highly topographic layouts), vegetation density, seasonal visibility conditions, and user population profiles. Broader generalization would require comparative, multi-campus studies conducted across diverse geographic, climatic, and institutional settings, as well as longitudinal assessments capable of capturing temporal variation. Accordingly, the interpretive scope of this study remains context-specific, and the insights offered here should be viewed as exploratory contributions rather than generalizable conclusions.
This study has several methodological limitations:
First, respondents’ specific locations or movement paths were not matched with corresponding spatial metrics; consequently, the spatial–perceptual correspondences identified here reflect campus-level tendencies rather than individual-level associations. Second, the study did not geolocate participants or link their responses to particular buildings, pathways, segments, or VGA cells. As a result, the associations presented here describe broad configurational patterns rather than detailed spatial exposures. Similar methodological cautions have been raised in previous spatial–behavioral studies, where the absence of individual-level movement tracking or geocoded perceptual data has been shown to limit the interpretability of spatial–perceptual relationships [60,71]. Research comparing configurational metrics with user experience also emphasizes that mismatches between analytical scale and perceptual scale can weaken or obscure potential associations, particularly in large outdoor environments [16,63]. These limitations indicate that the findings should be interpreted as context-specific tendencies rather than precise spatial alignments.
In addition to these limitations, it is important to note that the spatial metrics used in this study represent environmental-level configurational properties rather than individual-level spatial exposure. Because participants were not geocoded to specific buildings, departments, movement routes, or VGA cells, no person-level matching between syntactic measures and individual perceptions was conducted. As a result, the associations reported in this study should be interpreted strictly at a campus-wide configurational scale, and not as mechanisms linking spatial metrics to individual experiences. This limitation further restricts the capacity of the study to infer how specific spatial exposures may have shaped individual perceptions, and the findings are therefore limited to describing broader contextual patterns within the Balkan Campus.
Second, the Space Syntax approach does not directly incorporate material characteristics, microclimatic conditions, or psychosocial dimensions. Within this framework, syntactic measures describe configurational properties rather than environmental or sensory conditions. Studies adopting alternative or complementary approaches—such as dynamic movement observations, thermal comfort assessments, digital wayfinding tools, or multi-sensory environmental evaluations—illustrate additional ways of examining campus environments in the broader literature. Earlier research has similarly noted that environmental comfort, thermal variability, and multi-sensory cues can influence user experience independently of spatial configuration [79]. Studies incorporating behavioral mapping and post-occupancy evaluation have also shown that psychosocial and microclimatic factors often shape spatial perception in ways that fall outside the explanatory range of configurational metrics alone [80]. Topics including vertical circulation in multi-story buildings [57] or the organization of digital signage systems have also been discussed in previous research as areas that can influence spatial perception. These examples are noted here only to contextualize the scope of the present study rather than to outline prescriptive directions.
A third limitation concerns potential confounding factors that were not directly measured or controlled for in the survey. Individual differences—such as daily time spent on campus, frequency and pattern of movement, transportation modes, familiarity with the layout, academic schedules, and personal navigation strategies—may shape spatial perceptions and evaluations. Because the regression models were limited to the variables included in the questionnaire, unmeasured factors may also contribute to the observed associations. Similar cautions have been noted in previous environmental cognition research, where unmeasured behavioral routines and individual navigation styles were shown to influence spatial judgments in ways that are difficult to capture through survey-based models alone [63,64]. Studies of campus mobility also indicate that user familiarity, travel purpose, and mode of movement can shape perceptual evaluations independently of configurational structure. For this reason, the findings should be interpreted as reflecting broad perceptual tendencies rather than effects that have been adjusted for all possible confounding influences.
5. Conclusions & Recommendations
This study offered a descriptive examination of how spatial configuration and user-reported experiences appeared together within the Balkan Campus. The syntactic analyses revealed a pronounced center–periphery pattern shaped by the campus’s historical and linear development, with centrally positioned areas—such as the Rectorate, Library, and the main circulation spine—exhibiting higher integration and visibility. These locations were also more frequently associated with clearer movement, better accessibility, and more favorable overall evaluations. By contrast, peripheral and deeply structured zones, including the Engineering and Faculty of Pharmacy and the dormitory clusters, displayed lower integration and more restricted visibility, aligning with user reports of wayfinding difficulty, limited clarity, and reduced perceived safety. These findings reflect campus-level tendencies in which configurational structure and perceptual evaluations coincide, without implying explanatory or causal relationships.
The regression results indicated that wayfinding difficulty, the availability of social spaces, and cleanliness–hygiene conditions were the most influential correlates of overall satisfaction. Social and green spaces were frequently linked with more positive evaluations, while demographic differences—particularly among older participants and long-term campus users—highlighted differing experiences related to navigation, maintenance, and infrastructural conditions. These tendencies represent observable statistical patterns within the dataset and illustrate how different user groups perceive the campus environment, though they should not be interpreted as generalizable or predictive effects.
A central contribution of this study lies in demonstrating how configurational metrics and user-centered evaluations can be interpreted together within a single-campus context. The combined use of Space Syntax outputs and survey data provided a context-specific lens for understanding how spatial structure and user experience aligned across the Balkan Campus. The insights produced here remain grounded in the campus’s particular morphological and operational characteristics and are not intended as generalizable or transferable patterns.
The results may offer limited, context-specific insight into circulation clarity, the role of social and green spaces, age-inclusive accessibility, and maintenance-related perceptions within this case. These tendencies suggest areas where future planning discussions could consider enhancing legibility, strengthening outdoor social amenities, and addressing maintenance-related concerns, although the findings do not provide prescriptive or intervention-oriented guidance.
Future research may benefit from incorporating complementary approaches—such as movement-tracking observations, environmental-comfort assessments, or digital wayfinding tools—to document spatial and perceptual conditions in greater detail. Studies focusing on vertical circulation or navigation patterns in multi-story academic buildings may also deepen understanding of spatial–perceptual relationships across different campus morphologies, offering context-specific insights that remain grounded within the particular settings in which such studies are conducted.
In summary, this study provides a descriptive account of how spatial configuration and user perceptions appeared together within the Balkan Campus. The insights derived from combining configurational metrics with user-reported experiences are specific to this case and reflect the campus’s unique developmental, morphological, and operational characteristics. These findings illustrate campus-level tendencies rather than generalizable relationships. While similar studies may benefit from integrating configurational and perceptual datasets, their applicability will remain context-dependent and shaped by the spatial and cultural conditions of each individual environment.
Supplementary Materials
The following supporting information can be downloaded at: https://www.mdpi.com/article/10.3390/su172411221/s1, The study contains eight supplementary tables, Table S1: Correlation Between Demographic Variables and Campus-Related Challenges (r = 0.08; p = 0.107). Table S2: Correlation Between Demographic Variables and Accessibility Satisfaction Factors (r and p values). Table S3: Most Appreciated Features of the campus. Table S4: Major Challenges Encountered on campus. Table S5: Areas and Services Identified as Needing Improvement on campus. Table S6: Suggestions for Improving Satisfaction on campus. Table S7: Suggestions for Improving Satisfaction on campus. Table S8: Sustainability Practices Implemented on campus. Figure S1: Correlations between perceived campus-related difficulties and demographic variables.
Author Contributions
Conceptualization, A.Z. and O.S.; Methodology, A.Z. and O.S.; Software, A.Z. and O.S.; Validation, A.Z. and O.S.; Formal analysis, A.Z. and O.S.; Investigation, A.Z. and O.S.; Resources, A.Z. and O.S.; Data curation, A.Z. and O.S.; Writing—original draft preparation, A.Z. and O.S.; Writing—review and editing, A.Z. and O.S.; Visualization, A.Z. and O.S.; Supervision, A.Z. and O.S.; Project administration, A.Z. and O.S. All authors have read and agreed to the published version of the manuscript.
Funding
This research received no external funding, and the APC was funded by the authors.
Institutional Review Board Statement
The study was conducted in accordance with the Declaration of Helsinki and approved by the Ethics Committee of Trakya University (protocol code: E-29563864-050.04-811336], date of approval [10 March 2025]).
Informed Consent Statement
Informed consent was obtained from all subjects involved in the study.
Data Availability Statement
The data presented in this study are available on request from the corresponding author. The data are not publicly available due to privacy and ethical restrictions.
Conflicts of Interest
The authors declare no conflicts of interest. The funders had no role in the design of the study; in the collection, analyses, or interpretation of data; in the writing of the manuscript; or in the decision to publish the results.
References
- Özkan, D.G.; Özlü, S.; Dedeoğlu Özkan, S. Measuring place satisfaction by university campus open space attributes. A Z ITU J. Fac. Archit. 2022, 19, 137–149. [Google Scholar] [CrossRef]
- Peker, E.; Ataöv, A. Exploring the ways in which campus open space design influences students’ learning experiences. Landsc. Res. 2020, 45, 310–326. [Google Scholar] [CrossRef]
- Nehme, J.B.; Rodríguez, E.; Yoon, S. Spatial user experience: A multidisciplinary approach to assessing physical settings. J. Inter. Des. 2020, 45, 7–25. [Google Scholar] [CrossRef]
- Sailer, K.; Koutsolampros, P. Space syntax: Understanding human movement, co-presence and encounters in relation to the spatial structure of workplaces. In A Handbook of Theories on Designing Alignment Between People and the Office Environment; Appel-Meulenbroek, R., Danivska, V., Eds.; Routledge: New York, NY, USA, 2021; pp. 248–260. [Google Scholar]
- Calvo-Sotelo, P.C. From typological analysis to planning: Modern strategies for university spatial quality. CIAN Rev. Hist. Univ. 2014, 17, 31–58. [Google Scholar]
- Shi, Y.; Zhou, X. Evaluating the effectiveness of different directional signage systems in indoor wayfinding: A human-centered experiment conducted in virtual reality. In Intelligent Human Systems Integration (IHSI 2025): Integrating People and Intelligent Systems, Proceedings of AHFE (2025) International Conference; Honolulu, HI, USA, 8–10 December 2025, AHFE: New York, NY, USA.
- Sutkaitytė, M. Human behaviour simulation using space syntax methods. Archit. Urban Plan. 2020, 16, 84–92. [Google Scholar] [CrossRef]
- Askarizad, R.; Lamíquiz Daudén, P.J.; Garau, C. The application of space syntax to enhance sociability in public urban spaces: A systematic review. ISPRS Int. J. GeoInf. 2024, 13, 227. [Google Scholar] [CrossRef]
- Micheli, S. Green spaces and student well-being: Evidence from European university campuses. Build. Environ. 2024, 238, 110842. [Google Scholar]
- Agrawal, P.; Yadav, M. Campus design of universities: An overview. J. Des. Built Environ. 2021, 21, 37–51. [Google Scholar] [CrossRef]
- Lee, J.H.; Ostwald, M.J.; Zhou, L. Socio-Spatial Experience in Space Syntax Research: A PRISMA-Compliant Review. Buildings 2023, 13, 644. [Google Scholar] [CrossRef]
- Guo, W.; Wen, H.; Liu, X. Research on the psychologically restorative effects of campus common spaces from the perspective of health. Front. Public Health 2023, 11, 1131180. [Google Scholar] [CrossRef]
- Dawodu, A.; Dai, H.; Zou, T.; Zhou, H.; Lian, W.; Oladejo, J.; Osebor, F. Campus sustainability research: Indicators and dimensions to consider for the design and assessment of a sustainable campus. Heliyon 2022, 8, e11864. [Google Scholar] [CrossRef] [PubMed]
- Günaydın, A.S.; Yücekaya, M. An investigation of sustainable transportation model in campus areas with Space Syntax method. ICONARP Int. J. Archit. Plan. 2020, 8, 262–281. [Google Scholar] [CrossRef]
- Buttimer, A.; Seamon, D. The Human Experience of Space and Place; Routledge: New York, NY, USA, 2015. [Google Scholar]
- Hillier, B.; Hanson, J. The Social Logic of Space; Cambridge University Press: Cambridge, UK, 1984. [Google Scholar]
- Nes, A.; Yamu, C. Space syntax: A method to measure urban space related to social, economic and cognitive factors. In The Virtual and the Real in Planning and Urban Design; Routledge: Oxfordshire, UK, 2017; pp. 136–150. [Google Scholar]
- March, L.; Steadman, P. The Geometry of Environment: An Introduction to Spatial Organization in Design; Routledge: London, UK, 2020. [Google Scholar]
- Green, M.; Penn, A. Socio-spatial analysis of four university campuses: The implications of spatial configuration on creation and transmission of knowledge. In Proceedings of the 1st International Space Syntax Symposium, London, UK, 16–18 April 1997. [Google Scholar]
- Kubovy, M.; Pomerantz, J.R. (Eds.) Perceptual Organization; Lawrence Erlbaum Associates: Mahwah, NJ, USA, 2017. [Google Scholar]
- Montello, D.R. Scale and Multiple Psychologies of Space. In Spatial Information Theory: A Theoretical Basis for GIS; Springer: Berlin/Heidelberg, Germany, 1993; pp. 312–321. [Google Scholar]
- Golledge, R.G. (Ed.) Wayfinding Behavior: Cognitive Mapping and Other Spatial Processes; Johns Hopkins University Press: Baltimore, MD, USA, 1999. [Google Scholar]
- Gür, Ş.Ö. Architecture as spatial organization. Livenarch+ J. 2024, 1, 5–13. [Google Scholar]
- Zavoleas, Y.; Taylor, M. Patterns and spatial organisation: Culture, history and future perspectives. Nexus Netw. J. 2021, 23, 1–4. [Google Scholar] [CrossRef]
- Ishikawa, T.; Montello, D.R. Spatial knowledge acquisition from direct experience in the environment: Individual differences in the development of metric knowledge. Cogn. Psychol. 2006, 52, 93–129. [Google Scholar] [CrossRef] [PubMed]
- Popov, A.V. Architectural examination of student accommodation in Russia and the CIS. Amazon. Investig. 2019, 8, 179–190. [Google Scholar]
- Dalton, R.C.; Hölscher, C.; Turner, A. Understanding space: The nascent synthesis of cognition and the syntax of spatial morphologies. Environ. Plan. B Plan. Des. 2012, 39, 7–11. [Google Scholar] [CrossRef]
- Gath-Morad, M.; Grübel, J.; Steemers, K.; Sailer, K.; Ben-Alon, L.; Hölscher, C.; Aguilar, L. The role of strategic visibility in shaping wayfinding behavior in multilevel buildings. Sci. Rep. 2024, 14, 3735. [Google Scholar] [CrossRef]
- Hu, C.; Qi, Y.; Wang, C. An Analysis of the Spatial Characteristics of Jin Ancestral Temple Based on Space Syntax. Buildings 2025, 15, 85. [Google Scholar] [CrossRef]
- Luo, Y.; Lin, Z. Spatial Accessibility Analysis and Optimization Simulation of Urban Riverfront Space Based on Space Syntax and POIs: A Case Study of Songxi County, China. Sustainability 2023, 15, 14929. [Google Scholar] [CrossRef]
- Meng, Y.; Li, Q.; Ji, X.; Yu, Y.; Yue, D.; Gan, M.; Wang, S.; Niu, J.; Fukuda, H. Research on Campus Space Features and Visual Quality Based on Street View Images: A Case Study on the Chongshan Campus of Liaoning University. Buildings 2023, 13, 1332. [Google Scholar] [CrossRef]
- Lee, J.H.; Ostwald, M.J. Latent Dirichlet allocation (LDA) topic models for space syntax studies on spatial experience. City Territ. Archit. 2024, 11, 3. [Google Scholar] [CrossRef]
- Karimi, K. The configurational structures of social spaces: Space Syntax and urban morphology in the context of analytical, evidence-based design. Land 2023, 12, 2084. [Google Scholar] [CrossRef]
- Khasraghi, G.S. Developing a multi-agent based simulation model of users’ wayfinding as a representation and post-occupancy evaluation (POE) tool in a hospital. Prometh. Build. Cities Perform. 2020, 4, 102–105. [Google Scholar]
- Gil, J.; Varoudis, T.; Karimi, K.; Penn, A. The Space Syntax Toolkit: Integrating depthmapX and exploratory spatial analysis workflows in QGIS. In Proceedings of the 10th International Space Syntax Symposium (SSS10), London, UK, 13–17 July 2015; Available online: https://discovery.ucl.ac.uk/1490063/ (accessed on 1 October 2025).
- Varoudis, T. depthmapX: Multi-Platform Spatial Network Analysis Software. 2012. Available online: https://spacegroupucl.github.io/depthmapX/ (accessed on 1 October 2025).
- Haq, S.; Luo, Y. Space syntax in healthcare facilities research: A review. HERD Health Environ. Res. Des. J. 2012, 5, 98–117. [Google Scholar] [CrossRef]
- Bate, P.; Robert, G. Bringing User Experience to Healthcare Improvement: The Concepts, Methods and Practices of Experience—Based Design; CRC Press: London, UK, 2023. [Google Scholar]
- Jamshidi, S.; Ensafi, M.; Pati, D. Wayfinding in interior environments: An integrative review. Front. Psychol. 2020, 11, 549628. [Google Scholar] [CrossRef] [PubMed]
- Hillier, B. Space is the Machine: A Configurational Theory of Architecture; Cambridge University Press: Cambridge, UK, 1996. [Google Scholar]
- Alitajer, S.; Nojoumi, G.M. Privacy at home: Analysis of behavioral patterns in the spatial configuration of traditional and modern houses in the city of Hamedan based on the notion of space syntax. Front. Archit. Res. 2016, 5, 341–352. [Google Scholar] [CrossRef]
- Vilar, E.; Rebelo, F.; Noriega, P.; Filgueiras, E. A human-centered architecture: Considering usability and user experience in architectural design. In Handbook of Usability and User-Experience; CRC Press: Boca Raton, FL, USA, 2022; pp. 197–216. [Google Scholar]
- Zhou, X.; Zheng, G.; Cao, Y. A study of negative space accessibility of university campus based on spatial syntax theory: Take Hubei University of Technology as an example. In Proceedings of the 2nd International Conference on Computer Technology and Media Convergence Design (CTMCD 2022); Atlantis Press: Dordrecht, The Netherlands, 2022; pp. 678–688. [Google Scholar]
- Arslan, H.D.; Ergener, H. Comparative analysis of shopping malls with different plans by using space syntax method. Ain Shams Eng. J. 2023, 14, 102063. [Google Scholar] [CrossRef]
- Beek, V.A.; Duives, D.C.; Feng, Y.; Hoogendoorn, S.P. Comparison of pedestrian wayfinding behavior between a real and a virtual multi-story building: A validation study. Transp. Res. Part C Emerg. Technol. 2024, 163, 104650. [Google Scholar] [CrossRef]
- Ilako, C. The influence of spatial attributes on users’ information behaviour in academic libraries: A case study. In Proceedings of the ISIC, the Information Behaviour Conference, Pretoria, South Africa, 28 September–1 October 2020; Available online: http://informationr.net/ir/25-4/isic2020/isic2029.html (accessed on 1 October 2025).
- Smith, A.W. User experience design for older adults: Experience architecture and methodology for users aged 60+. In Proceedings of the 37th ACM International Conference on the Design of Communication, Portland, OR, USA, 4–6 October 2019; pp. 1–9. [Google Scholar]
- Erap, B.B.N.; Hilmioğlu, S.; Kariptaş, F.S. Kamusal mekânlarda deneyim ve kullanıcı merkezli tasarım. Sanat Tasarım Derg. 2021, 28, 335–347. [Google Scholar] [CrossRef]
- Wang, T. An investigation into the architectural environment of university campuses based on space syntax analysis: A case study conducted on the campus of Hubei University of Technology. In Proceedings of the International Conference on Advanced Civil Engineering and Smart Structures; Springer Nature: Singapore, 2023; pp. 283–294. [Google Scholar]
- Harte, R.; Glynn, L.; Rodríguez-Molinero, A.; Baker, P.M.; Scharf, T.; Quinlan, L.R.; ÓLaighin, G. A human-centered design methodology to enhance the usability, human factors, and user experience of connected health systems: A three-phase methodology. JMIR Hum. Factors 2017, 4, e8. [Google Scholar] [CrossRef]
- Bozdağ, A.; Gümüş, M.G.; Gümüş, K.; Durduran, S.S. Evaluating spatial legibility of the university campus using GIS. Aksaray Univ. J. Sci. Eng. 2020, 4, 127–147. [Google Scholar] [CrossRef]
- Wang, S.; Xie, H.; Yun, B.; Pu, X.; Qiu, Z. Optimization Strategy for the Spatiotemporal Layout of E-Bike Charging Piles from the Perspective of Sustainable Campus Planning: A Case Study of Zijingang Campus of Zhejiang University. Sustainability 2024, 16, 5690. [Google Scholar] [CrossRef]
- Darwish, I.I. Enhancing outdoor campus design by utilizing space syntax theory for social interaction locations. Ain Shams Eng. J. 2022, 13, 101524. [Google Scholar] [CrossRef]
- Khorsheed, J.; Sulaiman, W. Analytical study of university campuses’ walkability using space syntax analysis: University of Duhok (UoD) as a case study. J. Eng. Res. 2021, 9. [Google Scholar] [CrossRef]
- Mohamed, A.A. Using BERTopic modelling to map the evolution of space syntax re-search. In Land Use Policy; Elsevier: Amsterdam, The Netherlands, 2025; Volume 157. [Google Scholar] [CrossRef]
- Aydın, M.F. Provincial interpretations and regional diversification dynamics in the classical period of Ottoman architecture: The case of Vezirhan Köprülü Mehmet Pasha Mosque. Front. Archit. Res. 2025; in press. [Google Scholar] [CrossRef]
- Ulrich, R.S. View through a window may influence recovery from surgery. Science 1984, 224, 420–421. [Google Scholar] [CrossRef] [PubMed]
- Trakya Üniversitesi Rektörlüğü. Tarihçe. Trakya Üniversitesi. Available online: https://www.trakya.edu.tr/tarihce (accessed on 22 September 2025).
- Trakya Kalkınma Ajansı. TR21 Trakya Bölge Planı 2014–2023. Trakya Üniversitesi Yayınları. 2013. Available online: https://www.kalkinmakutuphanesi.gov.tr/assets/upload/dosyalar/tr21-trakya-bolge-plan.pdf (accessed on 1 October 2025).
- Penn, A. Space syntax and spatial cognition: Or why the axial line? Environ. Behav. 2003, 35, 30–65. [Google Scholar] [CrossRef]
- Arthur, P.; Passini, R. Wayfinding: People, Signs, and Architecture; McGraw-Hill: New York, NY, USA, 2002. [Google Scholar]
- Baskaya, A.; Wilson, C.; Özcan, Y.Z. Wayfinding in an unfamiliar environment: Different spatial settings of two polyclinics. Environ. Behav. 2004, 36, 839–867. [Google Scholar] [CrossRef]
- Hölscher, C.; Brösamle, M.; Meilinger, T.; Knauff, M. Up the down staircase: Wayfinding strategies in multi-level buildings. J. Environ. Psychol. 2006, 26, 284–299. [Google Scholar] [CrossRef]
- Weisman, J. Evaluating architectural legibility: Wayfinding in the built environment. Environ. Behav. 1981, 13, 189–204. [Google Scholar] [CrossRef]
- Conroy Dalton, R. The secret is to follow your nose: Route path selection and angularity. Environ. Behav. 2003, 35, 107–131. [Google Scholar] [CrossRef]
- Peponis, J.; Zimring, C.; Choi, Y.K. Finding the building in wayfinding. Environ. Behav. 1990, 22, 555–590. [Google Scholar] [CrossRef]
- Van Nes, A.; López, M.J.J. Micro scale spatial relationships in urban studies: The relationship between private and public space and its impact on street life. In Proceedings of the 6th International Space Syntax Symposium, İstanbul, Turkey, 12–15 June 2007; pp. 023.01–023.12. [Google Scholar]
- Hillier, B.; Yang, T.; Turner, A. Normalising least angle choice in Depthmap and how it opens up new perspectives on the global and local analysis of city space. J. Space Syntax 2012, 3, 155–193. [Google Scholar]
- Sharmin, S.; Kamruzzaman, M. Meta-analysis of the relationships between space syntax measures and pedestrian movement. Transp. Rev. 2018, 38, 524–550. [Google Scholar] [CrossRef]
- Jiang, B.; Claramunt, C. Integration of Space Syntax into GIS: New Perspectives for Urban Morphology. Trans. GIS 2002, 6, 295–309. [Google Scholar] [CrossRef]
- Turner, A. From axial to road-centre lines: A new representation for space syntax and a new model of route choice. Environ. Plan. B Plan. Des. 2007, 34, 539–555. [Google Scholar] [CrossRef]
- Kaya, N.; Erkip, F. Satisfaction in a Dormitory Building. Environ. Behav. 2001, 33, 35–53. [Google Scholar] [CrossRef]
- Kaplan, S. The restorative benefits of nature: Toward an integrative framework. J. Environ. Psychol. 1995, 15, 169–182. [Google Scholar] [CrossRef]
- Ulrich, R.S.; Simons, R.F.; Losito, B.D.; Fiorito, E.; Miles, M.A.; Zelson, M. Stress recovery during exposure to natural and urban environments. J. Environ. Psychol. 1991, 11, 201–230. [Google Scholar] [CrossRef]
- Gehl, J. Cities for People; Island Press: Washington, DC, USA, 2010. [Google Scholar]
- Hartig, T.; Mitchell, M.; de Vries, S.; Frumkin, H. Nature and health. Annu. Rev. Public Health 2014, 35, 207–228. [Google Scholar] [CrossRef] [PubMed]
- Karimi, K. A configurational approach to analytical urban design: Space syntax methodology. Urban Des. Int. 2012, 17, 297–318. [Google Scholar] [CrossRef]
- van Nes, A.; Yamu, C. An Introduction to Space Syntax in Urban Studies; Springer: Cham, Switzerland, 2021. [Google Scholar]
- Nikolopoulou, M.; Steemers, K. Thermal comfort and psychological adaptation as a guide for designing urban spaces. Energy Build. 2003, 35, 95–101. [Google Scholar] [CrossRef]
- Vischer, J.C. Towards an Environmental Psychology of Workspace: How People are Affected by Environments for Work. Archit. Sci. Rev. 2008, 51, 97–108. [Google Scholar] [CrossRef]
Disclaimer/Publisher’s Note: The statements, opinions and data contained in all publications are solely those of the individual author(s) and contributor(s) and not of MDPI and/or the editor(s). MDPI and/or the editor(s) disclaim responsibility for any injury to people or property resulting from any ideas, methods, instructions or products referred to in the content. |
© 2025 by the authors. Licensee MDPI, Basel, Switzerland. This article is an open access article distributed under the terms and conditions of the Creative Commons Attribution (CC BY) license (https://creativecommons.org/licenses/by/4.0/).