Abstract
Air pollutants and greenhouse gases share common sources, primarily originating from human activities such as energy utilization, thus presenting significant potential for synergistic control. Isolated consideration of solutions for either pollution mitigation or carbon reduction increases the unit cost of environmental governance and leads to inconsistencies and overlapping effects in policy measures. This study takes Chengdu, a low-carbon pilot city in China, as a case study. Based on clarifying the characteristics of regional air pollutant emissions and carbon emissions from energy consumption, it empirically investigates the synergistic variation in carbon emissions from diverse socioeconomic industries and multiple air pollutant emissions. The empirical results reveal the following: (1) during the research period, Chengdu’s air quality excellence rate demonstrated continuous improvement. Meanwhile, the carbon emissions from energy consumption exhibited a three-phase developmental pattern. The driving forces of growth had shifted from traditional high-energy-consuming industries to advanced manufacturing, urban basic energy demands, and energy extraction industries serving national strategies. (2) The synergistic reduction in carbon emissions with PM10 and PM2.5 reached relatively high levels from 2016 to 2019, followed by fluctuations due to the impact of the COVID-19 pandemic. The synergistic reduction between carbon emissions and SO2 exhibited considerable volatility. The electrification trend in transportation significantly promoted the synergistic reduction in carbon emissions and NO2 emissions. Due to the fact that O3 is a secondary pollutant with complex sources, achieving synergistic governance with carbon emissions proved more challenging. As a result of technological limitations, the synergistic reduction in carbon emissions and CO gradually exhibited a trend of diminishing marginal effects. The synergistic reduction effects between industry-specific carbon emissions and overall air pollutant emissions can be divided into five categories: sustained high-efficiency, generally stable, fluctuating, sudden-decline, and persistently low.
1. Introduction
In recent years, global climate warming and atmospheric environmental pollution have become two major challenges to human sustainable development. Air pollutants and greenhouse gases share highly similar roots and sources, primarily stemming from human activities such as energy utilization, thus presenting significant potential for synergistic control [1]. The UAE Consensus reached at the 28th UN Climate Change Conference explicitly calls for “transitioning away from fossil fuels in a just, orderly, and equitable manner.” This marks the first time the international community has formally acknowledged that the era of fossil fuels is coming to an end. Subsequently, the European Union passed the Renewable Energy Directive III, the United States issued supplementary provisions to the Inflation Reduction Act, Japan introduced its Green Transformation (GX) policy, and China issued implementation plans for carbon peaking in the energy sector across multiple provinces and cities. In this context, low-carbon energy transition has become a development consensus among countries worldwide. Meanwhile, under the coal-dominated energy consumption structure, China has long faced the challenge of heavily polluted weather, making the task of air pollution prevention and control particularly arduous. In traditional environmental management systems, climate change and air pollution have often been treated as two separate domains, with respective governance strategies adopted for each. Isolated consideration of solutions for either carbon reduction or pollution mitigation in the energy sector will increase the unit cost of environmental governance and lead to inconsistencies and overlapping effects in policy measures [2]. In this regard, a scientific assessment of the synergistic effects between carbon emissions from energy consumption and air pollutants will provide a critical basis for optimizing policy pathways and achieving dual environmental and climate governance goals at the lowest cost.
In the process of regional high-quality development, practices such as “rash carbon reduction campaigns” and “one-size-fits-all” approaches should be avoided. The Implementation Plan for Synergizing Carbon Reduction and Pollution Reduction issued by the Ministry of Ecology and Environment of the People’s Republic of China explicitly calls for “enhancing the synergy between ecological and environmental policies and energy industry policies.” The Action Plan for Carbon Peaking Before 2030 issued by the State Council of the People’s Republic of China proposes that “the central and western regions should focus on optimizing their energy structure.” The Joint Action Plan for Carbon Peaking and Carbon Neutrality in the Chengdu-Chongqing Economic Circle emphasizes the need to “promote the joint establishment of a nationally important clean energy base and create a demonstration zone for high-quality development of clean energy.” Cities serve as core hubs for economic and social activities, and the exemplary development of typical cities is expected to promote the “establish before abolish” approach in comprehensive environmental governance [3]. As the birthplace of the new development philosophy, the first city to propose the concept of a park city, and a “national low-carbon pilot city, Chengdu was selected in May 2024 as one of the first batch of pilot cities for deepening climate-resilient urban development. Therefore, it should play an exemplary and leading role in environmental synergistic governance efforts [4]. In this regard, this study conduct an in-depth investigation into the key pollutants and major industries involved in the synergy between carbon reduction and pollution mitigation in Chengdu. It is expected to provide a scientific and empirical basis for environmental governance efforts.
The main contributions of this study are as follows: (1) Based on the localized carbon emission factors derived from the Database of National Greenhouse Gas Emission Factor (https://data.ncsc.org.cn/factoryes/index, and the access date is 6 November 2025), this study calculates the carbon emission characteristics of energy consumption across 37 typical industries in Chengdu. Additionally, by incorporating field research and statistical source data, the emission characteristics of six key air pollutants (PM10, PM2.5, SO2, NO2, O3 and CO) in Chengdu are clarified. On this basis, this study avoids the limitations of a simplified “one-size-fits-all” approach in comprehensive assessments by introducing the perspective of sectoral heterogeneity in carbon emissions and variety heterogeneity in pollutants. This contributes to enhancing the accuracy of empirical research. (2) This study comprehensively evaluates the synergistic reduction effects between overall carbon emissions from energy consumption and multiple air pollutant emissions, as well as between carbon emissions across different industries and overall air pollutant emissions. This approach provides a more differentiated, refined, and comprehensive research perspective for analyzing the co-benefits of regional climate governance and pollution mitigation. (3) Moving beyond a description of aggregate data trends, this study attributes the observed changes to the concrete development dynamics of specific industries, thereby accurately mapping the real-world picture behind data fluctuations and enhancing the practical guidance value of academic research.
2. Literature Review
Currently, the primary approach to assessing and quantifying the synergistic effects of carbon reduction and pollution mitigation is based on measuring changes in emission levels. If indicators such as the emission volume, emission concentration, and reduction percentage of air pollutants and greenhouse gases are lower than those in the baseline scenario, it indicates positive synergistic progress in emission reduction efforts. Additionally, the cross-elasticity coefficient or the product of changes in the two can also be used to measure the level of synergy [5,6]. A positive value indicates a positive synergistic relationship between air pollutants and greenhouse gas, while a negative value signifies an inverse relationship [7]. Meanwhile, in recent years, scholars have begun to focus on an assessment perspective based on the synergy degree. Currently, China’s estimates of greenhouse gas and air pollutant emissions primarily reference international satellite accounts such as EXIOBASE [8], China’s Carbon Emission Accounts & Datasets (CEADs) [9], Tsinghua University’s MEIC database [10], and regional remote sensing data [11]. Alternatively, empirical measurements are conducted based on documents such as the IPCC Guidelines for National Greenhouse Gas Inventories and T/CSES 144-2024 Technical Guidelines for Compiling Urban Air Pollutant Emission Inventories. In 2024, the Ministry of Ecology and Environment of the People’s Republic of China issued the Technical Guidelines for Compiling Integrated Emission Inventories of Air Pollutants and Greenhouse Gases (Trial). With this issuance, a new systematic methodological foundation for the synergistic management of carbon reduction and pollution control has been laid.
Synergy mainly refers to the phenomenon in which two systems simultaneously evolve toward a better state [12]. The synergy between carbon reduction and pollution mitigation primarily refers to the coordinated advancement of greenhouse gas control and air pollution prevention efforts. This is specifically manifested as a simultaneous decreasing trend in carbon emissions and air pollutant emissions, leading to improved efficiency in comprehensive environmental governance [13]. Based on the type of synergistic effect, it can be categorized as either the carbon reduction effect resulting from pollution control measures or the pollution control effect resulting from carbon reduction measures [14]. Depending on whether the synergistic effect results in promotion or inhibition, it can be further specifically classified as positive synergy or negative synergy [15]. As climate change has gained increasing attention in the academic community, some scholars have explored the synergistic effects of carbon reduction and pollution mitigation. Selected typical studies are summarized in Table 1.

Table 1.
Typical studies in the field of carbon reduction and pollution mitigation synergy.
Existing studies have primarily focused on investigating the synergistic reduction effects between overall carbon emissions and air pollutants, including SO2, NOx, PM2.5, and O3. However, synergistic governance represent a complex multi-domain systemic issue that should be analyzed from a more systematic and comprehensive perspective. Additionally, since energy consumption is a key source of both greenhouse gases and air pollutants, it is essential to prioritize the management of their environmental impacts [26]. Therefore, it is necessary to examine the synergistic variation characteristics between differentiated carbon emissions across various socio-economic industries and multiple air pollutant emissions. Furthermore, commonly used metrics in existing research, such as the cross-elasticity coefficient, trend analysis and multi-indicator evaluation, are limited by their narrow perspective [27]. These approaches fail to simultaneously account for the level of emission reduction, the direction of synergy, and the strength of synergy. Hence, it is imperative to investigate the synergistic effects of carbon reduction and pollution mitigation from an integrated perspective using a coupling coordination degree model.
3. Model and Data
3.1. Carbon Emission Calculation Model
The calculation of carbon emissions from energy consumption is based on activity data such as energy utilization by sector and fuel type. To align with the carbon emission coefficients published in official databases, this study adopts the emission factor method for a quantitative assessment. Specifically, the basic data are multiplied by the corresponding emission factors and aggregated layer by layer to comprehensively assess the level of carbon emissions [28]. The detailed calculation model is shown in Formulas (1) and (2).
In the formulas, C represents the total carbon emissions from energy consumption, 104 t. Ai,j represents the consumption of the j-th energy type by the i-th industry, 104 t. Nj represents the net calorific value of the j-th energy type, TJ/104 t. Ej represents the carbon emission factor of the j-th energy type during combustion, 104 t/TJ. Tj represents the carbon content per unit calorific value of the j-th energy type, 104 t/TJ. Oj represents the carbon oxidation rate during combustion of the j-th energy type.
3.2. Analysis Model of Synergistic Effects
Since air pollutants and carbon emissions share homologous sources and processes, they exhibit a closely interlinked, dynamically coupling and mutual feedback relationship. The coupling coordination degree model can effectively reflect the synergistic development trends among multiple subsystems [29]. Therefore, this study adopts the coupling coordination degree model to evaluate the synergistic reduction effects. The specific evaluation models are shown in Formulas (3)–(5).
In the formulas, U1 represents the reduction level of carbon emission from regional energy consumption, 10,000 tons. U2 represents the control level of regional air pollutant emission concentration, µg/m3. Both variables undergo range standardization to eliminate dimensional effects, thereby more accurately reflecting relative changes. C represents the coupling degree. T represents the comprehensive development index. a and b are undetermined coefficients. Given that carbon reduction and pollution mitigation are considered equally important within the context of sustainable development, this study set a = b = 0.5 [30]. D represents the coupling coordination degree, which ranges from 0 to 1.
3.3. Data Sources and Preprocessing
Considering the consistency of baseline data, the study period is set from 2015 to 2023. The emission data for the six key air pollutants are sourced from field survey data and official statistical sources such as the Chengdu Environmental Quality Bulletin. Additionally, this study focuses on 37 typical energy consumption-related industries. The industry classification criteria and fundamental data are derived from the Chengdu Statistical Yearbook, ensuring consistency with official statistical standards. The carbon oxidation rate data refer to the Guidelines for Compiling Provincial Greenhouse Gas Inventories (Revised Edition) issued by the Ministry of Ecology and Environment of the People’s Republic of China in July 2025. Notably, the current carbon emission calculation guidelines are numerous and complex, with calculation models and emission factors lacking a unified standard. In this regard, existing macro-level research on China’s energy-related carbon emissions primarily references the default emission factors proposed by the IPCC, which significantly affects the accuracy of assessment results. To implement the requirements outlined in the Work Plan for Improving the Carbon Emission Statistical Accounting System, the Ministry of Ecology and Environment of the People’s Republic of China established the Database of National Greenhouse Gas Emission Factor in January 2025. This database provides localized factors derived from surveys, actual measurements, and scientific validation, and is regularly updated. Conducting investigations based on this official database helps enhance the timeliness of emission accounting and accurately reflects the multi-source emission characteristics aligned with China’s national conditions. The carbon emission coefficients of different types of energy are shown in Table 2.
Table 2.
The carbon emission coefficients of different types of energy.
Based on data availability, this study incorporates carbon emission indicator (source-based) and pollutant emission concentration indicator (receptor-based) into the coupling coordination degree model. To ensure the rationality of the evaluation approach, both carbon emission and pollutant emission concentration are processed as relative change quantities. Consequently, although these two indicators measure environmental issues from the perspectives of emission volume and emission concentration, respectively, after processing, they both measure the level of relative change. These correspond to the effectiveness of carbon reduction and pollution mitigation, respectively, thereby ensuring conceptual consistency. Meanwhile, this study employs the annual average concentration of pollutants, which helps avoid the randomness and volatility associated with short-term data.
4. Empirical Analysis
4.1. Overview of Chengdu’s Development
Chengdu, the capital of Sichuan Province, is an important central city in western China. It is located on the western edge of the Sichuan Basin, with terrain sloping from northwest to southeast. The western part lies within the basin’s marginal zone, characterized predominantly by deep hills and mountains, while the eastern part belongs to the basin’s plain area, composed mainly of plains, terraces, and some low hills. It experiences a subtropical monsoon climate, featuring ample heat, abundant rainfall, distinct seasons, and synchronous occurrence of rain and heat. Most areas of Chengdu exhibit a mild climate: summers are generally free from extreme heat, winters see little ice and snow, and temperatures remain moderate. Summers are long, winters are short, the frost-free period is lengthy, and rainfall is more frequent during autumn and at night. It also experiences light winds, high humidity, considerable cloudiness, and limited sunshine.
Chengdu is home to over 400 mineral sites, with proven coal reserves of 146 million tons. Its proven natural gas reserves amount to 1.68 billion cubic meters, making it a regionally advantageous mineral resource. Situated within the river basins of the Minjiang and Tuojiang, tributaries of the Yangtze River, Chengdu’s total annual surface water resources reach 7.23 billion cubic meters, while its groundwater resources amount to 2.99 billion cubic meters. The city’s forested area spans 580,600 hectares, with a forest coverage rate of 40.50% and a total standing timber stock of 38.67 million cubic meters. Covering a land area of 14,335 square kilometers, Chengdu maintains an annual grain crop sowing area of 5.80 million square meters.
Chengdu’s regional GDP exceeds 2.30 trillion yuan, with a per capita GDP of over 100,000 CNY. Meanwhile, its permanent resident population reached 21.47 million, and the urbanization rate of permanent residents stood at 80.80%. The industrial structure is divided as follows: 2.30% primary industry, 28.70% secondary industry, and 69% tertiary industry. Additionally, the total length of regional bus routes reached 21,255 km, while the operational length of rail transit lines extended to 673 km.
4.2. Evolution Characteristics of Air Pollution in Chengdu
The summary of Chengdu’s atmospheric environmental quality from 2015 to 2023 is presented in Figure 1.
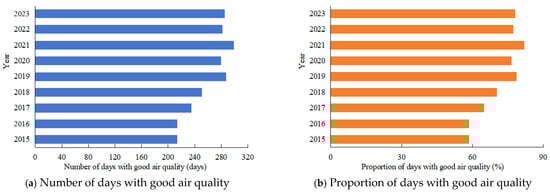
Figure 1.
Characteristics of Chengdu’s atmospheric environmental quality from 2015 to 2023.
According to the data shown in Figure 1, the overall atmospheric environmental quality in Chengdu continued to improve during the study period. The specific changes are characterized as follows: (1) The number of good-air-quality days increased significantly, from 214 days in 2015 to 285 days in 2023, representing a growth of 24.91%. The proportion of good-air-quality days rose from 58.60% to 78.10%, indicating a steady increase in the number of days meeting air quality standards. (2) The concentrations of major air pollutants generally decreased. Specifically, the annual average concentration of PM10 decreased from 108 µg/m3 to 60 µg/m3, a reduction of 44.44%. The annual average concentration of PM2.5 decreased from 64 µg/m3 to 39 µg/m3, a reduction of 39.06%. These improvements resulted from the comprehensive application of measures in Chengdu, including dust control, industrial dust removal, and vehicle emission management. This aligns with the findings of Ivanovski et al. [31] regarding air quality improvement measures in Slovenia. The annual average concentration of SO2 decreased from 14 µg/m3 to 3 µg/m3, representing the most significant decline of 78.57%. This achievement can be attributed to the notable effectiveness of initiatives such as the transition to clean energy (switching from coal to gas/electricity) and the widespread implementation of desulfurization facilities. This is consistent with the findings of Xu et al. [32] from a provincial perspective. The annual average concentration of NO2 decreased from 53 µg/m3 to 28 µg/m3, a reduction of 47.17%. This can be largely attributed to the gradual enhancement of vehicle emission standards in Chengdu and the outstanding contribution of urban public rail transit expansion. This finding is consistent with the research by Von Schneidemesser et al. [33] on NO2 reduction pathways in European cities. The concentration of CO decreased from 2 mg/m3 to 1 mg/m3, a reduction of 50%. The significant reductions in SO2 and CO concentrations highlight the remarkable effectiveness of controls on coal combustion and industrial emissions. However, the concentration of PM10 showed a slight rebound in 2023, and the concentration of O3 increased noticeably in 2022. This indicates that Chengdu still faces the risk of air pollution resurgence under specific periods, such as the accelerated economic recovery in the post-pandemic era, or under certain meteorological conditions like the stagnant air weather typical of the Sichuan Basin. (3) Within the research period, the concentration of O3 showed a slight fluctuating decline but remained at a high level, becoming a new focus of air pollution. Its concentration fluctuated between 2015 and 2023, with the highest value recorded in 2015 (183 µg/m3) and the lowest in 2021 (151 µg/m3). Subsequently, it rebounded to 181 µg/m3 in 2022, indicating that the existing VOC control and synergistic measures have limited effectiveness and unstable outcomes. This corroborates the findings of Jiménez et al. [34] in their study on the Iberian Peninsula, which revealed that O3 exhibits a sensitive response to precursor controls.
In summary, from 2015 to 2023, Chengdu’s air quality excellence rate demonstrated continuous improvement. This progress reflects the city’s substantial achievements in industrial restructuring, energy transition to cleaner sources, and precise pollution control measures. However, O3 pollution emerged as an increasingly prominent issue, while certain particulate matter emission indicators exhibited fluctuations. This situation indicates that regional air pollution control has entered a “deep-water zone,” facing more complex challenges. The aforementioned phenomenon was primarily attributed to the following socioeconomic realities: (1) The optimization of the industrial structure and adjustment of the energy mix. As an economic hub in western China, Chengdu continuously promoted the relocation or upgrading of high-energy-consumption and high-pollution enterprises. The proportion of high-technology, low-emission industries such as electronic information and new energy increased steadily. Meanwhile, Chengdu actively implemented initiatives like the “Elimination of Coal-Fired Boilers” and “Gasification of Chengdu.” The share of coal in total energy consumption dropped significantly, while the proportions of natural gas and electricity continued to rise. This directly led to a substantial decline in the concentration of air pollutants such as SO2 and CO, which is similar to the research results of Li et al. [35]. (2) The optimization of the transportation structure and management of motor vehicles. Chengdu’s subway operational mileage ranked among the highest in China, and the public transportation sharing rate continued to increase. Furthermore, it actively promoted the adoption of battery electric vehicles, plug-in hybrid electric vehicles, and fuel cell vehicles. These initiatives effectively reduced the pollution intensity from mobile sources and consequently led to a continuous decline in NO2 concentrations. This is consistent with the pollution control effects of vehicle electrification found in the study by Wang et al. [36]. (3) The continuous advancement of the air pollution prevention and control action plan. Chengdu actively implemented localized specialized measures like the Autumn and Winter Air Quality Campaign and the Ozone Pollution Prevention and Control Plan. These efforts focused on strengthening dust control, industrial emission supervision, and VOCs treatment, thereby driving a steady decrease in the concentrations of particulate matter such as PM2.5 and PM10. This is consistent with the empirical findings of Cieply et al. [37] regarding China’s two-control zone policy. (4) The unique formation mechanism made O3 pollution control challenging. The precursors of O3 (VOCs and NOx) originate from complex sources, involving multiple categories such as industry, motor vehicles, and solvent use. Simultaneously, their formation is associated with meteorological conditions like high temperatures and intense sunlight, resulting in high formation potential and significant control difficulties. In this regard, Chengdu urgently needs to strengthen seasonal regulation and regional joint prevention and control. This is similar to the findings of Sari et al. [38] regarding the temporal variation in air pollutants in Bursa, Turkey.
4.3. Evolution Characteristics of Carbon Emissions from Energy Consumption in Chengdu
4.3.1. Analysis from the Perspective of Total Emissions
Based on the calculation model established in Section 3.1, the characteristics of carbon emissions from energy consumption in Chengdu’s typical industries from 2015 to 2023 are summarized in Table 3.
Table 3.
Characteristics of carbon emissions from energy consumption in Chengdu’s typical industries from 2015 to 2023. Unit: 10,000 tons.
From the perspective of total carbon emissions, the trend did not increase linearly but exhibited a distinct three-phase developmental pattern. Specifically: Phase 1 was a period of fluctuating decline (2015–2018). The total carbon emissions decreased from 18.79 million tons in 2015 to 17.58 million tons in 2018, showing an overall fluctuating downward trend. A short-term weak decoupling between urban economic growth and carbon emissions emerged. The reasons for this phenomenon include: Firstly, nationally promoted policies such as “cutting overcapacity” and “reducing inventory” directly restricted the capacity expansion of high-energy-consuming industries in Chengdu, such as steel, coal, and cement. Carbon emissions from these industries either declined or remained stable during this period. Simultaneously, the Central Environmental Protection Inspection, initiated in 2016, was extensive in its supervision and strict in its accountability. A significant number of small and medium-sized enterprises in and around Chengdu that failed to meet environmental standards were shut down or mandated to rectify, which effectively reduced carbon emissions in the short term. This is consistent with the empirical findings of Pan [39] from a provincial perspective. Secondly, during the implementation of the 13th Five-Year Development Plan, Chengdu vigorously promoted the substitution of clean energy, reducing the burning of higher-carbon coal resources and increasing the use of natural gas. Thirdly, during this phase, the growth of Chengdu’s traditional manufacturing sector, characterized by high energy consumption, slowed down. Concurrently, advanced manufacturing industries, such as electronic information, remained limited in scale, meaning they had not yet generated high-level energy consumption demands. This “metabolism” of the industrial structure indirectly contributed to carbon reduction.
Phase 2 was a period of sharp increase (2020). The total carbon emissions surged from 18.72 million tons in 2019 to 27.58 million tons in 2020, representing a significant increase of 47.36%. This constituted an exceptionally pronounced inflection point, resulting from the convergence of multiple factors. Firstly, a major change in statistical boundaries occurred. Carbon emissions from the oil and gas extraction industry and the mining support activities industry abruptly rose to 4.06 million tons and 0.82 million tons, respectively, from nearly zero. This was most likely due to the inclusion of large-scale provincial or national energy projects (such as shale gas development and natural gas purification) within Chengdu’s statistical accounting. These projects were inherently energy-intensive, and their inclusion in the local inventory instantaneously elevated the regional carbon emission total. However, this represented a geographical reclassification of emissions rather than an actual, sudden increase in local consumption. Secondly, the economic rebound effect following the COVID-19 pandemic played a role. In the second half of 2020, China was among the first to recover from the pandemic, leading to a rapid resumption of production activities. To compensate for losses incurred in the first half, production intensity was increased across regions. Particularly in export-oriented industries, such as Chengdu’s electronic information industry, full order books prompted operations at maximum capacity, resulting in a concentrated release of energy demand. This differs from the overall contraction trend in production activities found in Li’s [40] study on Poland, primarily due to China’s strict lockdown policies, which led to effective pandemic control outcomes in the short term. Thirdly, pillar industries experienced explosive growth. For instance, carbon emissions from the computer, communication, and other electronic equipment manufacturing industry exceeded the one-million-ton threshold for the first time (1.21 million tons), marking a year-on-year increase of 10%. This is attributed to the fact that both its production lines and data centers were major electricity consumers.
Phase 3 was a period of stable growth at a high level (2021–2023). The total carbon emissions exceeded 30 million tons and continued to grow from this elevated baseline. However, the growth rate slowed significantly compared to the spike in 2020 (averaging 4.25% annually), reaching a historical peak of 33.50 million tons in 2023. The reasons for the above trend are as follows: Firstly, new growth engines gradually came to dominate the city’s industrial economy. For instance, carbon emissions from the electronic information industry continued to rise to 1.41 million tons. Benefiting from the manufacturing of green energy equipment like photovoltaic panels and lithium batteries, the electrical machinery industry experienced explosive growth, reaching 0.98 million tons. Although these industries were classified as advanced manufacturing, their production processes remained highly dependent on electricity. Secondly, Chengdu’s permanent resident population at year-end continued to increase, rising from 21.19 million in 2021 to 21.40 million in 2023. The physical urban space kept expanding, and the baseline energy consumption from subways, office buildings, data centers, and residential electricity use steadily increased. Thirdly, the “green paradox” effect emerged. Chengdu was actively developing green industries such as new energy vehicles and photovoltaic equipment. However, the production processes of these industries (e.g., battery manufacturing, silicon refining, and component production) were characterized by high energy consumption. Therefore, before the emission reduction effects of end-use consumption could materialize, carbon emissions from the production side increased first, highlighting a typical period of transitional challenges. This is consistent with the simulation results on the “green paradox” by Tu et al. [41], which were based on system dynamics.
4.3.2. Analysis from the Perspective of Industrial Heterogeneity
Based on the heterogeneous emission characteristics of typical industries, they can be classified into four categories: high-emission dominant, rapid-growth, stable, and declining. The high-emission dominant industries had annual carbon emissions consistently exceeding 1.5 million tons over the long term. This category mainly included: (1) The electric power, heat power production and supply industry was the absolute dominant industry. Its carbon emissions from energy consumption exhibited a brief “V-shaped” rebound in 2016, followed by sustained high-speed growth starting in 2018. By 2023, emissions had reached 12.37 million tons. The main reason for this phenomenon is demand-side drivers. As a megacity with net population inflow, Chengdu experienced rigid growth in its baseload demand due to urban expansion, transportation electricity use (especially from subways), data centers, and commercial and residential electricity consumption. This is similar to the development trajectory of Delhi, a megacity in India, as discovered in the study by Ram et al. [42]. Concurrently, the rapid development of high electricity-consuming manufacturing industries, such as electronic information and electrical machinery, collectively generated substantial electricity demand for production. (2) The non-metallic mineral products industry (e.g., cement, glass, ceramics) was a traditionally major source of carbon emissions, with its emissions consistently remaining within the range of 4.5 to 5.0 million tons over the years. However, it exhibited a general slow declining trend, decreasing to 4.31 million tons in 2023. The reasons for this phenomenon are as follows: under environmental regulations, a significant number of small and medium-sized cement plants and brick factories with low energy efficiency were permanently shut down, leading to increased concentration of production capacity. To meet environmental requirements, the remaining large enterprises were compelled to carry out energy-saving technological upgrades (such as waste heat power generation and high-efficiency grinding technology). This helped to reduce the carbon emission intensity per unit of product. (3) The petroleum processing, coking, and nuclear fuel processing industry maintained overall stability in its carbon emissions, which remained at around 2 million tons per year over a long period. The reason for this phenomenon is that the rigid demand in the refined oil market was linked to the vehicle population, making it resistant to sudden changes but stable at a high level. Simultaneously, processing technology was mature and production capacity was stable. Its carbon emissions only exhibited minor periodic fluctuations associated with equipment maintenance. This is similar to the findings of Fu et al. [43] in their study on the capacity adjustment strategies of large petrochemical enterprises in China under environmental regulations. (4) Carbon emissions from the raw chemical materials and chemical products manufacturing industry fluctuated within the range of 1.50 to 1.90 million tons, without showing a clear continuous upward or downward trend. This phenomenon primarily stemmed from production fluctuations caused by product diversity.
The rapidly growing industries started from a low or moderate baseline of carbon emissions but exhibited extremely rapid growth rates after 2019. This changing characteristic aligned closely with the evolutionary trend of Chengdu’s industrial development strategy. This category primarily includes: (1) The computer, communication, and other electronic equipment manufacturing industry maintained sustained high-speed growth in carbon emissions, surging from 336.40 thousand tons in 2015 to 1.41 million tons in 2023. (2) The carbon emissions from the electrical machinery and equipment manufacturing industry experienced explosive growth. The increase accelerated notably after 2019, surging sharply from 275.40 thousand tons to 981.50 thousand tons in 2023. The reasons for the above phenomena include: Firstly, the incentive effect of industrial clustering. Chengdu had established itself as one of the world’s most important production bases for integrated circuits, optoelectronic display, and smart terminals. Industry giants such as Intel, BOE, Foxconn, and Huawei gathered in the city and continued to increase investments and expand production, thereby driving up energy consumption concurrently. Secondly, the energy consumption cost of technological iteration. Production lines in the industry shifted from ordinary computers to more sophisticated chips and panels. Their processes (e.g., EUV lithography, OLED evaporation) demanded higher standards, such as ultra-clean environments and constant temperature and humidity, leading to an increase in energy intensity per unit of output value. This is consistent with the empirical findings of Juchneski et al. [44] based on patent invention data.
In the stable industry category, carbon emissions remained at a certain level (usually below 500,000 tons) for many years, with minimal fluctuations. This category primarily includes: (1) Automobile manufacturing industry. Carbon emissions peaked in 2017 (597,300 tons) before declining, but they later rebounded to 489,900 tons (2023). This phenomenon occurred because the industry was undergoing a transition from fuel-powered vehicles to new energy vehicles. The contraction of traditional production capacity and the expansion of new energy capacity offset each other in terms of energy consumption, maintaining a dynamic balance in total emissions. Its future carbon emission trends depend on the scale of new production capacity expansion and the pace of green electricity adoption in production processes. (2) Food manufacturing industry and alcohol, beverages and refined tea manufacturing industry. Both industries maintained overall stability in carbon emissions. The former remained within the range of 200,000–250,000 tons, while the latter stayed between 250,000 and 300,000 tons. This pattern occurred because these industries, being essential to daily living, experienced stable market demand and did not undergo drastic fluctuations in production capacity. Meanwhile, they actively implemented measures such as boiler upgrades and energy management, which offset some of the emission increases that would otherwise have resulted from capacity expansion. This is similar to the findings of Armstrong et al. [45] regarding the carbon emission characteristics of the supply chain for daily necessities in the United States. (3) Metal products industry and rubber and plastic products industry. Their emissions stabilized at 300,000–350,000 tons and 300,000–500,000 tons, respectively. As supplier industries of general components, their development moved in tandem with the overall performance of the manufacturing sector, which resulted in moderate fluctuations in their carbon emissions.
The declining industry category exhibited a distinct and long-term downward trend in carbon emissions. This category primarily includes: (1) Textile industry. Its carbon emissions dropped from 187,800 tons in 2016 to 30,200 tons in 2023. This occurred mainly because, as a labor-intensive industry, it was gradually relocated from Chengdu to less developed regions within the province or to Southeast Asia where costs were lower. Only a small amount of high-end or specialized production capacity remained in Chengdu, which agrees with the research results of Xu et al. [46] regarding the western region of China. (2) Leather, fur, feather and related products and footwear industry. Its carbon emissions decreased from 111,900 tons in 2015 to 19,300 tons in 2023. This downward trend was also attributed to industrial transfer. In addition, the industry was a key target for environmental remediation (due to severe pollution from tanning processes) in Chengdu. Under these circumstances, a significant number of enterprises were shut down, and production capacity was reduced. (3) Paper and paper products industry. Its carbon emissions declined from 518,900 tons in 2017 to 240,700 tons in 2023. This resulted from a significant contraction in the industry’s scale due to the impact of electronic media. (4) Chemical fiber manufacturing industry. Its carbon emissions shrank sharply from 346,800 tons in 2016 to 23,300 tons in 2023. This phenomenon occurred because Chengdu, as a traditional industrial base, gradually lost its competitive edge in the market, leading to the continued phase-out of production capacity.
4.4. Synergistic Reduction Effects Between Carbon Emissions from Energy Consumption and Air Pollutant Emissions in Chengdu
4.4.1. Synergistic Reduction Effect Between Overall Carbon Emissions and Multiple Air Pollutants
Based on the synergistic effect analysis model established in Section 3.2, the synergistic reduction effects between overall carbon emissions and multiple air pollutants in Chengdu are calculated, as detailed in Figure 2.
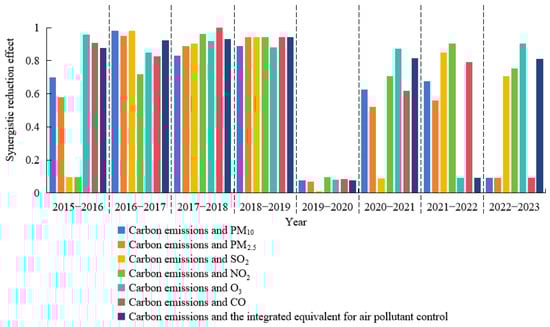
Figure 2.
Synergistic reduction effects between overall carbon emissions and multiple air pollutants in Chengdu.
Based on the data presented in Figure 2, the following observations are made: (1) The synergistic reduction effect between overall carbon emissions and both PM10 and PM2.5 in Chengdu was relatively high from 2016 to 2019, remaining in a well-coordinated state (above 0.8). This period of high synergy was attributed to the simultaneous advancement of air pollution control and low-carbon energy transition in Chengdu, driven by policies such as the Air Pollution Prevention and Control Action Plan and the Blue Sky Defense War. However, from 2019 to 2020, the synergistic reduction effect plummeted to approximately 0.07, entering a state of extreme imbalance. This sharp decline was mainly due to regional industrial shutdowns and transportation restrictions during the initial phase of the COVID-19 pandemic, which led to a temporary decoupling of carbon emissions and particulate matter emissions. Although the synergistic reduction effect later recovered to some extent, it dropped again to 0.09 in 2022–2023. This phenomenon was likely caused by the rebound in carbon emissions from energy-intensive industries as economic recovery progressed, which is similar to the findings of Phan [47] regarding energy demand in BRICS countries during the post-pandemic era. (2) The synergistic reduction effect between overall carbon emissions and SO2 exhibited significant fluctuations. From 2016 to 2019, it showed high synergistic values, maintaining an excellent coordination state (above 0.9). During 2019–2020, however, it dropped to an extremely low value (only 0.01), entering a state of severe imbalance. The synergistic reduction effect rebounded between 2021 and 2023. These fluctuations were mainly attributed to the fact that SO2 emissions originated from sources such as coal combustion and industrial processes, which were highly sensitive to policy interventions. The extremely low values in 2019–2020 were linked to the stagnation of industrial activities and temporary changes in the energy consumption structure during the pandemic period. (3) The synergistic reduction effect between overall carbon emissions and NO2 remained relatively high overall. During 2017–2019 and 2021–2022, the values exceeded 0.9, indicating an excellent coordination state. This pattern occurred because NO2 emissions were closely related to terminal energy consumption, particularly in sectors such as transportation. The electrification trend in transportation significantly promoted the synergistic reduction effects. (4) The synergistic reduction effect between overall carbon emissions and O3 was generally high (exceeding 0.84 in most years), indicating a well-coordinated state. However, in 2019–2020 and 2021–2022, it recorded two extremely low values of 0.0813 and 0.0941, respectively, before rebounding to 0.9044 in 2022–2023. This pattern occurred because O3 is a secondary pollutant, and the effectiveness of its emission reduction depended heavily on environmental governance investments. During the initial impact of the pandemic in 2019–2020 and the further disruption caused by the Omicron variant in 2021–2022, pollution control efforts were compromised in favor of maintaining economic and social stability. In contrast, socioeconomic activities remained highly dependent on energy use, leading to a divergence in the trends of carbon emissions and pollutant emissions. (5) The synergistic reduction effect between overall carbon emissions and CO was high during 2015–2019, while two distinct minima occurred in 2019–2022 and 2022–2023. This pattern arose because CO originates mainly from incomplete combustion. The high level of synergy during the 13th Five-Year Development Plan period was supported by the simultaneous advancement of clean energy substitution and improvements in combustion efficiency. The subsequent decline reflected a trend of diminishing marginal effectiveness in controlling CO emission concentrations under existing technological conditions. (6) The synergistic reduction effect between overall energy consumption carbon emissions and the integrated equivalent for air pollutant control remained at relatively high levels during the 13th Five-Year Development Plan period (with all values exceeding 0.87), indicating a well-coordinated or high-quality coordinated state. However, the value plummeted to 0.0941 in 2021–2022. This low value likely stemmed from structural contradictions between China’s “Dual Carbon” goals and regional energy supply guarantee policies, which temporally hindered progress toward both carbon reduction and pollution mitigation targets. Although a gradual recovery was observed in 2023, the value had not returned to its previous high level, indicating that coordinated governance still faced structural challenges. This differs from the findings of Alava et al. [48] based on a global perspective, primarily because China’s strict pandemic prevention and control policies were maintained for a longer duration.
4.4.2. Synergistic Reduction Effects Between Carbon Emissions in Multiple Industries and Overall Air Pollutants
The synergistic reduction effects between carbon emissions in multiple industries and overall air pollutants in Chengdu are detailed in Table 4.
Table 4.
Synergistic reduction effects between carbon emissions in multiple industries and overall air pollutants in Chengdu.
Based on Table 4, the synergistic reduction effects between industry-specific carbon emissions and overall pollutant emissions can be divided into five categories: sustained high-efficiency, generally stable, fluctuating, sudden-decline, and persistently low. Specifically, the sustained high-efficiency category included industries such as oil and gas extraction, mining support activities, electrical machinery and equipment manufacturing, computer, communication, and other electronic equipment manufacturing, and waste resource comprehensive utilization. The synergistic reduction effects between their carbon emissions and pollutant emissions were generally above 0.8, highlighting their stable and high-level capacity for coordinated carbon and pollution reduction. This phenomenon can be explained by the following socioeconomic factors: Firstly, industrial advancement. Industries such as electrical machinery, computers, and communications served as pillar sectors in Chengdu, characterized by technology-intensive production. Their manufacturing processes and pollution control technologies were inherently relatively advanced. Secondly, centralized management advantages. Industries such as petroleum extraction and resource utilization typically featured large-scale enterprises. Their concentrated production activities facilitated the implementation of unified and efficient energy management and end-of-pipe treatment measures, with low regulatory costs and significant control effectiveness. This finding is consistent with the results of Bal-Domanska et al. [49] regarding large industrial enterprises in Poland. Thirdly, policy guidance. High-end manufacturing industries like electronic equipment, along with environmental protection industries such as comprehensive waste utilization, aligned with Chengdu’s industrial high-quality transformation direction. As key priority areas for green, low-carbon, and circular development, these industries received continuous technical support and benefited from policy incentives in the field of coordinated environmental governance. The changes in synergistic effects within this category reflected Chengdu’s implementation of the “Retreat from Secondary, Advance into Tertiary” industrial restructuring policy.
The generally stable category included industries such as non-metallic mineral products, petroleum processing, coking, and nuclear fuel processing, raw chemical materials and chemical products manufacturing, non-metallic mineral products, and instrument manufacturing. The synergistic reduction effects between their carbon emissions and pollutant emissions remained generally stable. This is primarily because, on one hand, a significant portion of Chengdu’s chemical industry had been relocated, leading to stable remaining production capacity. On the other hand, the peak period of large-scale urban construction and infrastructure investment in Chengdu had passed, leading the absolute demand for materials like metals, cement, and glass, as well as machinery and equipment, entering a plateau or even a decline phase. However, the synergistic effects were susceptible to external policy shocks or major unexpected events. Abnormally low values occurred during 2018–2019 and 2020–2021. This phenomenon can be explained by the following socioeconomic factors: Firstly, the extremely low values concentrated in 2019 were mainly attributed to the large-scale expansion of sectors such as non-metallic minerals, petroleum processing, and chemicals against the backdrop of Chengdu’s stable macroeconomic performance. This expansion led to an increase in carbon emissions from energy consumption. In contrast, due to assessment pressures in the later stage of the 13th Five-Year Development Plan period, air pollutant emissions decreased, resulting in a sharp and simultaneous drop in the synergy values. This findings agree with the research results of Hu et al. [50] regarding the effectiveness of China’s Five-Year Plans. Secondly, the extremely low values concentrated in 2021 were primarily due to the recovery of production capacity in the aforementioned industries after the pandemic was brought under control. With the goal of prioritizing production, energy-saving and emission-reduction measures failed to keep pace, leading to a temporary imbalance in the synergistic effects.
The fluctuating category included industries such as agricultural and sideline food processing, textile and apparel manufacturing, paper and paper products, raw chemical materials and chemical products manufacturing, rubber and plastic products, general equipment manufacturing, automobile manufacturing, and gas production and supply. The synergistic reduction effects between their carbon emissions and pollutant emissions exhibited significant year-to-year fluctuations, without a clear sustained upward or downward trend. This phenomenon can be explained by the following socioeconomic factors: Firstly, their inherent industry characteristics. Most of these industries belong to traditional manufacturing sectors, characterized by numerous enterprises, decentralized scales, and uneven technological capabilities. Their environmental pollution levels were affected by multiple factors such as order volumes, raw material changes, and production process modifications, leading to unstable synergistic effects. This is similar to the findings of Lala et al. [51] regarding the environmental impact of the manufacturing sector in Nigeria. Secondly, practical policy and action drivers. Notable increases in the synergistic reduction values often corresponded with specific events such as environmental inspections, technological upgrades, or equipment replacements. For example, the general equipment manufacturing and automobile manufacturing industries reached peak synergy levels during 2017–2018, which was attributable to the stringent measures implemented during the final assessment phase of the first stage of the Air Pollution Prevention and Control Action Plan. Thirdly, market competition and cost pressures. When facing cost constraints, these industries tended to reduce investments in environmental governance and energy transition. The synergistic reduction effects in the automobile manufacturing industry dropped significantly to 0.2467 in 2023. This was closely related to supply chain adjustments under the impact of electrification. In this context, the industry faced a challenge in balancing the constraints on fuel vehicle sales and the inertia of existing industrial development patterns, which agrees with the research finding of Beltrami et al. [52] based on a global perspective. Fourthly, the vulnerability of the supply side under the influence of external factors. For the gas production and supply industry, although hydropower dominated electricity production in Sichuan Province, a seasonal contradiction existed between wet and dry periods. This is consistent with the findings of Jiang et al. [53] regarding the characteristics of energy supply in Sichuan Province. During extreme winter cold or summer heat events driven by global climate change, substantial coal-fired or gas-fired power generation must be dispatched to ensure grid safety and stability. The uncertainty of extreme weather events drove fluctuations in synergistic effects. For the chemical raw materials and chemical products manufacturing industry, which includes both basic chemicals (e.g., fertilizers, alkali) and fine chemicals, with different sub-sectors experiencing different business cycles. In years when specific product lines (e.g., lithium salts, electronic chemicals) saw strong demand and high operating rates, synergistic effects decrease; conversely, synergistic effects increase.
The sudden-decline category included industries such as alcohol, beverages and refined tea manufacturing, pharmaceutical manufacturing, non-ferrous metal smelting and rolling processing, Leather, fur, feather and related products and footwear, gas production and supply, and electrical machinery and equipment manufacturing. The synergistic reduction effects between their carbon emissions and pollutant emissions plummeted from previously medium-to-high levels after either 2021 or 2022, remaining consistently low (below 0.1). This phenomenon can be explained by the following socioeconomic factors: Firstly, the incentive effects of new industrial expansion drivers on carbon emissions. As the principal contradiction in Chinese society has shifted to that between unbalanced and inadequate development and the people’s ever-growing needs for a better life, consumption for enjoyment has driven continuous expansion in energy consumption in the industries such as alcohol, beverages and refined tea manufacturing. Consequently, their carbon emissions showed an increasing trend during the research period, contrasting sharply with the steady decline in pollutant emissions. Secondly, The impact of black swan events. The biomedical industry is a key focus of development in Chengdu, with the number of enterprises and production scale continuously expanding. Processes such as chemical synthesis, fermentation, and purification in drug production require strict environmental controls, leading to consistent energy demand. Meanwhile, the pharmaceutical manufacturing sector gained expansion opportunities during special periods such as the pandemic due to increased demand. Thirdly, inherent limitations of single energy source utilization. Taking the gas production and supply industry as an example, natural gas serves as an important transitional energy in achieving the carbon neutrality goal. However, as it is inherently a fossil fuel, its large-scale use still generated significant carbon emissions, which agrees with the findings of Li et al. [54] on natural gas industry. Moreover, methane leakage during its production and transportation makes the clean energy industry itself less clean. Thirdly, the strategic shift towards the new energy sector. Taking the electrical machinery and equipment manufacturing industry as an example, Chengdu prioritized the development of industries such as photovoltaics, lithium batteries, and new energy vehicles. Production stages like polysilicon reduction, silicon ingot pulling and squaring, and electrode winding and liquid injection are inherently highly energy-intensive processes. Consequently, the new growth driver in this sector resulted in new sources of pollution, thereby affecting the level of synergistic reduction. This phenomenon represented a concentrated reflection of Chengdu’s successful industrial planning, which simultaneously increased environmental pressure in the short term.
The persistently low category included industries such as furniture manufacturing, wood processing and wood, bamboo, rattan, palm, and straw products, cultural, educational, arts, crafts, sports, and entertainment goods manufacturing, and other manufacturing. The synergistic reduction effects between their carbon emissions and pollutant emissions remained below 0.7, or even 0.5, in most years. This phenomenon can be explained by the following socioeconomic factors: Firstly, these industries were typically characterized as small, scattered, and disorganized. Their production models were dominated by small and medium-sized enterprises and small workshops, which found it difficult to afford the high costs of energy-saving and environmental technological upgrades. Moreover, the large number and wide distribution of these enterprises made comprehensive and effective environmental supervision challenging, and created difficulties in the strict enforcement of environmental and energy efficiency standards. Meanwhile, the other manufacturing industry constituted a broad, catch-all category. Its internal composition was complex and variable, making it inherently difficult to form stable and effective coordinated management strategies. Secondly, these industries generally relied on biomass energy (e.g., wood waste) or high-carbon coal for their production operations, which aligns with the findings of Top [55] regarding energy utilization in furniture-manufacturing enterprises in Turkey. Their inherent processes made the transition to clean energy both difficult and costly.
5. Conclusions and Policy Implications
5.1. Main Conclusions
During the research period, Chengdu’s air quality excellence rate demonstrated continuous improvement. Specifically, the early-stage emission reduction efforts primarily focused on PM10, PM2.5, and SO2, while the mid- and late-stage efforts gradually shifted their focus to O3 and NO2. The carbon emissions from overall energy consumption in Chengdu exhibited a three-phase developmental pattern: a period of fluctuating decline, a phase of sharp increase, and a period of steady growth at a high level. The structure of carbon emissions in Chengdu’s typical industries underwent a fundamental transformation. The driving forces of growth had shifted from traditional high-energy-consuming industries (such as cement and steel) to advanced manufacturing (e.g., electronic information), urban basic energy demands (e.g., electricity), and energy extraction industries serving national strategies. This indicated that the decoupling process between Chengdu’s socioeconomic development and carbon emissions was more complex. While industrial upgrading brought new momentum for economic growth, it also introduced new, technologically advanced sources of emissions.
The synergistic reduction effects between carbon emissions from energy consumption and various air pollutant emissions in Chengdu showed overall improvement but was characterized by significant fluctuations. Driven by strategies such as the Blue Sky Defense War, the synergistic reduction in carbon emissions with PM10 and PM2.5 reached relatively high levels from 2016 to 2019, followed by fluctuations due to the impact of the COVID-19 pandemic. The synergistic reduction between carbon emissions and SO2 exhibited considerable volatility. The electrification trend in transportation significantly promoted the synergistic reduction in carbon emissions and NO2 emissions. Due to the fact that O3 is a secondary pollutant with complex sources, achieving synergistic governance with carbon emissions proved more challenging. As a result of technological limitations, the synergistic reduction in carbon emissions and CO gradually exhibited a trend of diminishing marginal effects. The synergistic reduction effects between industry-specific carbon emissions and overall air pollutant emissions can be divided into five categories: sustained high-efficiency, generally stable, fluctuating, sudden-decline, and persistently low. The sustained high-efficiency category, which includes technology-intensive and high-end manufacturing industries, inherently possesses synergistic advantages. In contrast, the fluctuating and persistently low categories, comprising traditional and fragmented manufacturing sectors, represent key targets for future efforts in synergistic emission reduction.
5.2. Policy Implications
Based on the empirical analysis results, the following differentiated policy implications are proposed to promote the synergistic effects of carbon reduction and pollution mitigation: (1) The sustained high-efficiency category should consolidate its leading advantages. By leveraging the industrial agglomeration advantages of Chengdu in electronic information, equipment manufacturing, and other sectors, efforts should be made to deepen the integration of industrial internet and artificial intelligence technologies in energy management and pollution control, thereby achieving precise prediction and real-time optimization. Additionally, leading enterprises (such as Tongwei, Intel, and BOE) should be supported to take the lead in establishing internationally advanced green supply chain standards. Demonstration projects of “zero-carbon factories” and “near-zero carbon emission zones” should be implemented so as to drive the continuous increase in both the proportion of green electricity usage and the energy efficiency of individual equipment. (2) The overall stable category should enhance system resilience. The key to driving of synergistic emission reduction lies in promoting high-end and refined adjustments to the product structure, coupled with improving production unit efficiency through technological iteration and upgrades to environmental protection facilities. Key industrial parks should establish flexible regulation mechanisms that coordinate with the city’s power supply and environmental capacity. Additionally, functional zones such as the Qingbaijiang Advanced Industrial Park should demonstratively undergo circular transformation and green upgrading, prioritizing the development of advanced industries like green manufacturing and new materials. Furthermore, more refined seasonal and differentiated control measures should be implemented, while actively exploring cross-regional and cross-industry collaborative governance mechanisms to enhance overall environmental management efficiency. (3) The fluctuating category should adopt targeted measures based on precise classification. For traditional industrial clusters such as food and clothing, a public digital service platform for synergistic carbon and pollution governance should be established for small and medium-sized enterprises, by leveraging Chengdu’s role as a hub node in the “East Data West Computing” project and its advantages in smart governance. For the chemical fiber manufacturing industry, efforts should be made to accelerate the research and development of green fibers and the adoption of clean production technologies. For the rubber and plastic products industry, guidance should be provided to increase the proportion of recycled materials used, and optimize carbon footprint management throughout the product lifecycle. In alignment with the rural revitalization strategy, the integration of agricultural and sideline food processing industries with the energy utilization of agricultural waste should be promoted. For the automotive manufacturing industry, the advantages of the local consumer market should be utilized to continuously drive the transition to electrification, with a focus on source control of VOCs and NOx emissions. Additionally, in post-pandemic recovery plans, a dedicated “Green Recovery” special fund should be established, and the proportion of green suppliers should be increased to reduce dependence on singular or fragile supply chains. (4) The sudden-decline category should focus on overcoming path dependency. The pharmaceutical manufacturing industry should be guided to utilize clean energy sources such as hydropower and photovoltaics, and to pursue research and development in green pharmaceutical processes. For the non-ferrous metal smelting and rolling processing industry, enterprises should be encouraged to adopt technologies such as waste heat recovery and energy-saving electrolytic aluminum, and explore high-value-added development pathways like green power aluminum and recycled metals. For the gas supply industry, the deployment of distributed energy and hydrogen energy storage facilities should be accelerated in newly developed areas like Tianfu New District and Eastern New District. Additionally, efforts should be made to promote the complementary integration of wind, solar, hydropower, and natural gas resources to reduce the inherent limitations of relying on a single energy source. (5) The persistent low category should implement centralized governance. Green demonstration parks can be planned in areas such as Pengzhou and Chongzhou to continuously guide small, scattered, and disorganized enterprises (e.g., small-scale furniture and stationery manufacturers) to relocate to parks with comprehensive environmental infrastructure. Subsidies should be provided for technological upgrades in these enterprises, while the parks should centrally construct facilities for wastewater and exhaust gas treatment, biomass energy systems, as well as carbon capture, utilization, and storage (CCUS) systems. Additionally, by leveraging Chengdu’s abundant bamboo and timber resources, regions like Dujiangyan and Qionglai should promote the use of bamboo products as substitutes for high-carbon materials. Meanwhile, the policy incentive mechanism should be improved, providing process upgrade subsidies and tax incentives to enterprises that conduct clean production audits and obtain green product certifications.
While this study offers novel contributions, its limitations present some opportunities for subsequent research. Firstly, this study adopts the latest officially published localized carbon emission factors and carbon oxidation rates for China. Compared to using the default data from the IPCC, as seen in previous studies, this approach significantly enhances the accuracy of the calculation results. In future research, city-specific data could be incorporated by combining experiments or field investigations. Secondly, this study takes into account 6 types of air pollutants and 37 energy consumption industries, facilitating a more granular analysis of synergistic effects. However, limited by data availability, this study primarily focuses on the overall air pollutant emissions at the city level and does not delve into the direct air pollution caused by energy consumption. Future research could further expand data sources by incorporating remote sensing technology. Thirdly, by calculating the relative changes and annual averages of the indicators, this study ensures conceptual consistency in assessing the synergistic effects of carbon reduction and pollution mitigation. Future research could, on the basis of obtaining pollutant emission factors from energy consumption, standardize them into “source” indicators to further enhance model consistency. Furthermore, this study moves beyond examining simple data trends to conduct an in-depth investigation of the socioeconomic basis behind the data, thereby clarifying the real-world logic behind the evolution of environmental issues. Future research could employ econometric models to empirically investigate the influence mechanisms of the driving factors behind changes in the synergistic effects.
Author Contributions
Conceptualization, Q.L.; Formal analysis, Q.L. and P.Z.; Investigation, Q.L.; Methodology, Q.L. and P.Z.; Resources, P.Z.; Software, Q.L.; Validation, Q.L. and P.Z.; Writing—original draft, Q.L. and P.Z.; Writing—review and editing, Q.L. and P.Z. All authors have read and agreed to the published version of the manuscript.
Funding
This research was funded by China Postdoctoral Science Foundation (2025MD774135) and Chengdu Philosophy and Social Sciences Planning Project (2024BS072).
Institutional Review Board Statement
Not applicable.
Informed Consent Statement
Not applicable.
Data Availability Statement
The raw data supporting the conclusions of this article will be made available by the authors on request.
Acknowledgments
This research was supported by the 2025 Research Project of Chengdu Association for Science and Technology.
Conflicts of Interest
The authors declare no conflicts of interest.
References
- Nasirov, S.; O’Ryan, R.; Morales, I. Environmental co-benefits of carbon taxation on air pollution under a low-carbon pathway in Chile. Energy Nexus 2025, 19, 100499. [Google Scholar] [CrossRef]
- Mier, M.; Adelowo, J.; Weissbart, C. Complementary taxation of carbon emissions and local air pollution. Energy Econ. 2024, 132, 107460. [Google Scholar] [CrossRef]
- Yawale, S.K.; Hanaoka, T.; Kapshe, M.; Deshpande, A. Direct and indirect air pollutant reductions as co-benefits of the energy transition toward carbon-neutrality in India’s residential sector. Energy Strategy Rev. 2023, 49, 101143. [Google Scholar] [CrossRef]
- Jia, Y.; Huang, Y.Y.; Zhou, J.Y.; Sun, J.S. Construction of evaluation indicator system and analysis for low-carbon economy development in Chengdu City of China. Systems 2025, 13, 573. [Google Scholar] [CrossRef]
- Nam, K.M.; Waugh, C.J.; Paltsev, S.; Reilly, J.M.; Karplus, V.J. Synergy between pollution and carbon emissions control: Comparing China and the United States. Energy Econ. 2014, 46, 186–201. [Google Scholar] [CrossRef]
- Tan, Q.Y.; Liu, F.; Li, J.H. An integrated analysis on the synergistic reduction of carbon and pollution emissions from China’s iron and steel industry. Engineering 2024, 40, 111–121. [Google Scholar] [CrossRef]
- Flores, R.; Houssainy, S.; Wang, W.X.; Cu, K.N.; Nie, X.; Woolfolk, N.; Polly, B.; Faramarzi, R.; Maclay, J.; Lee, J.; et al. Addressing building related energy burden, air pollution, and carbon emissions of a low-income community in Southern California. Adv. Appl. Energy 2024, 14, 100169. [Google Scholar] [CrossRef]
- Crippa, M.; Guizzardi, D.; Pagani, F.; Schiavina, M.; Melchiorri, M.; Pisoni, E.; Graziosi, F.; Muntean, M.; Maes, J.; Dijkstra, L.; et al. Insights into the spatial distribution of global, national, and subnational greenhouse gas emissions in the Emissions Database for Global Atmospheric Research (EDGAR v8.0). Earth Syst. Sci. Data 2024, 16, 2811–2830. [Google Scholar] [CrossRef]
- Yap, T.L.; Vu, N.T.H.; Yeow, P.H.P. Application of the sustainable system-of-systems approach and econometric analysis to address China’s decarbonisation problem. Ergonomics 2024, 67, 482–497. [Google Scholar] [CrossRef]
- Wu, N.; Geng, G.N.; Yan, L.; Bi, J.Z.; Li, Y.S.; Tong, D.; Zheng, B.; Zhang, Q. Improved spatial representation of a highly resolved emission inventory in China: Evidence from TROPOMI measurements. Environ. Res. Lett. 2021, 16, 084056. [Google Scholar] [CrossRef]
- Wang, Z.T.; Ma, P.F.; Zhang, L.J.; Chen, H.; Zhao, S.H.; Zhou, W.; Chen, C.H.; Zhang, Y.H.; Zhou, C.Y.; Mao, H.Q.; et al. Systematics of atmospheric environment monitoring in China via satellite remote sensing. Air Qual. Atmos. Health 2021, 14, 157–169. [Google Scholar] [CrossRef]
- Cao, X.D.; Ci, F.Y. Evolution and spatial correlation network analysis of the coupling coordination degree of urban intelligent industry and green industry in the Yellow River Basin. Sustainability 2025, 17, 5237. [Google Scholar] [CrossRef]
- Gómez-Sanabria, A.; Kiesewetter, G.; Klimont, Z.; Schoepp, W.; Haberl, H. Potential for future reductions of global GHG and air pollutants from circular waste management systems. Nat. Commun. 2022, 13, 106. [Google Scholar] [CrossRef] [PubMed]
- Hanaoka, T.; Masui, T. Exploring effective short-lived climate pollutant mitigation scenarios by considering synergies and trade-offs of combinations of air pollutant measures and low carbon measures towards the level of the 2 °C target in Asia. Environ. Pollut. 2020, 261, 113650. [Google Scholar] [CrossRef] [PubMed]
- Rafaj, P.; Kiesewetter, G.; Krey, V.; Schoepp, W.; Bertram, C.; Drouet, L.; Fricko, O.; Fujimori, S.; Harmsen, M.; Hilaire, J.M.; et al. Air quality and health implications of 1.5 °C–2 °C climate pathways under considerations of ageing population: A multi-model scenario analysis. Environ. Res. Lett. 2021, 16, 045005. [Google Scholar] [CrossRef]
- Ramanathan, V.; Xu, Y.Y. The copenhagen accord for limiting global warming: Criteria, constraints, and available avenues. Proc. Natl. Acad. Sci. USA 2010, 107, 8055–8062. [Google Scholar] [CrossRef]
- Vandyck, T.; Keramidas, K.; Kitous, A.; Spadaro, J.V.; Van Dingenen, R.; Holland, M.; Saveyn, B. Air quality co-benefits for human health and agriculture counterbalance costs to meet Paris Agreement pledges. Nat. Commun. 2018, 9, 4939. [Google Scholar] [CrossRef]
- Okorn, K.; Jimenez, A.; Collier-Oxandale, A.; Johnston, J.; Hannigan, M. Characterizing methane and total non-methane hydrocarbon levels in Los Angeles communities with oil and gas facilities using air quality monitors. Sci. Total Environ. 2021, 777, 146194. [Google Scholar] [CrossRef]
- Beevers, S.; Assareh, N.; Beddows, A.; Stewart, G.; Holland, M.; Fecht, D.; Liu, Y.Z.; Goodman, A.; Walton, H.; Brand, C.; et al. Climate change policies reduce air pollution and increase physical activity: Benefits, costs, inequalities, and indoor exposures. Environ. Int. 2025, 195, 109164. [Google Scholar] [CrossRef]
- Alimujiang, A.; Jiang, P. Synergy and co-benefits of reducing CO2 and air pollutant emissions by promoting electric vehicles—A case of Shanghai. Energy Sustain. Dev. 2020, 55, 181–189. [Google Scholar] [CrossRef]
- Liu, D.D.; Li, X.Y.; Wang, D.; Wu, H.; Li, Y.P.; Li, Y.J.; Qiao, Q.; Yin, Z. An evaluation method for synergistic effect of air pollutants and CO2 emission reduction in the Chinese petroleum refining technology. J. Environ. Manag. 2024, 371, 123169. [Google Scholar] [CrossRef] [PubMed]
- Yang, Y.T.; Xu, H.; Yang, X.; Zhang, Y.; Liu, T. Exploring synergistic efficiency of air pollution and carbon reduction and its influencing factors: Insights from China. Resour. Conserv. Recycl. 2025, 212, 107973. [Google Scholar] [CrossRef]
- Tibrewa, K.; Venkataraman, C. Climate co-benefits of air quality and clean energy policy in India. Nat. Sustain. 2020, 4, 305–313. [Google Scholar] [CrossRef]
- Sun, Y.X.; Xie, Y.L.; Hu, J.H.; Rao, Q.T.; Chen, Z.M. Towards coordinated sustainability: A systematic study of cross-regional synergy in pollution reduction and CO2 mitigation in the Dongjiang River Basin. J. Environ. Manag. 2025, 394, 127639. [Google Scholar] [CrossRef]
- Yang, T.T.; Yi, L.; Yan, S.; Zhang, R.; Wang, X.Y. Synergy of pollution reduction and carbon abatement of the 8 urban agglomerations in China: Status, dynamic evolution, and Spatial-temporal characteristics. Resour. Policy 2024, 95, 105180. [Google Scholar] [CrossRef]
- Li, Q.C.; Zhang, P. Prediction of carbon emission trend of regional energy consumption by integrating system dynamics model and inventory algorithm: A case study of Sichuan Province. Results Eng. 2025, 27, 106901. [Google Scholar] [CrossRef]
- Tong, Y.L.; Guo, F.H.; Wang, X.C.; Jiang, Y.; Gao, J.J.; Li, G.L.; Shao, D.D.; Yue, T. Enhancing the understanding of air pollutant emission reductions from coal-fired industrial boilers under the China’s Clean Air Action Plans. J. Hazard. Mater. 2025, 499, 139999. [Google Scholar] [CrossRef]
- Bertolini, M.; Duttilo, P.; Lisi, F. Accounting carbon emissions from electricity generation: A review and comparison of emission factor-based methods. Appl. Energy 2025, 392, 125992. [Google Scholar] [CrossRef]
- Alqadhi, S.; Bindajam, A.A.; Mallick, J.; Shahfahad; Rahman, A.; Talukdar, S. Mapping and evaluating sustainable and unsustainable urban areas for ecological management towards achieving low-carbon city: An empirical study of Asir Region, Saudi Arabia. Environ. Sci. Pollut. Res. Int. 2023, 30, 65916–65932. [Google Scholar] [CrossRef]
- Liu, Y.S.; Cao, Y.; Hou, J.J.; Zhang, J.T.; Yang, Y.O.; Liu, L.C. Identifying common paths of CO2 and air pollutants emissions in China. J. Clean. Prod. 2020, 256, 120599. [Google Scholar] [CrossRef]
- Ivanovski, M.; Anžel, I.; Goričanec, D.; Urbancl, D. Spatiotemporal analysis and physicochemical profiling of PM10 and PM2.5 in Slovenia. Atmosphere 2025, 16, 540. [Google Scholar] [CrossRef]
- Xu, C.; Zhao, W.Q.; Zhang, M.Z.; Cheng, B.D. Pollution haven or halo? The role of the energy transition in the impact of FDI on SO2 emissions. Sci. Total Environ. 2021, 763, 143002. [Google Scholar] [CrossRef] [PubMed]
- Von Schneidemesser, E.; Kuik, F.; Amar, K.; Butler, T. Potential reductions in ambient NO2 concentrations from meeting diesel vehicle emissions standards. Environ. Res. Lett. 2017, 12, 114025. [Google Scholar] [CrossRef]
- Jiménez, P.; Baldasano, J.M. Ozone response to precursor controls in very complex terrains: Use of photochemical indicators to assess O3-NOx-VOC sensitivity in the northeastern Iberian Peninsula. J. Geophys. Res. Atmos. 2004, 109, D20309. [Google Scholar] [CrossRef]
- Li, X.J.; Abdullah, L.C.; Hu, J.Z.; Sobri, S.; Said, M.S.M.; Hussain, S.A.; Aun, T.P. Spatial variation, multi-meteorological factors and potential source analysis of air pollutants in Chengdu megacity of Chengdu-Chongqing economic circle. Air Qual. Atmos. Health 2025, 18, 87–110. [Google Scholar] [CrossRef]
- Wang, L.Q.; Chen, X.; Zhang, Y.B. Switching to electric vehicles can lead to significant reductions of PM2.5 and NO2 across China. One Earth 2021, 4, 1037–1048. [Google Scholar] [CrossRef]
- Cieply, I.; Wang, F.C. Does pollution control foster innovation? Quasi-Experimental evidence from China’s two-control zone policy. Rev. Dev. Econ. 2025, 29, 1808–1833. [Google Scholar] [CrossRef]
- Sari, M.F.; Tasdemir, Y.; Esen, F. Major air pollutants in Bursa, Turkey: Their levels, temporal changes, interactions, and sources. Environ. Forensics 2019, 20, 182–195. [Google Scholar] [CrossRef]
- Pan, S.T. Dynamic responses of carbon emissions to central environmental protection inspection in China. Empir. Econ. 2025, 69, 661–713. [Google Scholar] [CrossRef]
- Gajdzik, B. Polish crude steel production in pandemic year of 2020 compared to previous five years. Metalurgija 2022, 61, 137–140. [Google Scholar]
- Tu, G.P.; Zan, Z. The green paradox of new energy vehicles: A system dynamics analysis. Sustainability 2025, 17, 3938. [Google Scholar] [CrossRef]
- Ram, M.; Gulagi, A.; Aghahosseini, A.; Bogdanov, D.; Breyer, C. Energy transition in megacities towards 100% renewable energy: A case for Delhi. Renew. Energy 2022, 195, 578–589. [Google Scholar] [CrossRef]
- Fu, G.T.; Tu, R.F.; Qiu, R.; Wan, X.W.; Su, Y.W.; Zhang, F.L.; Peng, Y.; Ni, W.L.; Liang, Y.T. Energy, economic and environmental impact analysis of adjusting oil refinery capacity: An interregional optimization approach for resource allocation. Energy 2025, 320, 135275. [Google Scholar] [CrossRef]
- Juchneski, N.C.D.; Antunes, A.M.D. Do the main developers of electrical and electronic equipment comply with the precepts of the circular economy concepts? A patent-based approach. Sustainability 2022, 14, 8467. [Google Scholar] [CrossRef]
- Armstrong, K.; Dong, W.Q.; Jin, M.Z.; Nimbalkar, S.; Cresko, J. Estimating energy consumption and GHG emissions in the U.S. food supply chain for net-zero. npj Sci. Food 2025, 9, 19. [Google Scholar] [CrossRef]
- Xu, S.Q.; Huang, J.Q.; Zheng, K.C. Create or squeeze out? The effect of environmental protection tax on labor demand and labor demand transfer: Evidence from China. Clean Technol. Environ. Policy 2025, 27, 3825–3840. [Google Scholar] [CrossRef]
- Phan, T.C. Energy prices volatility, natural resource policy-making and green economic recovery in post COVID-19 era: Evidence from BRICS countries. Resour. Policy 2023, 87, 104255. [Google Scholar] [CrossRef]
- Alava, J.J.; Singh, G.G. Changing air pollution and CO2 emissions during the COVID-19 pandemic: Lesson learned and future equity concerns of post-COVID recovery. Environ. Sci. Policy 2022, 130, 1–8. [Google Scholar] [CrossRef]
- Bal-Domańska, B.; Stańczyk, E.; Szewczyk, M. Empirical evidence on pro-environmental activities of companies in times of energy transformation: A case study of Poland. Energies 2025, 18, 2703. [Google Scholar] [CrossRef]
- Hu, Z.B.; Wu, G.D.; Wang, T.; Yuan, H.X. Convergence of sustainable development goals evolution and Five-Year Plans reform: Lessons from China. Socio-Econ. Plan. Sci. 2025, 98, 102156. [Google Scholar] [CrossRef]
- Lala, M.A.; Vincent, A.L.; Adesina, O.A.; Popoola, L.T.; Odejobi, O.J.; Sonibare, J.A. Particulate matter exposure in major manufacturing industrial zones of Nigeria: Non-carcinogenic human health risk assessments, spatiotemporal analysis and dispersion modeling. Case Stud. Chem. Environ. Eng. 2025, 11, 101151. [Google Scholar] [CrossRef]
- Beltrami, D.; Iora, P.; Tribioli, L.; Uberti, S. Electrification of compact off-highway vehicles—Overview of the current state of the art and trends. Energies 2021, 14, 5565. [Google Scholar] [CrossRef]
- Jiang, P.; Zhang, H.W.; Li, M.Y.; Zhang, Y.H.; Gong, X.J.; He, D.; Liu, L. Research on the structural optimization of the clean energy industry in the context of dual carbon strategy—A case study of Sichuan Province, China. Sustainability 2023, 15, 2993. [Google Scholar] [CrossRef]
- Li, Q.C.; Zhang, P. Study of the safety-economy-environmental protection coordination of Beijing’s natural gas industry based on a coupling coordination degree model. Sustainability 2025, 17, 2686. [Google Scholar] [CrossRef]
- Top, Y. Waste generation and utilisation in micro-sized furniture-manufacturing enterprises in Turkey. Waste Manag. 2015, 35, 3–11. [Google Scholar] [CrossRef]
Disclaimer/Publisher’s Note: The statements, opinions and data contained in all publications are solely those of the individual author(s) and contributor(s) and not of MDPI and/or the editor(s). MDPI and/or the editor(s) disclaim responsibility for any injury to people or property resulting from any ideas, methods, instructions or products referred to in the content. |
© 2025 by the authors. Licensee MDPI, Basel, Switzerland. This article is an open access article distributed under the terms and conditions of the Creative Commons Attribution (CC BY) license (https://creativecommons.org/licenses/by/4.0/).