Abstract
Across ten months of monitoring (1 October 2024–1 July 2025) at three drilled irrigation wells in the La Yarada Los Palos coastal aquifer, this study evaluates boron phytotoxicity risk and its interaction with salinity and sodicity in a hyper-arid coastal agroecosystem. Groundwater samples (n = 10 per well; n = 30) were analyzed for boron, major cations (Ca2+, Mg2+, Na+, K+) and EC. Salinity–sodicity indices (EC-based classes, SAR, Kelly Index, %Na, Mg/Ca ratio) were computed, and relationships among boron, cations, and EC/TDS were examined using correlation analysis and principal components. Boron concentrations ranged from 1.18 to 2.47 mg/L; all samples exceeded the FAO guideline for sensitive crops (0.7 mg/L), and 56.7% were ≥1.5 mg/L. Southern Border exhibited the highest boron (mean ≈ 2.10 mg/L), Ashlands intermediate (≈1.65 mg/L), and Bio Garden Los Palos the lowest (≈1.35 mg/L). EC remained ≈1–1.5 dS/m at Southern Border and Bio Garden Los Palos but reached ≈3–4 dS/m at Ashlands; all SAR values were <9, indicating low sodicity risk. Spearman correlations revealed weak associations between boron and EC/TDS, but moderate positive correlations with Ca2+ and Mg2+, highlighting partly decoupled controls on boron and salinity. For tolerant crops such as olive and orange, and more sensitive ones such as oregano and quinoa, these conditions imply risks that require combined management of salinity, boron, and cation balance. A risk-based monitoring scheme centered on EC, SAR, boron, and Ca–Mg–Na ratios is proposed to support irrigation decisions in La Yarada Los Palos and similar hyper-arid coastal agroecosystems.
1. Introduction
1.1. Context and Background
Arid coastal agriculture relies on groundwater, whose aquifers buffer rainfall variability, sustain irrigation, and have enabled the spread of irrigated farming across dry plains [1]. Dependence is rising as climate change heightens evaporative demand and drought frequency, increasing stress on aquifers [2]. In coastal zones, prolonged over-pumping can reverse hydraulic gradients and induce seawater intrusion, degrading water and soil and ultimately reducing yields [3,4]. Hence, irrigation must be managed in step with aquifer conservation for long-term sustainability.
In this context, groundwater quality sets the ceiling for productivity, as salinity drives osmotic stress, sodicity disperses clays and restricts infiltration, and ions such as boron, chloride, and bicarbonate can cause phytotoxicity or permeability issues—risks that require systematic monitoring and clear decision rules [5]. Persistent use of poor-quality water accelerates salinization and sodification, undermining fertility and crop uptake [6]. Best practice combines controlled leaching, amendments, drainage, and routine testing (EC, SAR, pH, key ions) under recognized guidelines [7]. In hyper-arid agroecosystems such as the coastal plains of southern Peru, where irrigation water is extremely scarce and relies heavily on stressed aquifers, proactive water-quality management becomes essential to sustain agricultural production and to build resilience to climate-related pressures on water resources [2].
Boron’s narrow essential-toxic window means even modest excess can trigger tip chlorosis and necrosis, depress photosynthesis, and induce oxidative stress, with yield losses documented across many crops [8,9,10]. Sensitivity to boron varies widely among species and genotypes; citrus, cereals and horticultural crops show contrasting responses, with tolerant lines maintaining growth where sensitive ones already exhibit foliar symptoms [11,12,13,14]. This variability underlines the need to define local thresholds and to select tolerant cultivars in arid regions.
Sodicity, characterized by a high proportion of exchangeable sodium, promotes clay dispersion and/or swelling, aggregate breakdown, and the formation of surface crusts, which reduces effective porosity and soil hydraulic conductivity [15]. These processes degrade soil structure and infiltration, causing marked declines in saturated hydraulic conductivity () under irrigation with waters with high SAR and low salinity, with different effects depending on clay mineralogy and on the temporal pattern of water quality [15,16]. Experiments and field studies show that declines in k8 can display hysteresis—partly irreversible degradation as salinity and sodicity fluctuate—especially in fine-textured soils [16]. Reviews agree that their interplay fixes the flocculation–dispersion threshold and thus controls aggregate stability and infiltration, both fundamental to productivity and long-term sustainability [15,17,18].
Cation balance is pivotal: when Na+ exceeds Ca2+ and Mg2+, clays disperse and infiltration and hydraulic conductivity fall [19], whereas Ca2+ and Mg2+ promote flocculation [15]. K+, though less abundant, behaves monovalently like Na+ and can foster dispersion, motivating indices such as the cation ratio of structural stability that integrate Na+, Ca2+, Mg2+, and K+ [16]. Carbonate/bicarbonate alkalinity can precipitate Ca2+ and Mg2+, increasing “active” sodium and tightening surface sealing even at moderate total Na+ [17]. Accordingly, routine tracking and management of these cations remain central to soil quality and productivity [20].
Globally, boron availability and soil physical integrity are co-controlled by boron, sodicity, and major cations; when Na+ outweighs Ca2+ and Mg2+ (high SAR), dispersion and reduced infiltration can magnify boron’s effects under saline conditions [19]. Calcium can partly blunt boron phytotoxicity—stabilizing cell walls and favoring flocculation—which lowers foliar B in sensitive species [9]. The opposite also occurs: salinity and sodicity tend to intensify boron injury; with saline water, Na+ uptake rises and physiological damage deepens, reducing growth and yield in several crops [21]. Recent syntheses concur that the relative proportions of Na+, Ca2+, and Mg2+—together with salinity and pH—govern boron mobility and phytoavailability while setting the flocculation/dispersion limits that define structural stability [8]. Hence, current guidance recommends monitoring boron alongside SAR and EC, adding Ca2+ sources when needed, and managing leaching to sustain productivity and soil function in arid and semiarid systems [22].
1.2. Regional Context (Tacna, Peru)
Arid coastal farming in La Yarada Los Palos mainly comprises perennial crops—above all olives, the department’s dominant crop and a pillar of the regional agro-industry [23]. Recently, the farming of oranges, onions, and oregano has expanded through producer organizations, widening supply for domestic and export markets [24]. National agencies note that most of Tacna’s olive groves lie in this district [25]. All of this relies on the La Yarada coastal aquifer; a century of pumping has enabled growth but also brought overextraction and seawater intrusion, which now threaten long-term economic viability [26].
The Caplina Basin in the far south of Peru exhibits a pronounced Andean–coastal gradient with a very arid climate along the coast, where rainfall is scarce and potential evaporation is high, constraining surface water availability [27]. In this context, the supply for irrigation and productive uses depends largely on the La Yarada coastal aquifer, whose hydrogeological condition shows a sustained decline in groundwater levels due to overexploitation, along with seawater intrusion processes in areas near the coastline [28]. Local hydrogeological studies corroborate the degradation of groundwater quality in the Middle La Yarada area and describe the aquifer structure hosted in alluvial and volcano-sedimentary deposits, together with its vulnerability to salinization under intensive pumping [29]. The regional geochemistry of the Caplina Basin is influenced by hydrothermal inputs such as Aruma, which naturally increase certain dissolved ions, modulating the quality of the resource that ultimately recharges the groundwater system and the lower reaches of the river [30].
Recurrent salinity issues and declines in piezometric levels associated with overexploitation have been documented in the Caplina Basin and the La Yarada coastal aquifer, with coastal sectors affected by seawater intrusion that increases the electrical conductivity and dissolved solids of the groundwater [28]. Local hydrogeological studies also report a water quality degradation in Middle La Yarada and spikes in sodicity indicators such as elevated SAR and Na+ in heavily pumped areas, implying a risk of soil structural degradation and reduced infiltration if these waters are used for irrigation without amendments [29]. Geochemical evidence shows dissolved ions from natural and anthropogenic sources; in places, boron rises to levels that threaten sensitive crops unless irrigation quality is controlled [30]. Regional reports tie irrigation expansion to the need for stricter water quality management to prevent yield losses and soil degradation [25,31]. Current guidance calls for the routine tracking of EC, SAR, Na+, Ca2+, Mg2+, and B, along with corrective steps—leaching, Ca2+ inputs (gypsum), and crop selection—when thresholds are exceeded [5].
In La Yarada and the wider Caplina Basin, studies describe lithology, hydraulics, and spatial water quality variability [30]. Overextraction has lowered groundwater levels, and seawater intrusion in coastal sectors elevates EC and TDS [28]. Further work has mapped localized deterioration—high sodium and facies shifts—linked to mineralogy, residence time, and pumping [29]. Multivariate and tracer studies indicate geologic/evaporitic controls combined with human pressures (pumping, irrigation expansion) as the main drivers of salinization and chemical heterogeneity, reinforcing the need for continuous monitoring and management actions [32].
1.3. Existing Technologies, Knowledge Gap, and Study Objectives
Irrigation water quality is managed through laboratory analyses plus routine EC checks, ion balance for Na+/Ca2+/Mg2+/K+, SAR and RSC, and boron and Cl− determinations, all under standardized sampling to ensure traceability and comparability [5]. In the field, portable pH/EC/TDS/temperature meters enable quick screening and trigger laboratory sampling when issues arise [33]. More recently, WSN/IoT systems stream real-time EC, temperature, water level, and turbidity to cloud tools for early warnings [34]. Complementarily, remote sensing and mapping techniques using satellite and UAV platforms together with machine learning models are increasingly employed to spatially estimate surface salinization and to support the prioritization of sampling and management measures at the basin scale [35]. Finally, integrated indices and indicators such as irrigation water quality indices and adapted WQIs, together with management guidance (e.g., leaching, calcium/gypsum amendments, source blending), serve to translate analytical results into corrective irrigation decisions, all underpinned by documented sampling and quality control protocols issued by extension services and technical agencies [36].
To mitigate sodicity and excess boron in irrigation water and soils, a combination of calcium amendments, water management, and water treatment measures is employed. In sodic soils, the supply of calcium via agricultural gypsum displaces Na+ from the exchange complex, promotes clay flocculation, and improves infiltration, although its effectiveness depends on adequate leaching and, where applicable, the presence of drainage [37]. Current guidance prioritizes diagnosing salinity/sodicity (SAR/ESP), computing leaching needs, and tuning irrigation and ground cover to rebuild structure; fog-sea salts or gypsum are standard treatments with application rates derived from soil data and SAR/ESP [38]. For boron, pH-controlled reverse osmosis can achieve ~99% rejection at farm scale [39], and N-methylglucamine resins are effective for desalinated or geothermal waters [40]. In crops, silicon helps curb boron toxicity and, together with organic matter or biochar, improves structure and the efficiency of leaching in sodic soils [41].
In La Yarada–Caplina, reliance on episodic sampling and limited networks hampers the early detection of seawater intrusion and salinity surges [28]. Specific studies exist, but they underscore the need to strengthen hydrochemical and piezometric monitoring for preventive action. In 2023, the National Water Authority approved a comprehensive hydrogeological study of the Caplina aquifer system that specifically identifies information and operational control gaps, as well as the absence of regulatory instruments and infrastructure to regulate withdrawals and restore groundwater levels [42]. In parallel, the updated Water Resources Management Plan for the Caplina–Locumba Basin sets out projects and investments to improve irrigation efficiency, water treatment, and aquifer management, underscoring delays in the basin-wide implementation of control and treatment technologies [43]. At the regional level, the aquifer-specific operational plan proposes measures such as a hydraulic barrier, the closure of wells along the coastal strip, and a pilot desalination plant. These actions are still being implemented and reflect the current limitations of locally used practices to contain salinization and sodicity [43].
On Peru’s arid coast, there are notable gaps in understanding the interactions among boron, sodicity, and the major cations. Although the processes of seawater intrusion and salinization in the La Yarada aquifer have been characterized, the combined effect of boron and sodicity parameters (SAR, Na+/Ca2+/Mg2+) on boron availability to regional crops has not been systematically evaluated [32]. There are also no continuous monitoring protocols that capture both the seasonality of boron and the evolution of ionic indicators at the plot or district scale [28]. With respect to physiological effects, the literature emphasizes the narrow margin between boron’s essentiality and toxicity in the form of boric acid, underscoring the need to develop specific thresholds under the high-sodicity conditions prevailing in the region [8]. The conceptual frameworks explaining how Na+, Ca2+, Mg2+, and K+ influence soil structural stability are relevant, but their validation in coastal settings with excess boron in Peru remains limited [19]. Finally, although international guidelines provide indicators and management measures, their suitability to the edaphoclimatic conditions of the southern Peruvian coast is insufficiently documented, hindering the implementation of evidence-based decisions tailored to local conditions [5].
1.4. Background on the Comprehensive Assessment of Irrigation Water Quality
International frameworks for assessing irrigation water suitability combine criteria based on physicochemical parameters (EC, pH, Na+, Ca2+, Mg2+, K+, Cl−, HCO3−) with indices designed to predict specific risks: salinity is evaluated using electrical conductivity (EC) and crop tolerance tables; sodicity is assessed via SAR/ESP and derived parameters (e.g., RSC); and soil structural stability is addressed with more recent indices such as CROSS (cation ratio of soil structural stability). These tools enable water classification and the definition of management measures [5]. Boron phytotoxicity is analyzed using agronomic thresholds (crop-specific tolerance tables) and direct analyses of B in water and soil (spectrometry or ion chromatography, IC), complemented by dose–response assays when thresholds must be tailored to local crops [9]. Contemporary guidelines (Food and Agriculture Organization of the United Nations and the International Water Management Institute (FAO/IWMI); national guidelines such as the Australian ones) recommend jointly evaluating EC, SAR, and B concentration, and applying decision support tools that integrate water quality, soil type, crop, and irrigation method to estimate leaching requirements and calcium amendments [22]. At the methodological level, the use of composite and customized indices (e.g., CIWQI and other multivariate indices) is encouraged, along with the integration of field sensors, IoT networks, and remote sensing for spatial and temporal monitoring, thereby improving the prioritization of sampling and management decisions in coastal basins [20]. Finally, recent literature underscores that combining indicators (EC + SAR + B) and incorporating ionic ratios (Na+:Ca2+:Mg2+) or structural indices such as CROSS yields a more robust assessment of irrigation water suitability than the isolated use of any single parameter [19].
In arid coastal regions, the concurrence of aquifer salinization, high electrical conductivity/TDS, and geogenic boron enrichment is consistently documented—factors that reduce the suitability of water for irrigation and threaten soil sustainability. Reviews of Mediterranean coastal zones underscore that salinization driven by overexploitation and climate change are the principal causes of coastal aquifer degradation [44]. Case studies in Morocco’s coastal basins show an interplay of seawater intrusion, evaporation, and geological processes that increase EC and TDS in groundwater used for irrigation [45]. Research in northern Chile (the Arica–Parinacota region) has found that high concentrations of boron and other elements, along with elevated electrical conductivity (EC) values, frequently exceed irrigation and drinking water guidelines, and that the spatial distribution is governed by geothermal controls and basin-scale evaporation [46]. In the Tarapacá Region, groundwater often combines high boron with elevated Na+, Ca2+, and Mg2+, complicating treatment, management, and farming [47].
Where boron co-occurs with saline/sodic conditions (“BorSal”), nutrient availability and plant function are altered; growth and yield typically decline, though in some species low boron doses partly offset salt stress—highlighting species- and site-dependence [48,49]. At the soil level, sodicity—characterized by an excess of Na+ relative to Ca2+ and Mg2+—degrades soil structure, reduces infiltration, and promotes the accumulation of soluble salts (including B) in the rhizosphere, thereby increasing the likelihood of phytotoxicity in sensitive crops. Consequently, irrigation and amendment management studies show that controlling the cation balance and enhancing cation exchange (e.g., Ca2+ inputs, gypsum amendments, and drainage) are crucial in reducing both sodicity and the mobility and toxicity of boron [6]. Research on coastal aquifers and arid regions such as La Yarada reports the co-occurrence of elevated conductivity, high Na+, and intermediate-to-high boron concentrations in groundwater used for irrigation, underscoring the need for integrated assessment (B, Na+, Ca2+, Mg2+, and salinity parameters) to plan agronomic and water resource management measures in these regions [32].
1.5. Study Hypothesis and Objectives
This study starts from the working hypothesis that, in the La Yarada Los Palos coastal agroecosystem, irrigation groundwater often combines elevated boron with salinity levels and cation compositions that can constrain irrigation water quality for the predominant crops. Accordingly, our objectives are to (i) build a ten-month monitoring series of boron, major cations, electrical conductivity (EC), and total dissolved solids (TDS) at three representative irrigation wells; (ii) derive and analyze key salinity- and sodicity-related indices (EC-based salinity classes, sodium adsorption ratio—SAR, Kelly Index, sodium percentage—%Na, and Mg/Ca ratio) together with correlation patterns and principal components among boron, major cations, EC, and TDS; and (iii) interpret these ranges in terms of boron phytotoxicity and sodicity risk for locally important crops such as olive, orange, oregano, and quinoa under hyper-arid conditions. Within this scope, the specific novelty of the study lies in providing an integrated evaluation of boron, salinity, and sodicity metrics in a stressed coastal aquifer of southern Peru and in organizing them into a risk-oriented interpretive scheme to guide irrigation management and groundwater monitoring in La Yarada Los Palos.
2. Materials and Methods
2.1. Study Area Description: Location, Climate, Geology, Land Use, and Groundwater Sources
The study area, located in the coastal zone of the La Yarada Los Palos District, is characterized by a hyper-arid climate with very low precipitation and the frequent occurrence of coastal fog—factors that limit the natural recharge of the aquifer [50]. Geologically, it overlies Quaternary alluvial and volcano–sedimentary deposits that constitute the Caplina–La Yarada coastal aquifer, which is intensively exploited through tubular, mixed, and open-cut wells, with depths ranging from 11 to 135 m and estimated yields of 2–85 L/s, used extensively for the irrigation of perennial crops such as olive, onion, and pepper [51]. Land use shows a marked expansion, with agricultural area increasing by 266% between 2000 and 2020, driven by the availability of groundwater and irrigation systems, which has enabled the diversification of crops toward vegetables and citrus [31]. Simultaneously, GIS and other methodologies such as GOD, DRASTIC, and GALDIT have been applied to map the vulnerability of local aquifers to contamination (boron, nitrates, salinization), identifying critical hotspots for the protection of water resources [52]. Quaternary alluvial–fluvial, multilayer porous aquifer recharged mainly by Andean runoff; structurally guided, coastward flow; discharge dominated by pumping, with seawater intrusion under over-extraction.
Within this coastal setting, the La Yarada Los Palos district and the three monitored irrigation wells are located on the intensively irrigated coastal plain (Figure 1). The UTM coordinates and elevation of each sampling point are summarized in Table 1.
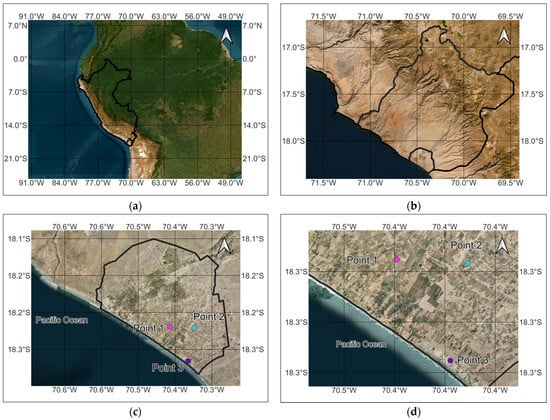
Figure 1.
Location of the study area and sampling wells in the hyper-arid La Yarada Los Palos coastal agroecosystem, Caplina Basin, southern Peru. (a) Peru within South America. (b) Tacna region and the coastal sector of the Caplina Basin. (c) La Yarada Los Palos district on the Pacific coast, showing the irrigated area and the three monitored irrigation wells. (d) Close-up of the monitored wells (Points 1–3), which correspond to the Southern Border, Bio Garden Los Palos, and Ashlands settings described in the text.

Table 1.
Coordinates and elevation of sampling points.
2.2. Sampling Strategy and In Situ Parameters
We monitored three representative sites (Ashlands, Southern Border, Bio Garden Los Palos), chosen for their relevant agroclimate and the density of the district’s principal crops—olive, orange, oregano, and quinoa [53]. Adherence to the National Water Authority’s monitoring protocol ensured representative, reliable data [54]. Monthly campaigns ran from 1 October 2024, to 1 July 2025.
During those monthly campaigns (1 October 2024–1 July 2025), we collected samples and recorded in situ physicochemical parameters with a portable multiparameter meter (Hanna HI 98194; Hanna Instruments, Nușfalău, Romania), recognized for accuracy and robustness under field conditions [55]. Measurements included pH, which indicates acidity/alkalinity and modulates carbonate equilibria and the activity/precipitation of Ca2+ and Mg2+; temperature, which affects the solubility of chemical compounds and redox processes and is relevant to treatment efficiency; and electrical conductivity (EC) and total dissolved solids (TDS), which reflect ion concentrations, salinity, and overall water quality [56]. All three sampling sites correspond to drilled irrigation wells used for irrigation. Groundwater samples were collected at the wellhead from pumped water after purging the wells until pH and EC stabilized, so that the sampled water column is representative of the screened interval.
Sampling was conducted directly at the wellhead after purging until field parameters stabilized (±0.02 pH units; ±2% EC/TDS; steady ORP) to obtain formation-representative groundwater. No open reservoirs were sampled. This approach minimizes atmospheric artifacts (CO2 degassing, re-oxygenation, evaporation) and preserves in-situ hydrochemistry for risk assessment.
Across the ten monthly campaigns (1 October 2024–1 July 2025), each well was sampled once per visit, yielding n = 10 samples per site and n = 30 groundwater samples in total. The three monitoring wells are located on the flat, intensively irrigated coastal plain described in Section 2.1, under similar land use (olive–citrus orchards and vegetable fields) and comparable irrigation practices. Because samples were collected from pumped well water after purging until pH and EC stabilized, short-range differences in vegetation cover or microtopography around the wellhead do not affect the sampled water column; temporal variability is thus interpreted as reflecting aquifer conditions and pumping regimes. The tables reporting monthly groundwater chemistry list all sampling dates and their corresponding analytical results, providing a month-resolved time series for each site.
2.3. Laboratory Analytical Methods (ICP-MS)
Laboratory analyses were performed using inductively coupled plasma mass spectrometry (ICP-MS), a highly sensitive and precise technique for the simultaneous detection of multiple elements, including agricultural cations and potentially phytotoxic boron in aqueous matrices. In this method, the liquid sample is introduced into a nebulizer, ionized in a high-temperature argon plasma, and the ions are separated by mass-to-charge ratio in a mass spectrometer, achieving detection limits in the parts-per-billion (ppb) range or lower (limit of detection ≤ µg/L) [57]. ICP-MS serves as the reference method in environmental and hydrogeochemical work due to its multi-element throughput, high resolution, and robustness against interferences—especially under U.S. EPA Method 200.8 with standard QA/QC: blanks, duplicates, and continuing calibration verification, broadly adopted for monitoring groundwater, surface water, and drinking water [58].
We quantified boron and Na+/Ca2+/Mg2+/K+ with an Agilent 7900 ICP-MS (Agilent Technologies, Tokyo, Japan), targeting parameters that govern irrigation water quality, crop performance, and soil stability; the SAR was then calculated to index sodicity risk as the balance of Na+ relative to Ca2+ and Mg2+ [59].
2.4. Data Analysis
2.4.1. Kelly Index (KI), %Na, Mg/Ca, EC/TDS
- -
- KI ≤ 1: Water suitable for irrigation—the divalent cations (Ca2+ and Mg2+) counteract sodium, preventing degradation of soil structure.
- -
- KI > 1: Water with excessive sodium levels—high sodicity potential that can adversely affect soil permeability and fertility.
Rationale for its use in this study:
- -
- We used KI because sodium-rich groundwater is common in the study region; KI quantifies Na+ versus Ca2++Mg2+, complements SAR/adjusted SAR on aggregation and infiltration, is trivial to compute from routine cation data, and pinpoints sodicity hotspots where sodium accumulation and boron phytotoxicity endanger yields.
2.4.2. Sodium Percentage (%Na)
- -
- Na+: total sodium (meq/L);
- -
- Ca2+: total calcium (meq/L);
- -
- Mg2+: total magnesium (meq/L);
- -
- K+: total potassium (meq/L).
Interpretation:
- -
- %Na < 60: generally suitable, low dispersion risk. %Na ≥ 60: high sodicity risk with likely infiltration decline, salinization, and reduced permeability.
Use in the present study:
- -
- In La Yarada Los Palos, sodium- and boron-rich groundwater heightens phytotoxicity and soil degradation; %Na flags Na+ imbalance versus Ca2+/Mg2+, complements SAR and KI, is simple and widely used, and is critical for managing heavily stressed, groundwater-dependent agriculture.
2.4.3. Mg/Ca Ratio
The molar Mg/Ca ratio is calculated as
where concentrations are expressed in molarity or equivalent units (meq·L−1).
Elements:
- -
- Mg2+ increases hardness and affects soil structure; its flocculation is weaker than Ca2+, and excess versus Ca2+ can reduce aggregate stability;
- -
- Ca2+ (calcium): a divalent cation essential for the stability of soil colloids; it helps prevent clay dispersion and facilitates infiltration.
Rationale for use in this study:
- -
- In arid coastal zones such as La Yarada Los Palos, an elevated Mg/Ca ratio (ratio > 1) may indicate seawater intrusion or a specific geologic composition that favors higher magnesium conditions associated with a risk of surface sealing and reduced infiltration;
- -
- Mg/Ca also helps identify mixing between marine and fresh waters or the upwelling of deeper waters, complementing other indicators such as Cl/Br and Na/Cl in seawater intrusion studies;
- -
- This ratio helps disentangle functional differences between magnesium and calcium in the ionic dynamics of irrigation water, given that calcium has a greater flocculating capacity than magnesium and therefore a greater impact on soil structure.
2.4.4. Electrical Conductivity and Total Dissolved Solids
Electrical conductivity (EC) and total dissolved solids (TDS) do not constitute a single, widely standardized formula per se in irrigation water studies; rather, they can be understood as measures of the overall osmotic effect of dissolved salts. This measure is grounded in one of the most widely used parameters: electrical conductivity (EC), which is a simplified expression of the total dissolved salt content in water [61,62].
Electrical conductivity (EC) and TDS are commonly defined as representations of the water’s total salinity, serving as a direct or indirect measure of the concentration of dissolved salts.
In practice, electrical conductivity (EC, in dS/m) is the most commonly used indicator for assessing salinity, due to its direct relationship with the total concentration of dissolved inorganic salts [61,62].
When an estimate in mass units is needed, EC can be converted to total dissolved solids (TDS, mg/L or ppm) using standard factors: ≈EC × 640 for EC < 5 dS/m, and ≈EC × 800 at higher EC values [62].
EC provides a rapid and reliable proxy for total salt content and thus for osmotic risk to plants. In arid settings such as La Yarada Los Palos, dissolved salts raise the soil solution’s osmotic potential, hindering water uptake and depressing productivity; EC captures these effects consistently [63,64]. On this basis, irrigation water can be classified by salinity: low risk, EC < 0.7 dS/m (TDS < 450 mg/L); moderate, EC 0.7–3 dS/m (TDS 450–2000 mg/L); high, EC > 3 dS/m (TDS > 2000 mg/L). These ranges reflect likely impacts on crop performance and soil salinization.
2.5. International Criteria for Evaluating Boron Phytotoxicity and Sodicity
International criteria frame irrigation water risks from boron and sodicity. FAO guidance flags B > 0.7 mg/L as toxic for sensitive crops and >3 mg/L as risky even for tolerant species. Sodicity is gauged with SAR; values > 9 increase clay dispersion and reduce infiltration, harming productivity [65]. The Ayers and Westcot thresholds, primarily based on electrical conductivity (EC) and sodium adsorption ratio (SAR) to assess salinity and sodicity risks to crops and soil structure, are widely adopted benchmarks grounded in extensive field and experimental evidence and inform many regulations [59].
Field risk also depends on soil texture/structure, electrolyte concentration (EC), the Ca–Mg balance, and the effective leaching fraction, so identical B or SAR values can lead to different outcomes across sites. The dispersion hazard associated with a given SAR generally decreases as EC increases, which motivates the use of EC-adjusted sodicity metrics (e.g., adjusted SAR), complementary indices (%Na, residual sodium carbonate), and integrated salinity–infiltration diagrams (U.S. Salinity Laboratory (USSL)/Wilcox, Riverside, CA, USA) rather than single cut-offs. Likewise, crop sensitivity to B varies with phenological stage and evaporative concentration, so risk appraisal should couple B, EC/TDS, and cation ratios with local crop calendars and irrigation scheduling, instead of relying on nominal thresholds alone.
2.6. Correlation Analysis
We computed descriptive statistics and Spearman’s rank correlations (ρ) among boron, major cations, EC, and TDS, followed by PCA to identify dominant gradients [66]. We then applied principal component analysis (PCA) to reduce dimensionality and identify dominant drivers—chiefly salinity and broader water quality gradients—that explain the most variance, a standard approach used for coastal aquifers [67]. Finally, we visualized the distributions of SAR and %Na to delineate higher-risk conditions and support water management decisions; no spatial interpolation was performed given the low density of sampling points (n = 3) [32].
3. Results
3.1. Overall B Concentrations, FAO Thresholds, and In Situ Field Parameters
Boron concentrations across the ten-month series (1 October 2024–1 July 2025) remained above the FAO sensitive crop threshold (0.7 mg/L) in 100% of samples, with 56.7% ≥ 1.5 mg/L and none ≥ 3 mg/L. Site means were ≈2.11 mg/L at Southern Border, ≈1.65 mg/L at Ashlands, and ≈1.35 mg/L at Bio Garden Los Palos.
In total, 30 samples were analyzed between October 2024 and July 2025. The results for each evaluated aspect are presented below (Table 2, Table 3 and Table 4).
Table 2.
Samples from Southern Border (October 2024–July 2025).
Table 3.
Samples from Bio Garden Los Palos (October 2024–July 2025).
Table 4.
Samples from Ashlands (October 2024–July 2025).
Southern Border exhibits the highest boron values (mean ≈ 2.10 mg/L), ranging from 1.89 to 2.47 mg/L. Calcium is also high (≈140 mg/L), whereas sodium and potassium are moderate compared with other zones (Table 5).
Table 5.
Mean concentrations of boron and major cations at the sampling sites.
Ashlands is the site with the highest cation concentrations—sodium (≈262 mg/L), calcium (≈302 mg/L), magnesium (≈43 mg/L), and potassium (≈21 mg/L). Boron remains at intermediate levels (≈1.65 mg/L).
Bio Garden Los Palos had the lowest concentrations for nearly all parameters: boron (≈1.35 mg/L), sodium (≈78 mg/L), calcium (≈103 mg/L), magnesium (≈20 mg/L), and potassium (≈14 mg/L).
The spatial analysis of boron and major cation concentrations revealed clear differences among the sampling points. At Southern Border, boron was the highest in the network (mean ≈ 2.10 mg/L), nearing phytotoxicity thresholds for moderately tolerant crops; calcium was also relatively elevated (≈140 mg/L). Ashlands showed the greatest cation load—especially sodium (≈262 mg/L) and calcium (≈302 mg/L)—pointing to stronger salinity and sodicity pressures for irrigation and soils. Bio Garden Los Palos had the lowest values for nearly all parameters, notably boron (≈1.35 mg/L) and sodium (≈78 mg/L), indicating comparatively favorable hydrochemical conditions for farming. Overall, Ashlands exhibits a concentrated ionic load and thus salinity/sodicity risk, while Southern Border stands out for high boron and potential phytotoxicity in sensitive crops.
In situ field parameters measured at the wellhead provide additional context for interpreting boron patterns and overall groundwater chemistry. Electrical conductivity at Southern Border ranged from 1.01 to 1.47 dS/m and at Bio Garden Los Palos from 0.95 to 1.33 dS/m, whereas Ashlands showed consistently higher values between 2.97 and 3.97 dS/m, in line with the higher TDS values at this site (≈1440–2000 mg/L). Temperatures were moderate at Southern Border and Bio Garden Los Palos (≈18–26 °C) and reached up to about 35 °C at Ashlands. Across the three wells, pH spanned from slightly acidic to moderately alkaline (≈5.9–9.3). The full set of in situ measurements (EC, temperature, pH, and TDS) for each sampling date is illustrated in Figure 2.
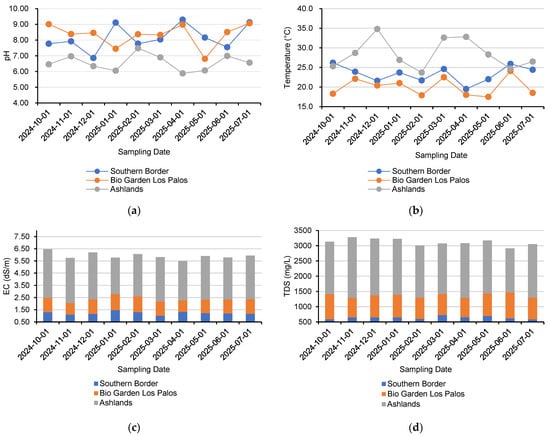
Figure 2.
In situ field parameters measured at the three monitored irrigation wells in La Yarada Los Palos from October 2024 to July 2025: (a) pH, (b) temperature (°C), (c) electrical conductivity, EC (dS/m), and (d) total dissolved solids, TDS (mg/L). The three wells correspond to Southern Border, Bio Garden Los Palos, and Ashlands.
3.2. Sodium Adsorption Ratio and Electrical Conductivity in the Study Area
Electrical conductivity (EC) and the sodium adsorption ratio (SAR) varied across sampling points (Table 6). At Southern Border, EC ranged from 1012 to 1467 µS/cm (≈1.01–1.47 dS/m), a moderate salinity range, while SAR stayed low, indicating minimal sodicity risk. At Bio Garden Los Palos, EC was relatively homogeneous, 947–1325 µS/cm (≈0.95–1.33 dS/m), also moderate salinity with low SAR—conditions that are generally favorable for irrigation. In contrast, Ashlands showed the highest EC values, 2971–3968 µS/cm (≈2.97–3.97 dS/m), spanning moderate to high salinity; SAR remained low (site mean ≈ 3.75), so osmotic constraints dominate over sodicity.
Table 6.
EC and SAR values by sampling point, with salinity class, sodicity risk, and overall irrigation suitability.
To summarize the covariation between B and the major cations, we performed a principal component analysis (PCA), and the results are shown in Figure 3.
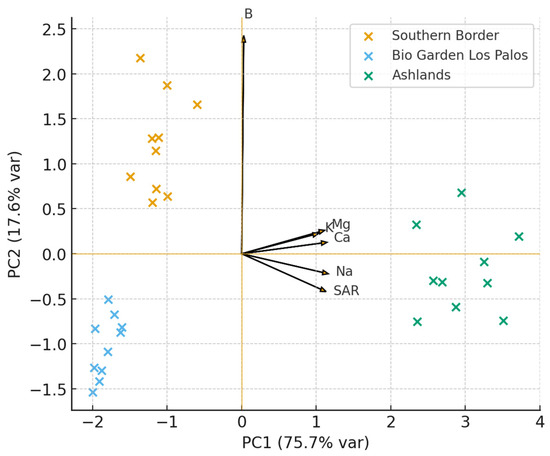
Figure 3.
PCA biplot (PC1–PC2) for B, Na+, Ca2+, Mg2+, K+, and SAR. Points = samples colored by site; arrows = variable loadings. PC1 captures bulk salinity/cation axis; PC2 reflects secondary ionic variation. PCA = principal component analysis; SAR = sodium adsorption ratio.
3.3. Correlation Structure
To accommodate possible non-normality and the modest per-site sample size, we used Spearman rank correlation (ρ) on the pooled dataset (n = 30; 1 October 2024–1 July 2025) to assess monotonic associations (Table 7). Boron correlated weakly to moderately with Ca2+ and Mg2+ (ρ ≈ 0.40 and 0.44), and weakly with K+ and Na+ (ρ ≈ 0.29 and 0.23). These patterns indicate that B exposure does not simply track the major ion salinity signal, consistent with the site contrast, whereby the highest B (Southern Border) does not coincide with the highest EC (Ashlands) (Figure 4).
Table 7.
Correlation between boron and other parameters (Spearman’s rho, n = 30).
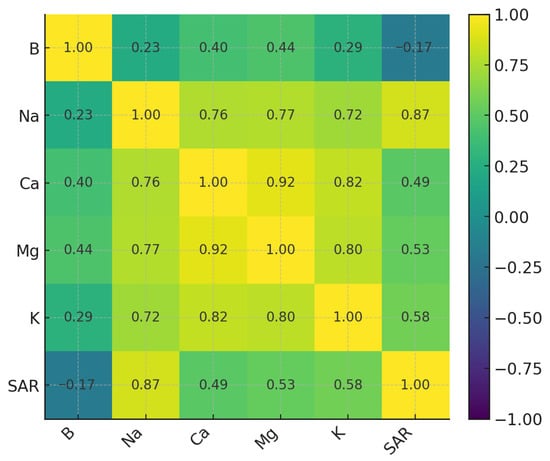
Figure 4.
Spearman correlation matrix (ρ) among B, Na+, Ca2+, Mg2+, K+, and SAR (n = 30). SAR = sodium adsorption ratio; ρ = Spearman’s correlation coefficient.
3.4. Phytotoxicity Risk Classification for Predominant Crops
The analysis of irrigation water quality at the three sampling sites revealed differential risks of boron phytotoxicity and sodicity in relation to the predominant crops in La Yarada Los Palos (olive, orange, oregano, and quinoa). Boron values ranged from 1.18 to 2.47 mg/L, in several cases exceeding the FAO thresholds of 0.75 mg/L for sensitive crops and 2.0 mg/L for moderately tolerant crops. This implies a high toxicity risk for orange and quinoa, and a moderate risk for olive and oregano at the Southern Border and Ashlands sites. Additionally, sodicity expressed by the SAR index, complemented by EC, reached values that classify the water as restricted for irrigation during some periods, since a high proportion of sodium relative to calcium and magnesium can impair soil permeability and exacerbate water stress in sensitive species. Taken together, the results suggest that groundwater in the Caplina Basin poses a significant risk of limiting agricultural productivity in the area, with more severe impacts on the most sensitive crops, underscoring the need for management strategies and ongoing monitoring tailored to each crop’s water requirements and tolerance.
Uncertainty: Field meters’ precision (±0.02 pH; ±2% EC/TDS) and laboratory QC indicate low instrumental error; the main uncertainty arises from short-term hydrochemical variability across pumping cycles. We therefore report medians and IQRs, and interpret weak correlations conservatively.
4. Discussion
4.1. Comparison with International and Regional Studies
During ten months of observation (1 October 2024–1 July 2025) at Ashlands, Southern Border, and Bio Garden Los Palos, the observed pattern—a combination of high salinity with generally low SAR and a distinct boron peak at Southern Border (mean ≈ 2.10 mg/L)—matches what previous experimental and review work has reported for arid coastal systems, where crop response hinges on the interaction among B concentration, electrical conductivity, and the cationic matrix of the water [48]. EC spanned ≈1.01–1.47 dS/m at Southern Border and ≈0.95–1.33 dS/m at Bio Garden Los Palos, versus ≈2.97–3.97 dS/m at Ashlands, while SAR remained low across sites (site means ≈ 1.75–1.85 at Southern Border and Bio Garden Los Palos, and ≈3.75 at Ashlands; all <9). Both synergism (salinity amplifying B injury) and, in specific species and ranges, partial antagonism (reduced B uptake under certain saline conditions) appear in the literature and help explain the month-to-month and site contrasts we recorded. Studies on B–nutrient interactions further indicate that Ca2+/Mg2+/Na+ ratios and pH steer B mobility and toxicity, which is consistent with the cation imbalance detected at Ashlands and the higher B exposure at Southern Border [49]. Regionally, hydrogeological investigations in La Yarada and comparable coastal basins describe mixed geogenic and anthropogenic controls that yield elevated EC, high Na+, and intermediate B—conditions that mirror our risk classification and spatial patterning [32]. Recent work on B dynamics in soils and groundwater reinforces the need to integrate B with SAR/EC and cation ratios to design site-specific measures, a principle that underlies the monitoring and management scheme we propose for La Yarada Los Palos [68].
4.2. Boron–Sodicity–Major Cation Interactions: Mechanisms and Crop Risk
The joint behavior of boron, salinity, and sodicity is central to irrigation suitability in the La Yarada Los Palos coastal agroecosystem. At Ashlands, high EC (2.97–3.97 dS/m) combined with low SAR (site mean ≈ 3.75) indicates osmotic pressure on plants with limited sodicity constraints; at Southern Border, mean B near ~2.1 mg/L raises the likelihood of phytotoxic effects in moderately tolerant crops. Mechanistically, excess Na+ displaces Ca2+ and Mg2+ on exchange sites, weakening aggregates and limiting nutrient supply, while elevated B at high EC burdens plant tissues and intensifies oxidative stress. Data show weak B–sodicity coupling, implying independent pathways; thus, use dual levers: salinity control and direct B management near thresholds.
Water–chemistry differences create crop-specific risk. Olive and orange, though moderately tolerant, become vulnerable under sustained sodium with B ≳ 1.5 mg/L, showing yield loss and older-leaf injury. Oregano and quinoa suffer under high EC and an unfavorable Na+/Ca2+ balance. Given that 56.7% of samples were ≥1.5 mg/L and none ≥3 mg/L, olive and orange—moderately tolerant—may experience gradual reduction in yields, whereas oregano and quinoa are more likely to be constrained when EC is high and the Na+/Ca2+ balance is unfavorable. Management should prioritize tolerant varieties, leaching strategies, and routine water quality tracking to sustain production.
While our dataset covers three sites over a defined season, the hydrogeochemical contrasts observed (salinity axis vs. boron behavior) are consistent with arid coastal aquifers worldwide. Thus, we frame recommendations as risk-based practices (monitoring thresholds, calcium amendments, blending/removal for B) that can be adapted as networks expand.
4.3. Possible Management and Remediation Strategies
An integrated strategy is required to address both B exposure and the cationic imbalance. Where structure and infiltration are at risk, calcium amendments (e.g., gypsum) and active management of the Ca–Mg balance help restore flocculation and hydraulic conductivity [63]. Salt leaching with appropriate fractions prevents the build-up of Na-dominant salts and limits B accumulation in the root zone, provided drainage is adequate and applications are timed to avoid evaporative concentration [64]. For supply-side control of B, farm-scale options documented in arid systems include pH-controlled reverse osmosis and N-methylglucamine ion-exchange resins; locally available zeolites provide a selective, lower-cost alternative where performance, regeneration, and logistics allow [65]. Field implementation benefits from localized irrigation (drip or pulsed) and, where feasible, blending or supplementing with treated or alternative waters to keep EC and B within crop-safe ranges; routine tracking of EC, SAR, %Na, and Ca/Mg/Na ratios then guides amendment dosing and leaching schedules [69].
A simple decision-support sequence can help farmers and local agencies translate these results into practice. First, irrigation wells can be monitored at least monthly for EC, SAR, and boron, and assigned to low-risk, intermediate-risk, and high-risk classes using the EC salinity classes and boron thresholds summarized in this study, while noting whether SAR remains safely below or approaches the sodicity threshold of 9.
Second, wells in the low-risk class can be used for a wide range of crops, with continued monitoring and simple field observations of soil salinity. Third, for intermediate conditions (intermediate EC classes and/or boron values close to the thresholds for moderately tolerant crops), management should prioritize moderately tolerant crops, schedule occasional leaching irrigations when EC rises, and, where possible, blend with higher-quality sources. Fourth, where EC falls in the highest salinity classes and/or boron clearly exceeds thresholds for most crops, emphasis should shift to the most tolerant crops, the use of gypsum or other calcium amendments to protect soil structure, more frequent leaching with adequate drainage, and supplemental low-boron water during sensitive growth stages. In all classes, pairing water-quality monitoring with periodic soil ECe/SAR measurements and simple yield records would allow risk thresholds to be refined and support early detection of trends in groundwater quality in hyper-arid settings where irrigation water is an extremely scarce and valuable resource.
4.4. Long-Term Sustainability Perspective
Because perennial systems in La Yarada Los Palos depend on a stressed coastal aquifer, agronomic gains and aquifer stewardship must advance together. Because 100% of the samples exceeded the FAO sensitive crop threshold for boron (>0.7 mg/L), long-term management should treat salinity and boron as coupled priorities, with risk-based monitoring centered on EC, SAR, B, and Ca–Mg–Na ratios. Continued use of high-B, sodium-rich waters imposes cumulative degradation in soil structure and yields; conversely, diversifying toward tolerant crops, upgrading irrigation technology [65], and institutionalizing hydrochemical monitoring can mitigate those risks over time. Add reuse of treated wastewater to cut pumping and improve water security as EC spikes and B persists [70], managing salinity and B as linked-but-distinct through risk-based monitoring.
4.5. Strengths, Limitations, and Future Research Directions
An additional limitation concerns soil processes. Although Section 1.1 and Section 1.4 summarize the conceptual links between salinity, sodicity, Na–Ca–Mg balances, soil structure, infiltration, and boron behavior, the dataset used in this study is restricted to groundwater chemistry and does not include direct measurements of soil ECe, structural degradation, or crop response. Consequently, a quantitative diagram of soil–water interactions and feedback for La Yarada Los Palos cannot yet be constructed and validated. Future work should couple groundwater monitoring with soil-profile ECe and SAR determinations, aggregate stability and infiltration tests, and crop performance indicators, so that the conceptual pathways summarized here can be translated into a calibrated, diagrammatic decision-support tool for regions facing similar salinity–sodicity and boron problems.
At the hydrogeological scale, a further limitation is the lack of well-specific lithological logs and screened-interval information for the three drilled irrigation wells. The interpretation therefore relies on the regional description of the Quaternary alluvial and volcano-sedimentary aquifer in Section 2.1, without resolving local stratigraphic contrasts around each well. Future work should couple groundwater chemistry with detailed borehole logs and hydraulic tests, so that flow paths and mixing processes can be better constrained.
5. Conclusions
Across ten months of monitoring (1 October 2024–1 July 2025) at three groundwater points in La Yarada Los Palos, two clear patterns emerged. First, boron was ubiquitous at levels of concern: 100% of samples exceeded the FAO threshold for sensitive crops (0.7 mg/L), 56.7% were ≥1.5 mg/L, and none reached 3 mg/L. The highest levels of boron occurred at Southern Border (mean ≈ 2.10 mg/L), while Ashlands showed intermediate values (≈1.65 mg/L) and Bio Garden Los Palos the lowest (≈1.35 mg/L). Second, salinity—not sodicity—was the dominant soil–water constraint. Electrical conductivity ranged between ≈0.95 and 1.33 dS/m at Bio Garden Los Palos and ≈1.01 and 1.47 dS/m at Southern Border, but rose to ≈2.97–3.97 dS/m at Ashlands, where SAR nevertheless remained low (site mean ≈ 3.75; all sites < 9).
These patterns point to partly decoupled controls on boron and the major ion salinity signal. Spearman correlations between boron and EC/TDS were weak (ρ ≈ −0.09 and −0.16), whereas positive but modest associations with Ca2+ and Mg2+ (ρ ≈ 0.40 and 0.44) suggest cation chemistry and mixing processes shape boron exposure differently from the salinity gradient that peaks at Ashlands. Practically, this means that managing boron and managing salts cannot rely on a single lever: sites with higher EC but low SAR call for osmotic control and infiltration protection, while sectors with elevated boron—most notably Southern Border—require direct measures to keep crop exposure below tolerance thresholds.
Implications for local crops are immediate. Olive and orange, both moderately tolerant, are likely to incur gradual degradation where boron remains at or above ~1.5 mg/L, particularly during dry spells when evaporative concentration elevates EC. Oregano and quinoa, which are more sensitive, face greater risk where EC approaches 3–4 dS/m and the Na+/Ca2+ balance is unfavorable. Given the observed ranges—boron up to 2.47 mg/L and EC up to ~3.97 dS/m—site-specific irrigation scheduling, timely leaching, and calcium amendments are essential to stabilize yields without degrading soil structure.
Action should follow directly from the evidence. Treat salinity and boron as coupled priorities but distinct problems: protect structure and infiltration with calcium sources (e.g., gypsum) where needed, and calibrate leaching to the measured EC; in parallel, reduce boron exposure through source blending or supplemental low-B irrigation during sensitive phenological stages, and consider selective removal where feasible. Operate a risk-based monitoring scheme centered on a small set of indicators—EC, SAR, boron, and Ca–Mg–Na ratios—at least monthly, with intensified checks when EC spikes or boron nears crop-specific thresholds. At the district scale, introducing treated alternative water sources (e.g., reclaimed wastewater or treated surface water) during dry months can relieve pressure on the coastal aquifer while keeping EC and boron within acceptable ranges.
For La Yarada Los Palos and, by extension, other hyper-arid coastal agroecosystems that depend on stressed groundwater, the pattern documented here—boron values between 1.18 and 2.47 mg/L and EC locally approaching 3–4 dS/m with SAR < 9—points to a concrete next step: adopting a simple, risk-based monitoring and management scheme. In practice, wells with Ashlands-type salinity should prioritize osmotic control and protection of infiltration, whereas Southern Border-type wells should focus on limiting boron exposure through crop choice, blending, or selective removal. Implementing monthly wellhead measurements of EC, SAR, boron, and Ca–Mg–Na ratios, coupled with field records of soil ECe and crop performance, would allow these classes and thresholds to be refined over time and to inform management in other coastal basins facing similar combinations of salinity, sodicity, and boron.
The scope of this study is limited. The monitoring network included three sites with monthly sampling, and the findings should not be excessively generalized to the entire basin. Expanding the monitoring grid to include soil ECe and plant tissue boron measurements, and complementing routine analyses with continuous EC and water level sensors, would enhance diagnostic precision and enable more rapid operational responses. Nonetheless, the signal is clear: under hyper-arid conditions, maintaining production in La Yarada Los Palos relies on consistent salinity control in Ashlands-type settings and disciplined management of boron exposure in Southern Border-type settings, supported by routine, decision-oriented monitoring.
Author Contributions
Conceptualization, L.J.P.M.S. and D.U.M.C.; methodology, L.J.P.M.S. and D.U.M.C.; software, L.J.P.M.S. and D.U.M.C.; validation, L.J.P.M.S. and D.U.M.C.; formal analysis, L.J.P.M.S.; investigation, L.J.P.M.S.; data curation, L.J.P.M.S. and W.D.F.P.D.L.; writing—original draft preparation, L.J.P.M.S.; writing—review and editing, L.J.P.M.S.; visualization, L.J.P.M.S. and W.D.F.P.D.L.; supervision, L.J.P.M.S.; project administration, L.J.P.M.S. All authors have read and agreed to the published version of the manuscript.
Funding
This research was self-funded by the National University Jorge Basadre Grohmann through Canon, Sobrecanon, and Mining Royalties number 2021-I, and did not receive any specific funding from external agencies or organizations.
Institutional Review Board Statement
Not applicable.
Informed Consent Statement
Not applicable.
Data Availability Statement
The data that support the results of this research can be requested by contacting the author by email.
Acknowledgments
This article was made possible thanks to the National University Jorge Basadre Grohmann through its Vice-Rectorate for Research and Research Institute, as part of the Research Project “Presence of Arsenite and Arsenate in the Water of the Caplina Watershed—Tacna and their Removal through Technologies Based on Renewable Energy”.
Conflicts of Interest
The authors declare no conflicts of interest.
References
- Fišer, C.; Zagmajster, M.; Jemec Kokalj, A.; Mali, N.; Šumrada, T.; Glavan, M.; Hose, G.C.; Schwartz, B.; Lorenzo, T.D.; Griebler, C.; et al. Toward Sustainable Irrigation Practices Safeguarding Groundwater Biodiversity and Ecosystem Services. BioScience 2025, biaf016. [Google Scholar] [CrossRef]
- Climate Change 2022: Impacts, Adaptation and Vulnerability: Working Group II Contribution to the Sixth Assessment Report of the Intergovernmental Panel on Climate Change; Intergovernmental Panel on Climate Change, Ed.; Cambridge University Press: Cambridge, UK, 2023; ISBN 978-1-009-32584-4. [Google Scholar]
- Su, Q.; Kambale, R.D.; Tzeng, J.-H.; Amy, G.L.; Ladner, D.A.; Karthikeyan, R. The Growing Trend of Saltwater Intrusion and Its Impact on Coastal Agriculture: Challenges and Opportunities. Sci. Total Environ. 2025, 966, 178701. [Google Scholar] [CrossRef]
- Saltwater Intrusion. Available online: https://www.usgs.gov/mission-areas/water-resources/science/saltwater-intrusion (accessed on 14 October 2025).
- Drechsel, P.; Zadeh, S.M.; Pedrero-Salcedo, F.; Alcon, F.; Allende, A.; Amerasinghe, P.; Amoah, P.; Ben-Gal, A.; Benes, S.E.; Bruning, B.; et al. Water Quality in Agriculture: Risks and Risk Mitigation; FAO: Rome, Italy; IWMI: Colombo, Sri Lanka, 2023; ISBN 978-92-5-138072-7. [Google Scholar]
- Mohanavelu, A.; Naganna, S.R.; Al-Ansari, N. Irrigation Induced Salinity and Sodicity Hazards on Soil and Groundwater: An Overview of Its Causes, Impacts and Mitigation Strategies. Agriculture 2021, 11, 983. [Google Scholar] [CrossRef]
- United States Department of Agriculture. Natural Resources Conservation Service Conservation Practice Standard: Saline and Sodic Soil Management (Code 610); United States Department of Agriculture: Washington, DC, USA, 2020.
- Landi, M.; Margaritopoulou, T.; Papadakis, I.E.; Araniti, F. Boron Toxicity in Higher Plants: An Update. Planta 2019, 250, 1011–1032. [Google Scholar] [CrossRef]
- Brdar-Jokanović, M. Boron Toxicity and Deficiency in Agricultural Plants. Int. J. Mol. Sci. 2020, 21, 1424. [Google Scholar] [CrossRef]
- Rékási, M.; Ragályi, P.; Füzy, A.; Uzinger, N.; Dobosy, P.; Záray, G.; Szűcs-Vásárhelyi, N.; Makó, A.; Takács, T. Effect of the Boron Concentration in Irrigation Water on the Elemental Composition of Edible Parts of Tomato, Green Bean, Potato, and Cabbage Grown on Soils With Different Textures. Front. Plant Sci. 2021, 12, 658892. [Google Scholar] [CrossRef]
- Sang, W.; Huang, Z.-R.; Yang, L.-T.; Guo, P.; Ye, X.; Chen, L.-S. Effects of High Toxic Boron Concentration on Protein Profiles in Roots of Two Citrus Species Differing in Boron-Tolerance Revealed by a 2-DE Based MS Approach. Front. Plant Sci. 2017, 8, 180. [Google Scholar] [CrossRef]
- Khan, M.K.; Pandey, A.; Hamurcu, M.; Avsaroglu, Z.Z.; Ozbek, M.; Omay, A.H.; Elbasan, F.; Omay, M.R.; Gokmen, F.; Topal, A.; et al. Variability in Physiological Traits Reveals Boron Toxicity Tolerance in Aegilops Species. Front. Plant Sci. 2021, 12, 736614. [Google Scholar] [CrossRef]
- United States Department of Agriculture, A.R.S. Boron Tolerance of Crops. Available online: https://www.ars.usda.gov/pacific-west-area/riverside-ca/agricultural-water-efficiency-and-salinity-research-unit/docs/databases/boron-tolerance-of-crops/ (accessed on 27 November 2025).
- Kaya, G. Boron Toxicity Affects Plant Growth by Destroying the Cell Membrane Stability and Micronutrient Balance in Melon. Sci. Rep. 2025, 15, 17126. [Google Scholar] [CrossRef]
- Stavi, I.; Thevs, N.; Priori, S. Soil Salinity and Sodicity in Drylands: A Review of Causes, Effects, Monitoring, and Restoration Measures. Front. Environ. Sci. 2021, 9, 712831. [Google Scholar] [CrossRef]
- Adeyemo, T.; Kramer, I.; Levy, G.J.; Mau, Y. Salinity and Sodicity Can Cause Hysteresis in Soil Hydraulic Conductivity. Geoderma 2022, 413, 115765. [Google Scholar] [CrossRef]
- Zhang, X.; Zuo, Y.; Wang, T.; Han, Q. Salinity Effects on Soil Structure and Hydraulic Properties: Implications for Pedotransfer Functions in Coastal Areas. Land 2024, 13, 2077. [Google Scholar] [CrossRef]
- Vieira, C.B.; Silva, G.H.M.C.; Almeida, B.G.D.; Pessoa, L.G.M.; Freire, F.J.; De Souza Junior, V.S.; Melo, H.F.D.; Lima, L.G.G.D.; Paiva, R.F.D.N.; Ferreira, J.F.D.S.; et al. Saturated Hydraulic Conductivity of Nine Soils According to Water Quality, Soil Texture, and Clay Mineralogy. Agronomy 2025, 15, 864. [Google Scholar] [CrossRef]
- Rengasamy, P. Irrigation Water Quality and Soil Structural Stability: A Perspective with Some New Insights. Agronomy 2018, 8, 72. [Google Scholar] [CrossRef]
- Tekile, A.K. Suitability Assessment of Surface Water Quality for Irrigation: A Case Study of Modjo River, Ethiopia. J. Environ. Public Health 2023, 2023, 1–12. [Google Scholar] [CrossRef]
- Qu, M.; Huang, X.; García-Caparrós, P.; Shabala, L.; Fuglsang, A.T.; Yu, M.; Shabala, S. Understanding the Role of Boron in Plant Adaptation to Soil Salinity. Physiol. Plant. 2024, 176, e14358. [Google Scholar] [CrossRef]
- ANZG. Water Quality for Irrigation and General Water Uses: Background Information. Australian and New Zealand Guidelines for Fresh and Marine Water Quality. Australian and New Zealand Governments and Australian State and Territory Governments, Canberra, 2023. Available online: https://www.waterquality.gov.au/sites/default/files/documents/irrigation-guidlelines-draft-9.2.pdf (accessed on 27 November 2025).
- Gobierno Regional de Tacna (GRT). Anuario Estadístico Agrícola 2021–2023: Producción de Cultivos de Alimentos Por Provincia, Región o Departamento de Tacna; GRT: Tacna, Peru, 2024. [Google Scholar]
- Agencia Peruana de Noticias. Agromercado: Nueva Sede En Tacna Articulará La Agricultura Familiar Con Los Mercados. Andina, 9 July 2025. Available online: https://andina.pe/agencia/noticia-agromercado-nueva-sede-tacna-articulara-agricultura-familiar-los-mercados-1036673.aspx (accessed on 27 November 2025).
- Ministerio de Agricultura y Riego (MINAGRI) Compendio Estadístico—Series Históricas de Producción Agrícola. Available online: https://cms.agritacna.gob.pe/uploads/statistics/agricola/2019/9ec50f18-55b0-4a47-a31c-60c8c99f8949.pdf (accessed on 27 November 2025).
- Pino, V.E. El Acuífero Costero La Yarada, Después de 100 Años de Explotación Como Sustento de Una Agricultura En Zonas Áridas: Una Revisión Histórica. Idesia Arica 2019, 37, 39–45. [Google Scholar] [CrossRef]
- Servicio Nacional de Meteorología e Hidrología del Perú—Senamhi. Climas Del Perú: Mapa de Clasificación Climática Nacional. 2021. Available online: https://www.senamhi.gob.pe/load/file/01404SENA-4.pdf (accessed on 27 November 2025).
- Universidad Nacional Jorge Basadre Grohmann; Pino, E.; Ramos, L.; Universidad Nacional Agraria La Molina; Avalos, O.; Autoridad Nacional del Agua; Tacora, P.; Chávarri, E.; Angulo, O.; de Tacna, T.U.P.; et al. Factores Que Inciden En El Agotamiento y La Contaminación Por Intrusión Marina En El Acuífero Costero de La Yarada, Tacna, Perú. Tecnol. Cienc. Agua 2019, 10, 177–213. [Google Scholar] [CrossRef]
- Universidad Nacional Jorge Basadre Grohmann; Pino, V.E.; Coarita, F.A. Caracterización Hidrogeológica Para Determinar El Deterioro de La Calidad Del Agua En El Acuifero La Yarada Media. Rev. Investig. Altoandinas-J. High Andean Res. 2018, 20, 477–490. [Google Scholar] [CrossRef]
- Universidad Nacional Jorge Basadre Grohmann; Pino, E.; Tacora, P.; Steenken, A.; Alfaro, L.; Valle, A.; Pontificia Universidad Católica del Perú; Chávarri, E.; Agraria, L.U.N.; Ascencios, D.; et al. Efecto de Las Características Ambientales y Geológicas Sobre La Calidad Del Agua En La Cuenca Del Río Caplina, Tacna, Perú. Tecnol. Cienc. Agua 2017, 8, 77–99. [Google Scholar] [CrossRef]
- Alvarado Huapaya, A.I.; Capristán Sotelo, P.; Corahua Benites, C.; Ruiz Philipps, C.; Velásquez Bejarano, G. Variación Del Área Agrícola En El Distrito La Yarada Los Palos, Tacna, Perú. Espac. Desarro. 2020, 35, 99–120. [Google Scholar] [CrossRef]
- Chucuya, S.; Vera, A.; Pino-Vargas, E.; Steenken, A.; Mahlknecht, J.; Montalván, I. Hydrogeochemical Characterization and Identification of Factors Influencing Groundwater Quality in Coastal Aquifers, Case: La Yarada, Tacna, Peru. Int. J. Environ. Res. Public Health 2022, 19, 2815. [Google Scholar] [CrossRef]
- Hashem, M.S.; Qi, X. Treated Wastewater Irrigation—A Review. Water 2021, 13, 1527. [Google Scholar] [CrossRef]
- Essamlali, I.; Nhaila, H.; El Khaili, M. Advances in Machine Learning and IoT for Water Quality Monitoring: A Comprehensive Review. Heliyon 2024, 10, e27920. [Google Scholar] [CrossRef]
- Wang, F.; Han, L.; Liu, L.; Bai, C.; Ao, J.; Hu, H.; Li, R.; Li, X.; Guo, X.; Wei, Y. Advancements and Perspective in the Quantitative Assessment of Soil Salinity Utilizing Remote Sensing and Machine Learning Algorithms: A Review. Remote Sens. 2024, 16, 4812. [Google Scholar] [CrossRef]
- Zulkifli, C.Z.; Garfan, S.; Talal, M.; Alamoodi, A.H.; Alamleh, A.; Ahmaro, I.Y.Y.; Sulaiman, S.; Ibrahim, A.B.; Zaidan, B.B.; Ismail, A.R.; et al. IoT-Based Water Monitoring Systems: A Systematic Review. Water 2022, 14, 3621. [Google Scholar] [CrossRef]
- Mamani Flores, J.; Andrade Foronda, D. Reclamation of a Saline-sodic Soil with Gypsum and Sulphur. In Proceedings of the Global Symposium on Salt-Affected Soils, Online, 20–22 October 2021. [Google Scholar]
- Mapping of Salt-Affected Soils—Technical Manual; FAO: Rome, Italy, 2020; ISBN 978-92-5-132687-9.
- Imbernón-Mulero, A.; Gallego-Elvira, B.; Martínez-Alvarez, V.; Martin-Gorriz, B.; Molina-del-Toro, R.; Jodar-Conesa, F.J.; Maestre-Valero, J.F. Boron Removal from Desalinated Seawater for Irrigation with an On-Farm Reverse Osmosis System in Southeastern Spain. Agronomy 2022, 12, 611. [Google Scholar] [CrossRef]
- Imbernón-Mulero, A.; Gallego-Elvira, B.; Martínez-Álvarez, V.; Martin-Gorriz, B.; Molina-del-Toro, R.; Jódar-Conesa, F.J.; Maestre-Valero, J.F. Ion Exchange Resins to Reduce Boron in Desalinated Seawater for Irrigation in Southeastern Spain. Agronomy 2022, 12, 1389. [Google Scholar] [CrossRef]
- An, X.; Liu, Q.; Pan, F.; Yao, Y.; Luo, X.; Chen, C.; Liu, T.; Zou, L.; Wang, W.; Wang, J.; et al. Research Advances in the Impacts of Biochar on the Physicochemical Properties and Microbial Communities of Saline Soils. Sustainability 2023, 15, 14439. [Google Scholar] [CrossRef]
- Autoridad Nacional del Agua. Estudio de Evaluación de La Intrusión Salina En El Acuífero Caplina 2010. Available online: https://repositorio.ana.gob.pe/handle/20.500.12543/3579?show=full (accessed on 27 November 2025).
- Autoridad Nacional del Agua. Plan de Gestión de Recursos Hídricos de La Cuenca Caplina-Locumba. 2013. Available online: https://www.ana.gob.pe/sites/default/files/normatividad/files/pgrh-locumba_0.pdf (accessed on 27 November 2025).
- Mastrocicco, M.; Colombani, N. The Issue of Groundwater Salinization in Coastal Areas of the Mediterranean Region: A Review. Water 2021, 13, 90. [Google Scholar] [CrossRef]
- Feng, W.; Yang, F.; Liu, J. Water Environment Pollution and Control in the Dual-Carbon Background. Water 2023, 15, 3082. [Google Scholar] [CrossRef]
- Pincetti-Zúniga, G.P.; Richards, L.A.; Daniele, L.; Boyce, A.J.; Polya, D.A. Hydrochemical Characterization, Spatial Distribution, and Geochemical Controls on Arsenic and Boron in Waters from Arid Arica and Parinacota, Northern Chile. Sci. Total Environ. 2022, 806, 150206. [Google Scholar] [CrossRef]
- Herrera, V.; Carrasco, C.; Araneda, P.; Sandoval, J.M. Chemical Quality of Urban and Rural Drinking Water, in Tarapaca, Northern Arid Area of Chile. J. Chil. Chem. Soc. 2019, 64, 4421–4427. [Google Scholar] [CrossRef]
- Pandey, A.; Khan, M.K.; Hakki, E.E.; Gezgin, S.; Hamurcu, M. Combined Boron Toxicity and Salinity Stress—An Insight into Its Interaction in Plants. Plants 2019, 8, 364. [Google Scholar] [CrossRef] [PubMed]
- Long, Y.; Peng, J. Interaction between Boron and Other Elements in Plants. Genes 2023, 14, 130. [Google Scholar] [CrossRef]
- Martínez Ríos, C.; Vargas Huamán, R.; Montoya Mendoza, J.; Chamorro Bellido, C.; Zenteno Tupiño, E.; Ascue Contreras, C.; Vigil Deza, L.; Fernández Alvarado, F. Estudio Hidrogeológico de Las Pampas de La Yarada y Hospicio—Tacna. 1996. Available online: https://repositorio.ana.gob.pe/handle/20.500.12543/4314?show=full (accessed on 27 November 2025).
- Gobierno Regional de Tacna Dirección Regional Sectorial de Agricultura Tacna. Plan Estratégico Regional Del Sector Agrario de Tacna. 2008. Available online: https://cms.agritacna.gob.pe/uploads/offices/documents/plan-estrategico-regional/2008/6e5e13d4-c68d-4f64-ad59-0900805cb135.pdf (accessed on 27 November 2025).
- Chinchihualpa Marquez, J.L. Uso de SIG Para Determinar La Vulnerabilidad de Contaminación En Acuíferos de La Yarada y Los Palos de Tacna. Diploma Thesis, Pontificia Universidad Católica del Perú, San Miguel, Peru, 2018. [Google Scholar]
- Dirección Regional de Agricultura Tacna. Estadística Agraria de La Región Tacna. 2025. Available online: https://www.agritacna.gob.pe/estadisticas (accessed on 27 November 2025).
- Autoridad Nacional del Agua. Protocolo Nacional Para El Monitoreo de La Calidad de Los Recursos Hídricos Superficiales: Resolución Jefatural N° 010-2016-ANA; Autoridad Nacional del Agua: Lima, Perú, 2016. [Google Scholar]
- Hanna Instruments Inc. Instruction Manual: HI98194, HI98195, HI98196. Multiparameter Meters pH/mV, ORP, EC, TDS, Resistivity, Salinity, Seawater σ, Dissolved Oxygen, Atmospheric Pressure & Temperature. Available online: https://www.mediray.co.nz/media/15620/om_hanna_multiparamater_ha-hi98194_single-2-multiparameter-hand-held.pdf (accessed on 27 November 2025).
- Lindemann, T.; Hamester, M.; Hinrichs, J.; Wills, J.D. High Sensitivity Arsenic Speciation: HPLC Sector Field ICP-MS; Thermo Fisher Scientific: Waltham, MA, USA, 2003. [Google Scholar]
- Yakimovich, P.V.; Alekseev, A.V. Analysis of Wastewater by ICP-MS. Metallurgist 2018, 62, 3–9. [Google Scholar] [CrossRef]
- U.S. Environmental Protection Agency. Method 200.8: Determination of Trace Elements in Waters and Wastes by Inductively Coupled Plasma-Mass Spectrometry (Revision 5.4); Environmental Monitoring Systems Laboratory, Office of Research and Development, EPA: Las Vegas, NV, USA, 1994.
- Ayers, R.S.; Westcot, D.W. Water Quality for Agriculture. In Water Quality for Agriculture; Food and Agriculture Organization of the United Nations: Rome, Italy, 1985; ISBN 92-5-102263-1. [Google Scholar]
- Yıldız, S.; Karakuş, C.B. Estimation of Irrigation Water Quality Index with Development of an Optimum Model: A Case Study. Environ. Dev. Sustain. 2020, 22, 4771–4786. [Google Scholar] [CrossRef]
- Cahn, M. Evaluating Salinity in Irrigation Water. University of California Cooperative Extension, Monterey County: Salinas, CA, USA. Available online: https://ucanr.edu/sites/default/files/2013-08/170989.pdf (accessed on 27 November 2025).
- Bauder, T.; Stednick, J.S.; Gates, T.; Sutherland, L. Water Quality for Irrigated Agriculture—Salinity/Sodicity Focus Overview Terminology Background. Available online: https://waterquality.colostate.edu/documents/irrigationwaterquality.pdf (accessed on 27 November 2025).
- Qadir, M.; Oster, J. Crop and Irrigation Management Strategies for Saline-Sodic Soils and Waters Aimed at Environmentally Sustainable Agriculture. Sci. Total Environ. 2004, 323, 1–19. [Google Scholar] [CrossRef]
- Blokland, M.H.; Zoontjes, P.W.; Van Rossum, H.J.; Kaklamanos, G.; Van Ginkel, L.A.; Sterk, S.S. Application of GC-C-IRMS for the Detection of Natural Hormone Abuse in Cattle: Background and Conclusions (Steroids Focus). 2014. Available online: https://edepot.wur.nl/304389 (accessed on 27 November 2025).
- Núñez-Gómez, D.; Legua, P.; Lidón, V.; Conesa, A.; Martínez-Nicolás, J.J.; Melgarejo, P. Evaluation of Agricultural Soil-Improving Zeolite for Improving Irrigation Water Quality. Appl. Sci. 2024, 14, 418. [Google Scholar] [CrossRef]
- Qin, X.; Wang, H.; Gong, J.; Ye, Y.; Zhou, K.; Xu, N.; Li, L.; Li, J. Multivariate Statistics and Hydrochemistry Combined to Reveal the Factors Affecting Shallow Groundwater Evolution in a Typical Area of the Huaibei Plain, China. Water 2025, 17, 962. [Google Scholar] [CrossRef]
- Yang, Q.; Zhang, J.; Wang, Y.; Fang, Y.; Martin, J. Multivariate Statistical Analysis of Hydrochemical Data for Shallow Ground Water Quality Factor Identification in a Coastal Aquifer. Pol. J. Environ. Stud. 2015, 24, 769–776. [Google Scholar] [CrossRef] [PubMed]
- Fatnassi, S.; Hörmann, G.; Fohrer, N.; Navarro-Pedreño, J.; Hachicha, M. Boron in Soil, Drainage Water and Groundwater in Long-Term Irrigated Area by Treated Wastewater in Northeast Tunisia. Soil Syst. 2025, 9, 8. [Google Scholar] [CrossRef]
- Roldán-Cañas, J.; Moreno-Pérez, M.F. Water and Irrigation Management in Arid and Semiarid Zones. Water 2021, 13, 2446. [Google Scholar] [CrossRef]
- Food and Agriculture Organization of the United Nations. World Food Day: Water Is Life, Water Is Food. 2023. Available online: https://openknowledge.fao.org/server/api/core/bitstreams/a57e3d8a-808e-41a9-8a52-30c49e80a87a/content (accessed on 27 November 2025).
Disclaimer/Publisher’s Note: The statements, opinions and data contained in all publications are solely those of the individual author(s) and contributor(s) and not of MDPI and/or the editor(s). MDPI and/or the editor(s) disclaim responsibility for any injury to people or property resulting from any ideas, methods, instructions or products referred to in the content. |
© 2025 by the authors. Licensee MDPI, Basel, Switzerland. This article is an open access article distributed under the terms and conditions of the Creative Commons Attribution (CC BY) license (https://creativecommons.org/licenses/by/4.0/).