Abstract
The Jing River–Dongting Lake (DTL), a critical river–lake complex system in the Middle Yangtze River, China, plays a vital role in flood regulation and ecological sustainability. Recent decades have experienced significant morphology adjustments due to upstream reservoir operations; however, the long-term high-resolution hydro-morphodynamic evolution and its impacts on river–lake interactions remain insufficiently quantified. To address this gap, a two-dimensional hydro-morphodynamic model based on HEC-RAS was employed to simulate three decades of hydro-morphology evolution under projected flow–sediment conditions. The model was validated against observed data and reproduced erosion–deposition trends consistent with previous numerical studies. The results indicate sustained channel incision in the Jing River, with a cumulative erosion volume of 462 million m3, in contrast to net deposition in the DTL area totaling 276 million m3 over three decades. A comparison of results under a sediment reduction regulation shows that the overall spatial pattern of erosion and deposition remains largely consistent, although local areas, particularly the confluence of the three major inlets feeding the lake, exhibit pronounced sensitivity to sediment variations. Furthermore, continuous mainstream incision intensifies a draining effect on the lake during dry seasons, leading to declines in both water levels and surface area in the DTL. This effect is most pronounced in the eastern lake area, with reductions being markedly greater in dry periods than in wet periods. Finally, the lake’s storage capacity progressively decreases, with an average annual loss of approximately 36.5 million m3 in the wet periods, underscoring significant impairment of its flood-regulation function. This study provides a validated modeling framework and critical insights for predicting morphological evolution and informing adaptive management in large river–lake systems.
1. Introduction
River-lake systems are dynamic interfaces where upstream fluvial processes and downstream lacustrine environments interact continuously, shaping flood regulation, sediment transport, and ecological habitats [1,2]. Some decadal-scale adjustments have been reported in large sand-bed rivers worldwide, which have been influenced by the impacts of reservoir operations, sediment deficits, and channel engineering on long-term erosion–deposition patterns and floodplain connectivity, such as in the studies of Yangtze River [3], Nile River [4], Mekong River [5], Missouri River [6]. These investigations collectively show that persistent main-channel incision, and reduced storage capacity are common signatures of sediment-starved, regulated systems.
In large-scale basins such as the middle Yangtze, the Jing River delivers a substantial proportion of the discharge and sediment load to Dongting Lake (DTL), the second largest freshwater lake in China. The coupled evolution of the Jing River channel and Dongting Lake water surface therefore governs regional flood risk, water-resource allocation, and long-term geomorphological stability [7,8]. The Three Gorges Reservoir (TGR), located approximately 600 km upstream of the DTL on the mainstem of the Yangtze River, began its reservoir impoundment in 2003. Since then, lake expansion and sediment trapping have markedly altered the Jing River–DTL system by reducing sediment influx, lowering hydraulic gradients, and decreasing discharge at the Three Inlets which represents the three major inlets feeding the lake (Ouchi, Hudu, Songzi), and intensifying lake-margin erosion [9]. These processes indicate a rapid systemic shift in regional river–lake coupling toward a new equilibrium during recent decades [9,10]. Meanwhile, large-scale reclamation reduced lake area and storage capacity, while the TGR and upstream cascade reservoirs trapped a substantial proportion of the Yangtze River’s suspended sediment discharge (SSD), converting the downstream channel from a sand-rich to a sand-deficient system [3,11]. These combined factors may have led to changes in river–lake interactions within the Jing River–DTL system in recent years [12,13]. Building on this broader evidence base, the present work examines whether the Jing River–Dongting Lake complex exhibits comparable behavior and sensitivities under projected flow–sediment regimes.
The current understanding of changes in river–lake interactions following the construction of the TGR primarily relies on hydrological station records and spatial remote-sensing analyses. For example: Zhang et al. [14] reconstructed the water-level variations in DTL before and after TGR construction using hydrological observations, revealing an overall decline in lake levels, with the most pronounced decrease occurring in East Dongting Lake. Changes in DTL’s water bodies between 2000 and 2019 were analyzed using field measurements and remote-sensing imagery. Their results showed that the lake’s surface area decreased at an average rate of 1.26 km2 per year, while its water volume declined by 16.65 million m3 annually [15]. Field measurements at the Chenglingji outlet revealed a shift in the lake’s sediment role—from a sink to a source—with net sediment export reaching up to 1.03 billion t in recent years [3]. DTL experienced extreme drought events in 2006 and 2011, with the water-surface area shrinking to about 350 km2 during the dry season. Moreover, in 2011, an extremely low-water-level period lasted for 80 days in the DTL area, during which hundreds of thousands of residents faced severe water shortages [16]. Meanwhile, with large volumes of sediment trapped in the reservoir, the SSD from the Jing River into the East China Sea decreased from 423 million t/yr to less than 135 million t/yr [17]. Consequently, the downstream riverbed shifted from seasonal to year-round erosion, and the sediment-carrying capacity below the dam was greatly reduced [17,18]. Alterations in river discharge and sediment transport in the Jing River collectively resulted in a substantial reduction in the lake’s flood-storage capacity within DTL. Moreover, Zhou et al. [8] further quantified an approximately 18% decline in DTL’s flood-storage volume relative to pre-TGR conditions. This loss weakens the lake’s role as a natural buffer against Yangtze River flood peaks, thereby elevating downstream flood risk.
However, the lack of long-term high-resolution data hinders a comprehensive understanding of how changes in sediment transport and morphological evolution have reconfigured the river–lake relationship between the Jing River and DTL. In Recent decades, numerical modeling has become the principal tool for quantifying these coupled processes [19,20,21]. Two-dimensional (2-D) hydrodynamic frameworks (e.g., MIKE21) are routinely applied to simulate flow fields and water quality across river-lake reaches [21,22]. Recent studies have demonstrated that coupled 1-D/2-D models can reproduce the water-level dynamics of the DTL area under both historical and engineered conditions, including the operation of the TGR [23,24,25]. Nevertheless, most existing investigations focus solely on hydrodynamics, while the feedback between flow and bed morphology remains underexplored. Morphodynamic coupling is essential for capturing the evolution of channel geometry and its impact on river-lake interaction, as highlighted by recent analyses of riverbed adjustment in the Jing River–DTL system [26].
In the past decades, 2-D hydro-morphodynamic modeling has been widely applied to river processes modeling [27,28,29,30,31]. Predictive modeling of morphological evolution in DTL has advanced in response to the altered hydrological regime induced by upstream reservoir operations [32,33,34]. For instance, Yao & He [34] projected that the lake would accumulate 229 million m3 of sediment over 30 years, with a progressively declining annual sedimentation rate. Furthermore, Hu et al. [32] forecasted a total sedimentation volume of 1.036 billion m3 over a century with 1-D modeling. However, these 1-D basin-scale projections obscure considerable spatial heterogeneity. For instance, sedimentation is primarily concentrated in East and South DTL, whereas West DTL has nearly reached dynamic equilibrium [35], underscoring the need for zonal analysis. More recently, Hu [36] employed a two-dimensional hydro-sediment-morphodynamic model to simulate erosion and deposition processes in the DTL basin over the next two decades. However, the model did not incorporate the morphological influence of the Jing River, thereby omitting a key factor in river–lake system interactions. To date, hydrodynamic and sediment transport models have not provided a quantitative understanding of how future sediment regimes influence river-lake morphological dynamics.
Therefore, this study employs a two-dimensional hydro-morphodynamic model to simulate the spatiotemporal evolution of flow, sediment transport, and morphology in the Jing River–DTL system under projected flow and sediment conditions, as well as and its consequent reshaping of river–lake interaction (water levels, wet surface area, and lake storage capacity). The model is designed to clarify how erosion–deposition processes under changing sediment regimes affect the lake’s hydraulic properties and storage capacity. The structure of the paper is as follows. Section 2 describes the study area, numerical methods, and model configuration. Section 3 presents predicted morphological changes and validates the model against measured data and existing numerical results [34,36]. Section 4 analyzes the influence of sediment regulation on morphological evolution and examines the response of river–lake interactions including water levels, surface area, and storage capacity. Section 5 will provide concluding remarks. This article will present a novel approach for analyzing river-lake interactions and demonstrates its application in the Jing River–DTL system, providing critical insights that could inform similar studies of other river-lake systems.
2. Data and Methods
2.1. Study Area
The Jing River–DTL system lies in the middle reaches of the Yangtze River, downstream of the TGR. The Jing River, a crucial branch of the Yangtze flowing through Hubei Province, is hydrologically connected to DTL, located in northeastern Hunan Province (Figure 1a). DTL comprises three sub-basins: Eastern, Western, and Southern Dongting Lakes (EDL, WDL, SDL). The lake receives flood pulses from both the Yangtze River and its basin tributaries—the Yuan, Li, Zi, and Xiang Rivers (Figure 1b). Annually, the Yangtze delivers about 89.5 million m3 of water and 111.4 million t of sediment to Eastern and Western Dongting Lakes via the Songzi, Hudu, and Ouchi Inlets [13]. SDL and WDL receive water and sediment primarily from the Xiang, Zi, Yuan, and Li Rivers, with an average annual discharge of 166.7 billion m3 and a suspended sediment load of 26.3 million t [13]. The system plays a vital role in flood regulation and sediment dynamics. The only outflow from DTL and the lower Jing River converge at Chenglingji (CLJ; see Figure 1c). The modeled domain spans ~104 km of the Jing River from Jianli (JL) to Luoshan (LS) and covers ~2700 km2 of DTL, including the Three Inlets (Songzi, Hudu, Ouchi) and portions of the Four Rivers (Xiang, Zi, Yuan, Li). As noted by Hu et al. [37], the region exhibits complex compound cross-sections and strong seasonal variations in flow and sediment transport. During low flows, water is confined to the main channel, whereas flood events produce extensive overbank flooding. The lake exhibits distinct river–lake interactions: flooding produces large inundated areas, whereas dry seasons expose narrow flow paths. Seasonal hydrological variations are significant: during wet periods, backwater effects from the Yangtze elevate water levels, reduce flow velocity, and promote sediment deposition that forms shoals and sandbars. In contrast, dry seasons expose extensive floodplains. The river corridor is highly sinuous, with well-developed alluvial plains and wetlands along both banks [38].
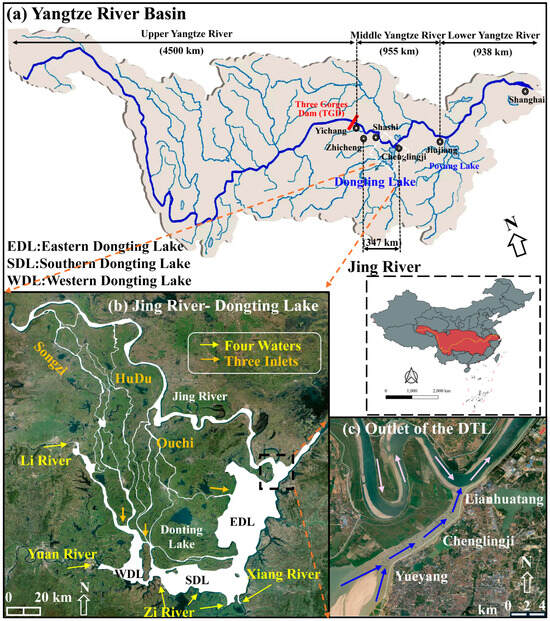
Figure 1.
Overview of the study area. (a) Yangtze River Basin; (b) Satellite image of the Jing River-DTL water system structure, where Four waters and Three inlets are shown; (c) Satellite image of the connection region from DTL to Jing River.
2.2. Numerical Methods
The shallow water equations (SWEs) govern depth-averaged free-surface flows and are derived from the Navier–Stokes equations under the hydrostatic assumption. They describe water-level variations and momentum transfer, ensuring conservation of mass and momentum across complex river–lake domains. In the Yangtze River, the SWEs—when coupled with sediment transport and morphodynamic models—have been widely applied [30,39,40]. The two-dimensional SWEs can be expressed in the standard conservation form as follows:
where is the time; is the depth; are the spatial horizontal coordinates in the Cartesian coordinate system; denotes the water level; = 9.81 m/s2 is the gravitational acceleration; are the depth-averaged velocities in the and directions, respectively; and is the bottom friction coefficient which can be resolved by Manning’s equation reflecting hydraulic resistance from bed material and surface irregularities:
where n denotes the Manning roughness and is the hydraulic ratio.
The vertically averaged transport equation, with sediment exchange between the flow and the riverbed as a source term, is used as the governing equation of the non-uniform sediment transports:
where is total-load depth-averaged sediment concentration of the kth grain class accounting for both bedload and suspended load. The number of sediment fractions (Nsed) is divided into four, and the four grain classes represent sediment fractions based on particle size: 0.05 mm, 0.05–0.25 mm, 0.25–0.5 mm, and >0.5 mm, sequentially. The first three groups are defined as suspended load; and the latter as bedload. are deposition and erosion rates of the kth grain class, which are estimated as the function of the sediment concentration and the sediment-carrying capacity for suspended load or bedload transport rate for kth grain class of the non-uniform sediment, respectively. is the ratio of near-bed to depth-averaged concentration, which is set as = 1 refer to Hu et al. [40] and Lyu et al. [30]. Bedload transport rate is estimated using the MPM equation [41], which relates transport capacity to grain size and critical shear stress. Suspended load transport is computed with the Van Rijn approach [42], which balances settling velocity and turbulent diffusion under local hydraulic conditions to derive vertical concentration profiles and transport rates. Together, these methods provide a comprehensive representation of sediment transport rate. Riverbed deformation caused by the transport of the kth fraction of the sediment is described by [30,36,39,40]:
where = the riverbed deformation caused by the kth fraction of the sediment; is the dry density of the bed materials. The gradation of the bed materials is also updated through the active layer sorting method, which partitions the bed into mobile and immobile layers [43]. The present model followed a simple but common method of considering the active layer thickness: ha = and84 [43], where an was an empirical parameter and d84 denotes the particle size at which 84% of the sediment are finer. And the parameter an = 400 was adopted by Hu et al. [40], so that active layer thickness was defined as a constant (0.2 m) in this paper. The bed elevation is updated at each hydrodynamic time step, ensuring that the correct topography is used in every hydrodynamic calculation. However, since the timescale of hydrodynamic variations is typically 1–2 orders of magnitude smaller than that of bed erosion and deposition, the introduction of a Morphological Acceleration Factor (MF) can address the discrepancy between the two. By multiplying the bed elevation change calculated at each hydrodynamic time step by a constant, the topographic changes are accelerated, allowing the hydrodynamic time step to be linearly extended to match the topographic update time step [44].
It is important to note that when using the MF in medium to long-term geomorphological evolution simulations, the model needs to set the corresponding upstream and downstream boundary conditions at the appropriate scale. If measured boundary conditions are still used, the hydrodynamic process will be artificially extended in terms of timescale, and thus, the actual hydrodynamic process needs to be averaged [44]. The model framework is solved using the Eulerian–Lagrangian Method (ELM), which integrates finite-difference and finite-volume schemes on unstructured meshes [20,23,45]. The model framework is solved by using HEC-RAS V6.6.
2.3. Initial Conditions and Boundary Conditions
The model is initialized using the terrains from Jianli to Luoshan in the Jing River and of the DTL area, which are measured in 2011 with the 1:10,000 resolution, as shown in Figure 2a. Eight hydrological stations are located in this region, including Jianli (JL), Yanchuantao (YCT), Chenglingji, Lujiao (LJ), Yingtian (YT), Xiaohezui (XHZ), Caowei (CW), and Luoshan (LS). Boundary conditions for the model include ten inflow boundaries: the mainstream Jing River at Jianli, Xiang River, East Zi River, Middle Zi River, West Zi River, Yuan River, Li River, Xiaojiawan, Sanchahe, and Zhuzikou. The outflow boundary is defined by the water-level time series at the LS hydrological station (Figure 2a). Future sedimentation and erosion scenarios are driven by the one-dimensional river network model of the Yangtze River Basin, developed by the Changjiang River Scientific Research Institute [34]. This model provides flow–sediment boundary conditions for the next 30 years (10,959 days), using measured flow and sediment series from the 1990s while accounting for the regulation of upstream cascade reservoirs. The initial spatial distributions of bed material composition in the computational domain were linearly interpolated from cross-section data which are collected based on surveys of DTL bed sediment conducted between 2003 and 2012 by the Yangtze River Commission, with the initial gradation specified by four segments the same as the sediment fractions presented in Section 2.2. The Manning roughness (n = 0.020 s/m1/3 for the Jing River region and n = 0.030 s/m1/3 for the DTL region) was chosen. The computational domain is discretized into an unstructured mesh, with average grid sizes of ~400 m in the lake area and ~200 m in the main river channel (Figure 2b). The model time step is 60 s, and the MF with a value of 15 is applied to enable long-term morphological simulations.
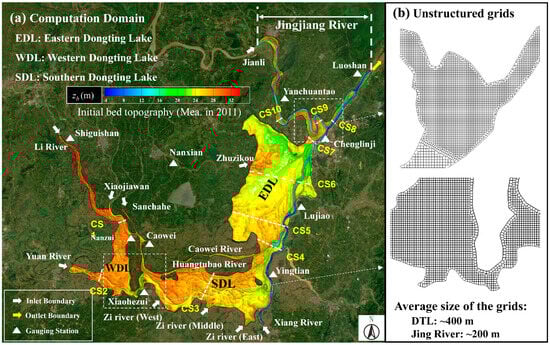
Figure 2.
(a) The computation domain, initial bed topography and (b) the sketches of unstructured grids set about Jing River-DTL Hydro-morphology system.
2.4. Numerical Scenarios
Four numerical cases were designed to calibrate the hydro-morphodynamic model and to examine the response of river–lake interactions to future erosion–deposition patterns, as summarized in Table 1. The Base Case serves as the reference, simulating 30 years using three repeated cycles of the 1990s projected flow–sediment series, incorporating regulatory impacts from cascade reservoirs, with bed evolution enabled. The projected flow–sediment boundary conditions and the general morphodynamic framework are consistent with the earlier 1-D basin-scale simulations [34] and the 2-D basin model [36], which are later used for comparison. To assess the system’s sensitivity to sediment dynamics, two parallel simulation tracks were employed: one including the erosion and deposition factor, and another excluding it. This dual approach was chosen to quantitatively evaluate the impact of erosion/deposition on the evolution of river-lake relations. Thus Case 1 was designed with applying the same hydro-sedimentary inputs as the Base Case but excludes bed evolution to isolate its effects (by setting ∂zb/∂t = 0 in Equation (6)). Case 2 reduces sediment supply by 50% relative to the Base Case while retaining bed evolution, to evaluate sensitivity to upstream sediment regulation. This is due to that as mentioned in the introduction, after the construction of reservoirs such as TGR, the amount of sediment entering the system has decreased significantly. Therefore, we generalize the impact of this effect by using a 50% reduction in all incoming sediment. Finally, Case 3 provides a one-year validation using flow–sediment data measured in 2012 with not considering bed evolution, allowing comparison with field measurements at hydrological stations to further validate the performance of the models.

Table 1.
Summary of numerical case studies.
3. Validation and Results
3.1. Flow Condition
To validate model effectiveness, hydrological station data from 2012 was employed to verify the model’s computational performance; the Nash-Sutcliffe efficiency coefficient (NSE) and the Root Mean Square Error (RMSE) were introduced to quantitatively assess model accuracy, with the expression as follows:
where n represents the number of time series data points; and denote the simulated and observed values, respectively; and indicates the mean value of the observed variable. The NSE ranges from 0 to 1, where 1 indicates perfect agreement between simulated and observed values, and 0 reflects complete disagreement. Figure 3 presents a comparison between calculated and observed water levels for Case 3 at six representative stations (CLJ, LJ, YT, XHZ, CW, and YCT). The simulated and observed water levels, which range approximately between 20 and 30 m at the selected stations, are consistent with the local gauge datums in 2012. At the majority of stations, the simulated values closely reproduce the observed trends, with NSE coefficients of 0.998, 0.996, 0.996, 0.894, 0.945, and 0.980, respectively. Additionally, the values of RMSE for the stations are as follows: CLJ = 0.185 m, LJ = 0.218 m, YT = 0.220 m, XHZ = 0.544 m, CW = 0.417 m, and YCT = 0.500 m. These NSE and RMSE values indicate the precision of the model in reproducing observed water levels, with smaller RMSE indicating better model performance. The relatively lower NSE and Higher RMSE at XHZ, corresponding to an approximate 10% error, can be attributed to local hydrological complexities. In particular, water levels at XHZ are heavily affected by inflows from the Songzi River. Discrepancies at this station arise because the model did not incorporate the complex river network of the Three Inlets channels, or inputs from smaller tributaries. Nevertheless, the simulation results are satisfactory, especially as the simulated and observed values along the YT–LJ–QLS transect in the EDL exhibit near-perfect agreement, demonstrating the model’s reliability.
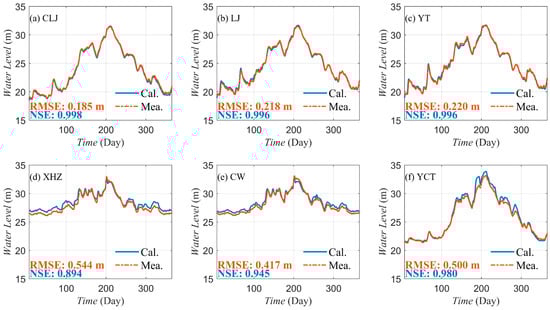
Figure 3.
Comparison of calculated water levels and measured values at typical hydrological stations.
3.2. Erosion and Deposition
Figure 4 shows the predicted temporal evolution of total and annual erosion and deposition volumes under the Base Case for the Jing River and DTL, respectively. Owing to the absence of post-2011 measured topographic data in the DTL region, the simulation results are evaluated against reference values of erosion and deposition from 2011 to 2020 and numerical predictions from 1-D and 2-D models using consistent initial and boundary conditions [34,36]. Indeed, the reference values derived by measured data were determined through the Sediment Flux Methods. Specifically, the erosion volume in the Jing River was calculated as the sediment load at Jianli plus that at CLJ minus the load at LS. Conversely, the sedimentation volume in DTL was derived from the total sediment inflow from the Three inlets and Four Rivers minus the outflow at CLJ, in which these data was collected by hydrological station. Otherwise, unlike Hu (2024) [36], our 2-D domain explicitly includes the lower Jing River so that river incision feeds back on lake morphology; and unlike the results reported by Yao & He [34], our 2-D simulation can resolve the spatial heterogeneity of erosion and deposition in Jing River-DTL system.
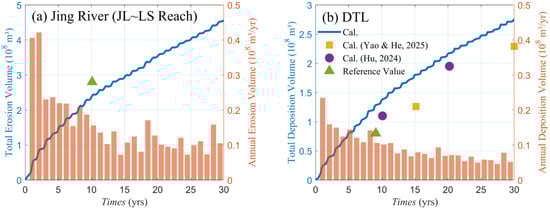
Figure 4.
(a) Predicted total deposition volume and annual results in the Jing River. (b) Predicted total deposition volume and annual results in the DTL, and comparison with the reference values and Calculated results shown by Hu [36] and Yao & He [34].
As shown in Figure 4a, the Jing River reach exhibits persistent erosion along the main channel. The total erosion in the Jianli–Luoshan segment is simulated to reach 240 million m3 by the 10th year, which is comparable to the reference value of 280 million m3 reported in 2021, representing a deviation of about 14.3%. Over the full 30-year period, cumulative erosion is projected to reach 462 million m3. The annual erosion rate exhibits a pronounced decreasing trend, declining from approximately 20 million m3/yr to about 10 million m3/yr by the end of the simulation. For the DTL region (Figure 4b), the predicted deposition volumes in this study are consistently higher than estimates from previous studies. Over 10 and 20 years, the model predicts sediment deposition of 136 million m3 and 215 million m3, respectively, with a deviation of 10.2% at the 20th year compared to earlier estimates conducted by Hu [36], in which predicted cumulative deposition of 110 million m3 and 195 million m3 at the 10th and 20th year. The 1-D model simulated cumulative deposition of 126 million m3 and 229 million m3 at the 15th and 30th year, respectively, whereas this study predicts 276 million m3 by the 30th year, representing a 17.0% deviation at the 30th year. Furthermore, when benchmarked against the reference deposition value of 80.35 million m3 for the DTL region, the model’s predicted sedimentation trend shows general alignment with the observed conditions.
Overall, the total deposition volumes obtained in this study are broadly consistent with results from both previous 1-D and 2-D simulations. Notably, as the inflow boundary conditions are based on cycled hydrological data from the 1990s, the simulated deposition volume in the DTL region exhibits a marked increase in the eighth year, corresponding to the high-flow and high-sediment conditions of 1998. This pattern supports the reliability of the predictions, as it realistically reflects the intensified sedimentation expected during extreme flood events.
3.3. Morphology Evolution
Figure 5 illustrates the predicted erosion and deposition distribution within the Jing River–DTL system at the 15th and 30th years (total erosion volume in the Jing River reaches 297 million and 461 million m3, respectively; total deposition volume in the DTL is 180 million and 276 million m3, respectively). The lower Jing River (JL–LS reach) exhibits overall channel incision, with localized deposition along convex banks in meandering regions between JL and CLJ due to curvature-induced flow patterns. In the CLJ–LS reach, erosion dominates, leading to the gradual disappearance of mid-channel bars. The lake outflow channel experiences deposition near its confluence with the mainstem, resulting from an enlarged cross-section caused by downstream incision. In contrast, the upper segments of the outflow channel undergo erosion, contributing to slope flattening—a trend supported by the topographic evolution shown in Figure 6. Sediment is primarily supplied from the four major tributaries (Xiang, Zi, Yuan, Li), and the Three Inlets. Flow deceleration upon entering the lake promotes significant sedimentation near and downstream of confluences. Notable deposition occurs along the Xiaojiawan Inlet–Nanzui corridor (up to ~4 m), whereas WDL shows minimal change. Beyond Nanzui, the southern branch experiences additional deposition exceeding 4 m, while the northern branch, constrained by the narrow and high-discharge Caowei River, delivers most of its sediment into EDL, where deposition is concentrated in deeper zones near the confluence. The depositional pattern in EDL is complex, influenced by multi-source inflows, boundary conditions, and pre-existing bathymetry. This results in the infilling of historically dredged trenches and erosion in shallower zones, consistent with earlier 2-D models [36]. Additionally, a sandbar develops at Zhuzikou due to flow expansion. Pronounced erosion occurs in the inflow channels of the Li, Yuan, and Zi Rivers, with the most significant incision in the eastern deep channel of EDL. Spatially, the simulation over three decades indicates sustained deposition in river mouths and the DTL basin, whereas erosion is concentrated within the lake’s river channels. The mainstem exhibits an alternating pattern of erosion and deposition, aligning with previous numerical simulations and observed geomorphic trends from the past decade.
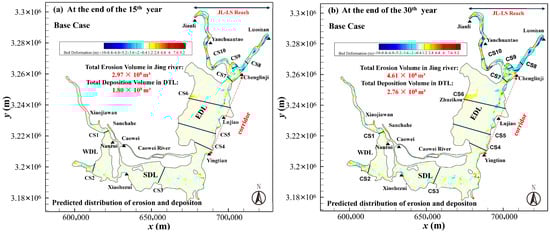
Figure 5.
Predicted distribution of erosion and deposition in the computational domain by Base Case at (a) the 15th year and (b) the 30th year.
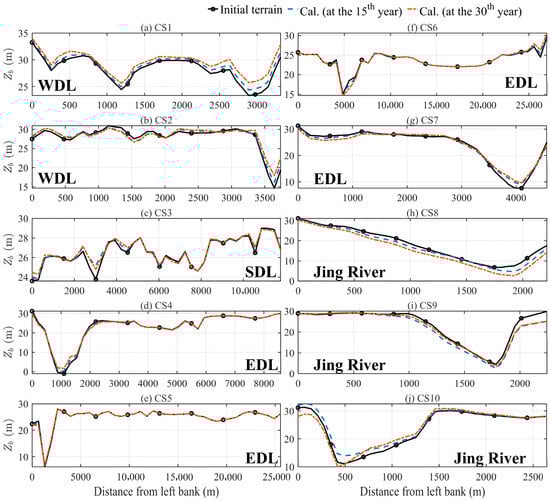
Figure 6.
Cross-section profiles of the measured bed elevation at the initial time and the predicted bed elevation at the 15th and 30th years. See Figure 5 for their position.
Furthermore, Figure 6 illustrates the changes in cross-sectional morphology after 15 and 30 years (section locations are shown in Figure 2). At Section CS1 (near Xiaojiawan and Sanchahe), both the channel and floodplain exhibit significant deposition, with a maximum sediment thickness of nearly 4 m. As for Sections CS2 and CS3, located in the West, South, and EDL areas, are characterized by deposition in the deep channels, while the floodplains display alternating erosion and deposition, albeit with smaller magnitudes than those in the deep channels. Sections CS4, CS5 and CS6 in EDL display channel erosion alongside floodplain deposition. Overall, the lake area exhibits a deposition-dominated trend. At Section CS7 within the outflow channel, sediment accumulation occurs due to mainstream incision, consistent with previous findings. Sections CS8 to CS10 along the mainstream are predominantly erosional, with notable channel downcutting. Among these, Section CS10—situated at a bend—shows initial deposition followed by erosion, highlighting the ongoing and complex adjustment of erosion–deposition dynamics in the Lower Jing River reach.
4. Discussion
4.1. Effects of Sediment Regulation on Morphological Evolution
To investigate the effects of sediment regulation on morphological evolution in the Jing River–DTL system, Figure 7 presents the predicted erosion and deposition distribution under a scenario where all incoming sediment loads are reduced by 50% compared to the Base Case, showing results after 15 and 30 years. Based on model statistics, the Jing River reach (JL–LS) experiences cumulative erosion of 354 million m3 and 576 million m3 over 15 and 30 years, respectively, while the DTL area undergoes deposition of about 167 million m3 and 227 million m3 over the same periods. Qualitatively, these trends align with the Base Case, in which deposition in the lake and erosion in the mainstream, though quantitative differences are evident. This indicates that the overall morphological response pattern remains consistent even under significantly reduced sediment supply. Under both scenarios, the erosion–deposition pattern in the lake area is broadly similar, with the spatial distribution under the Base Case illustrated in Figure 5. Even with a 50% reduction in upstream sediment supply, the general pattern in the lake and mainstream closely resembles that of the baseline condition. The primary difference occurs near the Zhuzikou inlet (CS6): under the original sediment load, flow expansion and reduced velocity upon entry into the lake caused rapid sedimentation and pronounced deltaic shoal formation. In contrast, with reduced sediment supply, the decreased influx results in a relatively higher transport capacity, preventing significant shoal development. This contrast highlights the strong control of sediment availability on local geomorphic evolution. Overall, the comparison demonstrates that although the erosion–deposition structure remains relatively stable, sensitive local areas such as inlets are highly sensitive to sediment variations.
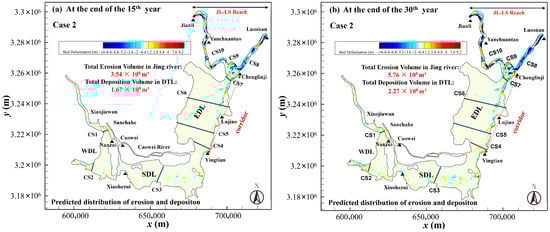
Figure 7.
Predicted distribution of erosion and deposition in the computational domain by Case 2 at (a) the 15th year and (b) the 30th year.
To further examine the impact of sediment regulation on sedimentation patterns within the lake basin, Figure 8 presents the statistical outcomes of cumulative deposition and erosion volumes across different regions, including WDL, SDL, EDL, and the Jing River. The results reveal that sediment regulation exerts spatially heterogeneous effects on sediment dynamics within the DTL system. WDL shows reduced deposition, with cumulative sedimentation decreasing by 0.084 × 10⁸ m3 relative to the Base Case at the 30th year. In contrast, SDL exhibits increased sediment accumulation, with a gain of 0.034 × 10⁸ m3. The strongest impact within DTL is evident in EDL, where deposition declines by 0.43 × 10⁸ m3. The most pronounced effect occurs in the mainstream Jing River, where erosion intensifies by 1.12 × 10⁸ m3 after 30 years. The apparent contrast between different sub-regions arises from spatial heterogeneity in hydrodynamic connectivity and changes in sediment transport pathways under sediment-reduction scenarios. Specifically, sediment regulation decreases the total sediment load entering DTL region, which strengthens erosion in the main channel and reduces sediment deposition in highly connected zones such as EDL, while relatively more sediment is retained in hydrodynamically weaker zones such as SDL. Overall, these findings indicate that sediment regulation not only amplifies channel downcutting in the mainstream but also reshapes intra-lake deposition patterns, thus reducing sedimentation in WDL and EDL while promoting accumulation in SDL, with the strongest effect in EDL, attributable to its closer hydrological connectivity with the Jing River.
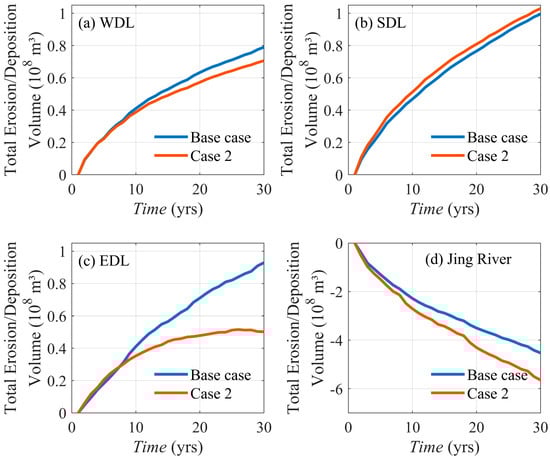
Figure 8.
Predicted total deposition/erosion volume results in the Jing River-DTL system by Base Case and Case 2: (a) WDL; (b) SDL; (c) EDL; (d) Jing River (JL~LS) (Negative values denote erosion; positive values denote deposition).
4.2. Response of Water Levels to Morphology Evolutions
The hydrological characteristics of the river–lake connecting section are shaped by their interactions, and studying them helps clarify the changing relationship between these two water bodies over time [21]. Previous studies have shown that continuous downcutting of the mainstream Yangtze River intensifies the “draining effect” on connected lake systems during dry seasons, resulting in reduced lake water levels [3,14]. Building on this understanding, the present study quantifies this effect through representative hydrological stations (Figure 2), including CLJ, LJ, YT, CW, and XHZ within the lake area, and YCT in the mainstream, under projected long-term conditions with and without erosion/deposition. It is shown from Figure 9 that the results demonstrate that continued erosion in the mainstream causes a notable water level decline at the YCT station, with an average drop of 0.322 m during the dry season (January–March), more than twice the decline observed during the flood season (June–August), which averages 0.152 m. The maximum recorded difference was −1.22 m. Similarly, water levels in the lake region exhibit a consistent downward trend, characterized by pronounced seasonal contrasts. The declines are more pronounced during dry seasons. At CLJ station, for example, the average reduction is projected to reach about 0.524 m in dry periods, compared with 0.285 m during floods, with a maximum difference of about 1.648 m. This seasonal gap is substantially greater than those observed at other stations (LJ: 1.202 m; YT: 1.188 m; XHZ: 0.237 m; CW: 0.232 m, respectively). Spatially, the magnitude of decline is closely associated with proximity to the mainstream. Stations near the Yangtze, such as CLJ, exhibit the most significant decreases, whereas those located farther away, such as XHZ and CW in WDL, are only slightly affected, exhibiting limited seasonal variability. Overall, the analysis highlights that the YT–LJ–CLJ zone in EDL, directly adjacent to the mainstream, is expected to undergo the most significant water level declines in the future.
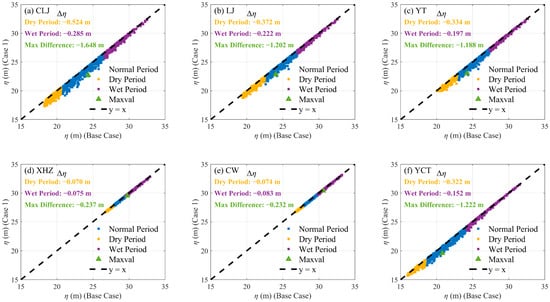
Figure 9.
Comparison of water level calculations at typical stations with and without considering morphology evolution (Base Case and Case 1). Additionally, water level changes during the dry and wet periods, as well as the maximum differences, are provided in each subfigure.
4.3. Response of Lake Wet Surface Area to Morphology Evolutions
To examine the response of lake surface area to morphological evolution, Figure 10 compares water depth distributions after 30 years under scenarios with and without morphological change. The statistical method for the total wet surface area of the DTL basin is as follows:
where is the effective wet area in the DTL region, with a critical water depth of 0.1 m, and , are the area and water depth of the computational cell grid, respectively. Under low water levels (e.g., during dry seasons), the lake exhibits a single-thread channel pattern with reduced surface area. With increased inflow during wet periods, the lake transitions to a continuous sheet-flow pattern. Under both hydrological conditions, two braided channels persist in the northwest and southwest of EDL, together with two perennial deep-water channels linking the three major lake regions. These channels remain water-filled year-round and constitute the core lake area of the DTL basin. During dry periods, water bodies in the three major lake regions contract from the margins, connecting channels narrow, and SDL becomes highly fragmented, with obstructions and breakups producing extensive alternating river–shallow patterns. The most pronounced contractions occur at the central deltaic shoals in EDL and in Lu Lake and Hengling Lake within SDL. Central EDL shoals expand outward, while lake–channel confluences are reduced to narrow waterways. Lu Lake contracts substantially, with its connection to the main lake reduced to a narrow link. Hengling Lake becomes dominated by extensive shoals. During floods, Lu Lake, Wanzi Lake, Dalian Lake, and Hengling Lake all undergo notable surface area reductions. Furthermore, the main lake areas of EDL, Lu Lake, and Caisang Lake nearly vanish.
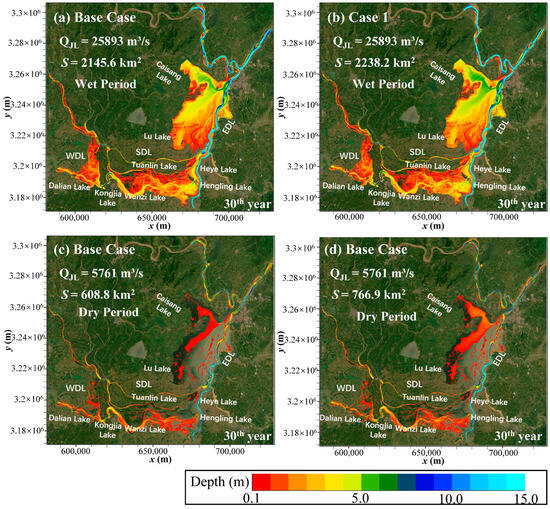
Figure 10.
Predicted water depth distribution during flood and dry periods at the 30th year with and without morphology evolution (Base Case and Case 1). Additionally, discharge in JL (QJL) and wet surface area within the DTL basin (SDTL) at this moment are provided in each subfigure. (a) and (b) depict wet periods and that panels (c) and (d) depict dry periods.
Furthermore, Figure 11 quantitatively illustrates the temporal variation in lake surface area under both with and without erosion-deposition scenarios. During dry periods, the average surface areas are 724.1 km2 and 646.4 km2, whereas during wet periods they increase to 2341.9 km2 and 2315.5 km2, respectively. These results indicate that morphological evolution exerts a more pronounced influence on lake surface area under low-water conditions. Quantitatively, compared with the scenario without morphological evolution, the difference in wet surface area between the two cases is minor during wet periods (4.1%) but increases to 20.6% during dry seasons, concentrated mainly in EDL. This discrepancy is attributed to two major factors: (1) ongoing deposition that raises bed elevation in this region; (2) the enhanced draining effect of mainstream downcutting during low-water periods, which substantially amplifies lake contraction. Additional, during dry periods, extensive shallow margins lie close to the 0.1 m threshold; small water-level increases can therefore inundate large areas, producing higher sensitivity than in wet periods when much of the basin is already submerged. Furthermore, the annual variation exhibits pronounced seasonality, with a difference of nearly 2000 km2 between wet and dry periods, underscoring the critical role of DTL’s storage capacity in regulating mainstream floods.
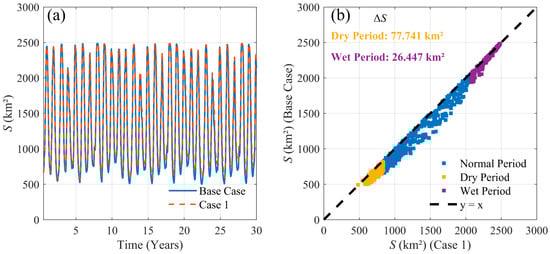
Figure 11.
(a) Time variation in predicted wet surface area within the DTL in Base Case and Case 1; and (b) Comparison of the predicted wet surface area by the two cases, with the value of average differences (Case 1 minus Base Case) during both dry and wet periods provided in the legends.
4.4. Response of Lake Storage Capacity to Morphology Evolutions
Morphological evolution in the lake area progressively undermines its water storage capacity, particularly impairing flood regulatory function. In order to clarify this relation, the statistical method for the total water storage volumes of the DTL basin is as follows:
where is water storage volumes of the computational cell grid. Figure 12a shows the temporal variation in water storage within the lake area under scenarios with and without future morphological evolution. Both scenarios exhibit pronounced interannual and intra-annual variability. Interannually, flood years (e.g., the 1998 historic flood in the Yangtze River, represented as the 8th, 18th, and 28th years in the simulation) show distinct peaks in water storage, with maximum values of ~18 billion m3, whereas normal years exhibit lower peaks of ~6 billion m3. Intra-annually, clear seasonal patterns emerge: during dry periods, water storage remains stable at ~1.5 billion m3, whereas wet periods are marked by substantially higher storage levels. This pattern reflects the lake’s dual role in flood retention and dry-season regulation. Figure 12b further demonstrates that when erosion and deposition are considered, ongoing sedimentation causes a systematic year-by-year reduction in water storage compared with the scenario without morphological changes. This sedimentation-induced loss also varies seasonally: during dry periods, the reduction is modest (~0.006 billion m3 per year) because of the smaller base storage, whereas during wet periods, the loss is much larger (~0.0365 billion m3 per year) due to the greater stored volume and the lake’s critical regulatory role during these times. This wet-period reduction corresponds to roughly 0.2% of DTL’s total effective storage (~18 billion m3), illustrating that even small fractional losses accumulate substantially over multi-decadal periods. These results underscore that continued sedimentation substantially impairs the lake’s flood-regulation capacity, highlighting the sensitivity of its regulatory function to morphological changes.
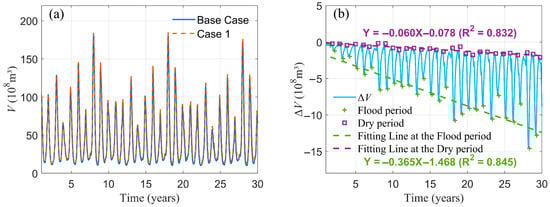
Figure 12.
(a) Time variation in predicted water storage volume within the DTL in Base Case and Case 1; and (b) Time variation in the difference in the predicted water storage volume (Case 1 minus Base Case).
Furthermore, this study quantifies in detail how morphological evolution modifies this relationship. As shown in Figure 13, a significant cubic relationship (R2 > 0.98) is identified between lake storage capacity and simulated CLJ water levels under both scenarios (with and without morphological evolution). The results confirm that, regardless of whether erosion and deposition are considered, CLJ water levels remain the strong indicator controlling lake water storage, and this strong correlation is not fundamentally altered by future morphological evolution. A comprehensive analysis of Figure 9 as presented in Section 4.2 indicates that, under the dual effects of mainstem downcutting and lake sedimentation, CLJ water levels show a persistent downward trend. This decrease propagates through the strong correlation, ultimately driving a year-by-year decline in lake water storage. This decline is not uniform or linear but is modulated by both seasonal hydrodynamics and erosion–deposition responses. During wet periods, when the lake performs its crucial regulation function, Figure 12b shows the system is most sensitive to deposition. Combined with declining CLJ water levels, this substantially amplifies the loss of water storage capacity during floods. In contrast, during dry periods, base storage is small, the response to sedimentation is modest, and sensitivity to CLJ water level decline is comparatively weak. Nevertheless, the cumulative long-term effects of both processes substantially weaken the lake’s future regulation capacity. Ultimately, the combined long-term effects progressively weaken the lake’s overall regulation capacity. The core mechanism lies in the coupled decline of CLJ water levels and annual lake sedimentation, which reshape the water level–storage capacity curve and compress the upper limit of storage capacity under identical flood inflow conditions. This structural shift constitutes the fundamental driver of the lake’s future decline in regulation capacity.
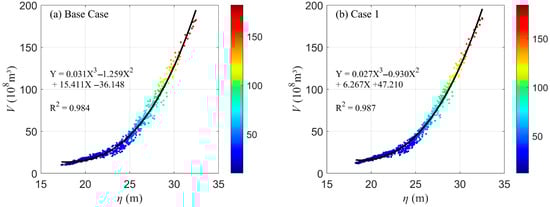
Figure 13.
The relationship between the water storage volumes in the DTL and the water level at the CLJ station: (a) Base Case; (b) Case 1.
5. Conclusions
This study employed a hydro-morphodynamic model to simulate the long-term evolution of the Lower Jing River–DTL system over a 30-year period. The model demonstrates good performance in reproducing key hydro-morphological indicators, including water levels, erosion and deposition volumes, and morphological evolution. In particular, the simulations revealed distinct morphological evolution patterns: sustained channel erosion occurred in the Jing River, totaling 462 million m3 over 30 years, whereas net deposition prevailed in the DTL area, reaching 276 million m3. Comparative scenario analyses yielded the following key conclusions:
(1) Morphological evolution exhibits significant spatial heterogeneity. The Jing River is characterized by progressive channel incision, whereas deposition within the DTL concentrates near tributary inlets and the deep channels of the EDL. This overarching spatial pattern remains qualitatively consistent even under a 50% reduction in upstream sediment supply, although sensitive local areas exhibit pronounced responsiveness to sediment changes.
(2) We found continuous incision of the Jing River intensifies the “draining effect” on the connected lake, resulting in significant water level declines during dry seasons. These declines exhibit a clear spatial gradient, diminishing from stations near the Jing River toward distal lake regions, with the YT–LJ–CLJ corridor in the EDL being particularly affected. This effect also produces a markedly greater reduction in lake surface area during dry periods than during wet periods.
(3) It is found that the combined impacts of ongoing sedimentation within the lake and mainstream incision progressively reduce DTL’s storage capacity, thereby critically impairing its flood regulation function. Quantitative assessments indicate that morphological evolution causes an average annual storage loss of approximately 0.0365 billion m3 during wet periods corresponds to approximately 0.2% of total lake volume per year, underscoring a significant threat to the basin’s flood mitigation capacity.
In summary, this study establishes a validated modeling framework and provides critical insights into the coupled dynamics of river erosion and lake sedimentation, highlighting their profound implications for future hydrological regimes and flood management in the region. Several aspects of the simulated behavior are likely generalizable beyond the Jing River–DTL system. First, persistent downstream incision tends to steepen water-surface gradients and enhance dry-season drainage of connected lakes, leading to disproportionate reductions in water level and effective wet area even when flood-season levels are only moderately affected. Second, inlets, deltas, and confluences act as morphodynamic hotspots where small changes in sediment supply can strongly modify local deposition and channel geometry. Third, the key feedbacks develop on decadal timescales, implying that cumulative morphological adjustment, rather than single events, governs long-term changes in regulation capacity. These three characteristics are expected in other sediment-limited, reservoir-regulated river–lake networks with comparable connectivity and boundary conditions.
Nevertheless, several limitations should be acknowledged. Firstly, long-term simulations are driven by repeated historical hydrological sequences in this study due to the lack of the sufficient data, which may not fully capture non-stationary future changes in discharge and sediment load due to climate variability and evolving reservoir operations. Additionally, future discharges and sediment loads are inherently uncertain; therefore, our scenarios should be interpreted as plausible trajectories that illustrate sensitivities and mechanisms rather than deterministic forecasts. Secondly, small tributaries, floodplain exchanges, and local engineering works are represented in a simplified manner. Finally, although sensitivity tests indicate that the main patterns are robust to key parameters, residual uncertainty remains in roughness, morphological acceleration, and sediment parameters in this study. These limitations are common to morphodynamic modeling of large regulated river–lake systems; and addressing them in future work for the Jing River–DTL system and comparable networks will further enhance the reliability and applicability of long-term morphodynamic projections.
Author Contributions
Conceptualization, B.L., Y.Y. and M.W.; Methodology, B.L., Y.Y. and M.W.; Software, B.L.; Validation, B.L.; Formal analysis, B.L.; Investigation, B.L. and Y.G.; Resources, Y.Y. and M.W.; Data curation, Y.G.; Writing—original draft, B.L.; Writing—review & editing, B.L.; Visualization, B.L.; Supervision, M.W.; Project administration, Y.G., Y.Y. and M.W.; Funding acquisition, M.W. All authors have read and agreed to the published version of the manuscript.
Funding
This research is supported by The National Key Research and Development Program of China (2022YFC3202601); The China Three Gorges Corporation Research Project (0704209); The Central Public-interest Scientific Institution Basal Research Fund (CKSF2025689/HL); The National Key Research and Development Program of China (2024YFC3214000).
Institutional Review Board Statement
Not applicable.
Informed Consent Statement
Not applicable.
Data Availability Statement
The data presented in this study are available on request from the corresponding author.
Conflicts of Interest
Author Yu Gao was employed by the company China Three Gorges Corporation. The remaining authors declare that the research was conducted in the absence of any commercial or financial relationships that could be construed as a potential conflict of interest.
References
- Daneshvar, A.; Svanfelt, J.; Kronberg, L.; Prévost, M.; Weyhenmeyer, G.A. Seasonal Variations in the Occurrence and Fate of Basic and Neutral Pharmaceuticals in a Swedish River–Lake System. Chemosphere 2010, 80, 301–309. [Google Scholar] [CrossRef]
- Liang, J.; Yi, Y.; Li, X.; Yuan, Y.; Yang, S.; Li, X.; Zhu, Z.; Lei, M.; Meng, Q.; Zhai, Y. Detecting Changes in Water Level Caused by Climate, Land Cover and Dam Construction in Interconnected River−lake Systems. Sci. Total Environ. 2021, 788, 147692. [Google Scholar] [CrossRef]
- Zhu, C.; Zhang, Y.; van Maren, D.S.; Xie, W.; Guo, L.; Wang, X.; He, Q. Modulation of Sediment Load Recovery Downstream of Three Gorges Dam in the Yangtze River. Anthr. Coasts 2023, 6, 2. [Google Scholar] [CrossRef]
- Ahmed, M.; Abdelrehim, R.; Elshalkany, M.; Abdrabou, M. Impacts of the Grand Ethiopian Renaissance Dam on the Nile River’s Downstream Reservoirs. J. Hydrol. 2024, 633, 130952. [Google Scholar] [CrossRef]
- Kondolf, G.M.; Schmitt, R.J.P.; Carling, P.; Darby, S.; Arias, M.; Bizzi, S.; Castelletti, A.; Cochrane, T.A.; Gibson, S.; Kummu, M.; et al. Changing Sediment Budget of the Mekong: Cumulative Threats and Management Strategies for a Large River Basin. Sci. Total Environ. 2018, 625, 114–134. [Google Scholar] [CrossRef]
- Gibson, S.; Shelley, J. Flood Disturbance, Recovery, and Inter-Flood Incision on a Large Sand-Bed River. Geomorphology 2020, 351, 106973. [Google Scholar] [CrossRef]
- Tian, Q.; Xu, K.H.; Dong, C.M.; Yang, S.L.; He, Y.J.; Shi, B.W. Declining Sediment Discharge in the Yangtze River From 1956 to 2017: Spatial and Temporal Changes and Their Causes. Water Resour. Res. 2021, 57, e2020WR028645. [Google Scholar] [CrossRef]
- Zhou, W.; Sun, Z.; Yang, Z.; Guo, G. Confluence Effects of Dongting Lake in the Middle Yangtze River: Discontinuous Fluvial Processes and Their Driving Mechanisms. Water Resour. Res. 2025, 61, e2024WR039030. [Google Scholar] [CrossRef]
- Lai, X.; Zou, H.; Jiang, J.; Jia, J.; Liu, Y.; Wei, W. Hydrological Dynamics of the Yangtze River-Dongting Lake System after the Construction of the Three Gorges Dam. Sci. Rep. 2025, 15, 50. [Google Scholar] [CrossRef]
- Li, Z.; Sun, Z.; Chen, L.; An, S. A Large-Scale Hydrological and Hydrodynamic Coupled Model for Flow Routing in the Yangtze-Dongting System. J. Hydrol. 2024, 641, 131768. [Google Scholar] [CrossRef]
- Yang, S.L.; Milliman, J.D.; Xu, K.H.; Deng, B.; Zhang, X.Y.; Luo, X.X. Downstream Sedimentary and Geomorphic Impacts of the Three Gorges Dam on the Yangtze River. Earth-Sci. Rev. 2014, 138, 469–486. [Google Scholar] [CrossRef]
- Lu, C.; Jia, Y.; Jing, L.; Zeng, Q.; Lei, J.; Zhang, S.; Lei, G.; Wen, L. Shifts in River-Floodplain Relationship Reveal the Impacts of River Regulation: A Case Study of Dongting Lake in China. J. Hydrol. 2018, 559, 932–941. [Google Scholar] [CrossRef]
- Yu, Y.; Mei, X.; Dai, Z.; Gao, J.; Li, J.; Wang, J.; Lou, Y. Hydromorphological Processes of Dongting Lake in China between 1951 and 2014. J. Hydrol. 2018, 562, 254–266. [Google Scholar] [CrossRef]
- Zhang, X.; Bai, L.; Xu, Z.; Jiang, C.; Chen, H.; Ye, C.; Ma, X.; Huang, Y. Impacts of Large Reservoirs on Downstream Lake Hydrological Regimes in Complex River–Lake Systems: A Case Study of the Three Gorges Reservoir and Dongting Lake. J. Hydrol. 2025, 661, 133694. [Google Scholar] [CrossRef]
- Cao, M.; Mao, K.; Shen, X.; Xu, T.; Yan, Y.; Yuan, Z. Monitoring the Spatial and Temporal Variations in The Water Surface and Floating Algal Bloom Areas in Dongting Lake Using a Long-Term MODIS Image Time Series. Remote Sens. 2020, 12, 3622. [Google Scholar] [CrossRef]
- Ji, H.; Wu, G.; Liu, Y. Sharp Change of Lake Levels during the Two Extreme Droughts and Its Hydroclimatic Processes in Lake Dongting, China. J. Lake Sci. 2016, 28, 207–216. [Google Scholar] [CrossRef]
- Dai, Z.; Fagherazzi, S.; Mei, X.; Gao, J. Decline in Suspended Sediment Concentration Delivered by the Changjiang (Yangtze) River into the East China Sea between 1956 and 2013. Geomorphology 2016, 268, 123–132. [Google Scholar] [CrossRef]
- Lai, X.; Yin, D.; Finlayson, B.L.; Wei, T.; Li, M.; Yuan, W.; Yang, S.; Dai, Z.; Gao, S.; Chen, Z. Will River Erosion below the Three Gorges Dam Stop in the Middle Yangtze? J. Hydrol. 2017, 554, 24–31. [Google Scholar] [CrossRef]
- Bing, J.; Deng, P. Hydrological Changes along the Jing River and Its Causal Analysis. IOP Conf. Ser. Earth Environ. Sci. 2021, 643, 012081. [Google Scholar] [CrossRef]
- Hu, D.; Yao, S.; Duan, C.; Li, S. Real-Time Simulation of Hydrodynamic and Scalar Transport in Large River-Lake Systems. J. Hydrol. 2020, 582, 124531. [Google Scholar] [CrossRef]
- Liu, Y.; Yang, S.-Q.; Jiang, C.; Long, Y.; Deng, B.; Yan, S. Hydrological Drought in Dongting Lake Area (China) after the Running of Three Gorges Dam and a Possible Solution. Water 2020, 12, 2713. [Google Scholar] [CrossRef]
- Li, X.; Huang, M.; Wang, R. Numerical Simulation of Donghu Lake Hydrodynamics and Water Quality Based on Remote Sensing and MIKE 21. ISPRS Int. J. Geo-Inf. 2020, 9, 94. [Google Scholar] [CrossRef]
- Hu, D.; Chen, Z.; Li, Z.; Zhu, Y. An Implicit 1D-2D Deeply Coupled Hydrodynamic Model for Shallow Water Flows. J. Hydrol. 2024, 631, 130833. [Google Scholar] [CrossRef]
- Li, L. Hydrodynamics of Jingjiang River and Dongting Lake as a Coupled System. Ph.D. Thesis, Tsinghua University, Beijing, China, 2009. [Google Scholar]
- Yang, B.; Shi, Y.; Luan, Z.; Jin, Q. Study on Super-Standard Flood Situation in Dongting Lake Area. Hydro-Sci. Eng. 2023, 2, 34–42. [Google Scholar] [CrossRef]
- Tian, H.; Ren, Z.; Yao, C.; Zhong, N.; Xia, C. Impact of Flow and Sediment Factor Selection on Downstream Channel Adjustments in the Lower Jingjiang Reach of the Yangtze River. Front. Environ. Sci. 2025, 13, 1554900. [Google Scholar] [CrossRef]
- Williams, R.D.; Measures, R.; Hicks, D.M.; Brasington, J. Assessment of a Numerical Model to Reproduce Event-Scale Erosion and Deposition Distributions in a Braided River. Water Resour. Res. 2016, 52, 6621–6642. [Google Scholar] [CrossRef] [PubMed]
- Schuurman, F.; Ta, W.; Post, S.; Sokolewicz, M.; Busnelli, M.; Kleinhans, M. Response of Braiding Channel Morphodynamics to Peak Discharge Changes in the Upper Yellow River. Earth Surf. Process. Landf. 2018, 43, 1648–1662. [Google Scholar] [CrossRef]
- Costabile, P.; Macchione, F. Enhancing River Model Set-up for 2-D Dynamic Flood Modelling. Environ. Model. Softw. 2015, 67, 89–107. [Google Scholar] [CrossRef]
- Lyu, B.; Li, J.; Hu, P.; Cao, Z.; Liu, H. High-Resolution Hydro-Sediment-Morphodynamic Modelling of a Meandering River Reach with Mid-Channel Bars on Multiyear Timescales: A Case Study of Shashi Reach in Middle Yangtze River. J. Hydrol. 2024, 635, 131167. [Google Scholar] [CrossRef]
- Singh, U.; Crosato, A.; Giri, S.; Hicks, M. Sediment Heterogeneity and Mobility in the Morphodynamic Modelling of Gravel-Bed Braided Rivers. Adv. Water Resour. 2017, 104, 127–144. [Google Scholar] [CrossRef]
- Hu, C.; Ruan, B.; Zhang, S. Evolution and Regulation of the Relationship Between the Yangtze River, Dongting Lake, and Poyang Lake; Science Press: Beijing, China, 2017. [Google Scholar]
- Wei, Q. Research on the Evolution of Runoff and Sediment Fluxes in Dongting Lake Under Changing Environment and Its Impacts; Tsinghua University: Beijing, China, 2022. [Google Scholar]
- Yao, S.; He, Z. River and Lake Evolution of the Middle and Lower Yangtze River Basin and Its Impacts. J. Chang. River Sci. Res. Inst. 2025, 42, 1. [Google Scholar]
- Song, P.; Fang, C.; Li, X. Study on Characteristics of Sediment Transport and Deposition Distribution Characteristics in Dongting Lake. J. Yangtze River Sci. Res. Inst. 2014, 31, 130–134. [Google Scholar] [CrossRef]
- Hu, D. Computational River Engineering; Tsinghua University Press: Beijing, China, 2024. [Google Scholar]
- Hu, C.; Fang, C.; Cao, W. Shrinking of Dongting Lake and Its Weakening Connection with the Yangtze River: Analysis of the Impact on Flooding. Int. J. Sediment Res. 2015, 30, 256–262. [Google Scholar] [CrossRef]
- Wang, Y.; Li, Z.; Tang, Z.; Zeng, G. A GIS-Based Spatial Multi-Criteria Approach for Flood Risk Assessment in the Dongting Lake Region, Hunan, Central China. Water Resour. Manag. 2011, 25, 3465–3484. [Google Scholar] [CrossRef]
- Hu, P.; Deng, S.; Zhao, Z.; Cao, Z.; Liu, H. Dredging Volume Estimation and Dredging Timing for Waterway Maintenance: A Case Study Using a Depth-Averaged Hydrosediment–Morphodynamic Model with Transient Dredging Effects. J. Waterw. Port Coast. Ocean. Eng. 2022, 148, 04022014. [Google Scholar] [CrossRef]
- Hu, P.; Lei, Y.; Deng, S.; Cao, Z.; Liu, H.; He, Z. Role of Bar-Channel Interactions in a Dominant Branch Shift: The Taipingkou Waterway, Yangtze River, China. River Res. Appl. 2021, 37, 494–508. [Google Scholar] [CrossRef]
- Meyer-Peter, E.; Müller, R. Formulas for Bed-Load Transport; IAHR: Stockholm, Sweden; Volume 3, pp. 39–64.
- Van Rijn, L. Mathematical Modelling of Morphological Processes in the Case of Suspended Sediment Transport; Tu Delft: Delft, The Netherlands, 1987. [Google Scholar]
- Hoey, T.B.; Ferguson, R. Numerical Simulation of Downstream Fining by Selective Transport in Gravel Bed Rivers: Model Development and Illustration. Water Resour. Res. 1994, 30, 2251–2260. [Google Scholar] [CrossRef]
- Luan, H.L.; Ding, P.X.; Wang, Z.B.; Ge, J.Z. Process-Based Morphodynamic Modeling of the Yangtze Estuary at a Decadal Timescale: Controls on Estuarine Evolution and Future Trends. Geomorphology 2017, 290, 347–364. [Google Scholar] [CrossRef]
- Brunner, G.W. HEC-RAS, River Analysis System Hydraulic Reference Manual Version6.0; US Army Corps of Engineers: Washington, DC, USA, 2020. [Google Scholar]
Disclaimer/Publisher’s Note: The statements, opinions and data contained in all publications are solely those of the individual author(s) and contributor(s) and not of MDPI and/or the editor(s). MDPI and/or the editor(s) disclaim responsibility for any injury to people or property resulting from any ideas, methods, instructions or products referred to in the content. |
© 2025 by the authors. Licensee MDPI, Basel, Switzerland. This article is an open access article distributed under the terms and conditions of the Creative Commons Attribution (CC BY) license (https://creativecommons.org/licenses/by/4.0/).