Abstract
Although numerous studies have investigated individual methods to improve the performance of solar air heaters (SAHs), such as flow obstruction barriers, porous media, nanofluids, and thermal energy storage units, the overall integration of these reinforcement strategies into a unified, sustainable system remains to be defined. The current study presents a hybrid solar air heating configuration that combines a solar air collector (SAC) with an electric air heater (EAH) powered by photovoltaic (PV) panels, aiming to stabilize outlet air temperature and enhance overall thermal efficiency. Experimental and numerical approaches were employed to evaluate the influence of barrier geometry (flat, trapezoidal, and V-groove) and airflow rate (53, 158, and 317 L/min) on system performance using three SAC models. Experimental results revealed that lower airflow rate promotes greater temperature rise (ΔT) due to longer air–surface contact, while V-groove barriers achieved the highest ΔT and collector efficiency among all configurations. At higher airflow rates, the absorbed energy factor Fc (τα) increased to approximately 0.73, whereas the heat loss factor FcU decreased, indicating reduced thermal losses and improved energy transfer. Model III demonstrated the most effective heat absorption, confirming its superior thermal design. The integrated SAC–EAH system exhibited improved overall efficiency, with the SAC functioning effectively as a preheating unit and the EAH sustaining thermal stability during variable solar conditions. Numerical results showed that the highest temperature difference occurs at the V-groove barriers at an air flow rate of 53 L/min. In contrast, the difference between inlet and outlet temperatures decreases across the remaining models, with reduced percentages of 11.8% and 12.7% for Model II and Model I, respectively. Numerical simulations ensured the experimental outcomes, showing close agreement with the temperature variation trends and validating the system’s enhanced thermal performance.
1. Introduction
Despite the development in the energy market regarding different types of fuels, they have many major problems, the most important of which is the pollution that they cause. All fossil fuels emit gases into the atmosphere, most of which are poisonous gases [1]. Fossil fuels have been used extensively in thermal energy production since the Industrial Revolution because they provide an easy way to obtain energy, but steps have been taken in the right direction. Solar energy is one of the most significant renewable energies [2,3]. Solar energy does not emit harmful gases into the atmosphere; instead, it uses a free source (the Sun), which is cheaper than fossil fuels and requires minimal infrastructure. The Sun provides about 89,000 TW to the Earth, and the energy consumption in 2018 was 18 TW [4]. Solar energy technologies are classified into two main types: active and passive techniques. Passive techniques are individual systems because they do not use any mechanical system to convert that energy. They convert solar energy into heat using additional energy sources. Active systems use mechanical devices to store solar energy or convert it into photovoltaic or thermal energy [5]. As in PV casing, thermal resistance greatly limits the thermal conductivity of ultrathin flexible heat pipes [6]. Solar air heaters (SAH) are used in several industrial, laboratory, and home activities, for example, work environment heating, drying, heating operations for industrial and agricultural products, herbal medicines, clothes, etc., and here the importance of SAHs appears, as they are low-cost and environmentally friendly [7,8]. The most critical factors affecting SAH performance are collector geometry (flow depth and collector length), absorption surface properties (material, color, and roughness), cover glass plate specifications (transparency, material, and thickness) [9], and fluid flow system type (either laminar or turbulent) [10,11,12,13,14]. The main problem facing SAH is that the temperature of hot air or other fluid drawn into the solar air heater varies daily. Increasing airflow or the absorption surface area within permissible limits improves the heat transfer rate of the SAH [15]. The increasing airflow will enhance heat transfer losses to the surroundings by increasing the pressure drop across the collector [16]. This represents one of the settlement methods using techniques to improve heat transfer to the SAH, such as inserting paddles into the air channel to allow sufficient time for heat transfer [17].
Esen [18] found that obstructions in air ducts significantly improved SAH thermal efficiency. This is due to the increased heat-transfer surface area along the flow path and around the finned absorber plate. Prabha and Sharma [19] demonstrated a significant improvement in thermal performance, increasing efficiency by about 18%, when the fin spacing was decreased from 4 cm to 1 cm at an air flow rate of 0.011 kg/s. At the same time, Krishnananth and Murugavel [20] studied a dual-pass SAH system with a paraffin wax TES, resulting in higher thermal efficiency. Chaban et al. [21] experimentally investigated the effect of changing the flow rate in SAH on the thermal performance. This study included the installation of longitudinally arranged fins in an air channel. The results show that at airflow rates of 0.012 and 0.016, the maximum efficiencies are 51.50% and 43.94%, respectively. Reddy et al. [22] studied the importance of sand-coated absorbent plates (0.075–0.250 mm in diameter). The maximum percentage increase in energy efficiency in sand-covered and high-temperature solar air collectors was 13% and 8.21%, respectively. Reddy et al. [23] conducted experiments on SAH using absorption plate shapes of a reverse trapezoid and a cross trapezoid. The authors showed that the absorbent plate with a cross-shaped, corrugated trapezoidal pattern was 30% more efficient than the inverse trapezoidal plate. Reddy et al. [24] conducted experiments on undulate plates for SAH using a new hybrid instrument to evaluate the energy-strain analysis. The results showed that at a mass flow rate of 0.00785 kg/s, the maximum power and thermal efficiencies were 11.58% and 37.22%, respectively. Gawande et al. [25] studied the thermal–hydraulic performance of SAH equipped with chamfered square ribs mounted on an aluminum absorber plate. Their study examined a wide range of rib pitch-to-height ratios (p/h = 7.14 − 17.86) and chamfer angles from 0° to 40°, while keeping the relative roughness height constant at h/H = 0.042. The results showed that the system achieved its highest thermo-hydraulic performance factor (TPF = 2.047) at a chamfer angle of 20°, p/h = 7.14, and Reynolds number of 15,000. In terms of heat transfer enhancement, the Nusselt number increased by a factor of 3.247 compared with a smooth duct, with ribs at p/h = 7.14 and a 40° chamfer at a Reynolds number of 15,000. However, this improvement was accompanied by a significant increase in flow resistance, with the friction factor rising to 4.247 times its original value under similar geometric and flow conditions at a Reynolds number of 3800. Qamar et al. [26] concluded that there is a direct relationship among solar radiation, mass flux rate, and the system’s thermal efficiency. The pilot study showed that 0.327 kW was produced, and the heat loss from SAH was reduced from 4.9 to 2.27 W/m2 K because the back and sides of the SAH were suitably insulated with polystyrene board (thermal conductivity 0.033 W m−1 K−1). The pressure drop across the SAH was measured at 0.0000434 bar, which is negligible. Mustafa et al. [27] examined the influence of fin configuration and airflow velocity on the thermal performance of an SAH. The results showed that for a single line of fins, outlet air temperatures of 48 °C, 47.5 °C, and 58.5 °C were achieved at an air speed of 1.7 m/s, whereas reducing the air speed to 0.9 m/s increased these temperatures to 52 °C, 57.5 °C, and 66 °C when two lines of fins were used. The system’s efficiency improved markedly with fin addition, rising by 28% for one fin line and 66% for two fin lines at 0.9 m/s, and by 27% and 51%, respectively, at 1.7 m/s. However, higher airflow velocities also intensified thermodynamic irreversibility: the average thermal energy destruction rate increased by 37.6% for the absorber plate, 60.6% for the working fluid, and 68.66% for the cover glass as the velocity rose from 0.9 m/s to 1.9 m/s. Overall, the velocity efficiency improved by 24.1% across the same velocity range, highlighting the trade-off between enhanced convective heat transfer and increased entropy generation.
Alomar [28] used two SAH models, one conventional and one with a porous material, and concluded that the highest efficiency, 67% for Model 2 and 60% for Model 1, was obtained at a mass flow rate of 0.02 kg/s. For all mass flow rate values, a larger temperature change is observed in the variable system than in the conventional system, where the exhaust temperature of Model 2 is higher than that of Model 1. The improvement in Model 2′s efficiency shows that the use of porous materials significantly affects heat exchange and, consequently, the heat transfer rate. Experimentally, Abdelkader et al. [29] evaluated the development of a new type of Flat-Plate Solar Air Heater (FPSAH) coated with CNTs and copper oxide (CuO) nanoparticles, which are etched into a black coating. They used the laws of thermodynamics (first and second laws) to evaluate energy/power efficiency. To manufacture a unique solar-selective coating with high solar absorption and low solar emission properties, a black coating was combined with carbon nanotubes and copper oxide. They reported that adding a black coating to carbon nanotubes/copper at 4% resulted in the highest solar absorption (0.964) and thermal emission (0.124). For the power/energy study of an SAH covered with an innovative solar-selective coating, four airflow velocities were evaluated. They recorded an approximately 24.4% increase in energy efficiency and found that SAH inlet and outlet temperatures improved by up to 22% on average. Moreover, compared with ordinary black-coated solar air heaters, 4% CNT/CuO black-coated solar air heaters exhibit higher efficiency at higher airflow rates. Increased airflow temperature near the outlet is the reason behind this.
Hu et al. [30] proposed a hybrid solar system that works independently without an external electrical source by incorporating PV panels and a thermal energy storage (TES) unit, and the thermal and electrical performance of the hybrid solar system with the TES unit was studied. The new design results showed that it could continuously output heat for 24 h a day by setting the airflow rate based on solar irradiance. The system’s average thermal efficiency is 52.73% throughout the day. Sharma and Debbarma [31] used the SAH system integrated with a thermal energy storage unit, using Phase Change Materials (PCMs) to improve thermal performance. The results are based on detailed system analysis and provide quantitative performance improvements for SAHs. Afaynou et al. [32] studied a hybrid PCM-based heat sink partially filled with aluminum MF at various height ratios (0, 1/3, 2/3, and 1) to address its limited heat storage capacity and increased system cost. They used the enthalpy–porosity method and thermal equilibrium model; two-dimensional transient simulations were performed with n-eicosane as the PCM. The results show that the PCM-based heat sink effectively manages electronic component temperature, with performance and heat transfer improving as the ratio increases. A filling ratio of 1.0 reduces the temperature by 16.3 °C (38%) and the PCM melting time by 1163 s (13.85%) compared to an unfilled normal case.
Although previous research has explored various methods to enhance the performance of solar air heaters, such as employing obstructing objects or porous materials, using nanoparticles, and integrating thermal energy storage systems, there remains a notable gap in comprehensively integrating and optimizing these techniques within a unified system. Specifically, the daily fluctuation in air temperature from the solar heater still needs to be improved by combining it with a sustainable solar energy source. The novelty of this study lies in the full integration of an SAC equipped with V-groove flow-obstructing barriers and an EAH powered directly by a photovoltaic (PV) system, forming a unified, self-sustaining hybrid configuration. While previous research has examined SACs with flow enhancements, SAC–TES combinations, or PV-powered heating systems individually, no existing studies have combined these three elements into a single operational framework. This work uniquely evaluates how flat, trapezoidal, and V-groove barriers enhance heat transfer within the SAC, how the PV-driven EAH compensates for temperature drops during low-solar-radiation periods, and how the combined system stabilizes the daily outlet air temperature. By analyzing the interactions among aerodynamic modification, electrical heating support, and solar–electric coupling, the study provides new insights into maintaining temperature continuity, reducing dependence on the grid, and improving overall thermal reliability, offering a practical pathway toward fully renewable, stand-alone air-heating systems. This work provides rigorous dual validation through both experimentation and computational fluid dynamics (CFD), with a focus on thermal performance analysis. This dual experimental–numerical approach enables a critical exploration of the underlying physical mechanisms, such as the interplay among flow resistance, thermal conductivity enhancement, and thermal stability dynamics.
2. Experimental Facility
This section describes the experimental arrangements used to analyze the performance of the solar air heater system, including the new design of a solar air collector and an electric air heater unit. A solar air collector was fabricated by filling it with barriers that create turbulent airflow. The experiments were performed on a solar air collector integrated with an electric air-heater unit fabricated from aluminum. So, these heaters were designed and fabricated. The description of the solar collector system analysis utilized, as well as the measurement system for characterizing the solar air collector and electric air heater unit performance, data collection, and uncertainty analysis, will also be illustrated in this section.
2.1. Design and Fabrication of Solar System
The solar heating system comprises two primary components: an innovatively designed solar air collector (SAC) and an electric air heater unit (EAH). The collector’s efficiency is mainly influenced by the solar radiation incident on its front surface, which, in turn, depends on the collector’s surface area and the absorber materials’ properties. To maximize thermal gain, it is recommended that the collector be placed in an open area and that air be used as the working fluid to absorb solar energy. Air serves as the absorption medium in this setup, while the collector cover, ideally made from a highly permeable material such as glass, enhances thermal performance. The system is positioned at a 45° inclination to optimize solar exposure throughout the day. The enhanced design incorporates barriers that create turbulent airflow, thereby improving heat transfer via vortices generated in the collector channel. This is effective because the air’s flow velocity is generally greater in collectors without these barriers. In this study, new configurations, varying in geometry and location, were tested. The geometry of the solar heating system for these configurations is detailed as follows:
SAC Models: The collector body is designed and fabricated from aluminum and measures 990 × 1640 × 100 mm. Three barrier models were fabricated and tested (flat, trapezoidal, and V-groove). All models were filled with 25 barriers. The barrier dimensions in Model I were 10 cm × 4 cm, arranged in parallel rows. In comparison, Model II had an arc length of 10 cm and a height of 4 cm. Finally, Model III was filled with 25 V-groove barriers, and a group of equal-sided triangles forms the V-shaped geometry. The 25 barriers were formed from 200 × 40 × 2 mm aluminum strips bent in half to create two sides of an equilateral triangle at a 60-degree angle. These barriers were fixed in parallel rows to the solar collector channel, as shown in Figure 1a. The collector has an open bottom for inlet air and a circular outlet on the upper side with a 75 mm diameter. The aluminum absorber is 0.7 mm thick. In this arrangement, air enters through the bottom channel between the absorber plate and the glass. The detailed specifications of the solar air collectors selected for the experiments are given in Table 1.
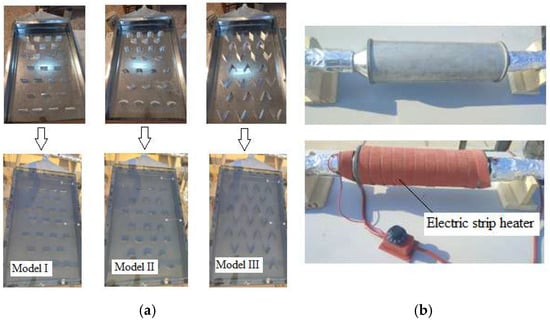
Figure 1.
Structural images of the solar system: (a) SAH models and (b) EAH model.

Table 1.
Specifications of the solar air collector and the electric air heater.
EAH Model: The second part of the solar energy system is the EAH, a cylindrical pipe with a 200 mm diameter and 600 mm length, made of aluminum, designed to accommodate 10 disks in an incomplete area; they were fixed at equal distances inside the pipe in a way that formed a winding path for the air to pass through, while the ends of the electric heater had a diameter of 75 mm, as shown in Figure 1b. A 3 cm wide, 500 cm long strip heater is wound on the outer wall of a cylindrical pipe, with a power of 3000 W. The detailed specifications of the electric air heater selected for the experiments are given in Table 1.
2.2. Experimental Setup
The experimental work was conducted on a clear, sunny day from 7:00 AM to 7:00 PM at the University of Technology in Iraq, located at 33.3123° N, 44.446° E. The experimental arrangement is illustrated in Figure 2. The system consists of four important parts: the solar air collector, the electric air heater, the electric power generator from solar cells, and the axial air impeller (blower fan). The specifications of the solar air collector and electric air heater are provided in Table 1. The solar heating system is equipped with an axial blower fan at the outlet of the SAC. The blower fan draws air in such a way that it circulates the air within the system as needed, and the voltage regulator controls its speed (air mass flow rate). The fan characteristics were an HF-100 model, 35 W, 2600 RPM, and 220 m3/h flow. A solar-powered generator provided the electrical energy needed to heat the air to the required temperature.
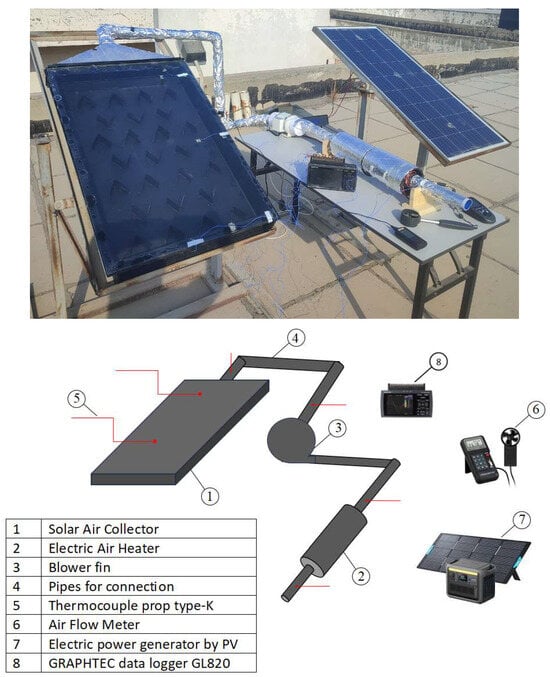
Figure 2.
Experimental setup visualization.
2.3. Measuring Instruments and Uncertainty Analysis
To measure the temperatures in the SAC, type K thermocouples were used. Two thermocouples were installed on the glass of the solar collector at a mid-point along the collector surface. Also, the air temperature is measured at the inlet and outlet of the SAC using sensors installed at the inlet and outlet of the collector. To measure the temperatures in an electric air heater, two thermocouples were installed at the inlet and outlet of the heater container. The remaining three were distributed throughout the system to measure the increase in temperature. The ambient temperature, Tamb, was also measured. All thermocouples were calibrated at 100 °C; the highest error value recorded was 1.26 °C. The airflow meter was used to measure the air velocity. To control air velocity throughout the solar system, a variac was used to adjust the blower power to achieve the required flow rate. Airflow uniformity inside the SAC was verified experimentally by recording air velocity at multiple points across the inlet and outlet sections, ensuring that variations remained within ±5–10% for all flow rates. Due to the combined thermal inertia of the SAC and the delayed electrical response of the PV-powered EAH, the integrated system exhibits a response time of approximately 4–10 min under sudden drops in solar irradiance. The root-mean-square method was used to calculate the uncertainty [1]. The minimum and maximum values were determined from the collected values of the hybrid system components, each of which is an accuracy value.
Table 2 presents the uncertainty analysis for the key measured parameters used in the experimental investigation. The parameters include the collector surface temperature, air temperatures at the inlet and outlet of both the SAC and EAH, and the air flow rate. The collector surface temperature was measured with an accuracy of ±1.1 °C, and its relative uncertainty ranged from 1.041% to 0.882% over the temperature range of 23 °C to 68 °C. The air temperature measurements, with an accuracy of ±1.31 °C, showed relative uncertainties of 1.18–1.01% for the SAC and 1.22–1.04% for the EAH across temperature ranges of 31–89 °C and 34–89.4 °C, respectively. The airflow rate, measured with an accuracy of ±0.04 L/min, exhibited the lowest uncertainty, ranging from 0.244% to 0.189% for flow rates between 53 and 211 L/min. These results indicate that all measurement uncertainties are within acceptable limits, confirming the reliability of the experimental data and ensuring confidence in the performance evaluation of the solar air heating system.
Table 2.
Uncertainty values of the measured parameters.
2.4. Data Collection
The parameter data was recorded sequentially. First, the sensors were correctly connected and isolated from the external environment. Second, air was introduced into the solar air collector, then into the electric air heater unit, and all readings were recorded. Third, we sequentially change the collector models and airflow rates at several stages, and record the readings. The experimentally recorded data are described in Table 3.
Table 3.
Data collection for solar system, SAC, and EAH.
To calculate the Nusselt number, the heat transfer coefficient is calculated as [23,24]
where Ac is the collector surface area, and Tm is the difference between the collector surface temperature and the air temperature. Due to the air channel’s different structure, it is not easy to control the bulk temperature of the air. In this analysis, ΔTm is obtained by measuring the mean temperature between the inlet and outlet flow in the solar collector, as follows [24]:
The Nusselt number based on the hydraulic dimension is obtained as [23]
where de is the collector cross-sectional hydraulic dimension, and k is the thermal conductivity of the air. To calculate the useful heat gain, the heat gain of the air in the solar collector can be determined regarding the efficiency curve slope parameter, FcU, and the absorbed energy parameter, Fc (τα), based on [23].
The collector efficiency is determined primarily by three parameters: incident solar radiation, collector area, and the useful heat the collector gains [23].
where ηc is the efficiency of the collector, G is the incident solar radiation, Ac is the area of the collector, and Qu is the useful heat gained by the collector. ηc is defined as [24].
The heat gained by the working fluid parameters is the mass flow rate, , the heat capacity, Cp, and the change in the air temperature .
The efficiency of an electric air heater unit was assessed by comparing the useful energy to the input electrical energy (voltage × current) [24,25]. The EAH unit efficiency was calculated using the following equation:
3. Numerical Analysis
The heat transfer enhancement and performance of a solar heating system can be simulated using CFD, a specialized computational tool in COMSOL Multiphysics v6.1. The performance evaluation criteria for three types of absorber plates (flat, trapezoidal, and V-groove) were developed, and the maximum efficiency was achieved. The results can be helpful as an economic support for the future commercial and residential applications of porous media-assisted solar air heating. Another goal of this simulation is to determine the maximum possible heat rate from a hybrid system combining a solar air collector and an electric air heater powered by PV-generated electricity, with different barrier shapes. Figure 3 presents the numerical analysis processes.
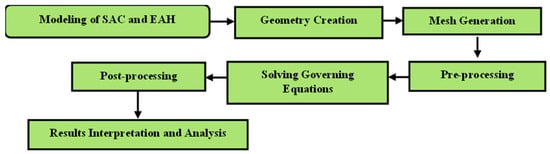
Figure 3.
Numerical analysis flowchart.
3.1. Geometry Creation and Mesh Generation
The first step in analyzing any engineering system is constructing a geometric model, which serves as the basis for the required modeling domain. Analyzing thermal systems based on their geometric form is essential, especially for energy-saving systems, including uniform element dimensions and different shapes, as is the case with barriers with other distributions. Therefore, it is necessary to rely on geometric extrapolation through modern engineering programs. This modeling comprised two parts: the SAC and EAH models.
SAC Model: The model was built by defining two geometric fields for the solid components, the glass cover and the aluminum absorber, and one fluid field for the air. The length of the three models is 1640 mm, and the width is 990 mm. The glass cover is 4 mm thick, the aluminum absorber is 0.7 mm thick, and the collector opening area is ~0.1 m2. In this arrangement, air enters through the bottom channel (first passage) between the absorber plate and glass cover. In the present work, the flat plate DP-SAC computational domain is used with temperature points. Figure 4a shows the computational domain of the SAC model.
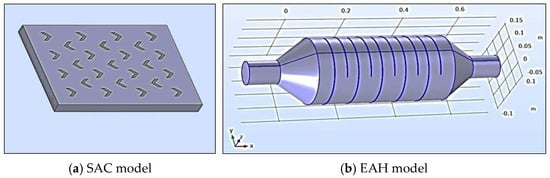
Figure 4.
Computational domain of the SAC and EAH models.
EAH model: The study’s electric air heater unit (EAH) consists of a cylindrical container that accommodates 10 disks with an incomplete area, serving as a winding path for airflow. The cylindrical container measures 300 mm in diameter and 600 mm in length, while the ends of the electric heater have a diameter of 75 mm. The computational domain of the EAH is depicted in Figure 4b.
A computational fluid dynamics model was used to simulate heat transfer by absorption through the absorbent plate, which was loaded with airflow-blocking barriers. Unstructured tetrahedral meshes were used to model the air domain. An irregular tetrahedral mesh was adopted due to the model’s complex geometry. A finite-volume method is adopted here, in which the domain of interest is divided into smaller geometric elements. The mesh accommodates tetrahedral elements in 3D. Consideration was also given to eliminating the effect of mesh size by creating an independent solution. The optimal mesh size was chosen because increasing the mesh parameter size did not affect the results. Figure 5 shows the 3D meshed geometry of the models for the solar heating system. The final mesh model produced accurate results in numerical simulations, which are more suitable for comparing heat gain within the collector and for identifying the working fluid velocity and temperature distribution. Finally, the fine-mesh model was used for simulations and analysis.
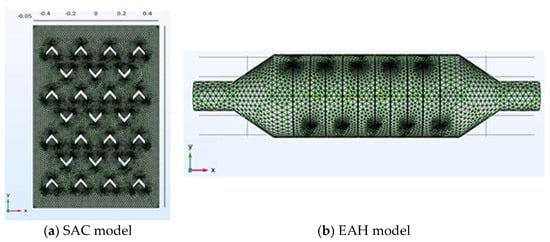
Figure 5.
Geometrical mesh of the models: SAC and EAH.
Mesh independence: The computational processes were carried out for five selected grid sizes for models SFC and EAH; the summary of the grid independence test results is shown in Table 4. We observed that the results of outlet air temperature from the SFC produced almost identical results when using nodes 919,551 and 998,171. Hence, a domain with 919,551 nodes was chosen to increase computational accuracy and reduce computation time. Additionally, it was observed that the air temperature results from the EAH produced almost identical results when using nodes 318,362 and 398,664. Figure 6 shows how to validate the mesh independence of the numerical simulation by plotting the simulated air temperatures as the mesh density (i.e., number of nodes) increases. Two parameters are being monitored: the outlet air temperature from the SAC and the EAH. For the SAC, the outlet air temperature ranges from approximately 46 °C to 55 °C. As the number of nodes increases beyond about 600,000 the SAC outlet temperature declines slightly and then stabilizes, indicating that grid refinement has minimal impact beyond this resolution. This suggests that the SAC reaches a steady-state numerical solution with an outlet temperature limit around 50 °C, reflecting the collector’s effective thermal performance. For the EAH, the outlet air temperature ranges from 80 °C to 100 °C, resulting in higher thermal output than the SAC due to the direct electrical heating source. As the number of nodes increases, the outlet air temperature trend stabilizes after a slight initial variation, similar to SAC. The limiting outlet air temperature for EAH is therefore around 90 °C, which reflects the steady-state performance of the electrical heating system.
Table 4.
Mesh independence.
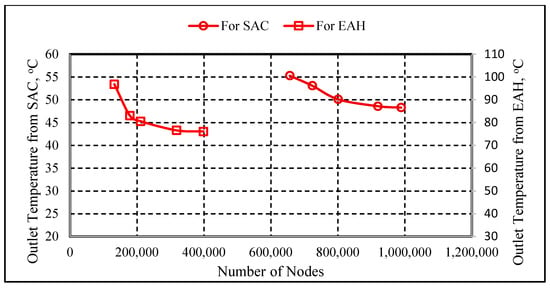
Figure 6.
Variation in air temperature with number of nodes.
3.2. Governing Equations
The computational analysis is based on the fundamental governing equations of fluid dynamics, which include the conservation of mass (continuity), momentum (Navier–Stokes), and energy. These equations were adapted for a three-dimensional, steady-state, incompressible, and viscous fluid flow regime to represent the physical behavior within the system accurately. Numerical solutions were obtained using the COMSOL commercial CFD software Version 6.1 (v6.1), employing a finite volume approach. The simulation setup and solver parameters were configured following established practices and prior studies, as referenced in [18,21]. This approach enables the precise evaluation of heat transfer, fluid motion, and thermal energy storage performance within the solar collector and EAH models. This analysis depends on many assumptions:
- ▪
- Steady model, 3D, and single-phase fluid.
- ▪
- The k-ε turbulence model is considered suitable for the barrier models in the collector.
- ▪
- The heat transfer by radiation and slip at the wall is considered negligible.
- ▪
- The barriers are distributed at the inner surface of the collector, and the uniform heat flux on the collector’s wall is considered.
Continuity equation:
Momentum equations in x–y and z-directions are given by Equations (11)–(13), respectively.
The velocity components in the x, y, and z directions are u, v, and w, respectively. In the y-direction, only the gravitational effect appears. And ρ is the density value. In the case of stable pressure for any fluid, the assumption is for incompressible fluid flow. For a slight temperature change, the fluid viscosity, μ, is constant and is assumed to be a Newtonian fluid [21]. At the same time, the viscosity effect cannot be neglected when the flow occurs inside a relatively long conduit. Table 5 presents the boundary conditions for SAC and EAH simulations.
Table 5.
Boundary conditions for SAC and EAH simulations.
The energy equation is
where β is the coefficient of thermal expansion, defined as
where the thermal conductivity and the heat capacity of water are k and Cp, and are assumed constant due to no significant change in the temperature during the heat transfer process, and
4. Results and Discussion
The acquired data from experimental measurements and numerical simulations were clustered to highlight the effects of changing the shape of barriers in the collector design and the air flow rate on the improvement in the heat transfer rate, the thermal efficiency of the collector, and the enhancement of SAC when integrated with EAH. Firstly, the experimental results are presented. The second subsection presents the numerical results, while the third subsection provides validation of the numerical modeling.
4.1. Experimental Results
Figure 7 shows the effect of different SAC models on the diurnal variation in air temperature difference (ΔT = Tout − Tin) at air flow rates of 53 and 317 L/min. It compares three models: Model I, Model II, and Model III. The findings indicate that Model III demonstrates superior thermal performance, likely due to a more favorable V-groove shape and thermal absorption period. Model I (flat shape) performs the worst, indicating lower thermal absorption or less optimal structural properties. All models exhibit a similar diurnal pattern: ΔT increases gradually during the morning, peaks around noon to early afternoon (12:00–14:00), and then declines toward the evening. At a flow rate of 53 L/min (Figure 7a), Model III consistently shows the highest ΔT across the entire time span, reaching a peak of approximately 14.1 °C. Model II follows closely with a slightly lower peak (~11.8 °C). Model I delivers the lowest ΔT throughout the day, peaking just below 9.7 °C. At a flow rate of 317 L/min (Figure 7b), the behavior remains consistent, recording lower ranges for the highest ΔT of 9.8 °C, 8.1 °C, and 7.2 °C for Models III, II, and I, respectively. Generally, the role of the V-groove barriers was to increase flow disturbances, enhance turbulence intensity, and promote more vigorous mixing of the air stream. These effects collectively reduce the thickness of the thermal boundary layer along the absorber surface, allowing more efficient convective heat transfer. Consequently, the higher turbulence and improved thermal interaction led to increased absorber plate temperature, greater energy extraction, and higher system efficiency.
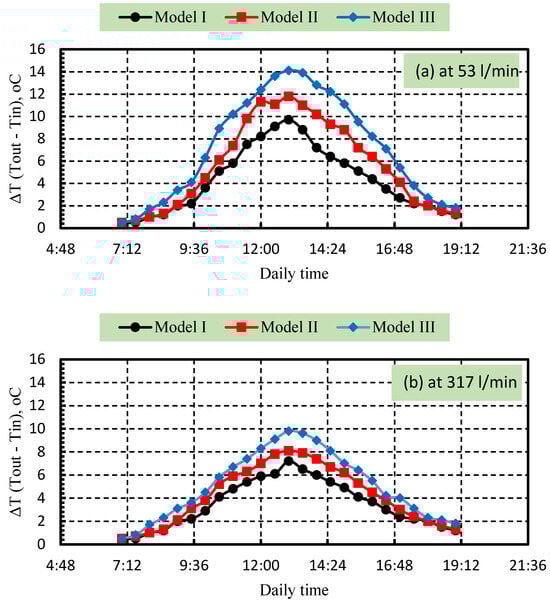
Figure 7.
Variation in ΔT for different SAC models (a) at a flow rate of 53 L/min, and (b) at a flow rate of 317 L/min.
Figure 8 illustrates the effect of different air flow rates (53 to 317 L/min) on the maximum temperature difference (ΔT) for three SAC models. The results demonstrate that lower flow rates enhance heat transfer, resulting in higher ΔT values due to prolonged air contact time with the heated barriers. Model III consistently yields the highest ΔT across all flow rates, confirming its superior thermal performance. Model II follows, showing slightly lower ΔT values. Model I lags, performing the worst at all flow rates. At 53 L/min, Model III achieves a ΔT of around 14 °C compared to approximately 12 °C and 10 °C for Models II and I, respectively. Even at a higher flow rate of 317 L/min, Model III maintains a higher ΔT (~9 °C) than the other models (~8 °C for Model II and ~7 °C for Model I), reinforcing the inverse relationship between flow rate and heat gain. Increasing the airflow rate decreases the outlet temperature rise because the absorbed heat is distributed over a larger mass of air. However, higher airflow enhances convective heat transfer, lowers absorber temperature, and reduces heat losses, thereby increasing the absorbed energy factor. This results in a trade-off between temperature rise and useful power. The optimal airflow rate is selected by maximizing the useful heat gain while maintaining a sufficient outlet temperature for the intended application.
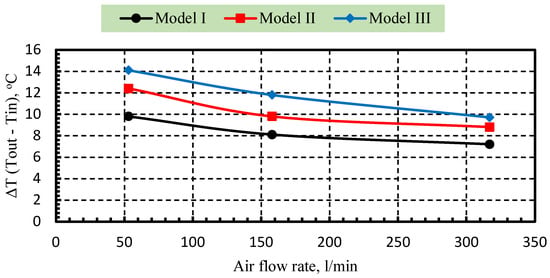
Figure 8.
Variation in the maximum air ΔT for different SAC models at various flow rates.
Figure 9 compares the collector efficiency for three different heated barrier models at three different flow rates: (a) 53 L/min, (b) 158 L/min, and (c) 317 L/min. Efficiency is plotted against the dimensionless temperature parameter (Ti-Ta)/G (m2.k/W). The results show that the collector efficiency decreases with increasing (Ti-Ta)/G. This is typical behavior in solar air collectors, as the thermal losses become more significant at higher temperature differences. Model III consistently shows the highest efficiency across all flow rates due to its complex shape, which impedes flow and results in a long thermal absorption period; this aligns with the results reported by Reddy et al. [22]. Model II (trapezoidal) performs better than the flat model (Model I) but is slightly lower than Model III due to its simpler form, which reduces the contact area and thermal absorption period. As the flow rate increases from 53 to 317 L/min, the overall collector efficiency for all models decreases. This is due to lower thermal residence time—the air spends less time in contact with the heated barriers, reducing heat absorption. At 53 L/min, the thermal absorption is better, and models reach higher efficiency faster (i.e., flatter curve drop).
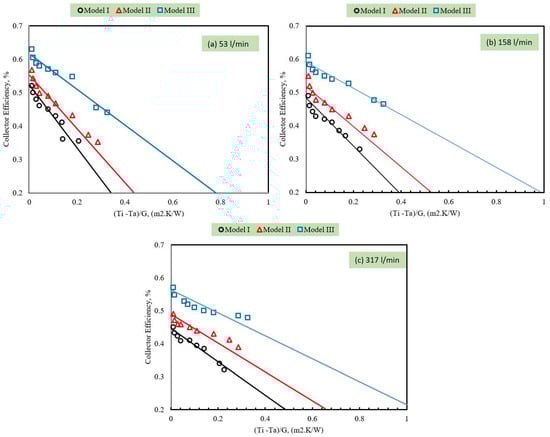
Figure 9.
Effect of heated barriers shape on collector efficiency at different air flow rates: (a) 53 L/min, (b) 158 L/min, (c) 317 L/min.
Figure 10 compares the thermal efficiency of two barrier types, (a) Model III (V-groove) and (b) Model I (flat), at three water flow rates. The data clearly show that collector efficiency declines as the (Ti-Ta)/G parameter increases, consistent with classical thermal-loss theory in solar collector analysis. Furthermore, Model III outperforms Model I at all flow rates due to the barrier’s shape, higher thermal absorption, and longer heat transfer period. Lower air flow rates (53 L/min) consistently deliver better thermal performance because the air has more time to absorb heat from the heated barriers. Model III (Figure 10a) exhibits the highest efficiency values at 53 L/min, which gradually decrease as the temperature parameter increases. As the flow rate increases to 158 and 317 L/min, efficiency curves shift downward. The collector operates more efficiently at lower flow rates, confirming that a longer air residence time in the V-groove barriers enables greater heat gain. Model I (Figure 10b) exhibited similar decreasing trends with increasing (Ti-Ta)/G. Overall efficiency values are lower than those for Model III at all flow rates. The difference between the curves (53, 158, and 317 L/min) is more pronounced, suggesting that the shape of heated barriers makes it more sensitive to flow rate variation.
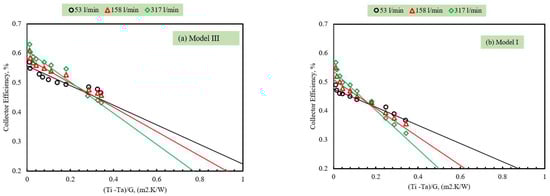
Figure 10.
The variation in collector efficiency with the temperature parameter (Ti-Ta)/I (m2.k/W) at different air flow rates: (a) Model III and (b) Model I.
Figure 11 shows the impact of airflow rate on key thermal performance indicators of solar collectors. The findings showed that higher airflow rates enhance the absorbed energy parameter Fc (τα) while reducing the slope parameter FcU, thereby improving energy transfer efficiency and reducing thermal losses. Figure 11a illustrates the variation in the absorbed solar energy parameter across three distinct airflow rates (53, 158, and 317 L/min) for models I, II, and III. For all models, Fc (τα) increases steadily with increasing airflow rate, indicating improved solar energy absorption at higher airflow rates than at lower ones. Model III consistently shows higher Fc (τα) values than Model I, suggesting that its structural design is more effective in enhancing solar energy absorption under all airflow rates. The maximum enhancement is observed at an airflow rate of 317 L/min for all models, but is particularly pronounced in Model III, where it approaches 0.73. The results suggest that a higher airflow rate improves thermal absorptivity due to the complexity of the air path within the collector. Figure 11b displays the variation in the efficiency curve slope parameter, FcU, also known as the overall heat loss coefficient times collector efficiency factor, for the same models and airflow rates. Unlike Fc (τα), the FcU parameter decreases with increasing airflow rate across all models.
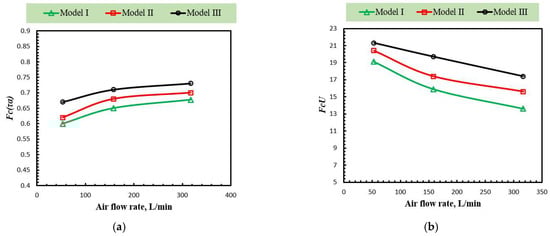
Figure 11.
The variation in the collector efficiency characteristics with air flow rates: (a) Fc (τα) and (b) FcU.
Figure 12 presents the variation in outlet air temperature from the EAH integrated with SAC (Model III) under different airflow rates (53, 158, and 317 L/min) throughout the day. The temperature profile for all cases increases from early morning until around solar noon, then gradually decreases toward evening as solar radiation diminishes. At the lowest flow rate of 53 L/min, the outlet temperature reaches the highest peak of approximately 140 °C near midday. This occurs because the lower air mass flow results in a longer residence time in the absorber, enabling the air to absorb more thermal energy. Conversely, as the airflow rate increases to 158 L/min and 317 L/min, the outlet temperature decreases to around 120 °C and 110 °C, respectively. The reduction in outlet temperature with increasing flow rate is attributed to the enhanced convective heat removal, which distributes the absorbed heat over a larger air volume, resulting in a lower temperature rise per unit mass. Despite lower outlet temperatures at higher flow rates, these conditions generally enhance the system’s overall thermal efficiency because the total energy transfer to the air increases with greater mass flow. The consistent trend across all curves demonstrates Model III’s good thermal response to varying flow conditions, indicating stable operation and effective heat absorption during peak solar hours.
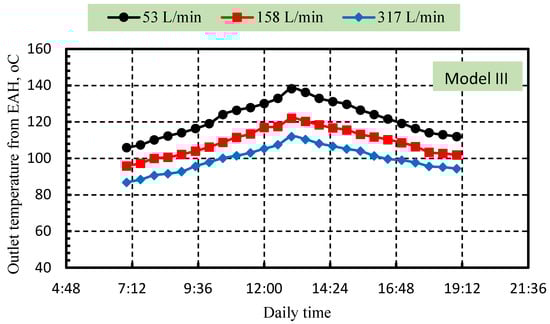
Figure 12.
Variation in outlet air temperature from EAH with daily time for an open system with airflow rates of 53, 158, and 317 L/min, integrated with Model III.
Figure 13 illustrates the variation in absorbed energy for both the SAC and the EAH throughout the day at three airflow rates of 53, 158, and 317 L/min. In general, both systems exhibit a similar diurnal trend that mirrors the solar radiation profile: absorbed energy rises steadily from the morning, peaks around solar noon (12:00–1:00 PM), and then gradually declines toward evening as solar intensity decreases. For the EAH, the absorbed energy is significantly higher than that of the SAC at all times of the day, confirming its superior capacity for thermal energy capture and storage. The highest absorbed energy in the EAH occurs at the largest airflow rate of 317 L/min, reaching approximately 370–380 W, followed by 158 L/min (around 200–220 W) and 53 L/min (roughly 80–90 W). This trend indicates that increasing airflow enhances convective heat transfer within the EAH, allowing more heat to be extracted from the absorber surface despite a lower temperature rise per unit of air. In contrast, the SAC shows lower absorbed energy values overall, with maximum midday peaks of approximately 65 W at 317 L/min, 40 W at 158 L/min, and 15 W at 53 L/min. The increase in absorbed energy with a higher airflow rate again reflects improved heat transfer efficiency and reduced temperature stratification within the collector. The combined observation suggests that while the EAH dominates total heat absorption, the SAC contributes as a primary preheating stage, improving overall system efficiency when operated with sufficient airflow. Therefore, higher air flow rates (317 L/min) provide the most favorable performance for both SAC and EAH, ensuring effective utilization of solar energy and stable heat delivery throughout the operating day.
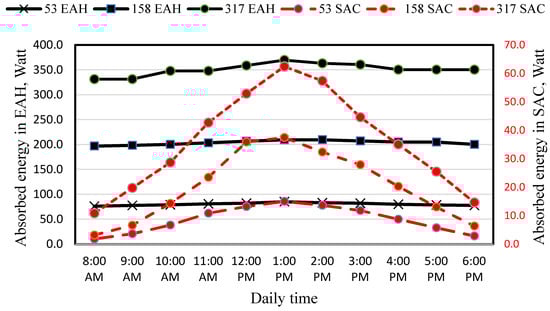
Figure 13.
Variation in absorbed energy in SAC and EAH with daily time for airflow rates of 53, 158, and 317 L/min.
4.2. Numerical Results
Figure 14 shows the contours of temperature distribution of the Model III collector for a flow rate of 53 L/min (a) at 7 a.m., (b) at 12 p.m., and (c) at 7 p.m. The results show that when air absorbs heat into the collector, the temperatures decrease. Still, at the exit, the air temperature increased due to suction and heat absorption within the V-groove design shown in the figure. It was noticed that the contour temperature rose as it approached the top.
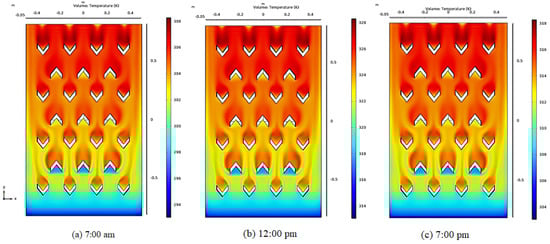
Figure 14.
Contours of temperature distribution for Model III collector at airflow rate 53 L/min.
Figure 15 shows the relationship between (∆T) and time during the day. The numerical program shows that, when cooling with air and using different models, the highest difference occurs at the V-groove barriers at an air flow rate of 53 L/min. Numerical results showed that the difference between inlet and outlet temperatures decreases across the remaining models, with reduced percentages of 11.8% and 12.7% for Model II and Model I, respectively.
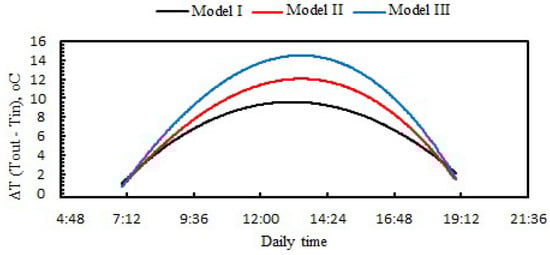
Figure 15.
Simulated difference in air temperature between the inlet and output for the SAC models at an airflow rate of 53 L/min.
Figure 16 shows temperature distribution contours in the EAH for airflow rates of 53, 158, and 317 L/min. From the theoretical program, we note that when heating the air by passing it through the electric heater, the outlet temperatures increased, and the air absorbed heat when using the zigzag design.
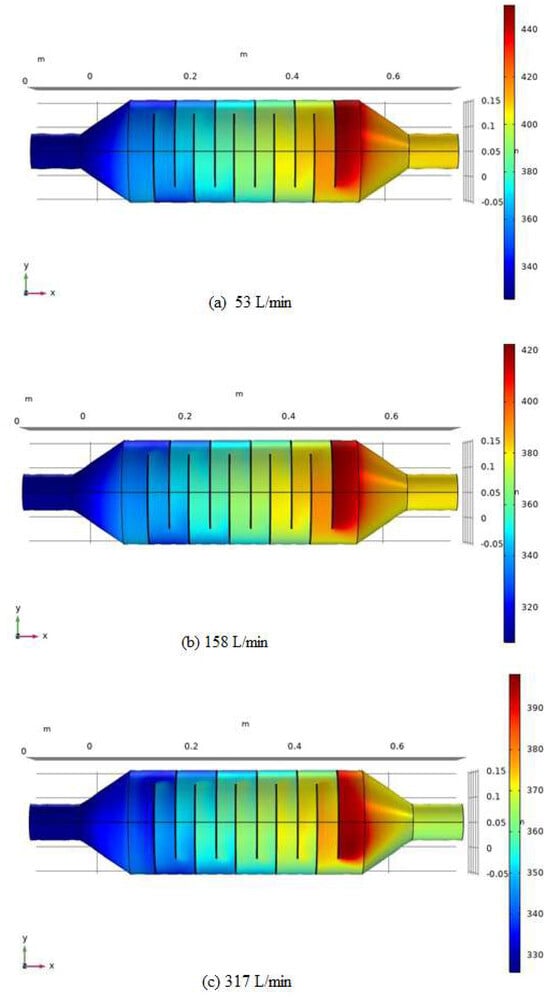
Figure 16.
Contours of temperature distribution for EAH model: (a) at 53 L/min, (b) at 158 L/min, (c) at 317 L/min.
4.3. Validation of Numerical Modeling
The validation results from Figure 17 strongly support the accuracy and reliability of the developed numerical models for both the SFC and EAH components. Depending on the Root Mean Square Error (RMSE), the maximum deviations between numerical and experimental results ranged from 7.7% to 8.4%, within acceptable engineering error margins. Figure 17 plots the SAC efficiency as a function of the reduced temperature parameter (Ti-Ta)/G for both Model III and Model I at a flow rate of 53 L/min. The experimental and numerical results follow the same trend, showing a decrease in efficiency with increasing reduced temperature, as expected, due to greater heat losses at higher temperature differentials. Model III’s maximum deviation between experimental and numerical efficiency values is 5.6%. For Model I, the maximum deviation is 4.8%. These differences are within acceptable limits for engineering simulations, validating that the numerical model reliably captures the thermal behavior of both barrier configurations under varying operating conditions.
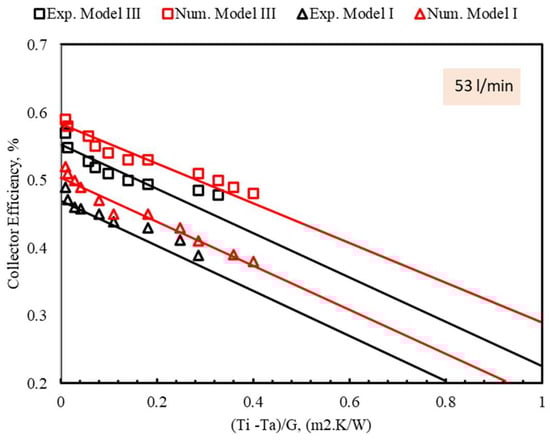
Figure 17.
Comparison between numerical and experimental SFC efficiency values.
5. Conclusions
This work describes an experimental and numerical analysis of the influence of changing barrier shape and flow rate on thermal performance in an SAC integrated with EAH, using a three-model SAC design. The temperature distribution for different air flow rates with flat, trapezoidal, and V-groove barriers installed along the air path of the SAC has been studied. The following conclusions are drawn:
- ▪
- Results showed that lower flow rates enhance heat transfer, resulting in higher ΔT values due to prolonged air contact time with the heated barriers. V-groove barriers consistently yield the highest ΔT across all airflow rates, confirming their superior thermal performance.
- ▪
- The collector efficiency results show that it operates more efficiently at lower flow rates, confirming that a longer air residence time in the V-groove barriers enables greater heat gain.
- ▪
- Results demonstrated that increasing airflow enhances the absorbed energy factor Fc (τα) while reducing the heat loss factor FcU, leading to better energy transfer and lower losses. Among the three models tested (I, II, and III), Model III consistently yields the highest Fc (τα) values, indicating superior energy-absorption performance. The greatest improvement occurs at the highest airflow rate of 317 L/min, where Fc (τα) reaches about 0.73. Conversely, FcU decreases with increasing airflow rate across all models, indicating reduced thermal losses and improved overall efficiency at higher airflow rates.
- ▪
- The results suggest that while the EAH dominates total heat absorption, the SAC contributes as a primary preheating stage, improving overall system efficiency when operated with sufficient airflow.
- ▪
- Numerical results showed that the highest temperature difference occurs at the V-groove barriers at an air flow rate of 53 L/min. In contrast, the difference between inlet and outlet temperatures decreases across the remaining models, with reduced percentages of 11.8% and 12.7% for Model II and Model I, respectively.
The findings of this study suggest that, as a future path to improve the hybrid system, we need to focus on the following:
- ▪
- In economic feasibility and cost analyses, future research should include a comprehensive techno-economic assessment to balance the performance benefits with the added costs of barrier fabrication and the electricity generated by PV panels.
- ▪
- Thermal energy storage (TES) is a key to commercial adoption, as it provides continuous heating. Further experimental work should examine the integration of TES with SAH.
Author Contributions
Conceptualization, H.N.O.A.-a.; Methodology, M.A.M.A.-J.; Software, H.A.A.W. and H.N.O.A.-a.; Validation, M.Ö.; Formal analysis, H.N.O.A.-a.; Investigation, H.A.A.W. and C.Ö.; Resources, M.A.M.A.-J. and H.N.O.A.-a.; Data curation, H.A.A.W. and C.Ö.; Writing–original draft, M.A.M.A.-J.; Writing–review & editing, H.A.A.W.; Visualization, M.Ö. and C.Ö.; Supervision, M.Ö. and C.Ö. All authors have read and agreed to the published version of the manuscript.
Funding
This research received no external funding.
Institutional Review Board Statement
Not applicable.
Informed Consent Statement
Not applicable.
Data Availability Statement
The original contributions presented in this study are included in the article. Further inquiries can be directed to the corresponding author.
Conflicts of Interest
The authors declare no conflict of interest.
References
- Ajel, M.G.; GediK, E.; Abdul Wahhab, H.A.; Shallal, B.H. Performance Analysis of an Open-Flow Photovoltaic/Thermal (PV/T) Solar Collector Using Different Fin Shapes. Sustainability 2023, 15, 3877. [Google Scholar] [CrossRef]
- Chabane, F.; Sekseff, E. Experimental Study of a Solar Air Collector with Double Glazing. Iran. J. Energy Environ. 2018, 9, 163–167. [Google Scholar] [CrossRef]
- Yahyazadeh, H.; Gorji, M. Thermal performance enhancement of gas-filled double-glazed flat plate solar collectors. Case Stud. Therm. Eng. 2024, 59, 104533. [Google Scholar] [CrossRef]
- Ismaeel, A.A.; Abdul Wahhab, H.A.; Naji, Z.H. Performance Evaluation of Updraft Air Tower Power Plant Integrated with Double Skin Solar Air Heater. Renew. Energy 2021, 8, 296–303. [Google Scholar] [CrossRef]
- Fan, J.; Huang, Q.; Sumner, D.M.; Wang, D. A simple method for partitioning total solar radiation into diffuse/direct components in the United States. Int. J. Green Energy 2018, 15, 497–506. [Google Scholar] [CrossRef]
- Sun, Y.; Liang, F.; Chen, J.; Teng, H.; Yuan, W.; Zhang, S.; Tang, Y.; Chua, K.J. Ultrathin flexible heat pipes with heat transfer performance and flexibility optimization for flexible electronic devices. Renew. Sustain. Energy Rev. 2025, 208, 115064. [Google Scholar] [CrossRef]
- Ganesan, R.; Selvaraj, K.; Dhakshinamoorthy, P.; Duraikkannu, V.; Perumal, K.; Rajayokkiam, M. Experimental study of pyramid solar still and absorber using a frustoconical reflector for hot air applications. Energy Sources Part A Recovery Util. Environ. Eff. 2025, 47, 6830–6848. [Google Scholar] [CrossRef]
- Al-Maliki, W.A.K.; Al-Hasnawi, A.G.T.; Abdul Wahhab, H.A.; Alobaid, F.; Epple, B. A Comparison Study on the Improved Operation Strategy for a Parabolic Trough Solar Power Plant in Spain. Appl. Sci. 2021, 119, 576. [Google Scholar] [CrossRef]
- Ahmed, P.; Rahman, M.F.; Haque, A.K.M.M.; Mohammed, M.K.A.; Toki, G.F.I.; Ali, M.H.; Kuddus, A.; Rubel, M.H.K.; Hossain, M.K. Feasibility and Techno-Economic Evaluation of Hybrid Photovoltaic System: A Rural Healthcare Center in Bangladesh. Sustainability 2023, 15, 1362. [Google Scholar] [CrossRef]
- Alqadi, M.; Zaharieva, S.; Commichau, A.; Disse, M.; Koellner, T.; Chiogna, G. Developing and Implementing a Decision Support System-Integrated Framework for Evaluating Solar Park Effects on Water-Related Ecosystem Services. Sustainability 2025, 17, 3121. [Google Scholar] [CrossRef]
- Jawad, Q.A.; Mahdy, A.M.; Khuder, A.H.; Chaichan, M.T. Improve the performance of a solar air heater by adding aluminum chip, paraffin wax, and nano-SiC. Case Stud. Therm. Eng. 2020, 19, 100622. [Google Scholar] [CrossRef]
- Saravanan, A.; Murugan, M.; Reddy, M.S.; Ranjit, P.S.; Elumalai, P.V.; Kumar, P.; Sree, S.R. Thermo-hydraulic performance of a solar air heater with staggered C-shape finned absorber plate. Int. J. Therm. Sci. 2021, 168, 107068. [Google Scholar] [CrossRef]
- Wahhab, H.A.A.; Al-Maliki, W.A.K. Application of a Solar Chimney Power Plant to Electrical Generation in Covered Agricultural Fields. IOP Conf. Ser. Mater. Sci. Eng. 2020, 671, 012137. [Google Scholar] [CrossRef]
- Albdoor, A.K.; Obaid, Z.A.H.; Mohammed Saad Kamel, M.S.; Azzawi, I.D.J. Energy, exergy, economic and environmental analysis of a solar air heater integrated with double triangular fins: Experimental investigation. Int. J. Thermofluids 2024, 24, 100979. [Google Scholar] [CrossRef]
- Boussoua, G.; Rostane, B.; Aliane, K.; Ravi, D.; Jan Gęca, M.; Gola, A. Study of the Thermal Performance of Solar Air Collectors with and without Perforated Baffles. Energies 2024, 17, 3812. [Google Scholar] [CrossRef]
- Jiang, Y.; Zhang, H.; Zhao, R.; Liu, Z.; Wang, Y.; You, S.; Wu, Z.; Wei, S. Thermal and Optical Performance Analysis of Triangular Solar Air Collectors and Regional Applicability in China. Sol. Energy 2023, 249, 288–300. [Google Scholar] [CrossRef]
- Khanlari, A.; Aytaç, İ.; Tuncer, A.D.; Variyenli, H.İ.; Şahin, H.N. Improving the Performance of a PCM Integrated Solar Air Collector by Adding Porous Fins over the Bottom Side of the Absorber: A Transient CFD Study. J. Energy Storage 2024, 90, 111847. [Google Scholar] [CrossRef]
- Esen, H. Experimental energy and exergy analysis of a double-flow solar air heater having different obstacles on absorber plates. Build. Environ. 2008, 43, 1046–1054. [Google Scholar] [CrossRef]
- Prabha, C.; Sharma, S. Thermal Performance Prediction of Extended Absorber Solar Air Heater. In Proceedings of the 20th National and 9th ISHMT-ASME Heat and Mass Transfer Conference, Mumbai, India, 4–6 January 2010; pp. 1120–1124. [Google Scholar]
- Krishnananth, S.; Murugavel, K.K. Experimental study on double pass solar air heater with thermal energy storage. J. King Saud Univ.-Eng. Sci. 2013, 25, 135–140. [Google Scholar] [CrossRef]
- Chabane, F.; Moummi, N.; Benramache, S. Experimental study of heat transfer and thermal performance with longitudinal fins of solar air heater. J. Adv. Res. 2014, 5, 183–192. [Google Scholar] [CrossRef] [PubMed]
- Reddy, J.; Das, B.; Negi, S. Energy, exergy, and environmental (3E) analyses of reverse and cross-corrugated trapezoidal solar air collectors: An experimental study. J. Build. Eng. 2021, 41, 102434. [Google Scholar] [CrossRef]
- Reddy, J.; Roy, S.; Das, B. Performance evaluation of sand-coated absorber-based solar air collector. J. Build. Eng. 2021, 44, 102973. [Google Scholar] [CrossRef]
- Reddy, J.; Debnath, S.; Das, B.; Jagadish. Energy and exergy analysis of wavy plate solar air collector using a novel hybrid expert system. J. Braz. Soc. Mech. Sci. Eng. 2019, 41, 397. [Google Scholar] [CrossRef]
- Gawande, V.B.; Dhoble, A.S.; Zodpe, D.B.; Chamoli, S. Experimental and CFD-based thermal performance prediction of a solar air heater provided with a chamfered square rib as artificial roughness. J. Braz. Soc. Mech. Sci. Eng. 2016, 38, 643–663. [Google Scholar] [CrossRef]
- Qamar, Z.; Munir, A.; Langrish, T.; Ghafoor, A.; Tahir, M. Experimental and Numerical Simulations of a Solar Air Heater for Maximal Value Addition to Agricultural Products. Agriculture 2023, 13, 387. [Google Scholar] [CrossRef]
- A-Dulaimil, M.J.; Hilal, A.H.; Hasan, H.A.; Hamad, F.A. Energy and Exergy Investigation of a Solar Air Heater for Different Absorber Plate Configurations. Int. J. Automot. Mech. Eng. 2023, 20, 10258–10273. [Google Scholar] [CrossRef]
- Alomar, O.R.; Mohamed Salih, M.M.; Maher Abd, H. Performance analysis of a single-pass solar air heater thermal collector with the addition of porous media and a finned plate. Energy Storage 2023, 5, 447. [Google Scholar] [CrossRef]
- Abdelkader, T.K.; Zhang, Y.; Gaballah, E.S.; Wang, S.; Wan, Q.; Fan, Q. Energy and exergy analysis of a flat-plate solar air heater coated with carbon nanotubes and cupric oxide nanoparticles embedded in black paint. J. Clean. Prod. 2020, 250, 119501. [Google Scholar] [CrossRef]
- Hu, J.; Lan, S.; Hu, J. A self-driven solar air heater integrated with a thermal energy storage unit: Design and experimental study. Energy 2024, 287, 129699. [Google Scholar] [CrossRef]
- Sharma, S.L.; Debbarma, A. Advancement in solar air heater with integrated PCM-based thermal energy storage system. Int. J. Green Energy 2024, 21, 3330–3366. [Google Scholar] [CrossRef]
- Afaynou, I.; Faraji, H.; Choukairy, K.; Djebali, R.; Rezk, H. Comprehensive Analysis and Thermo-Economic Optimization of a Hybrid Phase Change Material-Based Heat Sink for Electronics Cooling. Heat Transf. 2025, 54, 3754–3774. [Google Scholar] [CrossRef]
Disclaimer/Publisher’s Note: The statements, opinions and data contained in all publications are solely those of the individual author(s) and contributor(s) and not of MDPI and/or the editor(s). MDPI and/or the editor(s) disclaim responsibility for any injury to people or property resulting from any ideas, methods, instructions or products referred to in the content. |
© 2025 by the authors. Licensee MDPI, Basel, Switzerland. This article is an open access article distributed under the terms and conditions of the Creative Commons Attribution (CC BY) license (https://creativecommons.org/licenses/by/4.0/).