Abstract
The removal of topsoil from agricultural land and the use of low-quality fuel to produce fired clay bricks affect the environment, disturbing the ecological balance and contributing to climate change. This study has attempted to produce sustainable concrete hollow blocks by replacing OPC with a combination of supplementary cementitious materials (SCMs) (5–25% fly ash) optimally (10% silica fume and 5% recycled aggregate fine dust). Furthermore, 100% of the developed sustainable sand was added instead of natural sand. Based on the results, the highest compressive strength, 7.6 MPa, was achieved in the mix 15FASFRAHB with the combination SCMs (15% fly ash + 10% silica fume + 5% recycled aggregate fine dust), slightly higher (2.7%) than that of the reference mix NAHB*’s value of 7.4 MPa. All hollow block mixes also satisfied the tensile strength criterion (10–15% of f’c of NAHB*). This showed that they reached the acceptable strength limit for building hollow blocks. In addition, the SCMs effectively reduce the permeability coefficient (k) of sustainable concrete hollow block mixes. However, a direct correlation between the permeability coefficient (k) and compressive strength was not maintained. Finally, the best overall mix from this study, 15FASFRAHB, was with an optimal 30% SCMs and 100% sustainable sand. By using developed sustainable concrete hollow blocks in place of fired clay bricks (6.48 × 10⁷ tons of CO2 emission), 1.2 × 10⁹ tons of natural sand can be saved.
1. Introduction
Humans have used bricks since ancient times. Bricks have been used since the Neolithic era (c. 8300–7600 BC), making them the oldest known ancient building material. The main constituent of brick manufacturing is topsoil clay mixed with water and straw, as stated by [1]. Brick’s popularity as a modern building material increased rapidly during the Industrial Revolution, as the shift from handcrafted to mechanized mass production reshaped the industry. Throughout the 20th century, bricks were a popular building material. Brick production has increased due to the fast urbanization, industrialization, and high demand for construction activities in developing countries worldwide. Illegal contracts have emerged in areas susceptible to air pollution and agricultural land degradation, driven by the growing demand for brick production. These activities impact human health and contribute to ecological imbalances [2]. To create a variety of colors, clay is combined with topsoil, the primary raw material used in brickmaking.
Furthermore, trace amounts of magnesium (Mg), Barium (Ba), and other materials are added. When this layer is over-excavated, the soil quality deteriorates, and the region becomes vulnerable to several hazards, including a dip in the water table that makes it susceptible to flooding and waterlogging. Soil contains up to 500 ppm of fluoride, which is retained up to 1000 °C in the kiln and released as smoke from the chimney into the local environment. Human health is also threatened by other pollutants released into the atmosphere, such as CO2 and SO2. The local population and laborers working in production units are affected by many common diseases, such as Asthma, Tuberculosis, allergies, skin diseases, and eye irritation, which are some of the most common problems. There is a serious need to replace clay brick production with a sustainable and safe alternative for the construction industry [3,4].
Using more sustainable construction materials in the construction sector helps reduce its carbon footprint. It would also help address global climate change. Addressing this one step at a time will be crucial to reducing air pollution and stopping climate change. The construction and building materials industries have the highest demand for different applications. Reusing and recycling industrial waste have become increasingly popular because it has a lower carbon footprint than replacing and discarding natural materials. The fired clay bricks are made from topsoil and water, then fired in a kiln to produce durable, solid clay bricks for the construction industry. Fired clay bricks are a primary source of disturbance to the ecological balance and contribute to environmental carbon emissions, a key effect of climate change. In light of recent innovations and developments in fly ash-based bricks and pavers, solid and hollow concrete blocks could serve as alternative materials to fired clay bricks [5,6].
Recently published work on alternatives to fired clay bricks has been reviewed revealing the research gap addressed in this study. A study reviewed past studies on alternative materials, including fly ash-based bricks, hollow blocks, and solid blocks. It has been estimated that fly ash-based bricks, hollow blocks, and solid blocks account for about 25–30% of the total fly ash consumption in China alone. The study examined fly ash-based bricks as a replacement for fired clay bricks. The optimum compressive strength and water absorption results were about 12 MPa and 13%, respectively. The results indicate that the design mix (fly ash = 25%, lime = 20%, gypsum = 2%, and sand = 53%) achieved sufficient performance to replace fired clay bricks with sustainable fly ash-based bricks. Another study was conducted, which investigated bricks made from egg shell waste, and the results showed that 7% egg shell resulted in a reduction of about 38% in dry shrinkage and an increase of about 8% in bulk density [7,8,9,10,11].
In compressive strength, approximately 50% was reported. The study’s results suggested that incorporating egg shells in brick production enhances sustainability. The study evaluated the performance of solid concrete blocks when different waste plastics were added. The results show that the average compressive strength reduction was around 40% compared to the reference block with natural materials. The blocks’ water absorption was reported to be about 14%. This revealed that the reduction in strength was higher. This study needs more experimentation, but adding other waste materials can achieve a strength comparable to that of a suitable block. Other similar published studies reported that different waste materials can produce sustainable bricks and blocks to replace fired clay bricks. It has also been noted that the optimal quantity of the waste material combination should not exceed 50%. Adding more than 50% of waste materials resulted in a significant reduction in strength characteristics. Most studies show that clay-fired bricks have higher strength and durability than sustainable prefabricated bricks and blocks. That is why the construction industry has hesitated to replace fired clay bricks with sustainable alternatives. Hence, more up-to-date studies are required in this area to enable the construction industry to utilize sustainable bricks and blocks instead of fired clay bricks [12,13,14].
The present study filled the research gap by producing sustainable hollow blocks to replace 100% clay bricks. This study used a supplementary cementitious material (SCM), fly ash, silica fume, and recycled aggregate fine dust (RAFD) combination, and 100% sustainable sand to produce sustainable hollow blocks. This study conducted an environmental, engineering, and economics (EEE) assessment of replacing fired clay bricks with the newly developed sustainable hollow blocks.
2. Materials and Methods
2.1. Materials
2.1.1. Supplementary Cementitious Materials
In this study, fly ash (FA), silica fume (SF), and recycled aggregate fine dust (RAFD) were utilized as partial substitutes for ordinary Portland cement (OPC) in the production of sustainable hollow concrete blocks. This strategy encourages recycling construction and industrial waste while addressing the significant impact of CO2 emissions from the construction industry. Fly ash, a byproduct of coal-fired power plants, acts as a pozzolan and, over time, combines with cement hydration products to form more potent compounds. SF, an ultrafine byproduct of the silicon industry, has a strong microfiller effect, drastically reducing porosity and permeability, thereby improving durability and long-term compressive strength. Last but not least, dense, highly effective, and environmentally friendly recycled aggregate fine dust is produced from demolished concrete waste and prepared in the laboratory by friction separation (<0.075 mm) as an additional filler. Figure 1 shows the FA, SF, and RAFD in powder form.
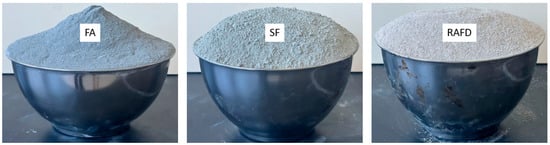
Figure 1.
FA, SF, and RAFD samples were utilized in this study.
2.1.2. Development of Recycled Aggregates
The development of recycled aggregates for this study is shown in Figure 2. The demolished concrete sample was collected from a different location, and the initial strength was determined by taking 6 cores from each sample. The criterion was checked when each sample passed the field strength (85% of fc’) set by [15,16]. Those samples that met the criterion were collected in sufficient quantity, so their physical properties did not change during the experimental work. The steel bars from the samples were removed before putting the sample in the crushing plant. After crushing, the sample was collected from the screening device. As per the requirements of the study, all fraction sizes larger than 9.5 mm were discarded. The 3 main fraction sizes used in this study were 9.5 mm and 4.75 mm, both for the coarse aggregate. The fine aggregate was collected from those that passed 4.75 mm and returned on 0.075 mm, and was utilized as sand in a composite mixture. The selected fraction was forwarded to the material lab for final preparation before being utilized in the prepared design mixes.
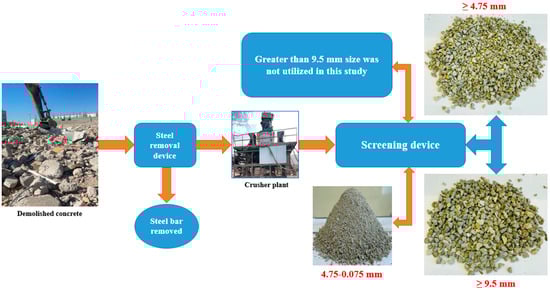
Figure 2.
Systematic process for preparing the recycled coarse and fine aggregates for this study.
2.2. Methods
2.2.1. Design Mix Designations, Proportions, and Mixing Methodologies
This study prepared different types of hollow block mixes by incorporating fly ash, silica fume, and recycled coarse and fine aggregate, as listed in Table 1. The first mix, designated a natural aggregate hollow block (NAHB*), was prepared as a reference mix for this study, using all natural materials. A series of mixes was prepared with the designation fly ash silica fume recycled aggregates hollow block (FASFRAHB) when OPC was replaced with fly ash in the range of 5, 10, 15, 20, and 25% marked against each mix series of developed mixes, designated 5FASFRAHB, 10FASFRAHB, 15FASFRAHB, 20FASFRAHB, and 25FASFRAHB, respectively. An optimized level of 10% silica fume was added to each mix. Furthermore, a developed combination of sustainable sand (50% recycled sand + 50% desert sand) was added instead of 100% natural sand. The desert sand fineness modulus was 1.4, which does not meet the requirements of ACI-211.1–91 [15]. It should be emphasized that the fineness modulus of cement-based materials plays an essential role in the strength characteristics. An aggregate mix with the fineness modulus of 100% desert sand, nearer to the lower boundary, due to a majority of fine particles, does not meet the recommended standards for cementitious materials [17,18,19]. According to ACI-211.1-91 [15], the required fineness modulus values should be between 2.4 and 3.0 for sand utilized in design mix concrete. For this reason, a series of tests was performed to improve the fineness modulus of desert sand, and the combination of (50% recycled sand + 50% desert sand) achieved a fineness modulus of 2.6, which falls well within the ACI-211.1-91 [17] recommendation. The specific gravity and water absorption of the combined sand (50% recycled sand + 50% desert sand) were reported as 2.652 and 2.326, respectively. The sand combination (50% recycled sand + 50% desert sand) particle sieve analysis was well within the standard limits of ASTM C136-06 [20].

Table 1.
The percentage and weight of each prepared mix per m3.
In this study, hollow blocks were manufactured using a fully automatic vibrocompressed block machine. The preparation methodology for hollow blocks is presented in a systematic diagram in Figure 3. Table 1 shows that the two types of aggregate, natural and recycled, were used in the sizes 9.5 mm and 4.75 mm, respectively. For each developed hollow block, the mix percentage and weight are reported in Table 1.
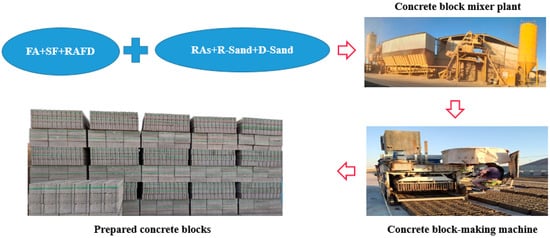
Figure 3.
Sustainable concrete block production process.
2.2.2. Hollow Block Manufacturing Process
Figure 3 illustrates the systematic process of manufacturing sustainable hollow blocks. The systematic diagram in Figure 3 presents the process from the material stockpile to hollow block production. As shown in Figure 3, the first stage of preparing materials for each batch involved supplying them to the hollow block materials maximum plant, where the ready materials were sent to a fully automatic vibrocompressed hollow block production machine. Finally, fly ash, silica fume, and recycled aggregate hollow blocks were produced.
3. Environmental Impact from the Clay Brick Industry
3.1. Fired Clay Brick Production Scenario
Around 20% of global CO2 emissions were generated from the brick industry. In brick manufacturing, Western countries contribute only about 13%, while Asian countries account for almost 87%, with 90% coming from China, India, Pakistan, Bangladesh, and Vietnam. Particulate matter emissions from manufacturing units kill millions of people each year from various diseases [21,22]. The total number of bricks manufactured in one quarter is primarily produced in South Asia [23]. According to an estimate, only India manufactures around 1.5 trillion fired clay bricks annually. The demand for fired clay bricks is rising, and only in India has it increased from 250 billion to about 800 billion bricks [22,24]. In Bangladesh, over 7000 brick kilns produce approximately 30 billion bricks annually, accounting for almost 1% of GDP. Approximately 5–6 billion bricks are manufactured in Nepal from more than 1700 brickmaking kilns. The total world production of bricks is estimated at around 1500 billion per year, as reported by the World Bank [4,25,26].
With 1.96 billion additional residents, the South Asia Region (SAR), which currently accounts for 24.89% of the global population, has experienced an unprecedented urbanization growth of about 6%. Building materials and residential and commercial spaces are in higher demand due to urbanization and economic expansion. A standard masonry material in Asian nations is brick. The only country that produces 1 trillion clay bricks a year is China; the following three countries are Bangladesh (4%), Pakistan (8%), and India (11%), which are considered the highest-producing countries [27].
The SAR is a prominent brick manufacturing region, even though the traditional brickmaking technologies are utilized in most countries. The technologies used to produce fired clay bricks in the SAR affect the local environment, disturb the ecological balance, and contribute to climate change. The kilns used for making fired clay bricks are a primary source of air pollution, with the most effective kiln being the Fixed Chimney Bull’s Trench kiln (FCBTK). One report proposes switching the brick production process from BKT and FCBKT to zigzag kilns to lower kiln emissions [26]. The discussion has concluded that switching brick production technologies could help reduce pollution from fired clay brick manufacturing.
Figure 4 below illustrates manufacturing clay bricks using a flowchart. The clay brick manufacturing process involves preparing clay mud, molding and drying the bricks, and firing, which is the usual process. The brickmaking process ends with the fire technique. A rather loosely packed mixture of numerous minerals is fired in kilns into burned brick, creating durable, stable, and long-lasting clay bricks. The strength, porosity, moisture resistance, hardness, and other characteristics of the burned clay brick are all affected by the firing process. Bricks are heated to temperatures ranging from 800 to 1100 degrees Celsius, depending on the type of clay and the desired level of burn quality. The firing process consists of three steps: heating, soaking, and cooling.
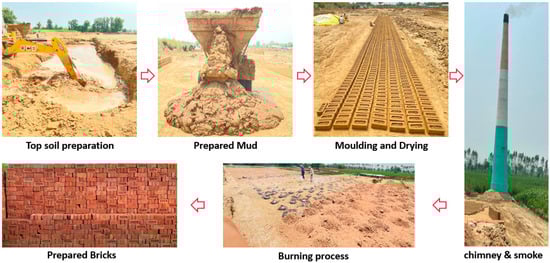
Figure 4.
Clay brick production process.
3.2. Environmental Consequences of Fired Clay Bricks in the Construction Sector
The environmental imbalances damaging our planet are the main driving force behind promoting sustainability in the construction sector. Compared to other thermal power plants, the brick business is far more involved in air pollution and land degradation because it uses cheap, low-quality fuel and uses the fertile clay top layer. The excessive use of topsoil, such as clay, for brick making has impacted the land ecosystem for many years. It impacts land fertility and air quality in the surrounding area near the brick processing units. Excessive land degradation seriously threatens our environment, disrupts the land ecosystem, and ultimately contributes to climate change [26,28,29,30]. For various reasons, it is challenging to enumerate the unintended consequences of climate change through land degradation. Changes in unsustainable land-use patterns are complicated, as are the physiological and biological aspects [31,32]. An estimated 95% of Earth’s topsoil has been moved to its current location, leaving only 5% as “residual soils” [33]. Figure 5 shows the critical scenario of utilizing top-caliber soil excavation for the brick industry.
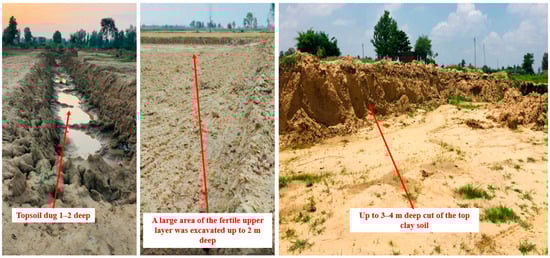
Figure 5.
Top-fertility soil utilization for fired clay brick production.
The degradation is caused by unwanted human activity, such as illegal sand mining for concrete production and the excavation of topsoil for brick making. Topsoil cutting for brick manufacturing has reduced soil fertility, disrupted the area’s ecosystem, and ultimately caused harmful environmental impacts. Consuming too much topsoil will degrade soil quality, increase its vulnerability to erosion, and reduce land efficiency and productivity. Monitoring climate change requires an understanding of land degradation. In topsoil, nitrous oxide (N2O), influenced by weather and management, is regulated by a microbial process known as pedogenesis [29,34,35]. According to studies, converting forest land to farmland and using topsoil for brick manufacturing both reduce soil carbon content. Thus, outcomes affect atmospheric CO2 levels, which could contribute to climate change, according to [36]. Farmers resort to excessive use of artificial fertilizers to restore depleted soil fertility, which unintentionally disrupts natural processes. In Asian countries, the Indian government has enacted a law that prohibits cutting the topsoil without government permission. However, the toxic emissions have a detrimental effect on soil pH levels due to a lack of regulation, as reported [37].
Construction activities emit black carbon and PM2.5 into the environment. The construction activities, such as cement manufacturing, concrete production, road construction, and the brick industry, are the main contributors [38]. India produces the most black carbon in the SAR. The brick industry accounts for 9% of the manufacturing sector’s black carbon emissions [30]. In addition to being harmful to human health, they could alter seasonal patterns and the global climate, including reducing seasonal rainfall and accelerating glacier melting. Worldwide food security is at risk due to these seasonal shifts, particularly for people living in poverty and those affected by conflict. The government must educate the public and private sectors about the risks posed by PM 2.5 and black carbon emissions to the environment and human health. According to a study, FCBKT, the primary source of PM2.5 emissions, produces the most CO2 [39]. In South Asian countries, governments are taking action to protect the environment affected by the brick industry. In India, brick kilns are permitted to operate in the National Capital Region (NCR) from 1 March to 30 June, according to a National Green Tribunal (NGT) ruling. Afterward, a ban was implemented due to concerns about air pollution, especially during the rainy season, when air quality tends to deteriorate [40,41,42].
4. Results and Discussion
4.1. Strength Characteristics
4.1.1. Developed Hollow Blocks’ Compressive Strength
Figure 6 shows the procedure for testing the compressive strength of the developed sustainable hollow blocks. In the first stage, the developed samples are arranged for testing in series, as shown in Table 1. The second stage shows the samples undergoing compression testing; the third and final stage reports the modes of the broken samples.
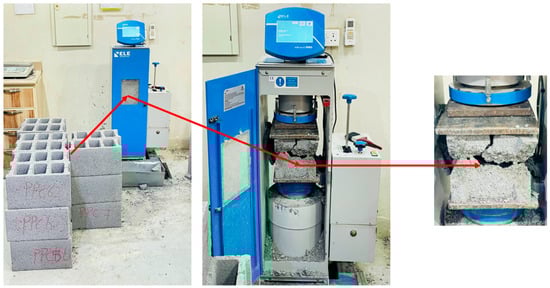
Figure 6.
Testing under a compression setup.
Sustainable hollow blocks made from fly ash, silica fume, and recycled aggregate were produced to replace solid clay bricks in construction. Figure 7 reports the compressive strengths of the developed hollow blocks NAHB*, 5FASFRAHB, 10FASFRAHB, 15FASFRAHB, 20FASFRAHB, and 25FASFRAHB, respectively. The first developed hollow blocks, NAHB*, contain 100% natural materials in the mix (100% OPC), and is marked as a reference mix. The newly prepared mixes 5FASFRAHB, 10FASFRAHB, 15FASFRAHB, 20FASFRAHB, and 25FASFRAHB, had fly ash percentages varying from 5 to 25%, with an increment of 5% in each mix. The silica fume, recycled coarse aggregate, and sand combination was optimized, and the optimal values of the 10% silica fume and aggregate combination (50% natural coarse aggregate + 50% recycled coarse aggregate), along with the sand combination (50% recycled sand + 50% desert sand), was substituted in each mix.
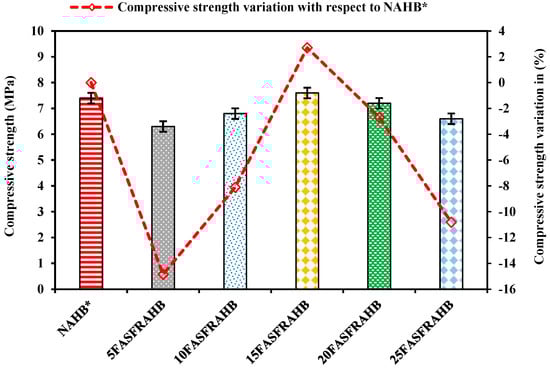
Figure 7.
Results of compressive strength.
The average values of compressive strength of the reference mix NAHB*, along with the prepared mixes 5FASFRAHB, 10FASFRAHB, 15FASFRAHB, 20FASFRAHB, and 25FASFRAHB, were estimated as 7.4, 6.3, 6.8, 7.6, 7.2, and 6.6 MPa, respectively. Based on the results, one point is clear: the reference mix NAHB* has a higher compressive strength than the prepared sustainable hollow blocks, except for mix 15FASFRAHB. The mixes 5FASFRAHB, 10FASFRAHB, and 15FASFRAHB reported continuous increments, as shown in Figure 7. When in the mix 20FASFRAHB, the fly ash silica fume combination (20% fly ash + 10% silica fume) replaced 30% OPC, a slight reduction in the compressive strength was observed, as shown in Figure 7. Figure 7 also reported that in the prepared sustainable mixes 5FASFRAHB, 10FASFRAHB, 20FASFRAHB, and 25FASFRAHB, the reductions in compressive strength were 14.86%, 8.11%, 2.70%, and 10.81%, compared to the reference mix, the hollow block NAHB* made with 100% natural aggregate. However, in the mix 15FASFRAHB (15% fly ash + 10% silica fume), when the combination was mixed with an optimal 10% of silica fume along with the aggregate (50% natural coarse aggregate + 50% recycled coarse aggregate) and sand (50% recycled sand + 50% desert sand), it showed a 2.7% increase in compressive strength when compared to the reference mix NAHB*.
The study results indicate that the mixes 5FASFRAHB, 10FASFRAHB, and 15FASFRAHB exhibited consistent increases in performance. From the mix 20FASFRAHB, when the fly ash silica fume combination reached 30% replacement of OPC, a slight reduction in the compressive strength was observed, as shown in Figure 7. This study suggested that up to 25% combined effects of SCMs (15% fly ash + 10% silica fume) exhibited an optimal level of compressive strength. The results also showed an enhancement in compressive strength with varying SCM percentages. The same combination of sustainable sand (50% recycled sand + 50% desert sand) was used in all sustainable hollow block mixes. Therefore, the sand combination of the SCMs’ reaction also helps enhance the compressive strength of the mixes. The optimal percentage of recycled sand in the sand combination (50% recycled sand + 50% desert sand) promotes secondary reactions through the residual cement in the matrix, increasing CSH gel formation and helping harden the sustainable concrete hollow block mixture. The fine particles of desert sand provide a large surface area, and the combination (OPC + SCMs + desert sand) system forms bonds between particles, resulting in particle packing. These factors help in improving the compressive strength of the mixes.
4.1.2. Splitting Tensile Strength
The splitting tensile strength (STS) of the developed sustainable hollow blocks, along with the reference mix, was estimated using Equation (1). STS stands for the splitting tensile strength, P for the peak load, and l and d for the length and diameter of the samples, respectively.
The STS results for the reference mix and the developed hollow block mixes, NAHB*, 5FASFRAHB, 10FASFRAHB, 15FASFRAHB, 20FASFRAHB, and 25FASFRAHB, were 1.11, 1.071, 1.134, 1.26, 1.449, and 1.323 MPa, respectively. As shown in Figure 8, the STS was compared with the reference mix NAHB*. In the first mix, the 5FASFRAHB combination showed a 3.51% reduction compared to the reference mix NAHB*. In other mixes, 10FASFRAHB, 15FASFRAHB, 20FASFRAHB, and 25FASFRAHB continuing to increment by 2.16%, 13.51%, 30.54%, and 19.18% was noted compared to the reference mix NAHB*. However, the maximum increment of 30.54% was obtained in the mix 15FASFRAHB using the SCM (15% fly ash + 10% silica fume) combination.
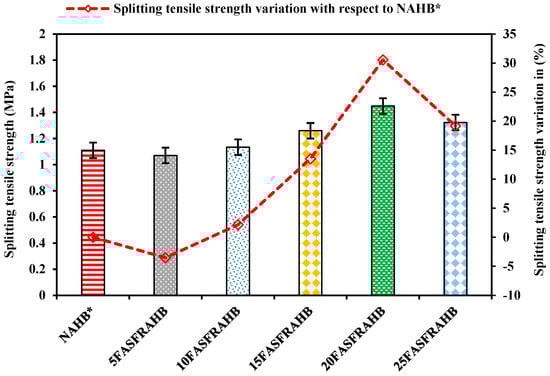
Figure 8.
Results of splitting tensile strength.
As per the standard [43], the STS of normal concrete is between 10 and 15% of (f’c). This study’s reference mix was NAHB* (f’c = 7.4 MPa). As a result, the developed mixes NAHB*, 5FASFRAHB, 10FASFRAHB, 15FASFRAHB, 20FASFRAHB, and 25FASFRAHB, achieved the following results: 15%, 14.47%, 15.32%, 17.02%, 19.58%, and 17.88% of (f’c = 7.4 MPa), respectively. The results show that all the developed sustainable hollow block mixes achieved the standard criterion [43]. The results also showed that the mixes 10FASFRAHB, 15FASFRAHB, 20FASFRAHB, and 25FASFRAHB exceeded the upper limit of 15% of (f’c) for NAHB*, which was 7.4 MPa. The highest value was obtained at 19.58% for the mix 20FASFRAHB. It has been demonstrated that all mixes yielded favorable STS results.
Incorporating the (fly ash + silica fume) combination in the sustainable hollow blocks with a developed sustainable sand shows ductile behavior in the mixes. It helps increase the peak load in the STS test. The paste quality of the mixes depends on the sand particles used in the concrete-based materials. The optimal desert sand combination, using recycled sand, improved the interfacial transition zone (ITZ) and ultimately increased the STS values. Furthermore, the SCMs and the developed sand combination also help improve the paste quality of the matrix. The fine particles (fly ash + silica fume) provide a large surface area and help in the strong bond formation at the ITZ. This also shows that increasing the SCMs enhances the samples’ elastic behavior. Hence, the newly developed sustainable sand (50% recycled sand + 50% desert sand) with different percentages of SCMs (fly ash + silica fume) decreases the brittleness of the samples and improves the cracking load by enhancing the bond strength between particles at the ITZ.
4.2. Water Absorption
Water absorption was evaluated to assess the durability characteristics of the reference mix, NAHB*, and the developed hollow block mixes, 5FASFRAHB, 10FASFRAHB, 15FASFRAHB, 20FASFRAHB, and 25FASFRAHB. Figure 9 reports the water absorption of NAHB*, 5FASFRAHB, 10FASFRAHB, 15FASFRAHB, 20FASFRAHB, and 25FASFRAHB, which were obtained at 9.2, 15.4, 13.8, 13.2, 12.9, and 13.5%, respectively. The percentage changes in water absorption values in the developed sustainable hollow block mixes 5FASFRAHB, 10FASFRAHB, 15FASFRAHB, 20FASFRAHB, and 25FASFRAHB, with respect to the reference NAHB*, were found to be 67.39%, 50%, 11.3%, 43.48%, 40.22%, and 46.74%, respectively.
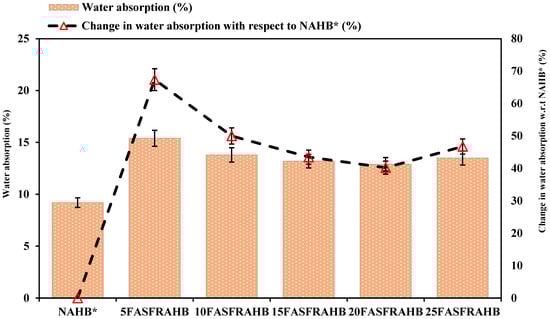
Figure 9.
Results of water absorption.
Figure 9 shows that a minimum water absorption of 9.2% was recorded for the reference mix NAHB* (100% natural aggregate and 100% OPC). However, all the developed sustainable mixes were 15.4%, 13.8%, 13.2%, 12.9%, and 13.5%, well within the 20% limits. Continuous improvement was observed in the sustainable hollow block mixes 5FASFRAHB, 10FASFRAHB, 15FASFRAHB, and 20FASFRAHB. The best improvement was observed in the mix 20FASFRAHB, where the value increased by 12.9%, and in 15FASFRAHB, which was close to 12.9%. Afterward, a slight increment was again seen in the mix 25FASFRAHB, which was about 13.5%. As seen from the mix proportions, the aggregate and sand proportions in the sustainable hollow block mixes are fixed in all mixes; only the replacement ratio of OPC with the combination of SCM (fly ash + silica fume) changes. Therefore, this phenomenon happens with different dosages of the SCM (fly ash + silica fume) combination.
When the reactive silica found in the SCMs (fly ash + silica fume) mixes with the hydration byproducts generated by OPC, more CSH gel is created. As a result, the sustainable hollow block mixes become denser, stopping further water absorption. The sustainable hollow block holes are filled and kept from opening by the pozzolanic action of the microsilica. The smaller particles in the SCMs filled the pores, along with fine desert sand, and reduced water absorption was reported. This study’s results align with recently published research on adding SCMs (fly ash + silica fume) to concrete-based materials [44,45].
The above discussion noted that the formation of additional CSH gel could be the main reason for reduced water absorption in the developed sustainable hollow blocks. It was also seen that this phenomenon threshold was reached somewhere in the mixes 15FASFRAHB and 20FASFRAHB when the value was between 13.2 and 12.9%. A slight increment was observed when 35% OPC was replaced (25% fly ash + 10% silica fume) in the mix 25FASFRAHB. This is because the mixture begins to absorb water in the voids created by the loss of the small particles once their value has peaked. Therefore, the longevity of the concrete-based materials, including SCMs (fly ash + silica fume), depends on having the largest concentration of tiny particles in the mix. Hence, the optimal percentages are highly significant for long-term durability.
4.3. Permeability and Compressive Strength Relationship
The falling-head permeability test determined the permeability of the composite materials developed for sustainable hollow blocks. The permeability coefficient (k) provides a means of understanding the behavior of a porous medium in water flow. This will provide a long-term durability assessment of the sustainable composite blends for hollow blocks. The strength of the hardened composite structure depends on the property that allows water to flow through the composite blend’s pores, namely the permeability coefficient (k). This study developed a relationship between the composite mixture’s hardened compressive strength and the freshly mixed composite mixture’s coefficient of permeability (k). The permeability of the composite mixture was measured using the standard falling-head permeability equation (Equation (2)).
Figure 10 reports the coefficients of permeability (k) of the freshly compacted composite mixtures for sustainable hollow blocks, which were designated 5FASFRAHB, 10FASFRAHB, 15FASFRAHB, 20FASFRAHB, and 25FASFRAHB. The permeability of the reference mix NAHB*, made with 100% natural materials, was also measured. The main objective of measuring the coefficient of permeability (k) for the developed mixes 5FASFRAHB, 10FASFRAHB, 15FASFRAHB, 20FASFRAHB, and 25FASFRAHB was to evaluate the compaction of the composite materials and determine the water flow capacity of each mixture. This will provide a significant analysis of the pores in the composite mixture on which the durability of the mixes at the hardened stage will depend.
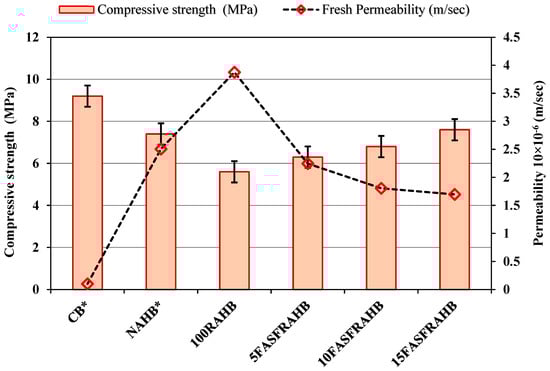
Figure 10.
Relationship between permeability and compressive strength results.
The results of the coefficient of permeability (k) of the developed mixes 5FASFRAHB, 10FASFRAHB, 15FASFRAHB, 20FASFRAHB, and 25FASFRAHB were (2.246, 1.805, 1.696, 1.468, and 1.254) × 10−6, respectively. The permeability of the reference mix NAHB* (100% natural materials) was measured at 2.506 × 10⁻⁶. The analysis of the permeability results showed several observations. It is clearly noticed that the reference mix NAHB*, with 100% natural materials, presented the highest permeability value, as shown in Figure 9. In the sustainable block mixtures, with the combination of SCMs in the mixes 5FASFRAHB, 10FASFRAHB, 15FASFRAHB, 20FASFRAHB, and 25FASFRAHB, they showed a continuous reduction in the permeability values. The fine particles of fly ash and silica fume help to provide greater compaction in the composite mixture, which helps reduce the pore spaces, and ultimately, a reduction in permeability values was noticed.
Figure 10 shows the correlation between the compressive strength and coefficient of permeability (k). When SCMs were added to the composite mixtures in 5FASFRAHB, 10FASFRAHB, 15FASFRAHB, 20FASFRAHB, and 25FASFRAHB, a continuous reduction in the permeability coefficient was observed. This shows that SCMs help reduce permeability coefficient values. It has also been noticed that this pattern is not directly proportional to the compressive strength values. Although this pattern is directly proportional in the mixes 5FASFRAHB, 10FASFRAHB, and 15FASFRAHB, the SCMs subsequently increased beyond 30%. As discussed in the compressive strength analysis, greater amounts of SCMs negatively affect compressive strength. Another piece of evidence from this relationship is that the optimal percentage of SCMs positively affects only the strength and durability of the sustainable mixture. The combined percentage of SCMs provides a large surface area, fills voids properly, and reduces the sustainable composite mixture’s permeability coefficient (k), as shown by the results, which indicate that mix 25FASFRAHB, with 40% SCMs, shows a significant reduction in the permeability coefficient (k). The fineness of desert sand also contributes to the filling of pore spaces. It prevents water from flowing through the composite matrix, thereby reducing the permeability coefficient (k). Hence, it can be concluded that SCMs effectively reduce the permeability coefficient (k), but no direct correlation between k and compressive strength is observed across all mixes.
4.4. Validation of Results
The validation of the results of the developed sustainable hollow blocks by incorporating SCMs, such as fly ash and silica fume, along with recycled coarse and fine aggregate, was conducted. The standard code and up-to-date published studies provide a rigorous basis for comparing the tested parameters, such as the compressive strength, splitting tensile strength, and water absorption. The focusing parameters confirm the validity, particularly for the optimally developed sustainable hollow block 15FASFRAHB.
4.4.1. Compressive Strength Validation
The compressive strength of the mix is the most essential parameter of the strength characteristic. In masonry units, it shows a direct correlation with structural integrity. The present study results reported that the developed sustainable hollow blocks’ compressive strength meets the requirements of block masonry [46,47].
In the present research study, the optimal mix was 15FASFRAHB, which achieved a compressive strength of 7.6 MPa, slightly higher (2.7%) than that of the reference mix NAHB* value of 7.4 MPa. This increment significantly validates the substitution of 30% of SCMs for OPC in sustainable hollow block construction. In addition, 50% recycled coarse aggregate and 50% recycled sand were included, demonstrating enhanced sustainability without compromising mechanical properties.
The final results show a range of compressive strengths (6.3–7.6 MPa), which align closely with other published studies on hollow concrete blocks manufactured by incorporating SCMs and recycled aggregates for masonry units [44,48]. The research on fly ash and recycled aggregate blocks often reports strengths in the 6–10 MPa range, confirming that the current study’s results are well within the expected and validated performance envelope for such sustainable materials [48]. The slight reductions in strength observed in the mixes 5FASFRAHB, 10FASFRAHB, 20FASFRAHB, and 25FASFRAHB compared to NAHB* are a common phenomenon reported in the research when high volumes of SCMs or recycled materials are introduced, which is typically attributed to the slower pozzolanic reaction of fly ash and the higher porosity of recycled aggregates [49]. However, the peak performance of 15FASFRAHB demonstrates that an optimal stability of these materials can be achieved, a result consistent with optimization studies in the field [50].
4.4.2. Splitting Tensile Strength Validation
The overall bond quality relative to cracking resistance is a crucial indicator of concrete-based materials, measured by the splitting tensile strength test. The developed sustainable hollow blocks showed the apparent trend of improving the STS values with SCMs of up to 20% fly ash incorporation, with an optimized 10% silica fume content.
The STS value of the reference mix NAHB* was determined to be 1.11 MPa. The optimal mix 15FASFRAHB was recorded at 1.26 MPa, almost 13.51% higher than the reference mix. The mix 20FASFRAHB achieved the highest value of 1.449 MPa, 30.54% higher than the reference mix. However, using recycled aggregates, this improvement in tensile performance clearly demonstrates the beneficial effect of the SCM (fly ash + silica fume) combination in enhancing the interfacial transition zone (ITZ) and refining the microstructure [51]. Established references found an increase in STS with SCMs’ optimized values. The reason was to develop the secondary pozzolanic reaction of the combined use of SCMs (fly ash + silica fume), which created the bond strength in the matrix, ultimately improving the paste quality, and thus validating the microstructural benefits of the developed sustainable hollow blocks’ matrix [49].
4.4.3. Water Absorption Validation
A lower water absorption value indicates a denser, less permeable matrix, a key parameter for assessing its durability. The water absorption limit allows the standardized code to fall within 10–15% to ensure long-term durability performance and resistance to weathering [50,52,53,54].
The water absorption in the reference mix, NAHB*, was 9.2%, the lowest among all the developed mixes. The results of the developed sustainable hollow block mixes (12.9–15.4%) indicate that the optimal mix 15FASFRAHB is well within the acceptable range of masonry units for good durability values [50].
The water absorption capacity of recycled aggregates, coarse and fine, is higher than that of natural aggregates. The consequences of incorporating recycled aggregates into the developed matrix are recognized to include increased water absorption, due to their higher porosity compared to natural aggregates [49]. With the incorporation of fly ash content (5–20%) along with the optimized 10% silica fume, the water absorption continuously decreases from 15.4% to 12.9%. This reduction validated the effectiveness of SCMs, and optimizing the combined value of the SCMs (fly ash + silica fume) resulted in a slightly higher value of 13.5%. The mitigating adverse effect of a higher amount of SCMs was also disclosed [48]. The sustainable hollow blocks developed in this study meet the durability criterion; their water absorption results are consistent with those reported in the literature for sustainable construction materials [44].
5. Economic Analysis of Sustainable Concrete Hollow Block
5.1. Carbon Footprint and River Sand Reduction from the Construction Industry
This study prepared sustainable hollow blocks to replace fired clay bricks. The construction industry uses a massive amount of cement to produce concrete, bricks, concrete blocks, pavers, tiles, and other cement-based materials, which increase the industry’s carbon footprint. For the sample calculation, we consider the data from a report published by McCarthy [55]. According to the published report, China alone consumed around 6 gigatons of concrete-based materials over the last three consecutive years. The data was used for sample calculation to understand how CO2 emissions and natural sand, such as river sand, can be reduced by using the sustainable hollow blocks produced in this study. This study considered the estimated CO2 emissions and the added value of natural sand protection.
5.1.1. Minimizing CO2 Emissions
As per the selected data, McCarthy [55], China’s yearly consumption of concrete-based materials was approximately 2 gigatons. As shown in Table 2, a sample calculation is provided to understand CO2 emissions. Table 2 shows the estimated CO2 emissions and the reduced value after replacing OPC with a fly ash and silica fume combination. The estimated 2 gigatons of concrete, equivalent to about 2 × 10⁹ tons, were used for a sample calculation to estimate yearly CO2 emissions. The quantity of OPC used in cement-based materials, such as cement concrete, cement concrete blocks, cement-based tiles, and other cement-based materials is presented.
Table 2.
Reduction of CO2 emissions.
According to the IEA [56], an estimated 0.6 tons of CO2 are emitted when producing 1 ton of OPC, providing an estimate of CO2 emissions by OPC consumption for cement-based materials. The approximately taken value of 0.6 tons of CO2 emissions is multiplied by the yearly OPC consumption for cement-based materials. The optimal mix for this study is 20% fly ash and 10% silica fume. Hence, 30% of OPC is replaced with fly ash and silica fume.
The sample estimation from Table 2 showed that replacing 30% OPC with the combination of SCMs (15% FA + 10% SF + 5% RAFD) reduced 6.48 × 10⁷ tons of CO2 emission. Using sustainable hollow blocks in construction, instead of clay bricks and concrete hollow blocks made with 100% cement, helps reduce the industry’s carbon footprint. Hence, if the government mandates the use of sustainable hollow blocks in construction, it can ultimately save tons of OPC, thereby reducing CO2 emissions. This would be a significant mitigating factor in addressing climate change and protecting the environment.
5.1.2. Preservation of Natural Sand
The report by McCarthy [55] has been utilized to estimate the natural sand preservation by sustainable sand. According to the report, the approximate annual production remained the same, at 2 gigatons. The study by Zheng et al. [57] reported that China alone generated around 2.4 billion tons of construction and demolition waste (CDW) annually. Using the above-selected data, an estimate of the rate of natural sand extraction for concrete-based materials can be made. China utilized approximately 2 gigatons of concrete-based materials, equivalent to 2 × 10⁹ tons, which was used for a sample calculation of natural sand replacement with sustainable sand. For a rough estimate, around 60% of the sand was used to prepare the concrete materials. In this study, sustainable sand was developed to replace natural sand to produce sustainable hollow blocks fully.
Table 3 reports the data, indicating that by producing 2 × 10⁹ tons of concrete-based materials, almost 1.2 × 10⁹ tons of natural sand were used. If 100% of the natural sand was replaced with the developed sustainable sand in this study, an equal amount of natural sand could be saved. The CDW waste generated more than the amount of river sand utilized in cement-based materials. Additionally, vacant desert sand is another essential type that can be used as a partial replacement. Hence, it can be demonstrated that 100% natural sand can be effectively replaced with a 100% developed sustainable sand combination.
Table 3.
Reduction of natural river sand.
6. Conclusions
From an environmental perspective, traditional clay brickmaking kilns generate significant CO2 emissions and utilize the top layer of clay, which is essential for agriculture. This study has addressed the issues of unstable ecosystems and climate change from utilizing clay bricks. The study aims to transition from traditional clay bricks to newly developed sustainable, low-carbon hollow blocks for construction. The sustainable hollow blocks replaced OPC with the most effective combination of SCMs (15% FA + 10% SF + 5% RAFD). In addition, natural sand was fully replaced with a developed sustainable sand combination. The successful use of combined waste in developed hollow blocks addresses environmental issues and helps to reduce the construction industry’s carbon footprint. The technical conclusion of the study is discussed in detail, point by point.
- The developed sustainable hollow blocks, 15FASFRAHB, exhibited the highest compressive strength, 7.6 MPa, when 30% of OPC was replaced with the combination SCMs (15% FA + 10% SF + 5% RAFD). This has successfully reached the acceptable limit for hollow blocks in construction work.
- It has also been concluded that the developed sustainable hollow block mix 20FASFRAHB started reducing compressive strength when the SCM combination (20% FA + 10% SF + 5% RAFD) reached 35%.
- The STS value of the reference mix NAHB* was determined to be 1.11 MPa. The optimal mix 15FASFRAHB was recorded at 1.26 MPa, almost 13.51% higher than the reference mix. The mix 20FASFRAHB achieved the highest value of 1.449 MPa, 30.54% higher than the reference mix.
- It can be concluded that SCMs effectively reduce the permeability coefficient (k), but a direct correlation between the permeability coefficient (k) and compressive strength in all mixes is not maintained.
- It is concluded from the sample calculation of selected data that 6.48 × 10⁷ tons of CO2 emissions can be reduced when 30% OPC is replaced with an optimized SCM (15% FA + 10% SF + 5% RAFD) combination, and it is further concluded that by incorporating 100% sustainable sand, 1.2 × 10⁹ tons of river sand can be saved annually.
Author Contributions
Conceptualization, M.N.A.; Methodology, M.N.A.; Software, M.N.A. and D.A.H.M.; Validation, M.N.A. and D.A.H.M.; Formal analysis, M.N.A.; Investigation, D.A.H.M.; Data curation, D.A.H.M.; Writing—original draft, M.N.A.; Writing—review & editing, D.A.H.M.; Supervision, D.A.H.M.; Funding acquisition, D.A.H.M. All authors have read and agreed to the published version of the manuscript.
Funding
This research received no external funding.
Institutional Review Board Statement
Not applicable.
Informed Consent Statement
Not applicable.
Data Availability Statement
The data presented in this study are available on request from the corresponding author (the data are not publicly available due to privacy).
Conflicts of Interest
The authors declare no conflict of interest.
References
- Fiala, J.; Mikolas, M.; Krejsova, K. Full brick, history and future. IOP Conf. Ser. Earth Environ. Sci. 2019, 221, 012139. [Google Scholar] [CrossRef]
- Alam, J.; Khan, M.; Akhtar, M. Fly ash based brick tiles: An experimental study. Int. J. Emerg. Trends Eng. Dev 2013, 6, 35–44. [Google Scholar]
- Jha, S.; Nayak, A.; Sharma, Y.; Mishra, V.; Sharma, D. Fluoride accumulation in soil and vegetation in the vicinity of brick fields. Bull. Environ. Contam. Toxicol. 2008, 80, 369–373. [Google Scholar] [CrossRef]
- Akhtar, M.N.; Bani-Hani, K.A.; Akhtar, J.; Khan, R.A.; Nejem, J.K.; Zaidi, K. Flyash-based bricks: An environmental savior—A critical review. J. Mater. Cycles Waste Manag. 2022, 24, 1663–1678. [Google Scholar] [CrossRef]
- El Maataoui, Y.; Alehyen, S.; Fadil, M.; Aouan, B.; Liba, A.; Saufi, H.; Taibi, M. Application of central composite design for optimizing mechanical performance of geopolymer paste from fly Ash using the mechanosynthesis method: Structural and microstructural analysis. Iran. J. Sci. Technol. Trans. Civ. Eng. 2025, 49, 2481–2501. [Google Scholar] [CrossRef]
- Velasco, P.M.; Ortíz, M.M.; Giró, M.M.; Velasco, L.M. Fired clay bricks manufactured by adding wastes as sustainable construction material–A review. Constr. Build. Mater. 2014, 63, 97–107. [Google Scholar] [CrossRef]
- Al-Awsh, W.A.; Al-Amoudi, O.S.B.; Al-Osta, M.A.; Ahmad, A.; Saleh, T.A. Experimental assessment of the thermal and mechanical performance of insulated concrete blocks. J. Clean. Prod. 2021, 283, 124624. [Google Scholar] [CrossRef]
- Akhtar, J.; Alam, J.; Akhtar, M. An experimental study on fibre reinforced fly ash based lime bricks. Int. J. Phys. Sci. 2010, 5, 1688–1695. [Google Scholar]
- Akhtar, M.; AKhtar, J.; Hattamleh, O. The Study of Fibre Reinforced Fly Ash Lime Stone Dust Bricks With Glass Powder. Int. J. Eng. Adv. Technol. 2013, 3, 314–319. [Google Scholar]
- Akhtar, M.; Hattamleh, O.; Akhtar, J. Feasibility of coal fly ash based bricks and roof tiles as construction materials: A review. MATEC Web Conf. 2017, 120, 03008. [Google Scholar] [CrossRef]
- Akhtar, J.; Ahmad, T.; Akhtar, M.; Abbas, H. Influence of Fibers and Fly Ash on Mechanical Properties of Concrete. Am. J. Civ. Eng. Archit. 2014, 2, 64–69. [Google Scholar] [CrossRef]
- Maaze, M.R.; Das, S.K.; Garg, N.; Shrivastava, S. A Review of Ecofriendly Brick Production: Exploring the Use of Fly Ash and Industrial Waste in the Construction Industry. J. Struct. Des. Constr. Pract. 2025, 30, 03124004. [Google Scholar] [CrossRef]
- Priyadarshini, M.; Mondal, G.; Dash, S.R. Development of a Nonconventional First-Class Fly Ash Brick and Evaluation of Its Mechanical and Durability Properties. J. Mater. Civ. Eng. 2025, 37, 04025266. [Google Scholar] [CrossRef]
- Singh, R.; Patel, M. Mechanical, durability, and microstructural characteristics of rice-straw-ash-based clay bricks: A sustainable approach to utilize biomass-based power plant waste. J. Mater. Cycles Waste Manag. 2025, 27, 170–192. [Google Scholar] [CrossRef]
- ACI-211.1-91; Standard Practice for Selecting Proportions for Normal, Heavyweight, and Mass Concrete. American Concrete Institute: Farmington Hills, MI, USA, 1991.
- ACI-214.4R-03; Guide for Obtaining Cores and Interpreting Compressive Strength Results. American Concrete Institute: Farmington Hills, MI, USA, 2013.
- Akhtar, M.N.; Albatayneh, O.; Bani-Hani, K.A.; Malkawi, A.I.H. Performance of modified desert sand concrete: An experimental case study. Case Stud. Constr. Mater. 2024, 21, e03465. [Google Scholar] [CrossRef]
- Hamada, H.M.; Abed, F.; Al-Sadoon, Z.A.; Elnassar, Z.; Hassan, A. The use of treated desert sand in sustainable concrete: A mechanical and microstructure study. J. Build. Eng. 2023, 79, 107843. [Google Scholar] [CrossRef]
- Jin, B.H.; Song, J.X.; Liu, H.F. Engineering characteristics of concrete made of desert sand from Maowusu Sandy Land. Appl. Mech. Mater. 2012, 174, 604–607. [Google Scholar] [CrossRef]
- ASTM-C136-06; Standard Test Method for Sieve Analysis of Fine and Coarse Aggregates. ASTM: West Concord, PA, USA, 2006.
- Mitra, D. Brick by Brick/Environment, Human Labour & Animal Welfare. In Environment, Human Labour, and Animal Welfare; International Labour Office: Geneva, Switzerland; The Brooke Hospital for Animals: London, UK; The Donkey Sanctuary: Sidmouth, UK, 2016. [Google Scholar]
- CSE-India. Overview on Brick Kiln: Pollution, Technology and Where We Need to Go? Presentation at Anil Agarwal Dialogue. March 11 2015. Available online: https://cdn.cseindia.org/docs/aad2015/Overview2.pdf (accessed on 11 March 2015).
- Zhang, L. Production of bricks from waste materials—A review. Constr. Build. Mater. 2013, 47, 643–655. [Google Scholar] [CrossRef]
- ICIMOD. Resource Efficient Burnt-Clay Bricks in India. International Centre for Integrated Mountain Development 2017. Available online: www.icimod.org (accessed on 31 March 2019).
- Baum, E. The Brick Industry Worldwide. ESMAP & World Bank Report. Ministry of Construction Vietnam: Hanoi, Vietnam, 2017. [Google Scholar]
- Turner, K.G.; Anderson, S.; Gonzalez-Chang, M.; Costanza, R.; Courville, S.; Dalgaard, T.; Dominati, E.; Kubiszewski, I.; Ogilvy, S.; Porfirio, L.; et al. A review of methods, data, and models to assess changes in the value of ecosystem services from land degradation and restoration. Ecol. Model. 2016, 319, 190–207. [Google Scholar] [CrossRef]
- Agarwal, A. Overview of Brick Kiln Sector in the Country. AAEIT, 2012. Available online: https://cdn.cseindia.org/docs/photogallery/slideshows/TP-cleaner-brick-production-20171211-15-Overview-of-Brick-Kiln-Sector-Environmental-issues-Nivit-Kuma.pdf (accessed on 11 March 2015).
- Gibbs, H.; Salmon, J.M. Mapping the world’s degraded lands. Appl. Geogr. 2015, 57, 12–21. [Google Scholar] [CrossRef]
- Van der Laan, C.; Wicke, B.; Verweij, P.A.; Faaij, A.P. Mitigation of unwanted direct and indirect land-use change–an integrated approach illustrated for palm oil, pulpwood, rubber and rice production in North and East Kalimantan, Indonesia. Gcb Bioenergy 2017, 9, 429–444. [Google Scholar] [CrossRef]
- Prince, S.; Von Maltitz, G.; Zhang, F.; Byrne, K.; Driscoll, C.; Eshel, G.; Kust, G.; Martínez-Garza, C.; Metzger, J.P.; Midgley, G.; et al. Chapter 4: Status and trends of land degradation and restoration and associated changes in biodiversity and ecosystem fundtions. In IPBES: The IPBES Assessment Report on Land Degradation and Restoration; Montanarella, L., Scholes, R., Brainich, A., Eds.; Secretariat of the Intergovernmental Science-Policy Platform on Biodiversity and Ecosystem services: Bonn, Germany, 2018. [Google Scholar]
- Lambin, E.F.; Turner, B.L.; Geist, H.J.; Agbola, S.B.; Angelsen, A.; Bruce, J.W.; Coomes, O.T.; Dirzo, R.; Fischer, G.; Folke, C.; et al. The causes of land-use and land-cover change: Moving beyond the myths. Glob. Environ. Change 2001, 11, 261–269. [Google Scholar] [CrossRef]
- Lambin, E.F.; Meyfroidt, P. Global land use change, economic globalization, and the looming land scarcity. Proc. Natl. Acad. Sci. USA 2011, 108, 3465–3472. [Google Scholar] [CrossRef]
- USDA. Soil Formation. United States Department of Agriculture. Available online: https://www.nrcs.usda.gov/resources/guides-and-instructions/soil-classification (accessed on 10 September 2015).
- Lambin, E.F.; Geist, H.J.; Lepers, E. Dynamics of land-use and landcover change in tropical regions. Annu. Rev. Environ. Resour. 2003, 28, 205–241. [Google Scholar] [CrossRef]
- Drescher, J.; Rembold, K.; Allen, K.; Beckschäfer, P.; Buchori, D.; Clough, Y.; Faust, H.; Fauzi, A.M.; Gunawan, D.; Hertel, D.; et al. Ecological and socioeconomic functions of tropical lowland rainforest transformation systems: An integrative approach. Philos. Trans. R. Soc. B 2015. [Google Scholar] [CrossRef]
- Olsson, L.; Barbosa, H.; Bhadwal, S.; Cowie, A.; Delusca, K.; Flores-Renteria, D.; Hermans, K.; Jobbagy, E.; Kurz, W.; Li, D.; et al. Land Degradation: IPCC Special Report on Climate Change, Desertification, Land 5 Degradation, Sustainable Land Management, Food Security, and 6 Greenhouse gas fluxes in Terrestrial Ecosystems; Intergovernmental Panel on Climate Change (IPCC): Geneva, Switzerland, 2019; p. 1. [Google Scholar]
- Maria, S.; Croitoru, L.; Khaliquzzaman, M.; Ferdausi, S.A.; Li, J. Introducing Energy-efficient Clean Technologies in the Brick Sector of Bangladesh. Government of Bangladesh. Energy Sector Management Assistance Program (ESMAP); The World Bank: Washington, DC, USA, 2011. [Google Scholar]
- DMG-Events. Construction Market in India. A Report by Dmg Events India. 2015. Available online: http://www.arbinternational.es/ARCHIVO/documentos/sectorial/1431507298_construction-market-report.pdf (accessed on 10 September 2015).
- Maithel, S.; Ravi, A.; Kumar, S. Roadmap for Promoting Resource Efficient Bricks in India: A 2032 Strategy; Greentech Knowledge solutions Pvt. Ltd.: New Delhi, India, 2018. [Google Scholar]
- Weyant, C.; Athalye, V.; Ragavan, S.; Rajarathnam, U.; Lalchandani, D.; Maithel, S.; Baum, E.; Bond, T.C. Emissions from South Asian brick production. Environ. Sci. Technol. 2014, 48, 6477–6483. [Google Scholar] [CrossRef]
- Skinder, B.; Pandit, A.; Sheikh, A.; Ganai, B. Brick kilns: Cause of atmospheric pollution. J. Pollut. Eff. Control 2014, 2, 3. [Google Scholar] [CrossRef]
- Ball, C. The harmful effects of living in brick kiln communities in the South Asia Region. Ballard Brief 2024, 2024, 10. [Google Scholar]
- ASTM-C496/C496M-11; Standard Test Method for Splitting Tensile Strength of Cylindrical Concrete Specimens. ASTM: West Concord, PA, USA, 2011.
- Shekhar, D.; Godihal, J. Sustainability Analysis of Hollow Concrete Blocks Manufactured Using Recycled Concrete Aggregate and Fly Ash as an Eco-Friendly Construction Component. J. Archit. Eng. 2024, 30, 04024001. [Google Scholar] [CrossRef]
- Akhtar, M.N.; Malkawi, D.A.H.; Bani-Hani, K.A.; Malkawi, A.I.H. Durability Assessment of Sustainable Mortar by Incorporating the Combination of Solid Wastes: An Experimental Study. Civ. Eng. J. 2023, 9, 2770–2786. [Google Scholar] [CrossRef]
- ASTM C129-03; Standard Specification for Nonloadbearing Concrete Masonry Units. ASTM: West Conshohocken, PA, USA, 2003; Volume 4, pp. 1–3.
- Bakera, T.; Malchiodi, B.; Hafez, H.; Scrivener, K. Low-Carbon Concrete Hollow Blocks as a Sustainable Solution for Affordable Houses. In Proceedings of the 18th International Brick and Block Masonry Conference, Birmingham, UK, 21–24 July 2024; pp. 914–920. [Google Scholar]
- Al-Naghi, A.A.A.; Ali, T.; Inam, I.; Qureshi, M.Z.; Kahla, N.B.; Ghazouani, N. An innovative approach to enhancing the strength and durability of recycled aggregate concrete through fly ash-silica fume coating and rice husk ash supplementation. Sci. Rep. 2025, 15, 32780. [Google Scholar] [CrossRef]
- Pedro, D.; De Brito, J.; Evangelista, L. Durability performance of high-performance concrete made with recycled aggregates, fly ash and densified silica fume. Cem. Concr. Compos. 2018, 93, 63–74. [Google Scholar] [CrossRef]
- Sharaky, I.; Issa, U.; Alwetaishi, M.; Abdelhafiz, A.; Shamseldin, A.; Al-Surf, M.; Al-Harthi, M.; Balabel, A. Strength and water absorption of sustainable concrete produced with recycled basaltic concrete aggregates and powder. Sustainability 2021, 13, 6277. [Google Scholar] [CrossRef]
- Shmlls, M.; Bozsaky, D.; Horváth, T. Compressive, flexural and splitting strength of fly ash and silica fume concrete. Pollack Period. 2022, 17, 50–55. [Google Scholar] [CrossRef]
- Thamboo, J.; Sathurshan, M.; Zahra, T. Reliable unit strength correlations to predict the compressive strength of grouted concrete masonry. Mater. Struct. 2024, 57, 151. [Google Scholar] [CrossRef]
- Chopperla, K.S.T.; Kaladaran, G.; Kochaver, A.K.; Isgor, O.B.; Weiss, W.J. The effect of water absorption and specific gravity of supplementary cementitious materials on required water. Cem. Concr. Compos. 2024, 154, 105808. [Google Scholar] [CrossRef]
- Safiuddin, M.; Mahmud, H.; Jumaat, M.Z. Efficacy of ASTM saturation techniques for measuring the water absorption of concrete. Arab. J. Sci. Eng. 2011, 36, 761–768. [Google Scholar] [CrossRef]
- McCarthy, N. China Used More Concrete in 3 Years than the U.S. Used in the Entire 20th Century. 2014. Available online: https://www.forbes.com/sites/niallmccarthy/2014/12/05/china-used-more-concrete-in-3-years-than-the-u-s-used-in-the-entire-20th-century-infographic/?sh=768ab48b4131 (accessed on 5 December 2014).
- IEA. Reducing CO2 Emissions While Producing Enough Cement to Meet Demand is a Global Challenge, Especially Since Demand Growth is Expected to Resume. Available online: https://www.iea.org/energy-system/industry/cement (accessed on 11 July 2023).
- Zheng, L.; Wu, H.; Zhang, H.; Duan, H.; Wang, J.; Jiang, W.; Dong, B.; Liu, G.; Zuo, J.; Song, Q. Characterizing the generation and flows of construction and demolition waste in China. Constr. Build. Mater. 2017, 136, 405–413. [Google Scholar] [CrossRef]
Disclaimer/Publisher’s Note: The statements, opinions and data contained in all publications are solely those of the individual author(s) and contributor(s) and not of MDPI and/or the editor(s). MDPI and/or the editor(s) disclaim responsibility for any injury to people or property resulting from any ideas, methods, instructions or products referred to in the content. |
© 2025 by the authors. Licensee MDPI, Basel, Switzerland. This article is an open access article distributed under the terms and conditions of the Creative Commons Attribution (CC BY) license (https://creativecommons.org/licenses/by/4.0/).