Abstract
The growing incidence of natural and man-made disasters, exacerbated by climate change, has highlighted the role of urban planning and design in reducing the impact of the risks they pose. This refers to pre-disaster recovery planning (PDRP), an innovative practice that aims to improve the response of urban contexts affected by a disaster, with urban planning actions implemented in peacetime, i.e., before the disaster occurs. This paper presents a methodology that integrates agent-based simulation and safety-based urban design within a sustainability-oriented urban planning framework. The methodology aims to support the design of safer and more resilient public spaces, focusing on open areas within heritage districts and operating within a sustainability-oriented urban planning framework. The proposed approach integrates simulation and design to evaluate the performance of existing spatial layouts under stress conditions and explore alternative configurations that optimize evacuation dynamics and minimize risks. The result of applying the simulation to the current urban context therefore allows for the identification of appropriate urban design techniques and practices aimed at defining alternative spatial scenarios and improving the urban form in terms of its evacuation performance.
1. Introduction
The increase in the incidence of natural disasters due to climate change and urban dynamics that continue to consume land puts the role of urban planning and design at the center as a tool for reducing risk to humans. So-called Pre-Disaster Recovery Planning (PDRP), an emerging practice that pursues prevention objectives through pre-disaster preparedness, mitigation, and response capacity building, takes on a very important role. It includes how to keep urban management and essential services functioning, where to locate temporary housing, how and where to rebuild, how to reestablish essential economic activities, etc. Communities can and must take measures before they are hit by a disaster to ensure that the consequences of the disaster do not themselves become a disastrous and chaotic situation [,,]. In this perspective, pre-disaster planning can be interpreted as a crucial component of sustainable urban development. Anticipating risk and integrating safety into spatial transformation processes contributes to the long-term sustainability of cities, reducing both environmental exposure and social vulnerability.
This article describes the results of research in the field of PDRP, which aims to use software to simulate crowd behavior during evacuation due to a disaster, to evaluate the performance of the settlement (the system of open public spaces) and implement urban design actions and interventions aimed at improving its urban form. This reduces urban risk and consequently increases safety and resilience [,]. The research described in this article therefore contributes to filling a significant gap in the scientific literature in the field of prevention, namely that of Safety-Based Urban Design (UDS-b). In fact, there is very little scientific research addressing the issue of urban design techniques for urban risk reduction using simulation tools, i.e., how to modify and adapt the urban form to make a neighborhood or city affected by natural or anthropogenic risks as safe as possible [,].
The research methodology can be summarized in six phases that are developed in the context of an Urban Digital Twin (UDT): (1) the construction of the simulation tool; (2) the identification of case studies on which to apply the tool from phase 1; (3) application of the simulator; (4) definition of UDS-b techniques; (5) construction of alternative urban scenarios aimed at risk reduction by applying the techniques from phase 4; (6) feedback from the simulation to verify the improvement in urban performance in terms of risk.
At the heart of this methodology is a simulation environment developed using the GAMA platform [,], which supports agent-based modeling of crowd behavior during emergencies. The platform allows for detailed representations of the built environment, crowd dynamics, and individual decision-making processes, making it particularly suitable for simulating evacuation scenarios triggered by catastrophic events such as earthquakes []. This simulation tool is integrated into a UDT that is being developed as part of a broader research project and incorporates an in-depth knowledge system that uses static and dynamic data (statistical and geographical data) with simulation tools (to verify urban performance) and representation tools (scenarios/dashboards) []. From a sustainability standpoint, the simulation-based approach supports the transition from reactive emergency management to proactive and adaptive spatial governance. By combining digital modelling, behavioural analysis, and design experimentation, the research provides a decision-support tool for managing environmental hazards within a framework of sustainable urban resilience.
This article is organized as follows. Section 2 reviews the relevant literature; Section 3 presents the materials and methods; Section 4 details the crowd-behavior simulator; Section 5 describes the Atri historic-centre case study and data preparation; Section 6 reports and discusses the results for Scenario 0 and Scenario 1; Section 7 concludes with implications and avenues for future research.
2. Literature Review
The field of research that characterizes the study presented in this article draws on two major themes: (i) models and methods for simulating crowd behavior in the event of evacuation; (ii) urban design techniques aimed at reducing the risk of evacuation and consequently increasing urban safety and resilience.
In the first field, scientific literature highlights numerous experiences concerning the study of models and algorithms, highly differentiated on collective human dynamics [,,] and very often concerning seismic hazards or fires. These studies use approaches based on multi-agent models [,,,,], in some cases using libraries for the construction of the network model and the implementation of algorithms with databases to store spatial data and map viewers to represent the simulation results [,]. There are also experiences that implement simulation platforms. Alternatively, there is research that implements and builds interdisciplinary simulation platforms that can be used in very different contexts, not only for evacuation analysis and planning [,].
Analysis of the scientific literature shows that simulation tools are developed mainly for simulations inside buildings [,] and much less for open urban spaces [,,]. These tools are very often based on artificial intelligence applications [].
Some studies focus on analyzing the risk of the road network by considering the flow of people in ordinary and evacuation situations [], analyzing, for example, the connectivity of the network to identify the best routes in the event of a disaster [,] and the performance of emergency areas during evacuation, shelters, or strategic facilities for disaster response [,].
Other studies focus on data sources for modeling crowds, such as cell phones [,], or explore crowd behavior models to be applied to simulation, such as panic, highlighting the existence of a large body of research on this topic [,,,,].
In the second field, urban design techniques aimed at risk reduction, scientific literature highlights few research experiences that link risk assessment, including evacuation through simulation tools, to the study of urban form performance. For example, there is research that evaluates this performance in relation to the location of shelters using Geographic Information Systems (GIS) and agent-based computer models [], or that introduces new approaches to crowd management in relation to the contribution of urban design [] or to actively guide crowds []. Specific research topics use simulation results to reorganize mobility infrastructure for evacuation [,]. Others attempt to identify urban design techniques for risk reduction and flexible planning and management of urban spaces, without evaluating the performance of urban form []. The research described in this article refers precisely to this specific topic, i.e., the use of tools for evaluating the performance of urban form aimed at risk reduction. In particular, the research focuses on evaluating the performance of open public spaces as nodes in the evacuation and emergency management network. A review of the scientific literature shows that there is a lack of scientific research in this field, which our work aims to fill by studying a tool for simulating crowd behavior whose application to an urban context allows us to assess its performance in terms of evacuation risk following a disastrous event.
3. Methodology
As mentioned in the previous paragraphs, the objective of the research described in this article is to define and apply a methodology aimed at applying a tool for simulating crowd behavior during an evacuation due to a disastrous event to urban contexts of various types and forms in various urban contexts, and consequently to apply urban design techniques to the settlement structure based on safety and aimed at improving urban performance for evacuation and thus increasing urban resilience. This work proposes a general simulation-informed design procedure for outdoor public spaces, organized as a simulate → design → re-simulate cycle. Spatial modifications are implemented as parametric operators (opening/resizing of access points, removal of obstacles, reallocation and sizing of assembly areas, wayfinding measures) and tested across multi-scale scenarios with capacity constraints at the destinations. Performance is assessed with replicable metrics (time to safety, cumulative share of people safe, density and bottlenecks), and the marginal effect of each operator is estimated through replications and sensitivity analysis, yielding quantitative feedback directly usable in design. Moreover, the procedure acts as an evidence-based validator of civil-protection emergency plans by stress-testing key parameters—such as assembly-area capacity and placement, and the effectiveness of wayfinding—against simulated demand and pedestrian behavior. This represents a scientific and methodological advance, since emergency planning is typically decoupled from urban planning and the provision/configuration of public space often follows ad hoc, preference-driven choices; our approach anchors those decisions in reproducible, model-based evidence. The method’s structure is independent of the case study and is transferable to different contexts given the same basic inputs (walkable network, population, assembly areas).
The methodology is divided into the following phases, which are developed in the context of a UDT:
- (1)
- The design and implementation of the software for the simulation tool.
- (2)
- The identification and characterization of case studies to which the tool from phase 1 can be applied.
- (3)
- The application of the simulator to the case studies to obtain the pre-project Scenario 0.
- (4)
- The definition of UDS-b techniques for risk reduction.
- (5)
- The assessment of urban risk and the construction of alternative urban scenarios (post-project Scenario 1) aimed at risk reduction by applying the techniques of phase 4.
- (6)
- Feedback from the simulation to verify the improvement in urban performance in terms of risk.
The first phase concerns the development of the modeling environment. The open-source GAMA platform was used, which supports spatially explicit agent-based simulations with customizable behavioral parameters [,]. Each agent within the model represents a single actor with specific attributes, such as movement speed and decision-making patterns, and can react dynamically to environmental stimuli and the behavior of surrounding agents. Simulation scenarios are evaluated using a set of performance indicators commonly adopted in evacuation studies. These include total evacuation time, average and maximum crowd density in critical areas, and the percentage of agents reaching safety within a defined time threshold. These indicators allow for quantitative comparison between baseline and optimized scenarios and provide empirical evidence to guide land-use planning decisions []. To ensure the robustness of the model, validation procedures include internal consistency checks, sensitivity analyses, and consultations with industry experts. The second phase (Phase 2) involves identifying case studies and developing GIS vector bases to be imported into the simulator (Phase 1) in QGIS open-source software version 3.34, which models all urban elements, and particularly the system of open public spaces useful for defining the evacuation network. The spatial model is constructed using a combination of institutional and open access datasets. These include orthophotos and topographic maps for reconstructing the morphology of the site, vector data on buildings and routes, and population estimates derived from institutional records and statistical sources. This provides the basis for the pre-project Scenario 0. In Phase 3, the results of the Scenario 0 simulation provide a diagnostic assessment of the site’s critical issues, highlighting problem areas in terms of crowd congestion, insufficient capacity of emergency gathering points (waiting or safety areas), or delays in individuals reaching safe areas. The behavioral logic implemented in the model is based on established principles in evacuation science, with particular attention to the influence of spatial constraints on pedestrian movement, as explored in works such as Shiwakoti and Sarvi [] and Wang et al. [].
Based on the diagnostic results, Phase 4 involves the formulation of spatial interventions, derived from UDS-b techniques, aimed at improving the evacuation performance of the system. These interventions, designed within an integrated GIS and simulation environment, may involve the repositioning or expansion of emergency areas, the modification of pedestrian circulation routes, or the removal of spatial barriers that hinder exit. UDS-b is linked to the identification of the urban risk that generates it and which is reflected in the evacuation risk. In Phase 5, the post-project scenario is constructed by applying the UDS-b to the existing urban structure with the aim of reducing both the evacuation risk and the urban risk. The latter is an intrinsic characteristic of the urban organism and derives from the combination of urban hazard with vulnerability and exposure. Once implemented, the new post-project scenario (Phase 5) is subjected to a second simulation (Phase 6), which allows for a comparative assessment with respect to the baseline condition and thus provides feedback information. This cyclical process, based on successive iterations of simulation and redesign, allows for the progressive refinement of spatial solutions and the validation of design choices through measurable indicators. Such a feedback cycle [,,] is essential for the transition from static, rule-based planning approaches to adaptive, performance-oriented spatial design. In short, the methodology employs an agent-based evacuation model. The environment is built from GIS layers: buildings as obstacles, a derived walkable network, designated safe areas with capacity (m2/person), and diffuse obstacles (e.g., parked cars) that reduce effective width and free-flow speed. Agents (pedestrians) are initialized from population/address points with heterogeneous speed, reaction time, and route preferences. They navigate the pedestrian graph toward the nearest available safe area; capacities are monitored, and agents dynamically reroute when an area saturates, or local congestion emerges. Model outputs include (i) time series of safe-area occupancy and saturation/clearance times and (ii) a georeferenced “crowdness” map highlighting highly traversed segments and critical choke points. These outputs support comparative testing of the current state (Scenario 0) versus design alternatives, enabling iterative, safety-oriented adjustments to public-space configuration and safe-area provision.
4. The Crowd Behavior Simulator
The simulator is an agent-based environment implemented in GAMA and organized around a compact set of species that encode the urban context and evacuation dynamics in a spatially explicit way (georeferenced inputs, continuous space, discrete time). The design follows established practice in evacuation ABMs—behavioral heterogeneity, congestion effects, reproducible scenario management—and leverages GAMA’s GIS-native modelling and scheduling [,]. Each pedestrian is an autonomous agent with a bounded-rational perceive–evaluate–act loop. Attributes include preferred speed, acceleration bounds, perception radius, compliance, and noise terms. Route choice balances shortest-path tendencies with density-aware re-routing and obstacle avoidance; social influence (herding/following) is parameterized rather than hard-coded to allow sensitivity tests against behavioral assumptions reported in evacuation literature [,,]. Motion controllers enforce collision avoidance and density-dependent speed adaptation to reproduce bottleneck saturation and flow nonlinearities []. Buildings are polygonal, non-walkable obstacles that structure the urban fabric and constrain both visibility and movement. Scenario rules may attach attributes (e.g., height/frontage) and debris buffers to reflect event-induced hindrances that slow or divert flows, consistent with city-scale evacuation modelling that explicitly treats open-space accessibility and barrier states []. The obstacle species covers permanent impediments (fences, walls, closed gates) and temporary ones (narrowings, works, debris). A light typology scheme governs whether an obstacle is hard (impassable) or soft (speed penalty). Among soft obstacles, parked vehicles can be optionally ingested via a shallow deep-learning detection on aerial/satellite imagery []; detected footprints are vectorized and used to reduce effective corridor width along walkable surfaces, leaving the behavioral engine unchanged []. Walkability is encoded as a pedestrian graph derived from tessellated walkable polygons and centroid connections, supplemented by local permeability rules. Agents move in continuous space but query this graph to compute least-cost targets and trigger re-routing when link costs change (capacity usage, temporary closures). Assembly areas (waiting/safety spaces) are target nodes with capacity constraints and occupancy tracking for performance assessment []. A central scheduler advances environment fields and agent steps; stochastic elements (departure delays, tiebreakers, perception noise) are controlled by seeded streams to enable ensemble reproducibility and sensitivity analysis []. The simulator returns scalar metrics (total evacuation time, share reaching safety at fixed horizons, peak/mean densities), time series (occupancy/evacuation curves), and georeferenced raster/vector of cumulative footfall and congestion for before/after comparison in design iterations [,]. Bounded rationality is represented by finite perception, decision tolerances, and network-constrained route choice. Multiple parameters about agents’ behavior are defined. Agents perceive obstacles and peers within fixed radii (P_obstacle_consideration_distance = 3.0 m, P_pedestrian_consideration_distance = 3.0 m), accept small target deviations (P_tolerance_target = 0.8), and may attempt a detour with probability P_proba_detour = 0.5. Movement follows the Social Force Model (SFM) provided by GAMA with the parameter sets declared in the code: simple (P_A_pedestrian_SFM_simple = 4.5, P_relaxion_SFM_simple = 0.54, P_gama_SFM_simple = 0.35, P_lambda_SFM_simple = 2.0, P_n_prime_SFM_simple = 3.0, P_n_SFM_simple = 2.0). Desired speed is sampled from a truncated normal distribution (gauss (3.6, 1.8) km/h, clipped to 3–4 km/h). Route choice targets the nearest safe area along the pedestrian network, subject to capacity limits read from the shapefile attributes (max_capacity).
These values are empirically grounded by accepted ranges in the pedestrian-dynamics literature but are not fitted to site-specific trajectories. Accordingly, the model is used to compare design operators and capacity configurations rather than to predict individual routes. Validation is performed at the outcome level: (i) capacity consistency at assembly areas (occupied slots vs. max_capacity exported in goals.csv), and (ii) plausibility of spatio-temporal crowding patterns derived from the instant/history heatmaps.
5. Case Study
The case study focuses on the historic center of Atri (Abruzzo, Italy), a hilltop settlement characterized by compact medieval fabric, narrow streets with variable cross-sections and sharp curvature (Figure 1). This morphology, together with the prevalence of masonry buildings and tightly interlocked fronts, creates a highly constrained pedestrian network where small variations in effective width or continuity can trigger disproportionate congestion during emergency egress. The presence of a limited number of open public spaces of adequate size—potential waiting or safety areas—further concentrates evacuation demand along a few critical corridors, heightening sensitivity to local bottlenecks and temporary impediments.
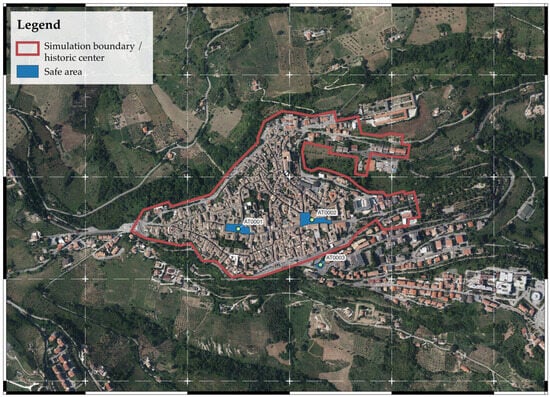
Figure 1.
Aerial view of the area.
These spatial properties align with issues repeatedly documented in city-scale evacuation studies, in which accessibility of open spaces and barrier states condition time-to-safety outcomes. The knowledge base integrates institutional vector datasets (building footprints, public space polygons, street fabric) with orthophotos and derived layers used to operationalize evacuation modelling. Buildings are represented as polygons with attributes required by the simulator (e.g., height or frontage where available), while candidate emergency safe areas are digitized and parameterized with conservative capacity assumptions. Safe areas come from the Civil Protection Emergency Plan for the Municipality of Atri. A conservative capacity was assigned to each designated waiting area by dividing its net usable surface by 2.5 m2 per person (as a precaution for the possibility that the crowd might stay for a long time). This threshold, already adopted in previous assessments on size and site selection of emergency assembly points [], balances the need to prevent excessive crowding with the operational requirement to accommodate short-to-medium stays during post-event coordination (e.g., triage, information, redistribution). In the simulator, this value becomes a hard capacity constraint: once instantaneous occupancy approaches the computed limit, incoming agents are re-routed to alternative areas, and the resulting occupancy trajectories are recorded for performance assessment. Table 1 shows safe area surface and capacity calculated according to these parameters.

Table 1.
Safe area dimension and capacity.
Population proxies are associated with address points to define origins and initial agent allocations. Number of residents for each address points were provided by the local municipality in an excel table containing addresses and residents (e.g., “Street name and house number, number of residents”). The table was imported in QGIS and geocoded using MMQGIS plugin in order to generate georeferenced points in the case-study environment. Walkability is encoded by deriving a pedestrian graph from the polygonal street fabric via regular tessellation and centroid connectivity, preserving local permeability and enabling shortest-path queries and dynamic re-routing during the simulation. Assembly areas are treated as target nodes with capacity and occupancy tracking, while buildings function as non-walkable obstacles that also shape visibility fields along the network. To reflect Atri’s historically constrained cross-sections, a layer of soft obstacles is introduced, accounting for localized reductions in effective width along key corridors. Among these, parked vehicles are detected from recent aerial/satellite imagery through a lightweight deep-learning workflow; detections are vectorized and used to apply segment-level width penalties without altering the behavioral engine.
6. Results
The simulation framework is based on a set of general parameters that are consistent across all case studies. These include: the total number of people evacuating from each building and traveling to designated emergency assembly areas via the shortest available route; the time taken to reach these areas; and the progressive occupancy rate of each emergency zone over time. The simulation results are organized into two scenarios: the first (Scenario 0) corresponds to the current spatial configuration of each campus, while the second (Scenario 1) reflects an optimized layout developed through the application of UDS-b strategies. The simulation code was custom developed by the authors and calibrated to ensure effective integration between the modeling environment and pre-processed geospatial data in a GIS environment. These spatial data form the foundation of the modeling process. At the end of each simulation, a georeferenced raster output is generated that represents the level of crowding along the pedestrian routes used during the evacuation. This output can be directly overlaid on the original spatial data to allow for comparative and visual analysis.
6.1. Scenario 0—Initial Conditions for Urban Performance
In the baseline configuration, as mentioned before, the historic center of Atri is modelled with three designated waiting areas (AT0001, AT0002, AT0003). The spatial layer visualizes and enforces both permanent barriers (building fronts, walls, fenced perimeters) and soft impediments along corridors (local narrowings, curvature-induced pinch points, and parked vehicles vectorized from aerial/satellite imagery via a lightweight deep-learning workflow), as recommended for credible city-scale evacuation assessment in heritage fabrics (Figure 2).
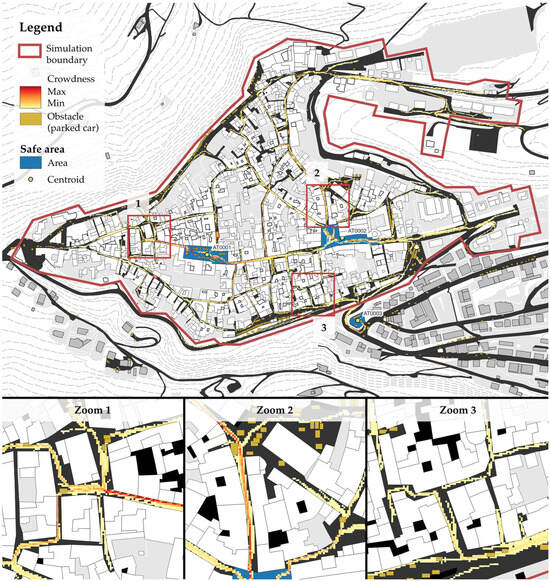
Figure 2.
Scenario 0: The results of applying the initial conditions (pre-project) of the simulation.
These impediments are treated as non-walkable (hard) or penalized (soft) obstacles and are rendered on the georeferenced outputs to make critical path constraints explicit during analysis [,]. The occupancy trajectories of the three safe areas (Figure 3) show differentiated uptake dynamics. AT0001 exhibits the fastest growth and reaches saturation at approximately 4.38 min, after an inflection between 3–4 min; this rapid filling suggests a favorable catchment and short access paths, but also signals a potential under sizing relative to its demand basin. AT0002 follows a steadier trajectory, surpassing 60% around 3 min, approaching ~98–100% by ≈5.45 min, which indicates balanced accessibility with residual tail effects likely linked to downstream corridor capacity. AT0003 displays a delayed onset (near zero until roughly 2 min), a mid-course acceleration between 3–5 min, and completes at about 5.83 min; the late start and long tail are consistent with longer approach routes and sensitivity to localized narrowings highlighted in the obstacle layer.
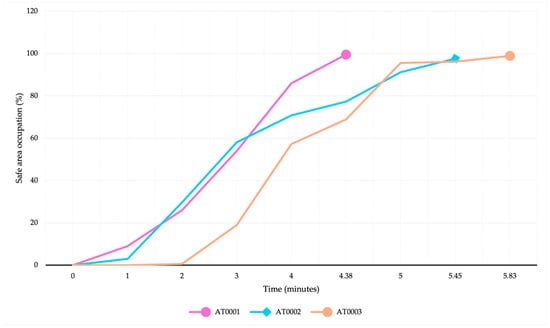
Figure 3.
Scenario 0: safe area occupation over time.
These patterns—early saturation in proximal areas, steady but extended filling for centrally located spaces, and delayed convergence for peripheral or poorly connected spaces—mirror established findings on the interplay between open-space accessibility, corridor capacity, and temporary impediments in evacuation performance. Overall, Scenario 0 reveals (i) a high dependency on a limited set of feeder corridors, where mapped obstacles concentrate congestion, and (ii) asymmetric demand among the three waiting areas, with AT0001 absorbing arrivals quickly and AT0003 underperforming until impediments clear. For Scenario 0, from a total of 2831 people, 986 can’t reach safe areas due to not sufficient capacity. These diagnostics provide the evidence base for UDS-b adjustments in Scenario 1, targeting corridor regularization, selective capacity rebalancing across the three areas, and the mitigation of soft obstacles to shorten tails in the occupancy curves.
6.2. Scenario 1—Optimized Urban Performance Conditions
The simulation applied to Scenario 0 made it possible to identify critical issues for evacuation and, consequently, critical issues in the structure and urban form that increase risk. The aim of the research is therefore to precisely define the urban elements that determine these critical issues and to intervene on their form to reduce the risk. This intervention takes the form of applying UDS-b techniques to urban contexts in Scenario 0 []. These interventions aim to reconfigure and reorganize the system of open public urban spaces, considered emergency areas, i.e., waiting or safety areas. This is done with the aim of reducing the risk of evacuation and, consequently, the time required for it, and eliminating the spatial obstacles that affect and make pedestrian flow critical.
6.2.1. UDS-b Techniques and Their Application
Simulation of Scenario 0 allows us to identify critical issues for evacuation during a specific disaster event. In our research, the simulation concerns a seismic event, but other hazards such as floods or landslides are also being studied. It is important to note that the GIS model of Scenario 0 is not only a representation of the current state of an urban structure, but also includes obstacles to evacuation identified in a specific urban risk study in two areas: (1) obstacles identified in an assessment of impediments caused by urban elements (specific shapes, street furniture, etc.); (2) obstacles derived from an analysis of the vulnerability of the built heritage, through which the possible damage to this heritage is identified and, therefore, the obstacles caused by the probable fall of debris or the opening of cracks. Debris are static and are generated from the buildings with the highest vulnerability index. This data comes from the Municipality’s emergency plan that, according to the Italian regulations on these topics, contains insights and evaluations on built environment vulnerability. Obstacles identified with satellite images deep-learning analysis are static as well. In this article, the measures envisaged for risk reduction (UDS-b) refer only to the first field of study, obstacles. The table below (Table 2) is the result of a collection of studies that consider both above fields and do not only provide a classification of obstacles to evacuation but a complete collection of all factors that prevent evacuation.
Table 2.
Risk factors for evacuation (revised from []).
The risk factors for evacuation (Table 2) represent the structural elements and conditions of a neighborhood or urban district (but also of the entire city) that prevent or slow down evacuation during a disaster. It is these factors that UDS-b techniques act upon, with the aim of reducing urban risk as defined at the beginning of Section 6.2.1 to acceptable levels as much as possible. These techniques, which are currently in the classification and exemplification phase, aim to reduce or eliminate the effect of direct and indirect obstacles (category 1 in Table 2), improve the accessibility and design of emergency shelters (categories 2 and 3 in Table 2), and increase the efficiency of technological and road networks (category 4 in Table 2). Scenario 1 described in the following section derives from the application of these techniques.
6.2.2. Safety-Based Redesign with Distributed Micro Safe Areas
Scenario 1 operationalizes a UDS-b technique that introduces a distributed system of micro safe areas uniformly embedded within the historic fabric. Each new area is parameterized with conservative capacity (net area/2.5 m2 per person) and mapped to the pedestrian graph as a target node, thereby shortening access distances and diversifying feasible destinations for simulated residents. The obstacle layer remains active (permanent barriers and soft impediments), but local routing pressure is rebalanced by increasing the density of admissible refuge points across the center. The occupancy trajectories (Figure 4) evidence a marked temporal dispersion of arrivals across nine safe areas (AT0001–AT0009), with several micro areas saturating very rapidly (e.g., AT0006 ≈ 1.4 min; AT0009 ≈ 2.5 min; AT0007 ≈ 4 min), while others stabilize at partial loads (AT0003 ≈ 33%; AT0004 ≈ 45%) and only a few carries a longer tail (e.g., AT0005 approaching 100% near ≈18 min). Compared to Scenario 0—where three areas absorbed demand with early saturation and long residual queues—the peak loads are redistributed, early local saturations occur closer to origins, and plateau effects in mid-size areas indicate relief of corridor bottlenecks rather than overflow. These dynamics are consistent with the expected benefits of increasing refuge granularity in constrained fabrics: shorter egress paths, more balanced catchments, and reduced competition on the same feeder links [].
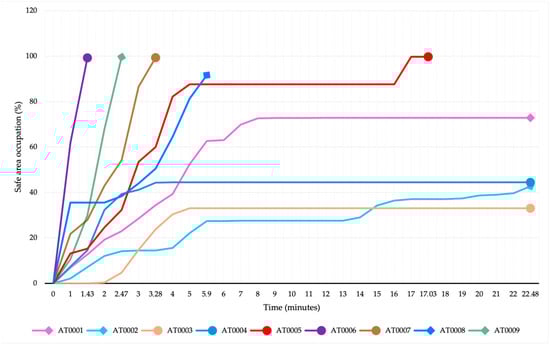
Figure 4.
Scenario 1: safe area occupation over time.
The georeferenced “crowdness” maps for Scenario 1 (Figure 5) show attenuated hot spots along the primary east–west spine and at previously critical junctions (Zooms 1–3). By creating additional target nodes within one or two turns of most origins, the redesign breaks up long, curvature-constrained corridors typical of the medieval network and limits the build-up of density at choke points identified in Scenario 0. This spatial smoothing reflects the coupling of behavioral re-routing with increased destination availability, a pattern also emphasized in evacuation literature when open-space accessibility is improved []. Relative to Scenario 0, the micro-area strategy:
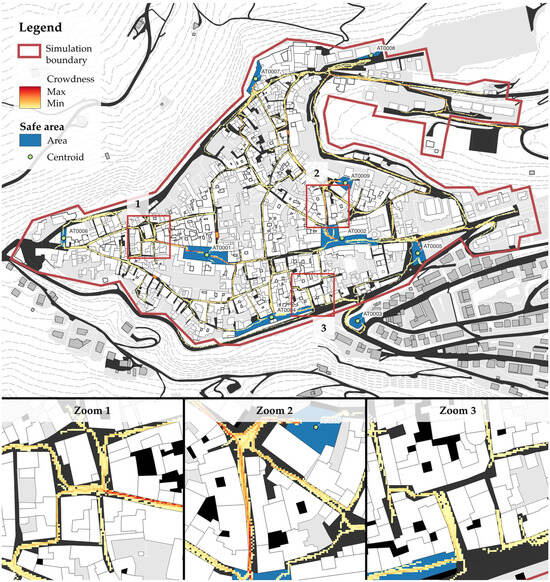
Figure 5.
Scenario 1: Simulation results when applying post-project conditions.
- (1)
- Reduces average time-to-safety for residents closest to the added refuges (early, steep occupancy curves).
- (2)
- Lowers maximum corridor densities by distributing flows onto multiple short approach paths.
- (3)
- Limits tail behavior to a small subset of areas influenced by terrain or residual soft obstacles.
- (4)
- Allows all citizens to reach safe areas.
These improvements substantiate the efficacy of UDS-b as a simulation-informed intervention: modest, spatially even additions to the refuge system yield disproportionate gains in evacuation performance (Table 3) without altering the behavioral engine or relaxing obstacle constraints (Figure 6).
Table 3.
Scenario 1 safe area dimension and capacity.
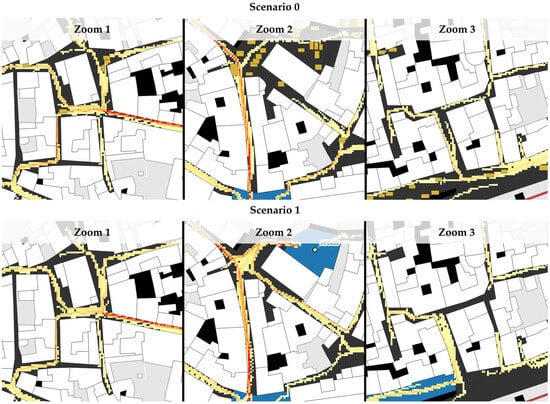
Figure 6.
Scenario 0 and 1 zoom comparison.
7. Conclusions
This study presented a simulation-driven approach to UDS-b, coupling an agent-based evacuation model with a geospatial representation of the historic centre of Atri in Italy. By translating morphological constraints and soft impediments into operational inputs, the framework quantified how modest spatial interventions—specifically, the introduction of uniformly distributed micro safe areas—can rebalance routing pressure, shorten effective egress distances, and dampen corridor bottlenecks. Methodologically, the contribution lies in the tight integration of GIS-backed urban form, behaviorally plausible agents, and design feedback cycles that convert performance diagnostics into spatial decisions. Substantively, the results support the use of evacuation performance as a measurable criterion for PDRP and the configuration of public space networks in heritage fabrics. The implementation is intentionally minimal and comparative. Behavioral parameters are range-grounded rather than site-fitted: desired speeds are sampled from a truncated normal, perception radii are fixed, and movement follows GAMA’s SFM with the declared simple/advanced parameter sets. “Herding” is not an explicit imitation term; it emerges from local interactions and congestion within SFM and the network constraints. Decision-making is bounded via tolerances and simple heuristics: agents target the nearest assembly area on the pedestrian network, accept small target deviations, and may attempt detours with a fixed probability. The model does not represent heterogeneity in compliance, learning, or information broadcasting (e.g., dynamic guidance), and signage is not modelled as a dynamic stimulus. Capacity at destinations is enforced through the max_capacity attribute read from shapefiles, and occupancy is recorded. However, door/queue mechanics at exits are not explicitly modelled and moving obstacles or vehicles are not active in the experiments. The environment is static; hazards are not explicitly simulated. Validation is conducted at the outcome level (capacity consistency at assembly areas; plausibility of instant/history heatmaps) rather than through trajectory-level calibration, due to the unavailability of micro-data. For these reasons, the model is intended for relative appraisal of design operators and capacity configurations—i.e., to rank interventions and stress-test civil-protection parameters—rather than to produce absolute, site-calibrated evacuation-time predictions.
With this case study, a safety-based urban design strategy that removes on-street parking within the historic core to restore effective pedestrian width and reduce conflict points during evacuations was explored. While this is framed as a “what-if” scenario—since it presupposes the creation of peripheral public parking areas and associated access management—it illustrates how strategic, network-scale interventions can measurably improve responsiveness and resilience under natural-hazard conditions. By clearing stationary vehicles, the public-space system becomes more legible and permeable, lowering congestion risk, shortening clearance times, and increasing the robustness of route alternatives when localized bottlenecks occur. This approach is inherently strategic rather than purely tactical: it requires coordinated land-use decisions for replacement parking, staged implementation, and operational protocols for emergency alerts (e.g., temporary parking bans during forecast windows). It also yields important co-benefits beyond emergencies—enhanced walkability, improved public-realm quality, and reduced visual clutter—supporting the everyday functioning and heritage value of historic centers. Our results should be read as comparative evidence: the simulation indicates performance gains under specified assumptions, but feasibility, equity implications, and stakeholder acceptance must be verified through design development, mobility planning, and participatory processes. In this sense, the Atri scenario serves as a transferable template for coupling evacuation performance analysis with strategic public-space reallocation in historic urban fabrics. At this stage the evacuation model is hazard-agnostic and represents the post-warning movement of pedestrians to designated safe areas. A specific earthquake (magnitude, intensity, duration) is not simulated nor simulate endogenous damage, debris, or link failures. Debris, as explained, is a static obstacle defined according to the elements contained in Emergency Plan of the local municipality. Results should therefore be read as comparative evidence of how spatial configurations influence evacuation performance, not as event-specific impact forecasts.
Future work will deepen behavioral realism and broaden operational scope along four lines.
(i) Agent typologies and inclusivity: we will extend the population model to incorporate distinct “types” of evacuees—e.g., persons with mobility, visual, or auditory impairments; children; older adults—assigning differentiated speeds, perception, assistance needs, and decision heuristics. This will enable equity-aware evaluation of design options and sensitivity tests on inclusive routing and refuge provision.
(ii) Real-time data and validation: building on the UDT architecture, we will integrate near-real-time data streams (e.g., sensors, mobile telemetry, operational reports) to inform boundary conditions, calibrate key parameters, and conduct progressive validation under controlled drills or routine crowd conditions—addressing known gaps in empirical grounding for evacuation ABMs.
(iii) Scalability and transferability: the pipeline will be applied to larger, denser contexts—multi-district cores and metropolitan sub-systems—to test computational scalability, robustness of behavioral modules under high loads, and portability of design heuristics across varying urban morphologies and risk profiles.
(iv) Coupling the model with seismic fragility and ground-motion scenarios to represent blockage, capacity loss, and time-varying pre-movement under shaking and aftershocks.
These extensions will advance the framework from a decision-support prototype to an operational toolchain for emergency planning and everyday urban design: capable of accommodating heterogeneous populations, leveraging live data for model credibility, and informing policy at scales ranging from historic districts to populous cities.
Author Contributions
Conceptualization, D.D.L. and A.D.M.; methodology, F.E.; software, G.Z.; validation, D.D.L. and A.D.M.; formal analysis, F.E.; investigation, D.D.L., F.E., G.Z. and A.D.M.; data curation, F.E. and G.Z.; writing—original draft preparation, D.D.L. and F.E.; writing—review and editing, A.D.M.; visualization, F.E. and G.Z.; supervision, D.D.L. and A.D.M. All authors have read and agreed to the published version of the manuscript.
Funding
The research described in this paper is part of three research projects in which the University of L’Aquila is involved as a partner: SICURA Project—“Intelligent house of technologies for safety—L’Aquila”—Emerging Technologies Support Programme (FSC 2014-2020)—Axis I “House of Emerging Technologies”, Research Programme: Safe City: urban design and technologies for urban safety; the National Centre for HPC, Big Data and Quantum Computing—PNRR Project, funded by the European Union—Next Generation EU; European Union—NextGenerationEU—National Recovery and Resilience Plan (Piano Nazionale di Ripresa e Resilienza, PNRR)—Project: “SoBigData.it—Strengthening the Italian RI for Social Mining and Big Data Analytics”—Prot. IR0000013—Avviso n. 3264 del 28 December 2021.
Institutional Review Board Statement
Not applicable.
Informed Consent Statement
Not applicable.
Data Availability Statement
The original contributions presented in this study are included in the article. Further inquiries can be directed to the corresponding author.
Acknowledgments
During the preparation of this manuscript/study, the author(s) used QGIS, version 3.34 for the purposes of data analysis and optimization, cartographies generation. The authors have reviewed and edited the output and take full responsibility for the content of this publication.
Conflicts of Interest
The authors declare no conflicts of interest. The funders had no role in the design of the study; in the collection, analyses, or interpretation of data; in the writing of the manuscript; or in the decision to publish the results.
References
- FEMA. Pre-Disaster Recovery Planning Guide for Local Governments. FEMA Publication FD 008-03. 2017. Available online: https://www.fema.gov/sites/default/files/2020-07/pre-disaster-recovery-planning-guide-local-governments.pdf (accessed on 2 February 2024).
- Otsuyama, K.; Maki, N. A Comparative Analysis and Identification of Issues on Legislative Systems for Pre-Disaster Recovery Planning in Japan and U.S. J. City Plan. Inst. Jpn. 2018, 53, 132–143. (In Japanese) [Google Scholar] [CrossRef]
- IRP-UNISDR. Guidance Note on Recovery. Pre-Disaster Recovery Planning. International Recovery Platform and United Nations Office for Disaster Risk Reduction. 2012. Available online: https://www.preventionweb.net/files/31963_predisasterrecoveryweb.pdf (accessed on 2 June 2024).
- Di Ludovico, D.; Eugeni, F.; Zanfardino, G.; Di Marco, A. Simulating crowd behaviour to implement safety-based urban design techniques aimed at optimizing evacuation. J. Urban Des. 2025, 30, 401–422. [Google Scholar] [CrossRef]
- Eugeni, F.; Zanfardino, G.; Di Ludovico, D. A crowd simulation-based tool for environmentally hazard-conscious urban design. BDC-Boll. Del Cent. Calza Bini 2024, 24, 147–162. [Google Scholar]
- León, J.; March, A. An urban form response to disaster vulnerability: Improving tsunami evacuation in Iquique, Chile. Environ. Plan. B Plan. Des. 2016, 43, 826–847. [Google Scholar] [CrossRef]
- Fallah, M.; Masoud, M.; Navaie, A. Role of resilient and flexible urban space in disaster Management. Bull. Environ. Pharmacol. Life Sci. 2014, 3, 01–06. [Google Scholar]
- Taillandier, P.; Gaudou, B.; Grignard, A.; Huynh, Q.-N.; Marilleau, N.; Caillou, P.; Philippon, D.; Drogoul, A. Building, Composing and Experimenting Complex Spatial Models with the GAMA Platform. Geoinformatica 2018, 23, 299–322. [Google Scholar] [CrossRef]
- Taillandier, P.; Vo, D.A.; Amouroux, E.; Drogoul, A. GAMA: Bringing GIS and Multi-Level Capabilities to Multi-Agent Simulation. In Proceedings of the 8th European Workshop on Multi-Agent Systems, Paris, France, 16–17 December 2010. [Google Scholar]
- Iskandar, R.; Allaw, K.; Dugdale, J.; Beck, E.; Adjizian-Gérard, J.; Cornou, C.; Harb, J.; Lacroix, P.; Badaro-Saliba, N.; Cartier, S.; et al. Agent-based simulation of pedestrians’ earthquake evacuation; application to Beirut, Lebanon. arXiv 2023, arXiv:2309.02812. [Google Scholar] [CrossRef]
- Sara, S.; Eugeni, F.; Di Ludovico, D. Urban and Spatial Planning Through the Support Tool of the Regional Digital Twin. In Proceedings of the Innovation in Urban and Regional Planning, Input 2023, L’Aquila, Italy, 6–8 September 2023; Marucci, A., Zullo, F., Fiorini, L., Saganeiti, L., Eds.; Lecture Notes in Civil Engineering. Springer: Berlin/Heidelberg, Germany, 2024; pp. 221–229, ISBN 9783031541179, ISSN 2366-2557. [Google Scholar] [CrossRef]
- Yang, S.; Li, T.; Gong, X.; Peng, B.; Hu, J. A review on crowd simulation and modelling. Graph. Models 2020, 111, 101081. [Google Scholar] [CrossRef]
- Haghani, M.; Sarvi, M. Crowd behaviour and motion: Empirical methods. Transp. Res. Part B 2018, 107, 253–294. [Google Scholar] [CrossRef]
- Moghaddam, M.T.; Muccini, H.; Dugdale, J.; Kjagaard, M.B. Designing Internet of Behaviors Systems. In Proceedings of the 2022 IEEE 19th International Conference on Software Architecture (ICSA), Honolulu, HI, USA, 12–15 March 2022; pp. 124–134. [Google Scholar] [CrossRef]
- Jobert, O.; Predhumeau, M.; Dugdale, J. Modelling and simulating age-dependent pedestrian behaviour with an autonomous vehicle. In Proceedings of the 37th ECMS International Conference on Modelling and Simulation ECMS 2023, Florence, Italy, 20–23 June 2023. [Google Scholar] [CrossRef]
- Li, C.; Hou, J.; Cheng, W.; Gai, W. A multiagent-based modeling approach for emergency evacuation plan optimization during toxic gas releases within chemical plants. Process Saf. Environ. Prot. 2022, 163, 543–557. [Google Scholar] [CrossRef]
- Wang, G.-N.; Chen, T.; Chen, J.-W.; Deng, K.; Wang, R.-D. Simulation of crowd dynamics in pedestrian evacuation concerning panic contagion: A cellular automaton approach. Chin. Phys. B 2022, 31, 060402. [Google Scholar] [CrossRef]
- Almeida, J.E.; Rosseti, R.J.F.; Coelho, A.L. Crowd Simulation Modeling Applied to Emergency and Evacuation Simulations using Multi-Agent Systems. arXiv 2013, arXiv:1303.4692. [Google Scholar] [CrossRef]
- Chondrogiannis, T.; Bouros, P.; Emser, W. Simulation-based Evacuation Planning for Urban Areas. In Proceedings of the 29th International Conference on Advances in Geographic Information Systems (SIGSPATIAL ’21), Beijing, China, 2–5 November 2021; ACM: New York, NY, USA, 2021. 4p. [Google Scholar] [CrossRef]
- Chooramun, N.; Lawrence, P.; Galea, E. Urban scale evacuation simulation using buildingEXODUS. In Proceedings of the 14th Interflam 2016 Conference Proceedings, London, UK, 4–6 July 2016; p. 2. Available online: http://www.intersciencecomms.co.uk/html/conferences/Interflam/If16/if16.htm (accessed on 14 May 2025).
- Kleinmeier, B.; Zönnchen, B.; Gödel, M.; Köster, G. Vadere: An Open-Source Simulation Framework to Promote Interdisciplinary Understanding. Collect. Dyn. 2019, 4, 1–34. [Google Scholar] [CrossRef]
- Pluchino, A.; Garofalo, C.; Inturri, G.; Rapisarda, A.; Ignaccolo, M. Agent-Based Simulation of Pedestrian Behaviour in Closed Spaces: A Museum Case Study. J. Artif. Soc. Soc. Simul. 2014, 17, 16. [Google Scholar] [CrossRef]
- Yoshimura, Y.; Sobolevsky, S.; Ratti, C.; Girardin, F.; Carrascal, J.P.; Blat, J.; Sinatra, R. An Analysis of Visitors’ Behavior in the Louvre Museum: A Study Using Bluetooth Data. Environ. Plan. B Plan. Des. 2014, 41, 1113–1131. [Google Scholar] [CrossRef]
- Liu, Y.; Lyu, L. Diversified Crowd Evacuation Method in Large Public Places. IEEE Access 2019, 7, 144874–144884. [Google Scholar] [CrossRef]
- Simonov, A.; Lebin, A.; Shcherbak, B.; Zagarskikh, A.; Karsakov, A. Multi-agent crowd simulation on large areas with utility-based behavior models: Sochi Olympic Park Station use case. Procedia Comput. Sci. 2018, 136, 453–462. [Google Scholar] [CrossRef]
- Mahmood, I.; Haris, M.; Sarjoughian, H. Analyzing Emergency Evacuation Strategies for Mass Gatherings using Crowd Simulation And Analysis framework: Hajj Scenario. In Proceedings of the SIGSIM-PADS ’17: 2017 ACM SIGSIM Conference on Principles of Advanced Discrete Simulation, Singapore, 24–26 May 2017; pp. 231–240. [Google Scholar] [CrossRef]
- Sidiropoulos, G.; Kiourt, C.; Moussiades, L. Crowd simulation for crisis management: The outcomes of the last decade. Mach. Learn. Appl. 2020, 2, 100009. [Google Scholar] [CrossRef]
- Sasabe, M.; Fujii, K.; Kasahara, S. Road network risk analysis considering people flow under ordinary and evacuation situations. Environ. Plan. B Urban Anal. City Sci. 2020, 47, 759–774. [Google Scholar] [CrossRef]
- Kim, J.; Park, J.; Kim, K.; Kim, M. RnR-SMART: Resilient smart city evacuation plan based on road network reconfiguration in outbreak response. Sustain. Cities Soc. 2021, 75, 103386. [Google Scholar] [CrossRef]
- Bretschneider, S.; Kimms, A. Pattern-based evacuation planning for urban areas. Eur. J. Oper. Res. 2012, 216, 57–69. [Google Scholar] [CrossRef]
- Howard, E.; Pasquini, L.; Arbib, C.; Di Marco, A.; Clementini, E. Definition of an Enriched GIS Network for Evacuation Planning. In Proceedings of the 7th International Conference on Geographical Information Systems Theory, Applications and Management (GISTAM2021), Virtual Event, 23–25 April 2021; pp. 241–252. [Google Scholar] [CrossRef]
- Yang, M.; Kumar, S.; Wang, X.; Fry, M.J. Scenario-robust pre-disaster planning for multiple relief items. Ann. Oper. Res. 2021, 335, 1241–1266. [Google Scholar] [CrossRef] [PubMed]
- Yin, L.; Chen, J.; Zhang, H.; Yang, Z.; Wan, Q.; Ning, L.; Hu, J.; Yu, Q. Improving emergency evacuation planning with mobile phone location data. Environ. Plan. B Urban Anal. City Sci. 2020, 47, 964–980. [Google Scholar] [CrossRef]
- Wachtel, G.; Schmöcker, J.-D.; Hadas, Y.; Gao, Y.; Nahum, O.E.; Ben-Moshe, B.P. Planning for tourist urban evacuation routes: A framework for improving the data collection and evacuation processes. Environ. Plan. B Urban Anal. City Sci. 2021, 48, 1108–1125. [Google Scholar] [CrossRef]
- Shiwakoti, N.; Sarvi, M. Understanding pedestrian crowd panic: A review on model organisms approach. J. Transp. Geogr. 2013, 26, 12–17. [Google Scholar] [CrossRef]
- Al-Kodmany, K. Crowd management and urban design: New scientific approaches. Urban Des. Int. 2013, 18, 282–295. [Google Scholar] [CrossRef]
- Han, T.; Zhao, J.; Li, W. Smart-Guided Pedestrian Emergency Evacuation in Slender-Shape Infrastructure with Digital Twin Simulations. Sustainability 2020, 12, 9701. [Google Scholar] [CrossRef]
- Kim, S.; Shekhar, S.; Min, M. Contraflow Transportation Network Reconfiguration for Evacuation Route Planning. IEEE Trans. Knowl. Data Eng. 2008, 20, 1115–1129. [Google Scholar] [CrossRef]
- Kumar, K.; Romanski, J.; Van Hentenryck, P. Optimizing Infrastructure Enhancements for Evacuation Planning. In Proceedings of the Thirtieth AAAI Conference on Artificial Intelligence, Phoenix, AZ, USA, 12–17 February 2016; Volume 30. [Google Scholar] [CrossRef]
- Radianti, J.; Granmo, O.C.; Bouhmala, N.; Sarshar, P.; Yazidi, A.; Gonzalez, J. Crowd Models for Emergency Evacuation: A Review Targeting Human-Centered Sensing. In Proceedings of the 46th Hawaii International Conference on System Sciences, Wailea, HI, USA, 7–10 January 2013; pp. 156–165. [Google Scholar] [CrossRef]
- Karamouzas, I.; Sohre, N.; Narain, R.; Guy, S.J. Implicit Crowds: Optimization Integrator for Robust Crowd Simulation. ACM Trans. Graph. 2017, 36, 1–13. [Google Scholar] [CrossRef]
- Wang, J.; Zhang, L.; Shi, Q.; Yang, P.; Hu, X. Modeling and simulating for congestion pedestrian evacuation with panic. Phys. A Stat. Mech. Its Appl. 2015, 428, 396–409. [Google Scholar] [CrossRef]
- Aszkowski, P. Deepness: Deep neural remote sensing plugin for QGIS. SoftwareX 2023, 23, 101495. [Google Scholar] [CrossRef]
- Şenik, B.; Uzun, O. An assessment on size and site selection of emergency assembly points and temporary shelter areas in Düzce. Nat. Hazards 2021, 105, 1587–1602. [Google Scholar] [CrossRef]
- Bramerini, F.; Castenetto, S. (Eds.) Manuale per l’Analisi della Condizione Limite per l’Emergenza (CLE) dell’Insediamento Urbano; Commissione Tecnica per la Microzonazione Sismica, Dipartimento della Protezione Civile: Roma, Italy, 2016. Available online: https://www.protezionecivile.gov.it/static/5e8b2e1be3692d4ba5682907650bd518/CLE2.pdf (accessed on 11 August 2025).
- Alkassabany, N.; Abouelfadl, H.; Alkassabany, Y. Enhancing pedestrian safety to improve urban health. BAU J. Health Wellbeing 2018, 1, 22. [Google Scholar]
- Cai, K.; Wang, J. Urban design based on public safety—Discussion on safety-based urban design. Front. Archit. Civ. Eng. China 2009, 3, 219–227. [Google Scholar] [CrossRef]
- EC-DGJFS. Pianificazione, Disegno Urbano, Gestione degli Spazi per la Sicurezza. Manuale. Politecnico di Milano–DIAP, IAU île-de-France, Regione Emilia-Romagna. 2007. Available online: http://www.costtu1203.eu/wp-content/uploads/2014/10/Manuale-Italiano.pdf (accessed on 11 August 2025).
- Murao, O. Case study of architecture and urban design on the disaster life cycle in Japan. In Proceedings of the 14th World Conference on Earthquake Engineering, Beijing, China, 12–17 October 2008; Available online: https://www.iitk.ac.in/nicee/wcee/article/14_S08-032.PDF (accessed on 20 May 2024).
- Bernardini, G.; Romano, G.; Soldini, L.; Quagliarini, E. How urban layout and pedestrian evacuation behaviours can influence flood risk assessment in riverine historic built environments. Sustain. Cities Soc. 2021, 70, 102876. [Google Scholar] [CrossRef]
- Santibáñez, L.R. Urban Evacuation Tsunamis: Guidelines for Urban Design. J. Eng. Archit. 2016, 4, 117–132. [Google Scholar] [CrossRef]
- Hosseini, K.A.; Jafari, M.K.; Hosseini, M.; Mansouri, B.; Hosseinioon, S. Development of urban planning guidelines for improving emergency response capacities in seismic areas of Iran. Disasters 2009, 33, 645–664. [Google Scholar] [CrossRef]
- WHO-ROE. Urban Planning, Design and Management Approaches to Building Resilience—An Evidence Review: First Report on Protecting Environments and Health by Building Urban Resilience; WHO Regional Office for Europe: Copenhagen, NY, USA, 2022; Available online: https://www.who.int/europe/publications/i/item/WHO-10665-355761 (accessed on 11 August 2025).
- March, A.; León, J. Urban Design: An Underutilized Tool for Disaster Risk Reduction? In Proceedings of the 7th State of Australian Cities Conference, Gold Coast, Australia, 9–11 December 2015; Available online: https://apo.org.au/node/63341 (accessed on 11 August 2025).
- Fei, W.; Lu, D.; Li, Z. Research on the layout of urban disaster-prevention and risk-avoidance green space under the improvement of supply and demand match: The case study of the main urban area of Nanjing, China. Ecol. Indic. 2023, 154, 110657. [Google Scholar] [CrossRef]
- Yang, J. Safety Urban Planning and Design Based on Disaster Prevention, Crime Prevention and Psychological Safety. Open House Int. 2019, 44, 84–87. [Google Scholar] [CrossRef]
- Wei, Y.; Jin, L.; Xu, M.; Pan, S.; Xu, Y.; Zhang, Y. Instructions for planning emergency shelters and open spaces in China: Lessons from global experiences and expertise. Int. J. Disaster Risk Reduct. 2020, 51, 101813. [Google Scholar] [CrossRef]
- Jayakody, R.R.J.C.; Amaratunga, D.; Haigh, R. Plan and design public open spaces incorporating disaster management strategies with sustainable development strategies: A literature synthesis. MATEC Web Conf. 2018, 229, 04001. [Google Scholar] [CrossRef]
- Montejano-Castillo, M.; Moreno-Villanueva, M. The adaptability of public space in Mexico City after an earthquake: A preliminary classification. Int. J. Saf. Secur. Eng. 2016, 6, 104–113. [Google Scholar] [CrossRef]
- Liu, L.; Lin, Y.; Wang, S. Urban design for post-earthquake reconstruction: A case study of Wenchuan County, China. Habitat Int. 2014, 41, 290–299. [Google Scholar] [CrossRef]
- Zhu, W.; Xing, H.; Kang, W. Spatial Layout Planning of Urban Emergency Shelter Based on Sustainable Disaster Reduction. Int. J. Environ. Res. Public Health 2023, 20, 2127. [Google Scholar] [CrossRef]
- Coutinho-Rodrigues, J.; Sousa, N.; Natividade-Jesus, E. Design of evacuation plans for densely urbanised city centres. Munic. Eng. 2016, 169, 160–172. [Google Scholar] [CrossRef]
- Tsai, M.-T.; Chang, H.-W. Contribution of Accessibility to Urban Resilience and Evacuation Planning Using Spatial Analysis. Int. J. Environ. Res. Public Health 2023, 20, 2913. [Google Scholar] [CrossRef]
- Wang, J.; Li, J.; Li, J.; Feng, J.; Xu, S.; Liu, J.; Wang, Y. Performance optimization of the obstacle to corner bottleneck under emergency evacuation. J. Build. Eng. 2022, 45, 103658. [Google Scholar] [CrossRef]
Disclaimer/Publisher’s Note: The statements, opinions and data contained in all publications are solely those of the individual author(s) and contributor(s) and not of MDPI and/or the editor(s). MDPI and/or the editor(s) disclaim responsibility for any injury to people or property resulting from any ideas, methods, instructions or products referred to in the content. |
© 2025 by the authors. Licensee MDPI, Basel, Switzerland. This article is an open access article distributed under the terms and conditions of the Creative Commons Attribution (CC BY) license (https://creativecommons.org/licenses/by/4.0/).