Abstract
Flooding is a phenomenon that has become more frequent in recent years due to climate change. This also includes Poland, where a flood occurred in 2024 due to the inflow of the Genoese low. The main objective of the article is to comprehensively characterize this phenomenon in the Bóbr River Basin. To achieve this objective, available hourly hydro-meteorological data from stations monitored by the Polish Institute of Meteorology and Water Management were used. On this basis, the duration, magnitude, scale of the flood, and selected runoff measures were determined. Data shows that the flood was caused by rainfall, which occurred at the highest intensity between 13.09 and 15.09. The duration of the flood was 536 h, assuming warning levels as boundary points. The average duration of the flood in all stations was 125.32 h, and its average magnitude (ratio of the highest level to the alert level)—1.53. The 10-point flood scale adopted in the article indicates that the flood affected the area around Jelenia Góra the most (average 3.10 for the entire basin). In 6 out of 22 stations, the highest water flow measurements in history were recorded in 2024. The area around Jelenia Góra was selected as the region most exposed to flooding. This work can be a compendium of knowledge in the field of understanding the mechanisms related to flooding. It may be important in the context of formulating the future water policy, developing documents related to flood protection, adaptation to climate change and sustainable development goals.
1. Introduction
1.1. Geographical Overview of Floods and Climate Change in Europe
Flooding is a phenomenon that can be defined in many ways [1]. For example, according to the European Union Flood Directive 2007/60/EC, it is “the temporary covering of land by water that is not normally covered by water” [2]. Within this legal act, floods are categorised according to their source, mechanism of occurrence and characteristics [3,4]. Among these floods, river floods are distinguished as having caused an estimated 7 million deaths in the 20th century [5], and the direct global average annual loss due to their occurrence is estimated at USD 104 billion [6]. This value may increase by up to 83% in terms of human losses and by 240% in terms of direct flood losses as a result of climate change compared to the period 1976–2005 for a temperature increase scenario of 1.5 °C by 2100 [7]. As emphasized by Slater et al. [8], the risk of floods occurring every 20, 50 and 100 years will increase in temperate climate zones.
With respect to Europe, the largest floods in terms of fatalities for the period 1900–2024 concerned: North Sea Flood (1953)—more than 2000 victims, Danube Valley Floods (1926)—more than 1000 victims, Spanish flash floods (1973)—500 victims [9]. In recent history, a flood that claimed approximately 229 human lives (and also caused significant infrastructure damage) occurred in October and November 2024 in Valencia, Spain and was caused by the contact of cold air with warm waters of the Mediterranean Sea, which caused heavy rainfall (so-called gota fria—“cold drop”) [10]. Based on telemetry data, it was estimated that 199 km2 was flooded, directly affecting over 90,000 inhabitants [11]. The European Union-wide study also showed that without adaptation measures to reduce flood risk (which is regulated, among others, by the aforementioned Floods Directive [2]), annual flood damage in this region could increase from EUR 5.5 billion to EUR 98 billion by the 2080s [12]. Significantly, however, the analysis of 1729 flood events in Europe from 1950 to 2020 showed that the number of fatalities decreased five-fold over the above-mentioned 70 years, thanks to the flood protection measures and early warning systems used [13].
1.2. Overview of Floods and Climate Change in Poland
Poland also belongs to this climate zone, where floods of varying duration, magnitude and frequency have occurred in the past [14,15,16,17]. In the basins of the two largest rivers in this country, the Vistula and the Odra, larger floods occurred, for example, in 1997, 2001 and 2010 [17,18,19]. It is estimated that floods exceeding 0.25% of the Polish gross domestic product occur on average once every 5 years [20]. In the context of the floods in the Odra basin in 1997 and 2010, material losses amounted to almost 1% of GDP [21]. In Poland, flood protection is regulated by the provisions of the aforementioned Directive 2007/60/EC, the implementation of which is reflected in the Polish Water Law [1,22]. As part of these activities, related strategic documents are implemented in 6-year planning cycles [23], i.e., preliminary flood risk assessment, flood hazard and risk maps, and flood risk management plans [24,25]. The aim is to reduce the negative effects of floods on human health and life, the natural environment, economic activity and cultural heritage by developing a catalog of technical and non-technical flood protection measures [26]. Currently, Polish Waters is carrying out work related to the review and update of documents in the third planning cycle of the implementation of the Floods Directive [27].
For the 1997 flood, the return time of a phenomenon of similar size was estimated at 250–1000 years [28]; however, a similar flood occurred in the Odra River basin in 2024. Its cause, similarly to the 1997 flood, was heavy rainfall caused by the inflow of a low-pressure front from the Mediterranean Sea to Poland (especially southwest) [29]. The effects of this flood are currently difficult to estimate, because it occurred recently, and humanitarian aid for people affected by this phenomenon will continue for a long time (e.g., for Kłodzko, the reconstruction time of the city is estimated at 5 years). In Poland, on 16 September 2024, a state of natural disaster was introduced, which was announced for a period of 30 days in selected regions of the Silesian, Opole, Lower Silesian and Lubuskie voivodeships [30,31,32]. It was announced for the third time in post-war Poland (after 1945), which indicates the large scale of the phenomenon described. Until 3 October 2024, the uniformed services operation “Flood 2024” was also conducted in parallel in the areas affected by the natural disaster [33]. The flood particularly affected urbanized areas located in mountainous and foothill areas, such as Głuchołazy, Lądek-Zdrój, Nysa, Kłodzko, Stronie Śląskie, Lewin Brzeski, Kamienna Góra and Jelenia Góra. According to information provided by the Polish Prime Minister and the Chief of Police, nine people died as a result of the flood [34]. Losses resulting from the flood are difficult to estimate and concern the destruction of water infrastructure, cities, roads and railways. According to information provided by the Polish Minister of Finance, they will amount to tens of billions of zlotys, and the support offered by the EU to help flood victims with the amount of USD 5.58 billion may not be sufficient [35]. The importance of flood protection during catastrophic floods should be mentioned as the construction of the Niedzica–Czorsztyn dam and reservoir on the Dunajec River (Poland) in 1997 was a significant event. At that time, the entire flood wave was intercepted by the aforementioned reservoir and reduced the flow from 1400 m3/s to 400–600 m3/s. It completely protected the areas located below from destruction, and the costs of potential damage would amount to the cost of building the entire dam and reservoir investment with the necessary infrastructure. It was similar in 2024 on the Odra; the dry dam Racibórz Dolny (put into service in 2020) reduced the flood flow to a size that did not cause damage below and protected 2.5 million residents of three voivodeships: Silesia, Opole, and Lower Silesia [36].
1.3. Motivations, Objectives and Novelty of the Research
In connection with the above, the topic of flood analysis is important from the point of view of developing more effective flood protection and sustainable water management measures [37]. As a contribution to this type of analysis, the Bóbr River Basin area was selected as a research area, i.e., the largest left-side tributary of the Odra River, with a basin area of 5876 km2. This area is characterized by a snow–rain hydrological regime according to Dębski, i.e., there are usually two periods of floods: one occurs in spring as a result of snow and ice thawing (most often March), and the other is caused by heavy torrential and/or flooding rainfall in the summer (July–August) [38,39]. According to the analyses conducted by Hudak et al. [40], historical floods in this area occurred in 1897, 1958, 1977, 1981 and 1997, and were caused by heavy rainfall (also confirmed by Adynkiewicz-Piragas and Lejcuś [41]). It was estimated that the alert level (a conventional level indicating a flood hazard) being exceeded in the Bóbr River Basin area occurs, on average, once every 3–5 years (26 times during the 68 years analyzed). The degree of flood risk in the Bóbr River Basin area is determined by both natural factors (geological structure, soil type, forms of basin use, rainfall intensity) and anthropogenic factors (channel regulation, hydrotechnical structures, urbanization in the river valley) [38,40,42,43,44].
The main objective of the article is to comprehensively characterize the flood that occurred in the Bóbr River Basin area in September and October 2024. To achieve this objective, available hourly meteorological (precipitation) and hydrological (water levels, flows) data from measurement stations monitored by the Polish Institute of Meteorology and Water Management—State Research Institute (IMGW-PIB) were used [45,46,47]. The paper uses a general-to-detail approach, i.e., first, the main cause of the flood in the form of rainfall and its variability in time and space was presented, and then the hydrological data were characterized using the adopted criteria of flood duration, size and scale (based on the conventional states used in Poland—warning and alert). Finally, this description was supplemented with hydrological characteristics, i.e., relative measures of runoff (runoff layer and specific discharge). The results were compared both with reference to average conditions in the Bóbr River Basin (levels and flows from many years) and to past floods in this area (especially the flood of 1997). A novelty is the proposal in the manuscript of a flood scale adopted on the basis of data, expressed in a closed range of 0–10. The points most at risk of flooding were also indicated based on the applied criteria (hot spots), for which corrective actions are proposed first. This work can be a compendium of knowledge in the field of understanding the mechanisms related to the flood, which covered, in the context of the same causes, not only the area of Poland but also Austria, the Czechia, Germany, Hungary, Moldova, Romania and Slovakia [48]. It may be important in the context of formulating future water policy in Poland, as well as developing documents related to flood protection, adaptation to climate change on a national, local and regional scale (e.g., flood risk management plans, small retention programs) and sustainable development goals (especially SDG 13 “Climate action”). At present, no scientific works related to the 2024 flood have been published, so this is also an innovative element related to current challenges.
2. Materials and Methods
In the article, analyses were carried out according to the research scheme presented in Figure 1. Their details are described in Section 2.2 and Section 2.3.
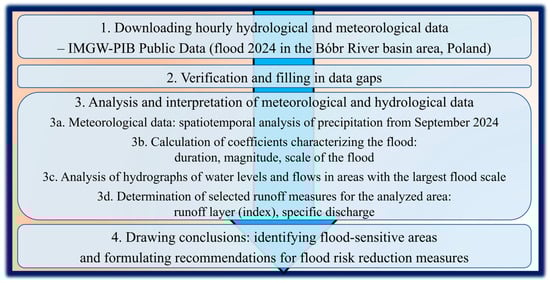
Figure 1.
Research scheme for the analyses presented in the article.
2.1. Study Area
The Bóbr River Basin area, located in the southwestern part of Poland and partly in the northern Czechia (Central Europe), was selected as the study area, with 99.2% of its area located within the borders of Poland. The basin area is 5876 km2 and the average gradient is about 0.3%. The source is located at an altitude of 780 m above sea level (m a.s.l.) in the Karkonosze Mountains (Bobrowy Stok), and the mouth is at an altitude of 38.1 m a.s.l., near Krosno Odrzańskie. The basin is part of the Upper Odra River basin and belongs to the Baltic Sea drainage basin area [49]. The main river is the Bóbr (272 km long), and the largest tributaries are the Kwisa, Czerna Wielka, Szprotawa and Kamienna (>30 km long). The largest share in the land use structure is forests (44.8%), agricultural land (24.1%) and grasslands (18.3%). It is an area with a low degree of urbanization (2.73% of the area) [50]. The nature of the flow, expressed by the specific discharge (the ratio of the average flow from the multi-year period to the basin area), shows that the streams in most of the Bóbr River Basin belong to the hydrological mountain or transitional/foothill type (division according to Kostrzewa’s method) [51]. The area lies in the temperate transitional warm climate zone (there is seasonal variability depending on the season, with the lowest temperatures in winter and the highest in summer). For example, the average annual air temperature for the Jelenia Góra station in the period 1981–2022 was 7.95 °C, while the average annual precipitation in this period was 686.7 mm [40]. According to the Kondracki regionalization, the Bóbr River Basin area belongs to the following macroregions: Western Sudetes, Central Sudetes, Western Sudeten Foothills, Silesian–Lusatian Lowland, Trzebnicki Rampart, Milicko–Głogowskie Depression, Zielona Góra Heights [52]. Figure 2 shows the location of the Bóbr River Basin area with marked hydrological and meteorological stations, based on which the analysis of the 2024 flood in this area was made, as described below.
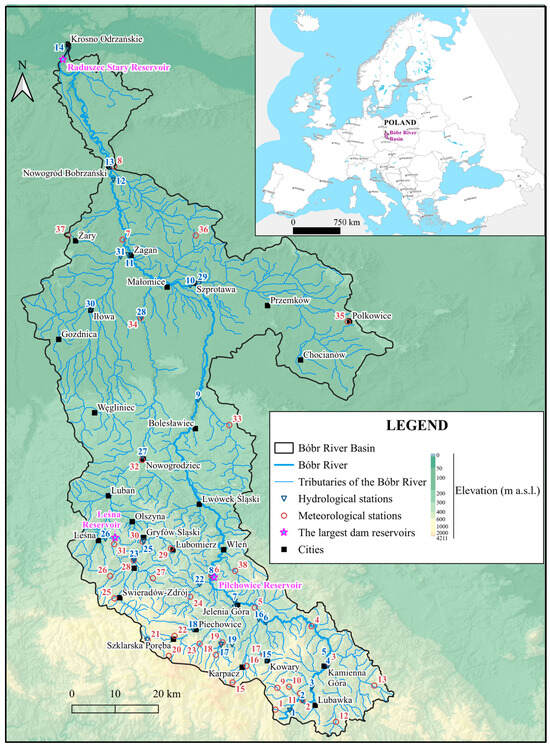
Figure 2.
Location of hydrological and meteorological stations and characteristic points in the Bóbr River Basin area (location of stations according to Hydro IMGW-PIB; https://hydro.imgw.pl/ (accessed on 20 October 2025; map base: https://www.mapsforeurope.org/explore-map/euro-dem (accessed on 20 October 2025)).
2.2. Research Data
The article uses and processes hourly meteorological and hydrological data available on websites run by the Polish Institute of Meteorology and Water Management—National Research Institute (IMGW-PIB), i.e., Hydro IMGW-PIB and IMGW-PIB Public Data [45,46]. Data from September and October 2024 were collected to analyze the course of flooding in the Bóbr River Basin.
In the case of meteorological data, the focus was on intense and long-lasting rainfall, which was the main cause of flooding in this area. The cause of its formation was the Genoese Low Boris (name given by a meteorological service), which occurred over Poland in the first half of September 2024 [53,54]. It is a low-pressure system that forms over the Gulf of Genoa (northern Italy). The main factor for its development is the large thermal contrast between warm Mediterranean air and cool air from the Alps and Central Europe. This low formed and moved in September 2024 towards the east and northeast, shaping weather conditions in a large part of Europe, especially in Poland, the Czechia, and Slovakia. It brought intense and long-lasting rainfall in the southwestern and southern parts of Poland (Figure 3). In addition to meteorological hazards, hydrological hazards also occurred at that time, causing floods, especially in mountain and foothill areas, in lower-lying areas and in the vicinity of rivers and reservoirs. A similar flood of similar size occurred in Poland in 1997. Its direct cause was two waves of heavy rainfall (4–8 July 1997 and 17–25 July 1997), also related to the same low-pressure system that formed over northern Italy as a result of the inflow of cold air from Western Europe. This low-pressure system moved to the northeast and caused the inflow of hot air masses from the Black Sea and the Mediterranean to the north, where cold air from the Baltic Sea areas was located. Heavy rainfall occurred on the border of both air masses, exceeding the multi-year average by many times. In July 1997, three times more rainfall fell, and in mountainous areas, even four or five times more than usual. The Odra River flow then increased to a value of 3500 m3/s, which had never been recorded before in history. Data measured hourly for the period from 9 to 16 September 2024 (8 days) from 37 meteorological stations for which most or all data were available were taken into account (information about them is included in Table 1, and the location—in Figure 2). Data gaps in the case of one station were supplemented based on the results from three neighboring stations, i.e., an average result was calculated.
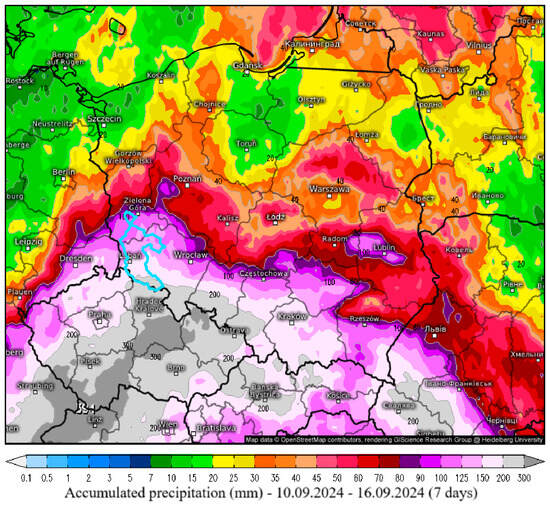
Figure 3.
Total accumulated precipitation in Poland for the period 10 September 2024–16 September 2024 with the Bóbr river basin area marked (Reprinted with permission from Ref. [55]. Copyright 2025 Miriam Kachelmann.

Table 1.
Information about meteorological stations in the Bóbr River Basin [45].
In relation to hydrological data, the beginning of the flood period was assumed to be the earliest occurrence of a warning state (initiating increased hydrological duty and observations in the flood-prone area) [56,57] at any of the measurement stations (in this case, 12 September at 12:00 UTC at the Leśna station on the Kwisa River), while the end was assumed to be the last recorded warning state in the analyzed area (4 October at 19:00 UTC at the Stary Raduszec station on the Bóbr River). In this case, data from 23 days were collected on water levels and flows measured every hour at 32 measurement stations (Table 2, Figure 2), and any gaps were supplemented by interpolation within the data sequence at a specific station (average values were calculated, assuming a proportional increase or decrease in levels/flows in the same time interval). In Table 2, in addition to the warning level, the alert water level is also included, which conventionally means the threat of flooding due to exceeding the marginal level at a given point.
Table 2.
Information about hydrological stations in the Bóbr River Basin [46].
2.3. Determination of the Flood Situation Based on Data
Based on the above data, maps illustrating the meteorological and hydrological situation in the Bóbr River Basin area (cumulative daily rainfall totals, duration of warning and alert levels, magnitude and scale of floods) were created. In the case of rainfall data, inverse distance weighting interpolation (IDW) was used between the analyzed stations (interpolation to show the overall temporal and spatial variability of rainfall data in the Bóbr river basin before the 2024 flood; according to the literature [58], the most reliable would be a combination of different interpolation methods to show such variability, but IDW itself is also used, e.g., [59,60]). The maps were made in QGIS 3.34.9 [61,62].
The course of the flood was also monitored hour by hour, marking the warning and alert levels at all stations in the period under study. The beginning and end of the flood were also determined at each station, also taking into account the longest, continuous duration (i.e., without a drop in water level below the warning level).
Hydrographs were also presented, showing the variability of water levels during the flood at hydrological stations with the largest flood scale (i.e., with the highest peak wave in relation to the alert level and with the longest duration, expressed as the average of these two variables, defined on a scale of 0 to 10 for observed actual data). Graphic materials were prepared in Microsoft Excel 2021 LTSC.
The criteria describing the flood within the article were, therefore, its duration df (the summed number of hours with warning and alert levels) and its magnitude mf (i.e., the ratio of the highest recorded water level Hmax to the alert level at a given hydrological station Halert). As mentioned above, the result of these two values would be the flood scale sf. The proposed point scales for all three variables introduced in this manuscript are presented in Table 3 (they reflect the flood situation for a selected, specific area and the scale introduced may differ for other cases; it should always be adapted to a specific data set). It was assumed that hydrological stations with an sf value of at least 5 were severely affected by the flood and should be areas of special concern in the context of planning future flood protection activities (so-called hot spots).
Table 3.
Criteria for assessing the duration (df), magnitude (mf) and scale of the flood (sf) in the article m.
An additional classifier of flood size was also the selected relative runoff measures calculated based on the data [63], i.e., runoff layer H (the ratio of the volume of water runoff during a flood V to the basin area at a given point A − H = V/A (mm); V = 3600; where 3600—number of seconds in an hour) and specific discharge q (the average flow during a flood from hourly flow values for exceeded warning levels divided by the basin area at a given station). Relative runoff measures allow for easy comparison and reduce the results to a common denominator, which is the basin area in a given calculation cross-section (hydrological station).
3. Results and Discussion
3.1. Meteorological Situation Causing Flooding
The main cause of the flood in September and October 2024 in the Bóbr River Basin area is the heavy rainfall caused by the inflow of the Genoese low (Boris) into this area. It was formed in the Gulf of Genoa in the Mediterranean Sea, and its formation is due to a number of factors, including [64,65]: (1) the meeting of cold and warm air masses; (2) high water surface temperatures in the Mediterranean Sea; (3) blocking by highs preventing its further movement; (4) the presence of higher areas in the passage (rising of humid air, its cooling, condensation and heavy rainfall).
The first rainfall began on 9 September at 5:00 UTC at the Żagań station, but the maximum rainfall in this area occurred on 13, 14 and 15 September (average daily rainfall from all stations: 61.5, 56.9 and 56.0 mm, respectively). On 16 September, rainfall was much smaller (average 7.4 mm), and in the following days, it was marginal compared to the analyzed period.
By following the dynamics of rainfall changes in the Bóbr River Basin, shown in Figure 4, it can be seen that the rainfall total was the highest in the southern, higher meteorological stations. The highest value was definitely 460.1 mm in Mała Kopa (station at an altitude of 1377.4 m a.s.l.). Rainfall exceeding 300 mm during the 8 days analyzed also fell in the next nine measuring stations, i.e., in decreasing order: Szrenica, Jakuszyce, Jarkowice, Szklarska Poręba, Kowary, Boguszów Gorce, Przesieka Jagniątków and Karpacz (values between 376.1 and 307.0 mm). The lowest rainfall totals, below 100 mm, occurred in the lower northern stations, i.e., in ascending order: Siecieborzyce (150 m a.s.l.), Nowogród Bobrzański, Żagań, Polkowice Dolne and Grabik (from 78.0 to 88.1 mm). The Genoese low itself moved from the southwest to the northeast, which could also have influenced such a distribution of rainfall [54]. The average rainfall total for the entire Bóbr River Basin was 227.0 mm in this period.
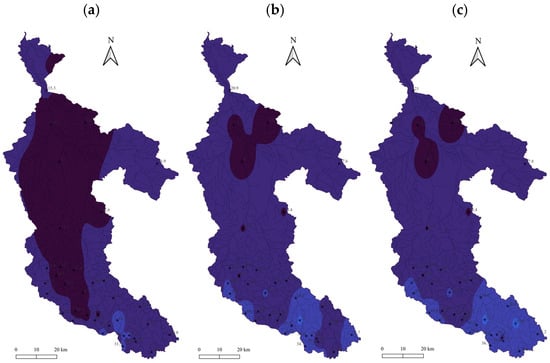
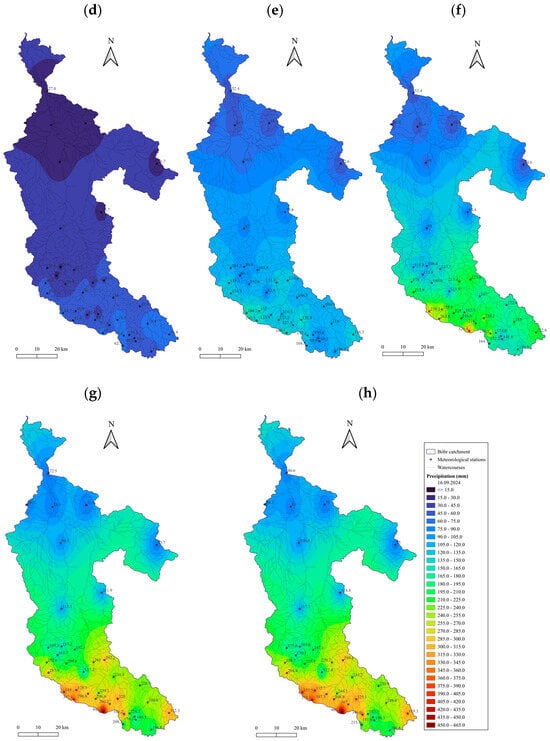
Figure 4.
Cumulative rainfall in the Bóbr River Basin area: (a) 9 September 2024, (b) 10 September 2024, (c) 11 September 2024, (d) 12 September 2024, (e) 13 September 2024, (f) 14 September 2024, (g) 15 September 2024, (h) 16 September 2024.
The intensity of precipitation can be evidenced by their comparison with the average annual precipitation total for the multi-year period 1974–2023 (Table 1). Of the 23 meteorological stations analyzed, the precipitation that occurred during the 8 days described constituted from 12.7% (Nowogród Bobrzański) to even 42.0% (Jagniątków) of the average annual precipitation for the multi-year period. The average for all stations was 27.5%. Assuming an even distribution of precipitation throughout the year, the aforementioned 8 days should constitute 2.2% of the annual precipitation, so in extreme cases, it was even 19 times this value. An additional factor intensifying the potential effects of this rainfall, manifesting itself as a flood, was the long period of drought in this region (for example, in Kowary, in July and August, 227.0 mm of rain fell, while during the analyzed 8 days, this value was 329.1 mm, and in the extreme, 3 days—245.4 mm). According to IMGW-PIB [54], September 2024 was wet in Poland according to the Kaczorowska classification, and precipitation in this month at the Jelenia Góra station compared to the multi-year average (1991–2020) amounted to 453.6%.
3.2. Flood Course
The effect of heavy rainfall was a rise in water levels and increased flows in streams that received the water carried by them. As can be seen in Figure 5, the first record of a warning state, meaning increased duty and more intensive monitoring of the hydrological situation in a given hydrological station, appeared on 12 September at 12:00 UTC at the Leśna station on the Kwisa River. The next day at 14:00 UTC, this state was announced in another five hydrological stations (Kamienna Góra, Pilchowice, Łomnica, Piechowice and Barcinek), and in the following hour—in three more (Jelenia Góra—Bóbr, Jakuszyce, Jelenia Góra—Kamienna). Two hours later (13.09, 17:00 UTC), in three stations (16, 18, 22—see Table 2), this level increased to alert, indicating a flood threat, and within the next 2 h—in another three stations (7, 8, 21). At that time, warning levels began in stations 3, 23, 24 and 25, while in 26, the last of them was recorded, which occurred again 18 h later. On 13 September from 20:00 to 23:00 UTC, warning or alert levels were recorded in 12 hydrological stations. On 14 September at 00:00 UTC, a warning level was announced in station 27, 4 h later—in station 6, and at 07:00 UTC—again in station 3. At that time, the aforementioned conventional levels were present in 14 stations. Subsequent warning levels were observed, respectively, at stations: 11, 28, 10, 9 and 15 (between 14.09 at 23:00 UTC and 15.09 at 07:00 UTC). Between the 68th and 77th hour of the analyzed flood situation (15.09 from 7:00 UTC to 16:00 UTC), alert or warning levels were observed at 20 out of 25 hydrological stations in the Bóbr River Basin area, where they were recorded. The last warning levels occurred at stations 31, 29, 13, 30 and 14 (at hours of the analyzed situation: 91, 96, 97, 100 and 134, respectively). The largest number of simultaneous warning and alert levels (21) occurred from 97 to 118 h of the flood (i.e., from 16.09, 12:00 UTC to 17.09, 09:00 UTC). The end time of warning levels was varied, i.e., chronologically in the analyzed hours: 118 (stations 23 and 24), 122 (22), 130 (6), 140 (3, 22), 144 (30), 148 (27), 159 (4), 182 (21), 186 (31), 197 (7), 200 (28), 207 (29), 208 (28), 221 (9), 266 (13), 315 (8), 355 (10), 372 (11). The last recorded warning level was observed on 04.10 at 19:00 UTC at station 14, i.e., Stary Raduszec on the Bóbr River (taking into account the continuity of levels, it would be 04.10 at 09:00 UTC). In general, the first reaction to rainfall occurred at stations on rivers located in mountainous areas, in their upper sections (e.g., the Łomnica and Kamienica rivers and the upper sections of the Bóbr River), while the latest water levels rose to warning in lower areas, in the lower sections of larger streams (especially the Bóbr and Kwisa Rivers).
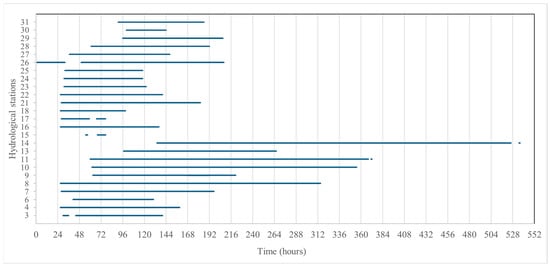
Figure 5.
The full course of the flood in 2024 in the Bóbr River basin based on warning and alert levels in individual hours (UTC) for hydrological stations (time: 0—12 September 2024, 11:00 UTC, 536—4 October 2024, 19:00 UTC).
When analyzing the longest flood durations (Table 4), they were varied, i.e., from 0 h in stations 2, 19 and 20 (respectively: Bukówka—Bóbr, Sosnówka—Sośniak, Podgórzyn—Podgórna) to 392 h in station 14 (Stary Raduszec—Bóbr). Usually, there was one flood wave, defined as a wave limited by warning levels; however, in the case of stations 26 (Leśna, Kwisa) and 17 (Jakuszyce, Kamienna) there were two—in the first case, the durations were 31 and 158 h, and in the second, 31 and 10 h. Sometimes, there were also single exceedances of warning levels or they lasted relatively short (less than 5 h; they are marked in the table in brackets). The average continuous duration of flooding in the Bóbr River Basin at stations where it was recorded was 140.36 h (5 d 8 h 03′). Taking into account three stations where flooding did not occur (warning levels were not reached), this time was 125.32 h (5 d 12 h 30′). However, looking at the entire time perspective, the flooding lasted from 12 September from 12:00 UTC to 4 October until 19:00 UTC, which is 536 h (22 d 20 h).
Table 4.
Extreme times of flood occurrence (in hours) in September and October 2024 in hydrological stations of the Bóbr River Basin area.
3.3. Characteristics of the Flood in the Bóbr River Basin Area
3.3.1. Duration of the Flood
The first variable characterizing the flood is its duration in relation to the recorded warning and alert levels, as well as their sum. The former occurred, on average, for 41.11 h (1 d 17 h 07′), the latter—84.89 h (3 d 12 h 53′), and in total—128 h. Usually, alert levels lasted longer than warning levels, with the exception of stations 15, 30, 17, 31, 29, 4 and 3. The ratio of the duration of alert to warning levels was, on average, 2.12, with the highest in stations 25, 14 and 21 (6.91, 6.31 and 5.00, respectively).
The longest warning levels were observed at stations 11 and 8 (113 and 109 h). Looking at the Bóbr River Basin area (Figure 6a), they are located in different places, but all of them are located on the Bóbr River. At the opposite end of the spectrum are stations 2, 19 and 20, where no warning levels occurred at all.
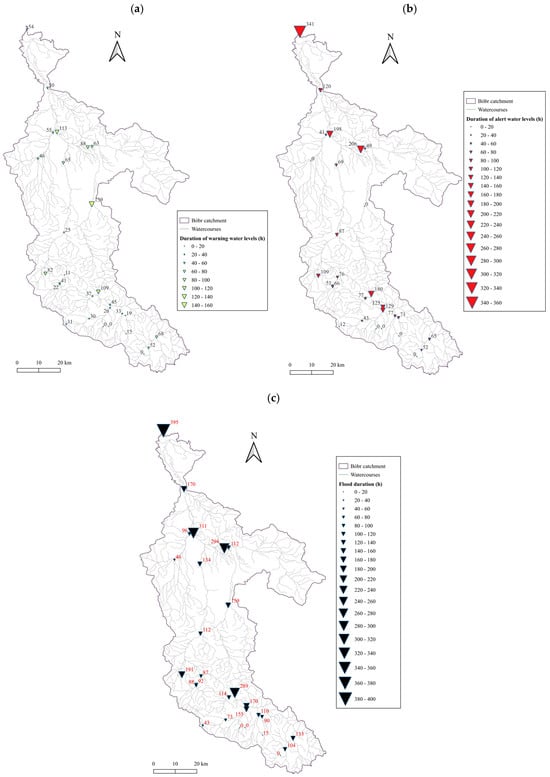
Figure 6.
Duration of conventional water levels in the Bóbr River Basin from 12 September to 4 October 2024 characterizing the flood (in hours): (a) warning levels, (b) alert levels, (c) total warning and alert levels (flood duration).
In relation to alert levels (Figure 6b), they were recorded for the longest at stations 14 (341 h) and 10 (206 h). At stations 11, 8, 9, 21, 7, 13 and 26, they occurred for more than 100 h. Alert levels were not recorded at five stations (30, 15, 2, 19 and 20), while in two of them, warning levels were observed (30 and 15), so the duty in relation to the flood situation was nevertheless intensified. The above-mentioned stations with the longest duration of alert levels are located mainly in the middle and lower reaches of the Bóbr River (five out of seven), the remaining two are the Kamienna and Kwisa Rivers.
The total duration of the flood (Figure 6c), which is one of the criteria for determining the scale of the flood in the article, was the highest in stations 14, 11, 10 and 8 (395, 311, 294 and 289 h, respectively). Translated to the adopted scale from 0 to 10, this is 9.99, 7.89, 7.44 and 7.31 h, respectively, which is a significant duration of the flood (higher than 5.0). It is worth mentioning that if the duration of alert levels were to be adopted as the criterion for the duration of the flood, the four stations with the longest duration would remain unchanged; only the order would change (swapping 11 and 10).
3.3.2. Magnitude of the Flood
Flood magnitude is characterized by the ratio of the highest recorded state during its duration (the culmination of the flood wave) to the alert level established for a given station. The alert level was adopted instead of the warning state, because by definition, it is identified with the beginning of the flood hazard. As can be seen on the map attached below (Figure 7), these values changed from 0.69 in station 20 (Podgórzyn) to 2.91 in station 8 (Pilchowice). The average value for the analyzed set was 1.53.
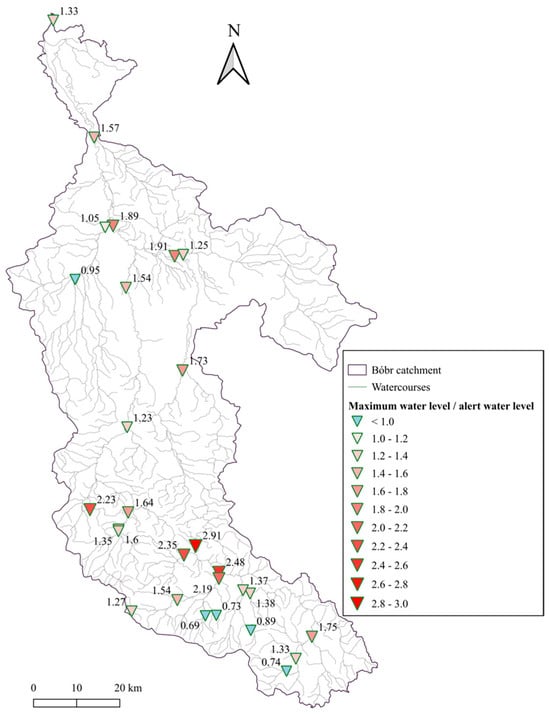
Figure 7.
Flood magnitude in the Bóbr River Basin from 12 September to 4 October 2024.
According to the adopted methodology, the magnitude on a scale from 0 to 10 in five stations was 0, i.e., it did not reach the alert level (in three cases, also the warning level). Above the value of 5, indicating a higher flood magnitude, there were seven stations, i.e., in descending order: 8, 7, 22, 26 and 21 (respectively: 10.00, 7.76, 7.04, 6.44 and 6.20). In this case, two stations are located on the Bóbr River, and one each on the Kamienna, Kamienica and Kwisa. It should be added that the maximum recorded levels could have been higher, because data from measurements from full hours were used, so the potential flood magnitude could have differed slightly from the one presented here (similarly to the number of occurrences of warning and alert levels).
3.3.3. Scale of the Flood
The flood scale (Figure 8), expressed as the average flood duration and flood magnitude on a scale from 0 to 10, varied between stations. Its average magnitude was 3.10. The lowest values were equal to 0.00 (no flood) in three stations, i.e., 19, 2 and 20. The highest, with a value of at least 5.00, were observed in stations 8, 11, 10, 7, 14, 26 and 21 (respectively: 8.67, 6.26, 6.11, 6.03, 5.85, 5.64 and 5.08). In these places, the flood lasted for a longer time and its magnitude was high compared to other stations. Most of them (five out of seven) are located in the middle and lower reaches of the Bóbr River, while the rest are located on the Kwisa and Kamienna Rivers. These are also the points where it is recommended to implement flood protection activities first.
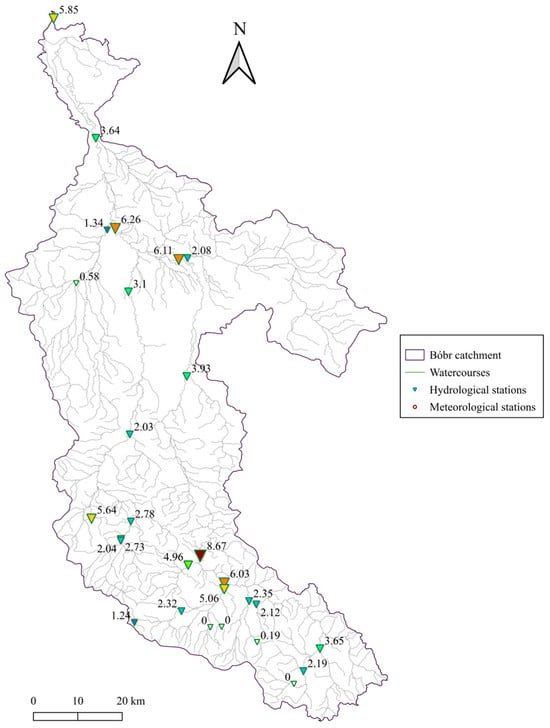
Figure 8.
Flood scale in the Bóbr River Basin from 12 September to 4 October 2024 (taking into account the duration and magnitude of the flood).
Particularly severe consequences of the flood among these places were recorded in Jelenia Góra (stations 7 and 21), where human property was destroyed as a result of the combination of high-water levels and flows from the Bóbr and Kamienna rivers, but significant economic and natural damage was also recorded. The next three out of seven stations, i.e., Pilchowice (8), Stary Raduszec (14) and Leśna (26), are located on the inflow or outflow of large retention reservoirs (respectively: Pilchowice, Stary Raduszec and Leśna), which collected water during the flood and were appropriately controlled to reduce the peak of the flood wave to the greatest extent possible. Szprotawa and Żagań (10 and 11) are stations located below the Pilchowice reservoir on the Bóbr river, where the effects of the flood were probably felt, among others, due to the too-late reaction to the situation related to the forecasted heavy rainfall in the context of preparing the Pilchowice reservoir for a flood situation; however, during the flood itself, the reservoir operated in accordance with the water management instructions (despite this, the scale of the damage in these two towns was not as large as, for example, in Jelenia Góra or, also located in the Odra River basin, Głuchołazy, Nysa or Kłodzko [36]. An example of a reservoir that helped to a large extent to improve the flood situation in the Odra River basin in 2024, which also includes the Bóbr River Basin, is the Racibórz Dolny reservoir, which limited the damage, among others, in Opole and Wrocław located lower on the Odra river (the reservoir took in about 147 million m3 of water, using 80% of its volume). A major role in limiting the effects of floods was played primarily by flood embankments, retaining walls, but also by protection from the population in the form of sandbags placed along the riverbeds [36]. As a reflection of the actual scale of destruction resulting from the flood, one can refer to the regulations introducing a state of natural disaster for a period of 30 days (from 16.09.2024, as amended) [30,31,32], resulting from the flood of 2024, which was announced in most of the Bóbr River Basin (Kamienna Góra, Karkonosze, Lwówek, Lubań, Bolesławiec counties, Szprotawa commune, Żagań, Nowogród Bobrzański, Dąbie and Krosno Odrzańskie, the city of Jelenia Góra, Małomice, Żagań). This state does not include hydrological station 30 (Iłowa), where the flood scale was 0.58, so its effects were marginal. It is worth adding that the Bóbr River Basin area was classified as an area at high and very high risk of flooding, in accordance with the regionalization of floods according to Ciepielowski [66].
The adopted point assessment of the flood scale is applicable to the described specific case and data set and could be changed for another basin or flood. Additionally, modifications could be introduced in relation to the assessment within the two adopted criteria, e.g., introducing different weights for both criteria (currently, both are treated as equally important), assuming the duration of the flood as the duration of the alert levels instead of the summed warning and alert levels, applying weights for warning and alert levels (e.g., 0.5 and 1), and assuming the quotient of the maximum level at a given station to the warning level instead of the alert level as the flood magnitude. Similarly, it would be possible to use a larger number of hydrological characteristics to adjust this scale, using, for example, runoff measures, data on multi-year levels and flows, comparisons with historical floods or the scale of destruction (social, economic, natural) resulting from the occurrence of this extreme hydrological phenomenon. This is a broad and multidimensional phenomenon and developing a universal scale for estimating the scale of floods is difficult. This article uses the approach of using conventional levels (warning and alert). The assessment scale itself could also be different, e.g., open, to adapt it to different types of floods and to be able to easily compare them. Looking at the actual scale of destruction, it would certainly be necessary to look at this issue more broadly, so that it could properly reflect current needs.
3.4. Hydrographs of Water Levels and Flows in the Areas with the Largest Flood Scale
A more detailed analysis of the hydrographs of water levels and flows (Figure 9) was carried out for eight stations where the calculated flood scale was the largest (i.e., its value was at least 5.0; in the last station, 4.96). These are stations (in descending order): 8, 11, 10, 7, 14, 26, 21 and 22. Looking at all the obtained graphs, it can be seen that water levels and flows correspond well with each other—their shapes are similar in each case.
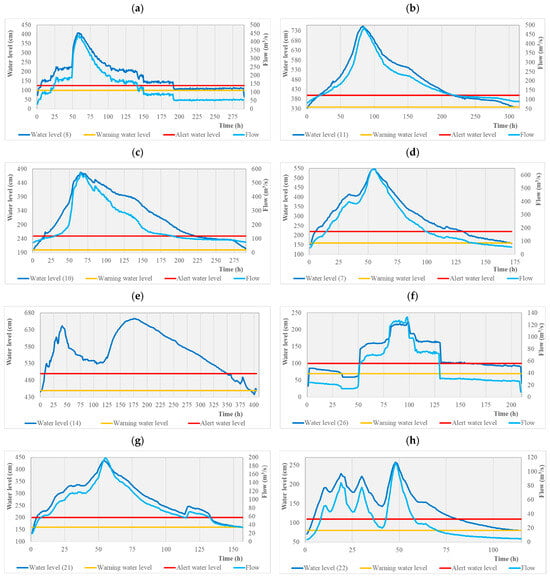
Figure 9.
Hydrographs of water levels and flows during floods at stations with the largest flood scale in the Bóbr River Basin area in 2024: (a) Pilchowice (Bóbr River; station 8), (b) Żagań (Bóbr River; station 11), (c) Szprotawa (Bóbr River; station 10), (d) Jelenia Góra (Bóbr River; station 7), (e) Stary Raduszec (Bóbr River; station 14), (f) Leśna (Kwisa River; station 26), (g) Barcinek (Kamienica River; station 21), (h) Jelenia Góra (Kamienna River; station 22); sorted by the largest scale of the flood sf.
In relation to water levels, for six out of eight stations, one clear flood wave maximum is visible. The exception is station 14, i.e., Stary Raduszec on the Bóbr River (Figure 9e), where such waves appeared twice—the first one lasted 125 h, the second—the remaining 275. This situation may result from the action of the recipient’s backwater, i.e., the Odra River, on which the flood wave also passed. In addition, this is a station in the mouth of the Bóbr River, so water from other tributaries from the basin area could flow at different times. In station 22 (Barcinek, Kamienica River; Figure 9g), three such waves occurred; however, similarly to station 14, they were higher than the warning level. This is a point near the mouth of the Pilchowice reservoir (Bóbr River; Figure 9a), which may be affected by water management conducted on the reservoir in relation to the variability of levels and flows. In relation to the shape, it is also observed that the levels and flows are maintained at a certain level in order to extend and flatten the flood wave as much as possible—this is especially visible in stations 8 and 22 (Pilchowice and Leśna reservoirs; Figure 9a,f).
The course of the flood could have also been influenced by other hydraulic structures and hydrotechnical constructions, such as weirs, barrages, or hydropower plants (the Bóbr river basin is responsible for approximately 3% of Poland’s hydropower potential) [67]; the location of water gauges downstream of such structures, e.g., the Leśna hydrological station on the Kwisa River, may also have had some influence. However, water reservoirs themselves, as hydrotechnical structures, perform important flood protection functions when properly operated: for example, according to modeling studies conducted for retention reservoirs in Chennai, India [68], in the event of their liquidation, a rainfall with a probability of 2% may cause flooding of the city equal to a rainfall of 1%, so the reservoirs reduce the risk of flooding twice. Studies of reservoirs in the Upper Vistula River basin in Poland indicate that the reduction in wave peaks with their use can reach up to 95% [69]. At the same time, Bezak et al. [70] emphasize that the proper location of such facilities is crucial, so that the actual benefits of this solution are higher than the social, economic, and environmental costs.
Among the analyzed stations, the longest flood duration was recorded in Stary Raduszec on the Bóbr River (station 14; Figure 9e), i.e., 392 h, while the shortest—in Barcinek on the Kamienica River (station 22; Figure 9g), equal to 113 h. The average was 236.5 h.
The flood wave peak was from 223 cm (station 26; Figure 9f) to 755 cm (station 11; Figure 9b). The average was 471 cm. In terms of maximum flows, it was from 112 m3/s (station 22; Figure 9h) to 648 m3/s (station 7; Figure 9d), with an average of 369.71 m3/s. The order of maximum levels and flows, therefore, differs between stations.
When calculating the volume of water flowing during the flood in all stations, the highest values were recorded in stations 10, 11, 13, 7, 8 and 9 (respectively: 215.9, 213.9, 173.4, 147.6, 141.6 and 128.1 million m3), the smallest—in 30, 17 and 15 (0.64, 1.20 and 1.41 million m3). The average volume for all stations was 57.0 million m3. The absolute values only partially reflect the scale of the flood—three out of six stations appear in both criteria.
The average flow during the flood period for all stations was 89.91 m3/s. In seven stations, it was above 100 m3/s, i.e., (in descending order): 13, 7, 9, 10, 11, 6 and 8 (respectively: 283.34, 241.26, 229.63, 194.11, 191.04, 176.16 and 136.06 m3/s). Flows below 10 m3/s occurred in four stations, i.e., 30, 29, 31 and 17 (3.89, 6.30, 7.31 and 7.77 m3/s). The highest average flows and total water volumes are mostly consistent with each other, but they occur in a different order (exception: station 6, where the average flow was quite high, and the total water volume was not among the highest). Looking at the total flow volumes and the average flow, it can be seen that out of the seven stations mentioned above, four of them were in the top seven highest values. The largest scale of flooding did not necessarily occur at the points with the largest flows.
Analyzing historical data on annual maximum flows from the period 1974–2023 and comparing them with data from the analyzed flood of 2024 (Table 5), in 6 out of 22 stations, the highest flows in the history of measurements were recorded in 2024 (i.e., stations: 6, 4, 16, 22, 7 and 10). Historical floods in the Bóbr River Basin in the mentioned period, taking into account the highest recorded flows, occurred in the years 1977 (five stations), 1981 (seven stations), 1982 (one station), 1997 (five stations), 2002 (one station), 2004 (one station), and 2006 (two stations). The most recent major flood occurred in the Bóbr River Basin in 1997. Comparing it with the flood described in the article, in 10 out of 21 stations, the maximum flows were higher in 2024 than in 1997, especially in stations 22, 24, 4, 21, 6 and 8 (higher by 69.44%, 42.25%, 38.66%, 38.19%, 34.93% and 34.57%, respectively). In turn, in the remaining 11, the maximum flows were lower in 2024 than in 1997, especially in stations 30, 31, 29, 9 and 11 (lower by 69.06%, 58.74%, 48.24%, 30.88% and 30.50%, respectively). In 2024, higher flows were recorded in the upper parts of the Bóbr River (outside Bukówka station), on the Łomnica, Kamienica and Kamienna Rivers in Jelenia Góra and on the Kwisa River (outside the Nowogrodziec station). Lower flows were recorded in the lower parts of the Bóbr River, on the Kamienna River in Jakuszyce and Piechowice, and on the Jedlica, Czarny Potok, Szprotawa, Czerna Wielka, Czerna Mała. The analyses again mention the areas of Jelenia Góra (Bóbr and Kamienna rivers) and Pilchowice (Bóbr, Kamienica) as the areas most affected by the flood in 2024. When comparing all stations, the scale of the flood in 2024 was similar to that in 1997, i.e., the maximum flows were, on average, 0.33% lower in 2024 than in 1997. However, in the past, higher floods occurred in some areas in relation to the observed flow, especially in 1977 and 1981. An analysis of the literature on the subject shows that larger floods in the Bóbr River Basin area also occurred in 1897 and 1958 [38]. In the future, the frequency of high flows in the Odra River basin (to which the Bóbr River Basin belongs) is predicted to increase as a result of climate change for the period 2071–2100 compared to 1971–2000 by an average of RCP 4.5—23.3% and RCP 8.5—36.7% [21]. Therefore, it will be increasingly important to undertake flood protection activities, which are one of the examples of adaptation to climate change [71,72]. This will be particularly important in urbanized areas, where surface runoff is increased [73,74].
Table 5.
Summary of information on the highest flows from the multi-year period 1974–2024, from 1997 and during the flood in 2024 in hydrological stations in the Bóbr River Basin area.
3.5. Selected Runoff Measures in the Bóbr River Basin Area
Since the absolute values of levels and flows may distort the analysis of results in the context of their comparison (favoring the larger ones and marginalizing the importance of the smaller ones), relative measures of runoff were additionally compared, taking into account the basin area at each station, i.e., the runoff layer H and the specific discharge q. Their spatial variability is presented in Figure 10.
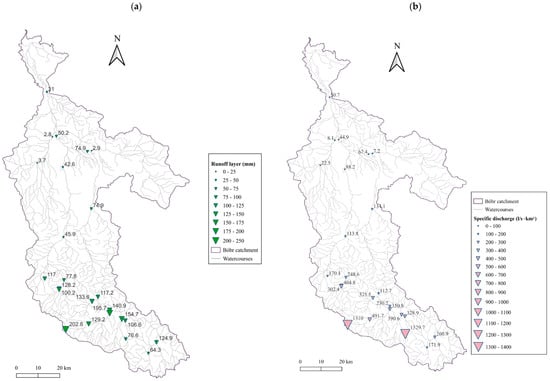
Figure 10.
Runoff measures in the Bóbr River Basin area during the 2024 flood: (a) runoff layer (index), (b) specific discharge.
The calculated runoff index/layer (Figure 10a) indicates that the largest volume of water per unit area drained during the 2024 flood in stations 17 and 21 (202.8 and 195.7 mm), while the smallest were in stations 31, 29 and 30 (2.8, 2.9 and 3.7 mm, respectively). The average was 91.6 mm. The highest values occurred in the upper sections of smaller rivers, which are characterized by a rapid increase in flows in the event of rainfall and an equally rapid decrease. Looking at the results, these are the rivers: Kamienna, Kamienna, Łomnica, Bóbr, Kamienica, Kamienna. As can be seen, the Kamienna River, which flows into the Bóbr in Jelenia Góra, appears three times in the six highest results, while in the case of the Bóbr, it is also the Jelenia Góra station. This is reflected in the actual flood situation, which was serious in Jelenia Góra and caused major damage in this area (losses were estimated at PLN 750 million = USD 189.27 million; the city’s reconstruction time is estimated at 4 years) [75]. Unfortunately, the actions taken in this city after the 1997 flood regarding preparation for the event of a threat did not fully bring the desired results (dry dams on Kamienna and Wrzosówka Rivers, flood embankments, regulation and reinforcement of the riverbed and banks, etc.), which is contrary to the results obtained in the article by Piepióra and Brzywcza [76]. In this case, however, early warning systems worked and no fatalities were recorded, and the evacuation actions carried out were effective. Interestingly, looking at the criteria adopted earlier, this phenomenon is not visible, for example, in station 17, where the estimated flood scale was equal to 1.24 (due to the short duration and small maximum exceedance of the alert level).
The second measure of runoff is the specific discharge (Figure 10b), indicating the volume of water that has drained from a given surface in a given time. In this case, in addition to calculating the parameter during the flood, calculations were also made for a multi-year period to compare these values and draw appropriate conclusions. As can be seen from the data in Table 6, in the Kostrzewa basin area, most of the Bóbr River Basin belongs to the mountain or transitional/foothill hydrological type, i.e., with a specific runoff greater than 4.15 L/s per km2 (exception: station 29, i.e., Szprotawa on the Szprotawa River). In absolute values, the highest specific runoffs during the flood were definitely present at stations 15 and 17 (Kowary on the Jedlica River and Jakuszyce on the Kamienna River)—these were 1329.7 and 1310.0 L/s per km2, respectively, with an average of 290.2 L/s per km2 for all stations. At the other extreme are stations 29 and 31 with q of 7.2 and 8.1 L/s per km2. The ratio of specific runoff during the flood to specific runoff over the multi-year period ranged from 1.91 at station 31 (Żagań, Czerna Wielka) to 75.98 at station 15 (Kowary, Jedlica), with an average of 17.34. Of the 24 hydrological stations analyzed, three of them exceeded the average q at least 30 times (15, 17 and 6), two more—20 times (22, 24 and 16), and the next 10—10 times (4, 25, 23, 21, 7, 18, 3, 9, 27 and 26). Considering these results with respect to rivers, these are, respectively, for the highest values: Jedlica, Kamienna, Bóbr, Kamienica, Kwisa and Łomnica. Referring to the scale of the flood, again, there is no convergence in the most extreme cases—for station 15, the calculated index was equal to 0.19, for 17—1.24, and for 6—2.12. This means that the designated warning and alert levels did not reflect this hydrological variability resulting from the specific discharge. Future work could be devoted to developing criteria for determining these conventional levels, as well as to comprehensively developing indices defining the intensity of flood occurrence based on a number of variables: economic, social, natural, etc. Such flood susceptibility indicators have been comprehensively described by, for example, Moreira et al. [77].
Table 6.
Summary of information on average flows for the multi-year period, individual runoffs for the multi-year period 1974–2023 and during the 2024 flood and hydrological types according to Kostrzewa of hydrological stations in the Bóbr River Basin area.
Looking back one year after the flood (November 2025), Poland has taken steps to help the affected population. Flood risk reduction programs have been established for some river basins, encompassing a comprehensive set of measures to increase the safety of residents in the region. Such a program was developed by the Polish Waters National Water Management Authority and the Institute of Meteorology and Water Management—National Research Institute for the Bóbr River basin, where 70 investments totaling over PLN 1.8 billion (approximately USD 500 million) are planned. The program’s main components include the construction of flood protection infrastructure (retention reservoirs, flood embankments, modernization and repair of water facilities and structures damaged by the flood), improving the condition of rivers (e.g., the Kamienna, Zadrna, and Kwisa), and forest and soil retention measures [78]. The second systemic action is the introduction of a special flood act, which assumes the purchase by the State Treasury of properties destroyed as a result of the flood in September 2024 [79].
It should be added that actions taken to reduce the risk of flooding are important because this phenomenon affects many aspects related to social, economic and environmental issues [80]. In the socio-economic context, floods cause widespread negative effects, both measurable (e.g., damage to property and infrastructure), and immeasurable (e.g., psychosocial damage, loss of family heirlooms) [81,82]. For example, in 2011 in Australia, losses due to record rainfall amounted to USD 1.3 billion, while in India in 2013, the deadliest flood of the 21st century occurred, claiming 5748 lives [83].
Floods also negatively impact agricultural production and soil water conditions, manifesting in crop losses, the death of livestock, and the destruction of soil, buildings, machinery, and infrastructure [84]. For example, between 1982 and 2016, global crop losses due to floods totaled USD 5.5 billion, which translated into losses of 4% for soybeans and 3% for rice during the return periods over a ten-year period [85]. Floods (as well as other disasters) in the context of agriculture also negatively impact the mental health and health of livestock, which results in economic losses for farmers, e.g., related to the costs of animal treatment [86]. The flood itself also negatively affects the properties of soils, including those used for agriculture: for example, as a result of the extreme flood in Serbia in 2014, increased concentrations of Ni, Cr, As, Pb and Cu were found in the studied sediments and soils from the West Morava catchment [87].
In terms of the environment, aquatic and water-related ecosystems are destroyed (e.g., river ecosystems [88]), and aquatic and wetland organisms that rely on this habitat die (e.g., macrobenthos [89]). Floods negatively impact water quality, especially in the context of concentrations of metals, specific organic compounds, fecal bacteria, and nitrates (according to studies conducted for the 2006 flood on the Luznice and Skalice rivers in the Czech Republic, the increase compared to the average level was up to 1760%, 1410%, 136%, and 121%, respectively) [90]. Such water is also unsuitable for consumption and may cause poisoning. As shown by cross-sectional epidemiological studies from 2004 to 2011, mortality rates increased by up to 50% in the first year after the flood [91].
Flood effects can be exacerbated by a number of factors, the most significant of which are urbanization and land use change, especially from forest to agricultural land. In this case, the components of the water balance change—surface runoff increases and subsurface infiltration decreases [92,93]. As emphasized, the effects described above are exacerbated by weather phenomena related to climate change (such as heavy rains, snowmelt, storms) but are also associated with the influence of anthropogenic factors such as urbanization, deforestation, population growth, and insufficient infrastructure [94,95,96]. On the other hand, cross-sectional studies on catastrophic floods [83] indicate that risk awareness and structural flood protection are also increasing, and that transdisciplinary research is needed to implement even better flood risk management concepts.
4. Conclusions
The presented analysis of the 2024 flood in the Bóbr River Basin area (caused by intense and long-lasting rainfall caused by the movement of a low-pressure system over the southwestern and southern part of Poland, i.e., Genoese low) demonstrated how important rational and sustainable water management is in the context of protection, as well as how extreme hydrological phenomena, such as floods, are becoming increasingly intensified in the face of climate change. The article describes three indicators characterizing floods (duration, magnitude, scale) and selected measures of runoff. Based on the performed analysis, the most frequently recurring hot spot according to the above criteria, i.e., the region of greatest concern for better flood protection in the Bóbr River basin area, was indicated around Jelenia Góra city. Two rivers, i.e., the Bóbr and Kamienna, flow through this city, which cumulatively increase the scale and intensity of floods.
In the context of flood protection measures, technical, administrative, and educational measures are proposed to reduce flood risk in areas where flooding caused the greatest damage. Based on the analyses conducted, this applies particularly to the upper reaches of the Bóbr River (except for the Bukówka station) and the Łomnica, Kamienica, Kamienna, and Kwisa rivers (except for the Nowogrodziec station). These are primarily mountain or transitional/foothill rivers with steep gradients and rapid water runoff, so any measures that reduce wave height and extend it would be recommended in these areas. Examples of these measures include the construction of reservoirs—both standard and dry—as well as polders, flood embankments, and the expansion of biologically active areas in cities (e.g., more parks, green roofs and walls). A second aspect is appropriate legislation and procedures in the event of a threat. Efficient operation of early flood warning systems (including the ability to check the current hydrological and meteorological situation) and crisis management centers, along with uniformed services and administration at various levels of governance (e.g., the special flood act in Poland related to the purchase destroyed after the flood, flood risk reduction programs), is also key. These centers will provide residents with information on issues such as flood protection procedures. All these integrated measures should help reduce flood risk, both in terms of preventive and remedial measures.
The proposed flood scale indicator may find wider application, e.g., in the development of strategic documents related to the implementation of the Floods Directive; however, its components should be verified and the scale should be adjusted to a more open one to make it more universal for different types of floods in different basins with different hydrological, hydrographic or geomorphological characteristics. Moreover, the methodology described in this article requires refinement to be more universal. Improvements could include, for example, relying on hydrological characteristics (e.g., presented runoff measures) rather than conventional warning and alert levels, which would better reflect the actual scale of flood risk and its consequences. Alternatively, these characteristics could be combined.
Future research could also focus on flood analysis from other perspectives, e.g., the impact of spatial development, the use of flood susceptibility indices, flood risk and threat analyses, the use of hydrodynamic modeling (e.g., showing flood zones using a digital terrain model) or remote-sensing analyses. To a greater extent, climate change scenarios or technical, social, economic and natural factors could also be taken into account, which are undoubtedly related to such extreme hydrological phenomena. A possible research direction could also be the analysis of changes in the water balance during such an extreme event, divided into its individual components, and taking into account, for example, the structure of land use as variables. Crisis management and proposals for flood protection measures, which were also mentioned in the work, are also important.
Author Contributions
Conceptualization, P.T.; methodology, P.T.; software, P.T.; validation, P.T.; formal analysis, P.T.; investigation, P.T.; resources, P.T.; data curation, P.T.; writing—original draft preparation, P.T.; writing—review and editing, M.W., R.K., Ł.G. and R.P.; visualization, P.T.; supervision, M.W. and R.K. All authors have read and agreed to the published version of the manuscript.
Funding
This work was supported by The Bekker Programme of the Polish National Agency for Academic Exchange (NAWA) [project number BPN/BEK/2023/1/00079.
Institutional Review Board Statement
Not applicable.
Informed Consent Statement
Not applicable.
Data Availability Statement
The original contributions presented in this study are included in the article. Further inquiries can be directed to the corresponding author.
Acknowledgments
This study used and processed meteorological and hydrological data provided by the Polish Institute of Meteorology and Water Management—National Research Institute (IMGW-PIB), available on the websites https://hydro.imgw.pl and https://danepubliczne.imgw.pl/.
Conflicts of Interest
The authors declare no conflicts of interest.
References
- EPC—The European Parliament and of the Council. Directive 2007/60/EC of the EPC of 23 October 2007 on the Assessment and Management of Flood Risks (Text with EEA Relevance); EPC: Brussels, Belgium, 2007; Available online: https://eur-lex.europa.eu/legal-content/EN/TXT/PDF/?uri=OJ:L:2007:288:FULL (accessed on 20 November 2025).
- Saharia, M.; Kirstetter, P.E.; Vergara, H.; Gourley, J.J.; Hong, Y. Characterization of floods in the United States. J. Hydrol. 2017, 548, 524–535. [Google Scholar] [CrossRef]
- Mikša, K.; Kalinauskas, M.; Inácio, M.; Pereira, P. Implementation of the European Union Floods Directive—Requirements and national transposition and practical application: Lithuanian case study. Land. Use Policy 2021, 100, 104924. [Google Scholar] [CrossRef]
- Hundecha, Y.; Parajka, J.; Viglione, A. Flood type classification and assessment of their past changes across Europe. Hydrol. Earth Syst. Sci. Discuss. 2017. [Google Scholar] [CrossRef]
- Doocy, S.; Daniels, A.; Murray, S.; Kirsch, T.D. The human impact of floods: A historical review of events 1980–2009 and systematic literature review. PLoS Curr. 2013, 5, ecurrents.dis.f4deb457904936b07c09daa98ee8171a. [Google Scholar] [CrossRef] [PubMed]
- Alfieri, L.; Bisselink, B.; Dottori, F.; Naumann, G.; de Roo, A.; Salamon, P.; Wyser, K.; Feyen, L. Global projections of river flood risk in a warmer world. Earth’s Future 2017, 5, 171–182. [Google Scholar] [CrossRef]
- Dottori, F.; Szewczyk, W.; Ciscar, J.C.; Zhao, F.; Alfieri, L.; Hirabayashi, Y.; Bianchi, A.; Mongelli, I.; Frieler, K.; Betts, R.A.; et al. Increased human and economic losses from river flooding with anthropogenic warming. Nat. Clim. Change 2018, 8, 781–786. [Google Scholar] [CrossRef]
- Slater, L.; Villarini, G.; Archfield, S.; Faulkner, D.; Lamb, R.; Khouakhi, A.; Yin, J. Global changes in 20-year, 50-year, and 100-year river floods. Geophys. Res. Lett. 2021, 48, e2020GL091824. [Google Scholar] [CrossRef]
- CRED. Emergency Events Database (EM-DAT) (2024). Available online: http://www.emdat.be (accessed on 20 November 2025).
- Charalampous, P.; Speybroeck, N.; van Loenhout, J.A.F.; Pluen, G.; Delforge, D. The 2024 Spain Floods: A Callfor Resilience and the Duty of Memory. Int. J. Public Health 2025, 70, 1608236. [Google Scholar] [CrossRef]
- Castro-Melgar, I.; Falaras, T.; Basiou, E.; Parcharidis, I. Assessment of the October 2024 Cut-Off Low Event Floods Impact in Valencia (Spain) with Satellite and Geospatial Data. Remote Sens. 2025, 17, 2145. [Google Scholar] [CrossRef]
- Rojas, R.; Feyen, L.; Watkiss, P. Climate change and river floods in the European Union: Socio-economic consequences and the costs and benefits of adaptation. Glob. Environ. Change 2013, 23, 1737–1751. [Google Scholar] [CrossRef]
- Paprotny, D.; Tilloy, A.; Treu, S.; Buch, A.; Vousdoukas, M.I.; Feyen, L.; Kreibich, H.; Merz, B.; Frieler, K.; Mengel, M. Attribution of flood impacts shows strong benefits of adaptation in Europe since 1950. Sci. Adv. 2025, 11, 7068. [Google Scholar] [CrossRef] [PubMed]
- Ghazi, B.; Przybylak, R.; Oliński, P.; Bogdańska, K.; Pospieszyńska, A. The frequency, intensity, and origin of floods in Poland in the 11th–15th centuries based on documentary evidence. J. Hydrol. 2023, 623, 129778. [Google Scholar] [CrossRef]
- Ghazi, B.; Przybylak, R.; Oliński, P.; Chorążyczewski, W.; Pospieszyńska, A. An assessment of flood occurrences in Poland in the 16th century. J. Hydrol. Reg. Stud. 2023, 50, 101597. [Google Scholar] [CrossRef]
- Ghazi, B.; Przybylak, R.; Oliński, P.; Targowski, M.; Filipiak, J.; Pospieszyńska, A. A comprehensive study of floods in Poland in the 17th–18th centuries. J. Hydrol. Reg. Stud. 2024, 53, 101796. [Google Scholar] [CrossRef]
- Venegas-Cordero, N.; Kundzewicz, Z.W.; Jamro, S.; Piniewski, M. Detection of trends in observed river floods in Poland. J. Hydrol. Reg. Stud. 2022, 41, 101098. [Google Scholar] [CrossRef]
- Wyżga, B.; Radecki-Pawlik, A.; Zawiejska, J. Flood Risk Management in the Upper Vistula Basin in Perspective: Traditional versus Alternative Measures. In Flood Risk in the Upper Vistula Basin. GeoPlanet: Earth and Planetary Sciences; Kundzewicz, Z., Stoffel, M., Niedźwiedź, T., Wyżga, B., Eds.; Springer: Cham, Switzerland, 2016; pp. 361–380. [Google Scholar] [CrossRef]
- Szalińska, W.; Otop, I.; Tokarczyk, T. Precipitation extremes during flooding in the Odra River Basin in May–June 2010. Meteorol. Hydrol. Water Manag. 2014, 2, 13–21. [Google Scholar] [CrossRef]
- Romanowicz, R.J.; Nachlik, E.; Januchta-Szostak, A.; Starkel, L.; Kundzewicz, Z.W.; Byczkowski, A.; Szamałek, K. Zagrożenia związane z nadmiarem wody. Disasters Relat. Water Excess. Nauka 2014, 1, 123–148. [Google Scholar]
- Piniewski, M.; Szcześniak, M.; Kundzewicz, Z.W.; Mezghani, A.; Hov, Ø. Changes in low and high flows in the Vistula and the Odra basins: Model projections in the European-scale context. Hydrol. Process. 2017, 31, 2210–2225. [Google Scholar] [CrossRef]
- MSRP—Marshal of the Sejm of the Republic of Poland. Announcement of the Marshal of the Sejm of the Republic of Poland of 16 June 2023 on the Announcement of the Consolidated Text of the Water Law Act; Dz. U. 2023 poz. 1478; Chancellery of the Polish Sejm: Warszawa, Poland, 2023. Available online: https://isap.sejm.gov.pl/isap.nsf/download.xsp/WDU20230001478/T/D20231478L.pdf (accessed on 14 October 2024).
- Woś, K.; Radoń, R.; Tekielak, T.; Wrzosek, K.; Pieron, Ł.; Piórecki, M. Role of multifunctional water reservoirs in the Upper Vistula Basin in reducing flood risk. Water 2022, 14, 4025. [Google Scholar] [CrossRef]
- Walczykiewicz, T. Multi-criteria analysis for selection of activity options limiting flood risk. Water Resour. 2014, 42, 124–132. [Google Scholar] [CrossRef]
- Dysarz, T. Development of methodology for assessment of long-term morphodynamic impact on flood hazard. J. Flood Risk Manag. 2020, 13, e12654. [Google Scholar] [CrossRef]
- Graf, R. Flood risk management system in Poland. In Management of Water Resources in Poland; Zeleňáková, M., Kubiak-Wójcicka, K., Negm, A.M., Eds.; Springer Water; Springer: Cham, Switzerland, 2021; pp. 361–377. [Google Scholar] [CrossRef]
- Kundzewicz, Z.W.; Januchta-Szostak, A.; Nachlik, E.; Pińskwar, I.; Zaleski, J. Challenges for flood risk reduction in Poland’s changing climate. Water 2023, 15, 2912. [Google Scholar] [CrossRef]
- Faganello, E.; Attewill, L. Flood management strategy for the Upper and Middle Odra River Basin: Feasibility study of Raciborz Reservoir. Nat. Hazards 2005, 36, 273–295. [Google Scholar] [CrossRef]
- Pavlinec, A. Heavy rains and flood in Poland. Are we facing a catastrophe? Wodne Sprawy 2024, 16, 13. Available online: https://wodnesprawy.pl/en/heavy-rains-and-flood-in-poland-are-we-facing-a/ (accessed on 14 October 2024).
- PM of Poland—Prime Minister of Poland. Announcement of the Prime Minister of 22 September 2024 on the Announcement of the Consolidated Text of the Regulation of the Council of Ministers on the Introduction of a State of Natural Disaster in the Area of Parts of the Lower Silesian, Lubusz, Opole and Silesian Voivodeships; Dz. U. Poz. 1395; Warszawa, Poland, 2024. Available online: https://isap.sejm.gov.pl/isap.nsf/download.xsp/WDU20240001395/O/D20241395.pdf (accessed on 14 October 2024).
- PM of Poland—Prime Minister of Poland. Regulation of the Council of Ministers of 28 September 2024 on the Introduction of a State of Natural Disaster in the Area of Parts of the Lower Silesian and Lubusz Voivodeships; Dz. U. Poz. 1435; Warszawa, Poland, 2024. Available online: https://isap.sejm.gov.pl/isap.nsf/download.xsp/WDU20240001435/O/D20241435.pdf (accessed on 14 October 2024).
- PM of Poland—Prime Minister of Poland. Regulation of the Council of Ministers of 2 October 2024 Amending the Regulation on the Introduction of a State of Natural Disaster in the Area of Parts of the Lower Silesian and Lubusz Voivodeships; Dz. U. Poz. 1460; Warszawa, Poland, 2024. Available online: https://isap.sejm.gov.pl/isap.nsf/download.xsp/WDU20240001460/O/D20241460.pdf (accessed on 14 October 2024).
- Pajdała-Kusińska, I. Completion of Operation “Flood 2024”; Polish Police Headquarters (KGP): Warsaw, Poland, 3 October 2024; Available online: https://www.policja.pl/pol/aktualnosci/251188,Zakonczenie-Operacji-Powodz-2024.html (accessed on 14 October 2024).
- AP—The Associated Press. Poland’s Death Toll from Floods Rises to 9 After 2 More Bodies Found. AP News. 28 September 2024. Available online: https://apnews.com/article/poland-flood-deaths-police-a87141fef1a47ae2e3dbbff076624afb (accessed on 14 October 2024).
- Koper, A.; Florkiewicz, P. Flooding in Poland Makes Changes to 2024 Budget More Likely, Says Minister. Reuters. 23 September 2024. Available online: https://www.reuters.com/world/europe/flooding-poland-makes-changes-2024-budget-more-likely-says-minister-2024-09-23/ (accessed on 14 October 2024).
- PGWWP—State Water Management Polish Waters. Aktualna Sytuacja Hydrologiczno-Meteorologiczna W Dorzeczu Odry; PGWWP: Warszawa, Poland, 4 October 2024. Available online: https://www.gov.pl/web/wody-polskie/zbiorniki-wod-polskich-przygotowane-na-opady (accessed on 14 October 2024).
- Kiedrzyńska, E.; Kiedrzyński, M.; Zalewski, M. Sustainable floodplain management for flood prevention and water quality improvement. Nat. Hazards 2015, 76, 955–977. [Google Scholar] [CrossRef]
- Kołodziejczyk, U.; Kuroczycki, L.; Żebrowska, M. Wezbrania na Bobrze w Żaganiu w świetle obserwacji historycznych. Zesz. Nauk. Inż. Środ. 2016, 162, 129–137, Uniwersytet Zielonogórski, Zielona Góra, Poland. [Google Scholar]
- Wrzesiński, D. Typologia reżimu odpływu rzek w Polsce w różnych fazach Oscylacji Północnoatlantyckiej. Bad. Fizjogr. Ser. A Geogr. Fiz. 2018, 9, 249–261. [Google Scholar] [CrossRef]
- Hudak, M.; Kołodziejczyk, U.; Kostecki, J.; Nowogoński, I.; Żebrowska, M. The analysis of the degree of flood risk in the middle Bobr valley. Civil Environ. Eng. Rep. 2018, 27, 68–75. [Google Scholar] [CrossRef]
- Adynkiewicz-Piragas, M.; Lejcuś, I. Flood risk of Lower Silesia Voivodship. Civ. Environ. Eng. Rep. 2017, 10, 7–18. [Google Scholar]
- Malczewska, B. Variability of water energy resources on example of Bóbr River. Infrastrukt. Ekol. Teren. Wiej. 2010, 13, 167–177. [Google Scholar]
- Machajski, J.; Olearczyk, D. Model investigations of side channel spillway of the Pilchowice storage reservoir on the Bóbr River. Stud. Geotech. Et Mech. 2010, 32, 65–81. [Google Scholar]
- Mokwa, M.; Malczewska, B. The silting influence on the capacity of the Krzywaniec reservoir. Ann. Wars. Univ. Life Sci. SGGW Land. Reclam. 2008, 39, 121–127. [Google Scholar] [CrossRef]
- IMGW-PIB—Polish Institute of Meteorology and Water Management—National Research Institute. Dane Publiczne IMGW-PIB–Dane Meteorologiczne. Available online: https://danepubliczne.imgw.pl/data/dane_pomiarowo_obserwacyjne/dane_meteorologiczne/ (accessed on 14 October 2024).
- IMGW-PIB—Polish Institute of Meteorology and Water Management—National Research Institute. Dane Publiczne IMGW-PIB–Dane Hydrologiczne. Available online: https://danepubliczne.imgw.pl/data/dane_pomiarowo_obserwacyjne/dane_hydrologiczne/ (accessed on 14 October 2024).
- IMGW-PIB—Polish Institute of Meteorology and Water Management—National Research Institute. Hydro IMGW-PIB. Available online: https://hydro.imgw.pl/#/ (accessed on 14 October 2024).
- Stezycki, K.; Laizans, J.; Stoklasa, R. Central European Floods Leave Trail of Devastation; New Areas to Evacuate. Reuters. 17 September 2024. Available online: https://www.reuters.com/world/europe/poland-fortifies-towns-deadly-floods-afflict-central-europe-2024-09-17/ (accessed on 14 October 2024).
- Olearczyk, D.; Stodolak, R. Regional relationships of maximum outflow in the Upper Bóbr River Basin. J. Ecol. Eng. 2015, 16, 206–212. [Google Scholar] [CrossRef]
- SCALGO Live—Poland (Bóbr River Basin). Available online: https://scalgo.com/live/poland?res=8&ll=15.066401%2C52.057817&lrs=pl_geoportal_g2_mobile_500%2Cpoland%2Fpoland%3Arain%3Aflooded–edgeflow–dfs%3Agugik%3Boption%3Drenderdownstream%3Dtrue%2Cpoland%2Fpoland%3Abdot10k%3ASWRS01&tool=watershed&watershed=15.073813%2C52.050109 (accessed on 22 May 2024).
- Kostrzewa, H. Verification of the Criteria and The Size of the Inviolable Flow for Polish Rivers; Research Studies, Series; Water Management and Protection: Warszawa, Poland, 2005. (In Polish) [Google Scholar]
- Piniarski, W. Challenges of a GIS-based physical-geographical regionalization of Poland. Environ. Monit. Assess. 2023, 195, 11734. [Google Scholar] [CrossRef]
- Kundzewicz, Z.W.; Ulbrich, U.; Brücher, T.; Graczyk, D.; Krüger, A.; Leckebusch, G.C.; Menzel, L.; Pińskwar, I.; Radziejewski, M.; Szwed, M. Summer floods in Central Europe–Climate change track? Nat. Hazards 2005, 36, 165–189. [Google Scholar] [CrossRef]
- IMGW-PIB—Polish Institute of Meteorology and Water Management—National Research Institute. Charakterystyka Wybranych Elementów Klimatu w Polsce we Wrześniu 2024 Roku. Available online: https://www.imgw.pl/wydarzenia/charakterystyka-wybranych-elementow-klimatu-w-polsce-we-wrzesniu-2024-roku (accessed on 14 October 2024).
- Meteologix. Accumulated Precipitaion, 7 Days (Satellite) (mm)—Tue 09/17/2024, 02:00am CEST. 2024. Available online: https://meteologix.com/pl/precipitation/poland/satellite-precipitation-7days/20240917-0000z.html (accessed on 20 October 2025).
- Kundzewicz, Z.W. Adapting flood preparedness tools to changing flood risk conditions: The situation in Poland. Oceanologia 2014, 56, 385–407. [Google Scholar] [CrossRef]
- Kuźmiński, Ł.; Nadolny, M.; Wojtaszek, H. Probabilistic quantification in the analysis of flood risks in cross-border areas of Poland and Germany. Energies 2020, 13, 6020. [Google Scholar] [CrossRef]
- Konca-Kędzierska, K.; Wibig, J.; Gruszczyńska, M. Comparison and combination of interpolation methods for daily precipitation in Poland: Evaluation using the correlation coefficient and correspondence ratio. Meteorol. Hydrol. Water Manag. 2023, 11, 1–27. [Google Scholar] [CrossRef]
- Chen, F.W.; Liu, C.W. Estimation of the spatial rainfall distribution using inverse distance weighting (IDW) in the middle of Taiwan. Paddy Water Environ. 2012, 10, 209–222. [Google Scholar] [CrossRef]
- Chin, R.J.; Lai, S.H.; Loh, W.S.; Ling, L.; Soo, E.Z.X. Assessment of Inverse Distance Weighting and Local Polynomial Interpolation for Annual Rainfall: A Case Study in Peninsular Malaysia. Eng. Proc. 2023, 38, 61. [Google Scholar] [CrossRef]
- Jeong, H.G.; Ahn, J.B.; Lee, J.; Shim, K.M.; Jung, M.P. Improvement of daily precipitation estimations using PRISM with inverse-distance weighting. Theor. Appl. Climatol. 2020, 139, 923–934. [Google Scholar] [CrossRef]
- Li, Z. An enhanced dual IDW method for high-quality geospatial interpolation. Sci. Rep. 2021, 11, 9903. [Google Scholar] [CrossRef]
- Gore, J.A.; Banning, J. Discharge measurements and streamflow analysis. In Methods in Stream Ecology, 3rd ed.; Hauer, F.R., Lamberti, G.A., Eds.; Elsevier Inc.: Amsterdam, The Netherlands, 2017; Volume 1, pp. 49–70. [Google Scholar] [CrossRef]
- Acquaotta, F.; Faccini, F.; Fratianni, S.; Paliaga, G.; Sacchini, A.; Vilímek, V. Increased flash flooding in Genoa Metropolitan Area: A combination of climate changes and soil consumption? Meteorol. Atmos. Phys. 2019, 131, 1099–1110. [Google Scholar] [CrossRef]
- Faccini, F.; Luino, F.; Sacchini, A.; Turconi, L. Flash flood events and urban development in Genoa (Italy): Lost in translation. In Engineering Geology for Society and Territory, Volume 5; Lollino, G., Manconi, A., Guzzetti, F., Culshaw, M., Bobrowsky, P., Luino, F., Eds.; Springer: Cham, Switzerland, 2015; pp. 1277–1281. [Google Scholar] [CrossRef]
- Mioduszewski, W. Ideas of flood protection in Poland. J. Water Land. Dev. 2003, 7, 3–19. [Google Scholar]
- Piwowar, A.; Dzikuć, M. Water Energy in Poland in the Context of Sustainable Development. Energies 2022, 15, 7840. [Google Scholar] [CrossRef]
- Nithila Devi, N.; Sridharan, B.; Bindhu, V.M.; Narasimhan, B.; Bhallamudi, S.M.; Bhatt, C.M.; Usha, T.; Vasan, D.T.; Kuiry, S.N. Investigation of Role of Retention Storage in Tanks (Small Water Bodies) on Future Urban Flooding: A Case Study of Chennai City, India. Water 2020, 12, 2875. [Google Scholar] [CrossRef]
- Tymiński, T.; Kałuża, T. Investigation of Mechanical Properties and Flow Resistance of Flexible Riverbank Vegetation. Pol. J. Environ. Stud. 2012, 21, 201–207. [Google Scholar]
- Bezak, N.; Kovačević, M.; Johnen, G.; Lebar, K.; Zupanc, V.; Vidmar, A.; Rusjan, S. Exploring Options for Flood Risk Management with Special Focus on Retention Reservoirs. Sustainability 2021, 13, 10099. [Google Scholar] [CrossRef]
- Stańczuk-Gałwiaczek, M.; Sobolewska-Mikulska, K.; Ritzema, H.; van Loon-Steensma, J.M. Integration of water management and land consolidation in rural areas to adapt to climate change: Experiences from Poland and the Netherlands. Land. Use Policy 2018, 77, 498–511. [Google Scholar] [CrossRef]
- Alfieri, L.; Feyen, L.; Di Baldassarre, G. Increasing flood risk under climate change: A pan-European assessment of the benefits of four adaptation strategies. Clim. Change 2016, 136, 507–521. [Google Scholar] [CrossRef]
- Szewrański, S.; Kazak, J.; Szkaradkiewicz, M.; Sasik, J. Flood risk factors in suburban area in the context of climate change adaptation policies—Case study of Wrocław, Poland. J. Ecol. Eng. 2015, 16, 13–18. [Google Scholar] [CrossRef]
- Mrozik, K.D. Problems of local flooding in functional urban areas in Poland. Water 2022, 14, 2453. [Google Scholar] [CrossRef]
- PAP—Polish Press Agency. Szef KPRM: Do tej pory 57 tys. osób Jest Realnie Dotkniętych Powodzią. PAP. 21 September 2024. Available online: https://www.pap.pl/aktualnosci/szef-kprm-do-tej-pory-57-tys-osob-jest-realnie-dotknietych-powodzia (accessed on 14 October 2024).
- Piepiora, Z.; Brzywcz, M. Counteracting flood effects in Jelenia Góra. Słup. Pr. Geogr. 2016, 13, 139–150. [Google Scholar]
- Moreira, L.L.; de Brito, M.M.; Kobiyama, M. Review article: A systematic review and future prospects of flood vulnerability indices. Nat. Hazards Earth Syst. Sci. 2021, 21, 1513–1530. [Google Scholar] [CrossRef]
- RZGW Wrocław–Regional Water Management Board in Wrocław. Program Redukcji Ryzyka Powodziowego w Zlewni Rzeki Bóbr. RZGW Wrocław; 12 June 2025. Available online: https://www.gov.pl/web/wody-polskie-wroclaw/program-redukcji-ryzyka-powodziowego-w-zlewni-rzeki-bobr (accessed on 20 November 2025).
- Ministry of Family, Labour and Social Policy of the Republic of Poland. Special Arrangements Related to Flood Recovery Efforts. MFLSPRP; 20 November 2024. Available online: https://www.gov.pl/web/family/special-arrangements-related-to-flood-recovery-efforts (accessed on 20 November 2025).
- Fawwaz, A.; Aldardasawi, M.; Eren, B. Floods and Their Impact on the Environment. Acad. Perspect. Procedia 2021, 4, 42–49. [Google Scholar] [CrossRef]
- Allaire, M. Socio-economic impacts of flooding: A review of the empirical literature. Water Secur. 2018, 3, 18–26. [Google Scholar] [CrossRef]
- Stanke, C.; Murray, V.; Amlôt, R.; Nurse, J.; Williams, R. The effects of flooding on mental health: Outcomes and recommendations from a review of the literature. PLoS Curr. 2012, 4, e4f9f1fa9c3cae. [Google Scholar] [CrossRef]
- Merz, B.; Blöschl, G.; Vorogushyn, S.; Dottori, F.; Aerts, J.C.J.H.; Bates, P.; Bertola, M.; Kemter, M.; Kreibich, H.; Lall, U.; et al. Causes, impacts and patterns of disastrous river floods. Nat. Rev. Earth Environ. 2021, 2, 592–609. [Google Scholar] [CrossRef]
- Brémond, P.; Grelot, F.; Agenais, A.-L. Economic evaluation of flood damage to agriculture-review and analysis of existing methods. Hazards Earth Syst. Sci. 2013, 13, 2493–2512. [Google Scholar] [CrossRef]
- Kim, W.; Iizumi, T.; Hosokawa, N.; Tanoue, M.; Hirabayashi, Y. Flood impacts on global crop production: Advances and limitations. Environ. Res. Lett. 2023, 18, 054007. [Google Scholar] [CrossRef]
- Filipe, J.F.; Herrera, V.; Curone, G.; Vigo, D.; Riva, F. Floods, Hurricanes, and Other Catastrophes: A Challenge for the Immune System of Livestock and Other Animals. Front. Vet. Sci. 2020, 7, 507016. [Google Scholar] [CrossRef] [PubMed]
- Antić-Mladenović, S.; Kresović, M.; Čakmak, D.; Perović, V.; Saljnikov, E.; Ličina, V.; Rinklebe, J. Impact of a severe flood on large-scale contamination of arable soils by potentially toxic elements (Serbia). Environ. Geochem. Health 2019, 41, 249–266. [Google Scholar] [CrossRef]
- Parasiewicz, P.; King, E.L.; Webb, J.A.; Piniewski, M.; Comoglio, C.; Wolter, C.; Buijse, A.D.; Bjerklie, D.; Vezza, P.; Melcher, A.; et al. The role of floods and droughts on riverine ecosystems under a changing climate. Fish. Manag. Ecol. 2019, 26, 461–473. [Google Scholar] [CrossRef]
- Cardoso, P.G.; Raffaelli, D.; Lillebø, A.I.; Verdelhos, T.; Pardal, M.A. The impact of extreme flooding events and anthropogenic stressors on the macrobenthic communities’ dynamics. Estuar. Coast. Shelf Sci. 2008, 76, 553–565. [Google Scholar] [CrossRef]
- Hrdinka, T.; Novický, O.; Hanslík, E.; Rieder, M. Possible impacts of floods and droughts on water quality. J. Hydro-Environ. Res. 2012, 6, 145–150. [Google Scholar] [CrossRef]
- Alderman, K.; Turner, L.R.; Tong, S. Floods and human health: A systematic review. Environ. Int. 2012, 47, 37–47. [Google Scholar] [CrossRef]
- Rogger, M.; Agnoletti, M.; Alaoui, A.; Bathurst, J.C.; Bodner, G.; Borga, M.; Chaplot, V.; Gallart, F.; Glatzel, G.; Hall, J.; et al. Land use change impacts on floods at the catchment scale: Challenges and opportunities for future research. Water Resour. Res. 2017, 53, 5209–5219. [Google Scholar] [CrossRef]
- De Roo, A.; Odijk, M.; Schmuck, G.; Koster, E.; Lucieer, A. Assessing the effects of land use changes on floods in the meuse and oder catchment. Phys. Chem. Earth Part B Hydrol. Ocean. Atmos. 2001, 26, 593–599. [Google Scholar] [CrossRef]
- Wdowczyk, A.; Szymańska-Pulikowska, A.; Chęcmanowski, J.; Kierzek, K.; Wiercik, P. Assessment of changes occurring in biochar/zeolite substrates used in the vegetation-activated sludge process in the treatment of leachate from landfills. Water Resour. Ind. 2025, 33, 100280. [Google Scholar] [CrossRef]
- Wdowczyk, A.; Szymańska-Pulikowska, A.; Gupta, A. Application of selected indicators to assess contamination of municipal landfill leachate and its impact on groundwater. Water Resour. Ind. 2024, 32, 100265. [Google Scholar] [CrossRef]
- Abegaz, R.; Wang, F.; Xu, J. History, causes, and trend of floods in the U.S.: A review. Nat. Hazards 2024, 120, 13715–13755. [Google Scholar] [CrossRef]
Disclaimer/Publisher’s Note: The statements, opinions and data contained in all publications are solely those of the individual author(s) and contributor(s) and not of MDPI and/or the editor(s). MDPI and/or the editor(s) disclaim responsibility for any injury to people or property resulting from any ideas, methods, instructions or products referred to in the content. |
© 2025 by the authors. Licensee MDPI, Basel, Switzerland. This article is an open access article distributed under the terms and conditions of the Creative Commons Attribution (CC BY) license (https://creativecommons.org/licenses/by/4.0/).