1. Introduction
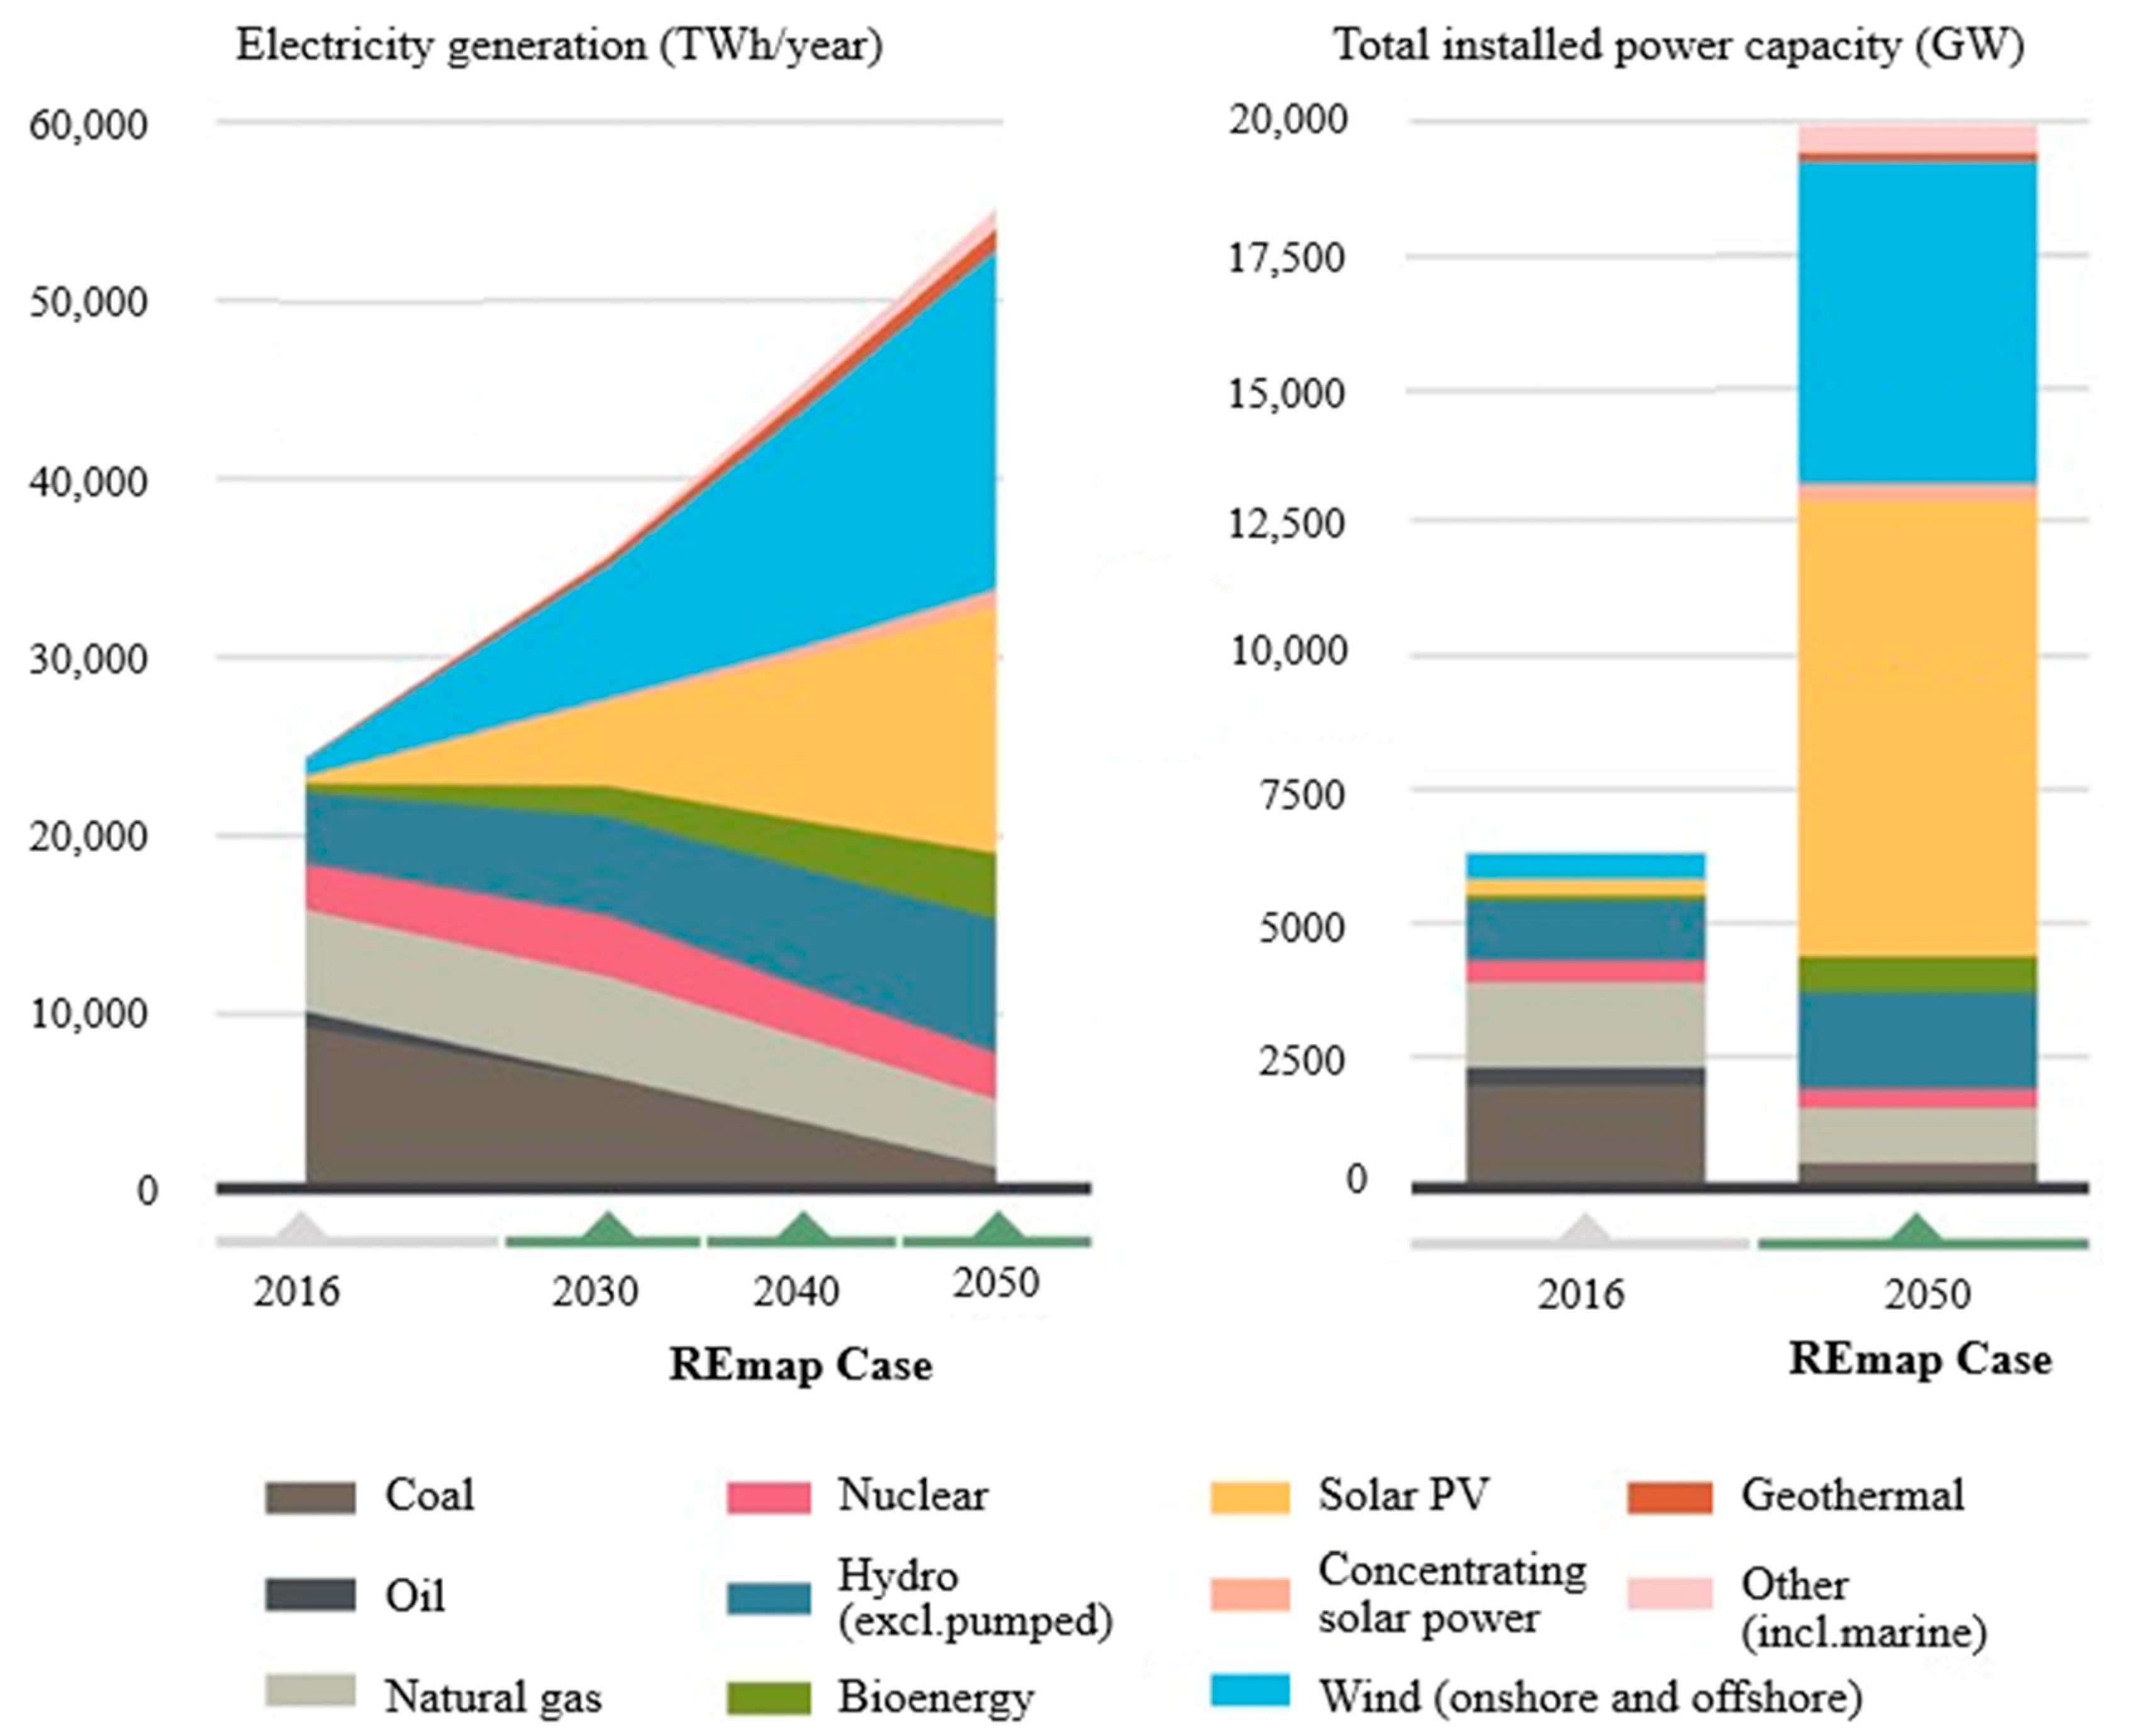
Solar photovoltaic energy is emerging in the world as one of the most highly promising renewable energy technologies. According to projections, photovoltaic systems will account for more than 40% of the worldwide renewable energy generated by 2050 [
1,
2]. Additionally, worldwide installed solar capacity expanded by 35% in 2022 compared to 2021, adding 239 GW of new solar capacity [
3]. According to the IEA, 6000 TWh of photovoltaic energy will be produced in 2050 to meet society’s needs [
4]. IRENA [
5] has also predicted an installed solar photovoltaic capacity of 8519 GW in 2050 (
Figure 1).
To meet this forecast and supply the largest share of total global demand with photovoltaic energy, large areas of land are needed [
4]. As the price of photovoltaic systems is declining and causing an increase in the cost-effectiveness of such systems, the land needed to install ground-mounted solar systems is becoming more and more crucial [
6], which may result in increased conflict regarding access to land for photovoltaic solar energy production and agriculture. Heightened competition for land use, which may result in socio-economic conflicts, may occur due to the growing solar energy demand [
7]. Indeed, due to climate change and global population growth, land scarcity will increase due to factors such as changes in agricultural land use, energy demand, and other human needs, as well as other factors that reinforce this trend, such as soil degradation [
8,
9,
10,
11,
12]. On the one hand, global food production is increasing to meet the growing population demand [
2,
13], while global population growth, improved living standards, and industrialization are driving global energy demand [
2,
14]. Furthermore, according to Chae et al. [
15], food demand will increase from 35% in 2010 to 56% in 2050. However, agriculture faces many challenges due to constraints related to climate change. Among these challenges are extreme weather conditions and temperature and water shortages. Agrivoltaics, an emerging clean technology, provides a promising solution by making it possible to co-produce food and energy on the same land surface [
7] and protecting crops against extreme weather conditions. These emerging systems may be very beneficial in developed and developing countries with high population densities and where renewable energy development is increasingly gaining importance, while agricultural land remains a valuable resource [
16] because agrivoltaics systems provide a synergistic approach to the coexistence of renewable energy and agricultural production.
Beyond agricultural and energy production, agrivoltaics systems can help improve agricultural conditions, especially given the impact of climate change on water resources and crops, for more sustainable production. Indeed, they help conserve water use in agriculture by reducing crop irrigation water requirements and creating microclimatic conditions favorable to crops. Thus, they can contribute to climate change mitigation and the sustainable use of water. The shade provided by the photovoltaic field in agrivoltaics systems can be beneficial, reducing the amount of water lost through evaporation and thus increasing water use efficiency [
17]. To this end, these devices are advantageous in areas prone to drought during hot periods, as they reduce plant water requirements through reduced evapotranspiration [
4,
18,
19]. The shade provided by the photovoltaic field in agrivoltaics systems can be beneficial, reducing the amount of water lost through evaporation and thus increasing water use efficiency [
17]. To this end, these devices are advantageous in areas prone to drought during hot periods, as they reduce plant water requirements through reduced evapotranspiration [
4,
18,
19]. Also, lower radiation levels below the PV array affect soil’s water-storage capacity and climatic parameters, creating conditions that are, on average, more favorable for crop growth under the panels than for crops exposed to full sunlight. As reported by Yue et al. [
20], agrivoltaics systems can increase soil moisture by 14.7% for fixed PV panel installation and 11.1% for oblique single-axis PV panel installation. Moreover, studies conducted in arid environments on the impact of agrivoltaics systems on specific crops have shown that water use efficiency under the panels was estimated at 157%, 65%, and 12% for chili peppers, tomatoes, and lettuce, respectively [
21]. Similarly, a simulation study conducted by Elamri et al. [
22] showed a reduction of less than 20% in lettuce water requirements due to the shading effect of the panels. Indeed, the installation of photovoltaic panel supports on agricultural land can either reduce or enhance crop yields. Beyond the physical footprint of the structures and the associated decrease in cultivable area, both of which vary with the design and spatial configuration of the system, the panels also generate shading effects that may lower soil evaporation and alleviate water stress. These microclimatic modifications can benefit certain crops, suggesting that the net impact on yield ultimately depends on the trade-off between land occupation losses and the favorable environmental conditions induced by the panels.
Thus, due to the increase in demand for food and energy, and the unavailability of land in rural and urban areas with increasing populations, it is necessary to evaluate the profitability of using agrivoltaics systems.
Agostini et al. [
23] conducted an economic assessment of agrivoltaic systems, comparing high-density configurations incorporating biaxial and monoaxial solar-tracking technologies at the
Agrovoltaico installation in the Po Valley, Italy. Neupane Bhandari et al. [
24] analyzed the economic performance of an agrivoltaic system under two scenarios—one assuming no reduction in crop yield and another with an 80% yield loss in Nger. Their study compared three agricultural production systems: rain-fed cultivation, diesel-powered irrigation, and solar-powered irrigation. However, the analysis did not explicitly account for system configuration, even though configuration directly influences the choice of equipment, number of panels, energy output, and crop productivity.
Similarly, Poonia et al. [
25] examined the economic profitability of five ground-mounted agrivoltaic configurations with crops cultivated in the interspaces of the photovoltaic arrays in the Jodhpur region of India. Di Francia and Cupo [
26] proposed a cost–benefit methodology to assess the economic viability of agrivoltaic installations relative to conventional ground-mounted photovoltaic plants in Italy. Chalgynbayeva et al. [
3] investigated the profitability of agrivoltaic systems in Hungary by analyzing the impact of cost reductions in key components and comparing agrivoltaic systems with both ground-mounted PV and traditional apple production systems. Gautam et al. [
27] compared the profitability of ground-mounted and elevated agrivoltaic systems with identical energy capacities in Uttar Pradesh, India. However, given that systems with the same installed capacity may occupy different land areas depending on configuration, profitability should also be evaluated relative to land use efficiency.
In the United Kingdom, Hussain and Ghosh [
28] analyzed the potential and viability of agrivoltaic systems by assessing various photovoltaic configurations across eleven regions, highlighting geographical location as a key determinant of system performance. Zidane et al. [
29] evaluated the profitability of single-axis, vertical, and elevated agrivoltaic configurations in comparison with conventional ground-mounted PV systems across several European countries, including Sweden, Denmark, Germany, and Italy. Chen et al. [
30] examined the financial feasibility and equitable benefit-sharing mechanisms of an ongoing agrivoltaic project in the Hachinohe region of Japan.
To the best of our knowledge, no prior research has assessed the performance of agrivoltaic systems with respect to configuration variability in West Africa. However, such analyses are particularly relevant in this region, where agrivoltaics offer substantial potential to enhance both energy access and agricultural productivity. This is especially critical in rural areas, where populations continue to face limited access to reliable electricity [
31], agriculture remains the main source of livelihood, and drought conditions are worsening due to climate change impacts [
32].
Comparing the profitability of agrivoltaics systems with agricultural production systems and PV power plants will make it possible to study the applicability and benefits or limitations of adopting agrivoltaics systems in order to verify the need for a transition from agriculture or PV power plants to agrivoltaics systems in rural and urban areas. It is therefore crucial to assess the economic profitability of agrivoltaics systems to support evidence-based decision-making and promote their adoption in developing regions. The purpose of this study is to evaluate the economic profitability of agrivoltaics systems in West Africa, with Burkina Faso serving as a representative case study. This study will provide policy makers, private individuals, and grower groups with evidence on the economic feasibility of different agrivoltaics configurations.
2. Materials and Methods
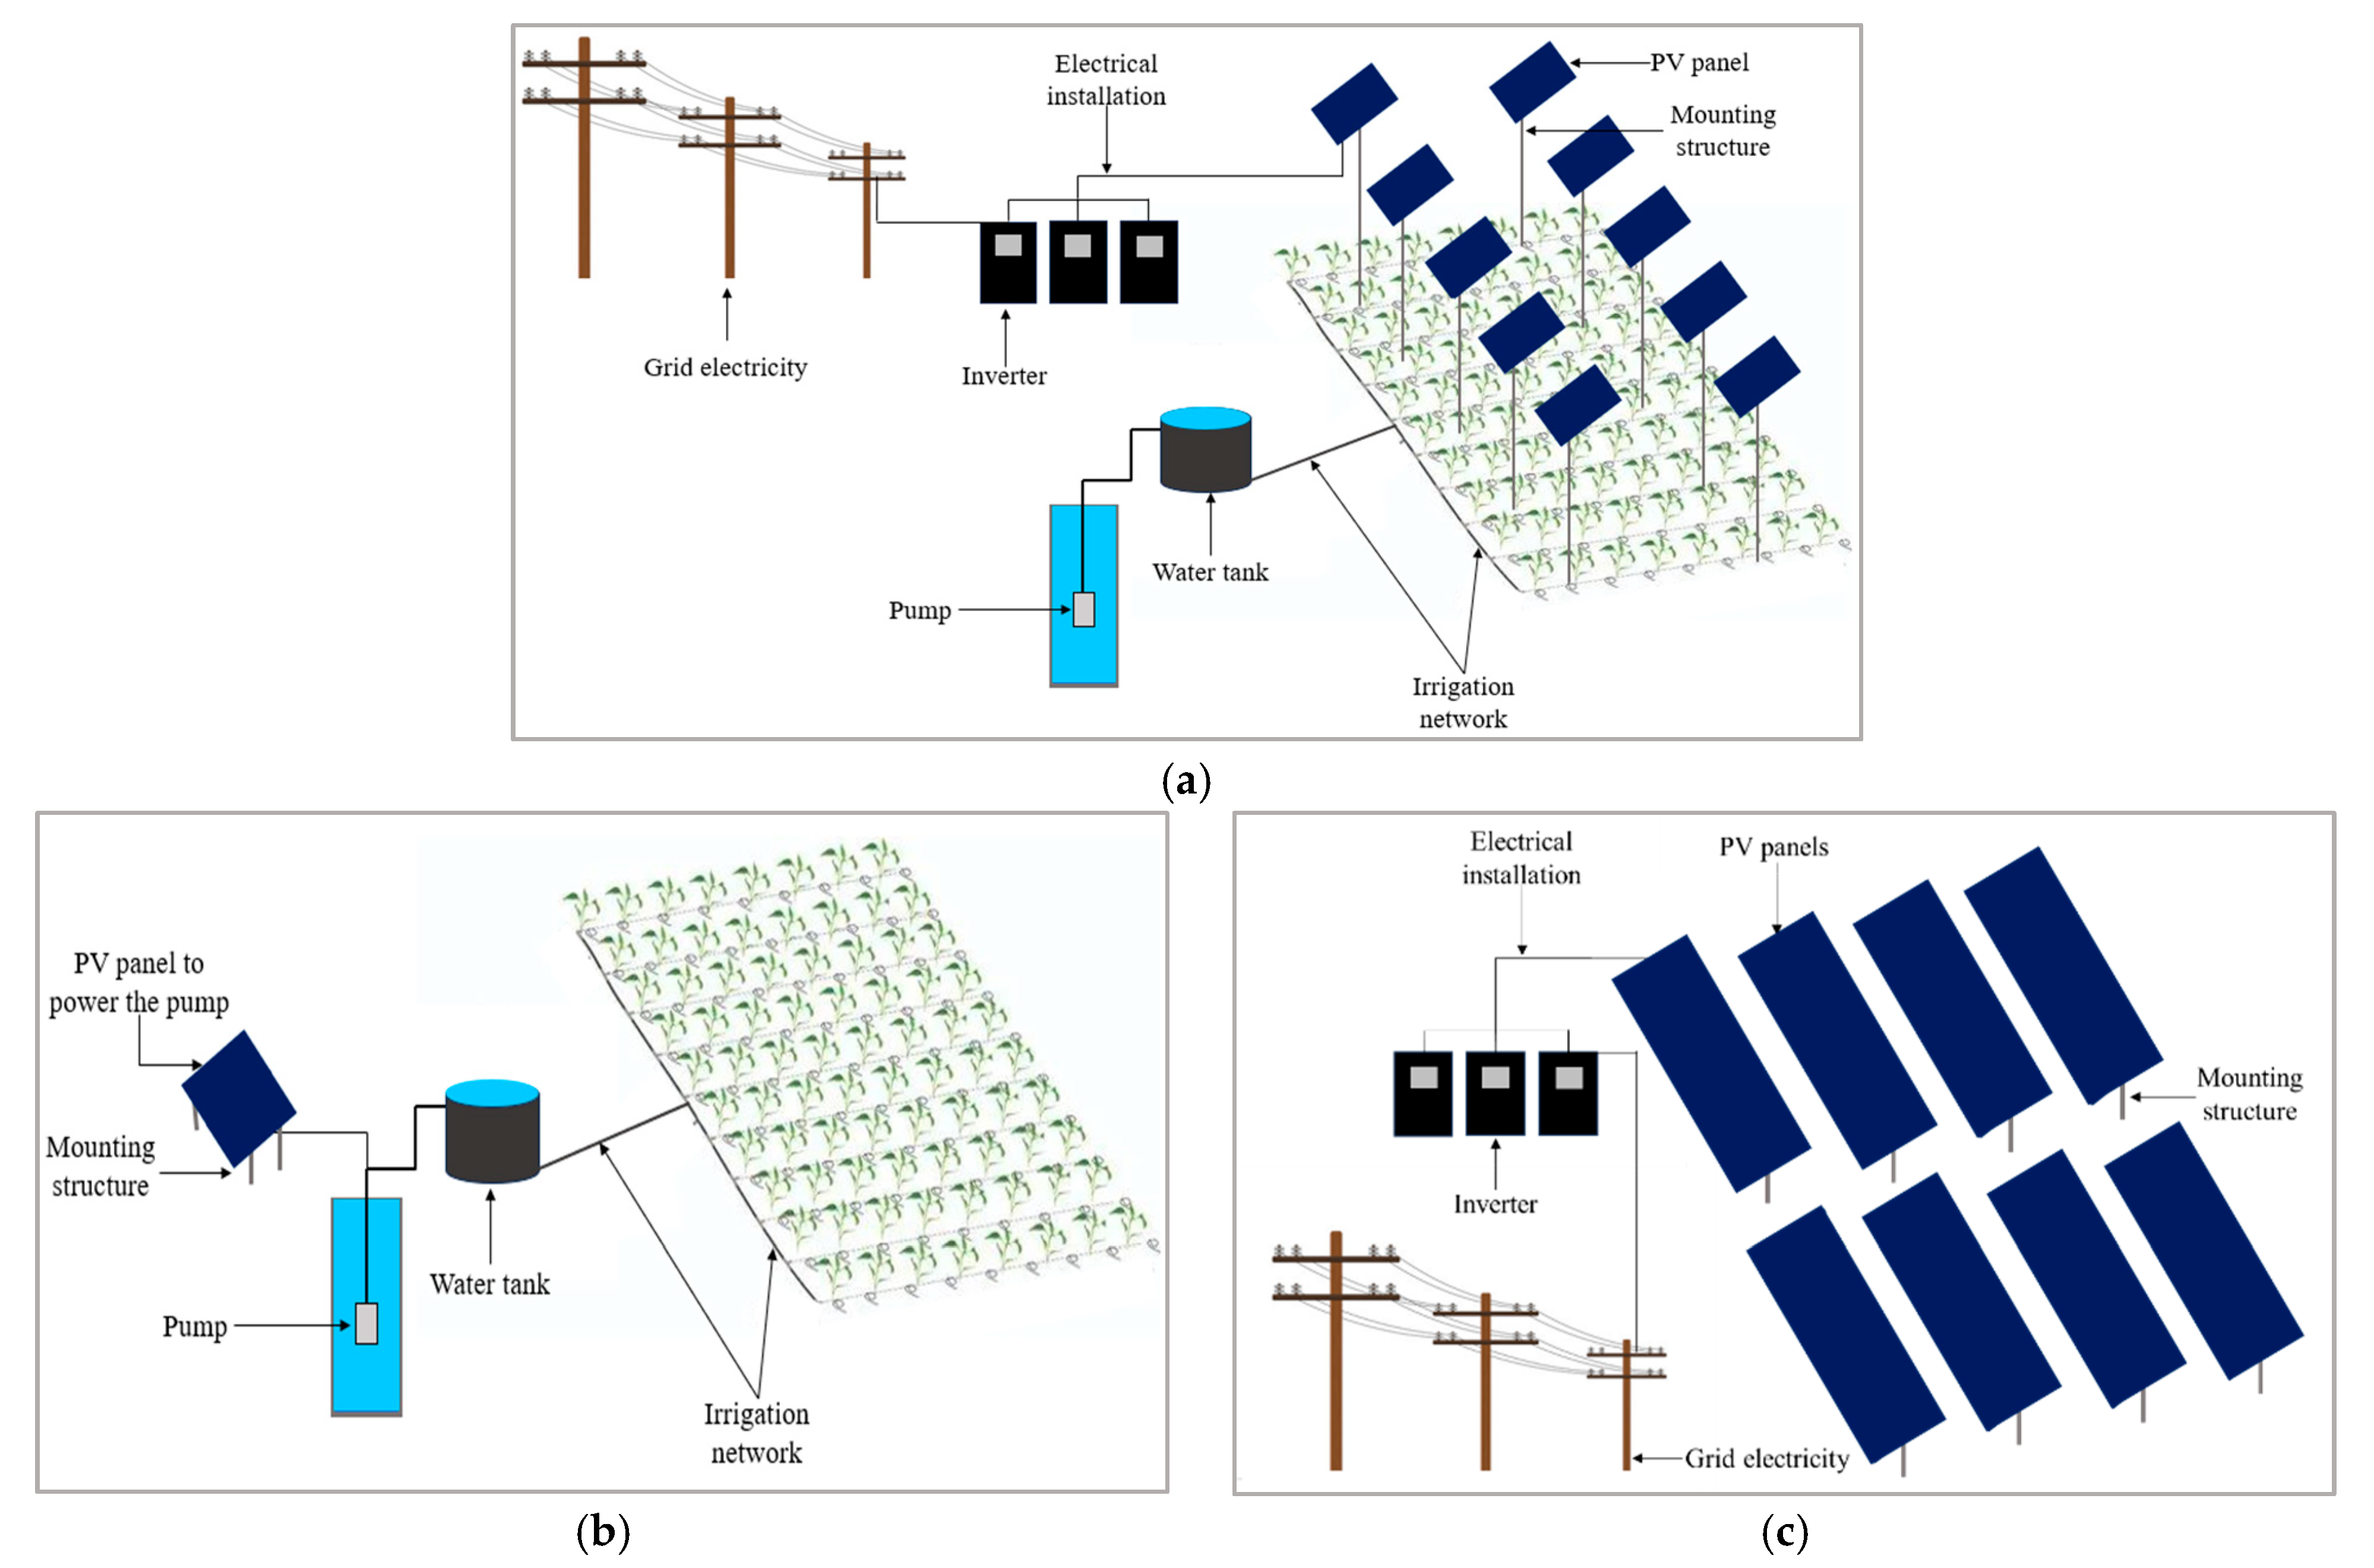
This study evaluates the profitability of agrivoltaics systems combined with automated irrigation in West Africa. The study compares three alternative agrivoltaics configurations against traditional agriculture and solar photovoltaic power plants, with all systems assessed over a standardized 1 ha area (
Figure 2).
The cost of purchasing 1 hectare of land varies considerably depending on the area (
https://bf.coinafrique.com/categorie/terrains-agricoles, accessed on 17 August 2025). Therefore, based on the most common costs, we considered five (5) scenarios related to the purchase of land:
Scenario 1, called FCL (free of cost land), in which the land is free of charge;
Scenario 2, called LPCL (low purchase cost of land), in which the average cost of land is 914.69 EUR/ha;
Scenario 3, called MPCLA (medium purchase cost of land A), in which the average cost of land is 5335.72 EUR/ha;
Scenario 4, called MPCLB (medium purchase cost of land B), in which the average cost of land is 22,867.35 EUR/ha;
Scenario 5, called HPCL (high purchase cost of land), in which the average cost of land is 108,238.80 EUR/ha.
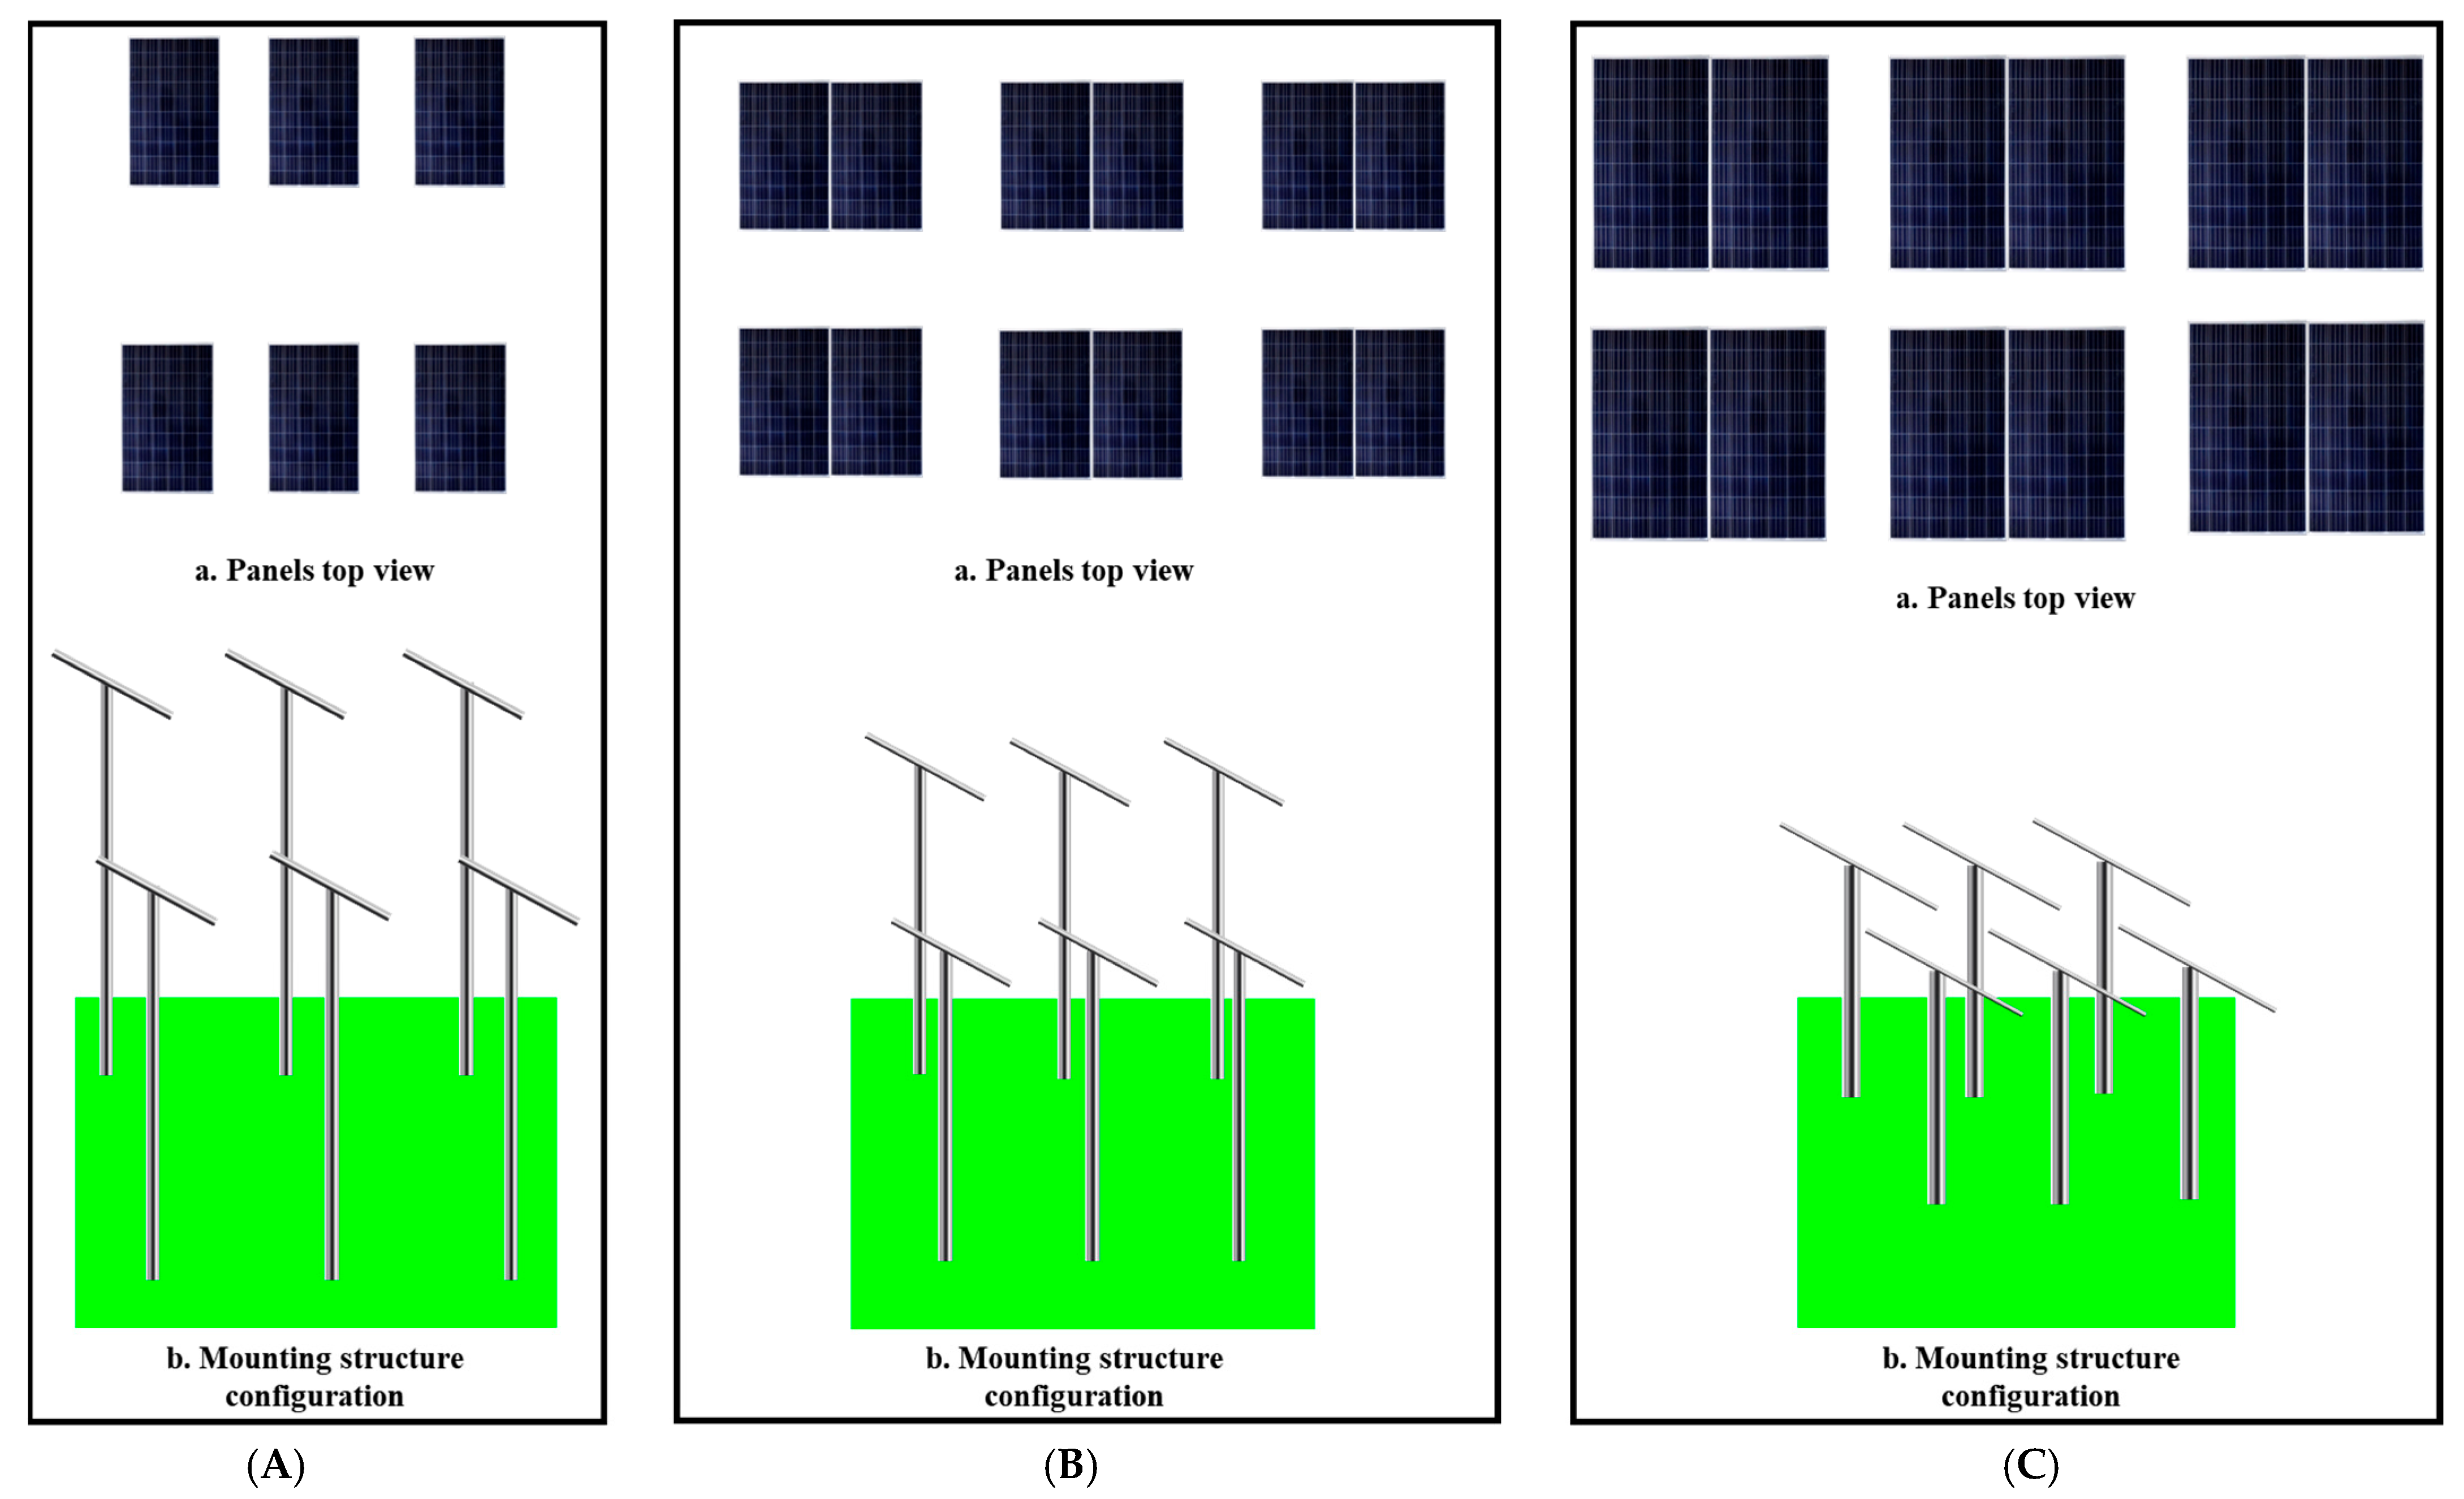
The study assesses the profitability of various agrivoltaics system configurations, taking into account that the number of photovoltaic (PV) panels, the shading they produce, and the associated equipment requirements can vary significantly depending on the chosen configuration. These differences can influence crop yield, the energy output of the solar PV installation, and the overall investment cost. Specifically, the quantity of solar panels and, consequently, the energy produced differ across configurations. For a given land area, agrivoltaics systems can generate varying levels of energy and may require different panel densities. Therefore, the surface area occupied by the panels is a critical factor when evaluating the profitability and efficiency of each configuration. In this study, three distinct configurations are considered for the same land area, allowing for an assessment of how the chosen configuration affects the economic performance of agrivoltaics systems. This study adopts the same configurations as those investigated in the first phase of our comprehensive study, previously published in 2024 [
33]:
Case 1, in which 100 W panels are used. The surface area of each panel is 0.68 m2, with one panel per table. The spacing between panels is 1.3 m, the spacing between rows of panels is 4.4 m, and the height of the panels is 4 m.
Case 2, in which 100 W panels are used. The surface area of a panel is 0.68 m2, with two panels per table. The spacing between panels is 1.9 m, the spacing between rows of panels is 3.2 m, and the height of the panels is 3.4 m.
Case 3, in which 260 W panels are used. The surface area of a panel is 1.62 m2, with two panels per table. The spacing between panels is 2 m, the spacing between rows of panels is 2 m, and the height of the panels is 2.3 m.
The elevations, the spacing between panel tables and between rows of panel tables for the three cases studied, and the crop yields and peak power for each case are summarized in
Table 1. Case 1 obtained a higher yield of 3.36 T/ha and a lower peak power of 96.9 kW, while case 3 had the lowest yield of 2.9 T/ha and a peak power of 378.6 kW.
Figure 3 provides an overview of the three configurations of the agrivoltaics systems studied.
Traditional agriculture is a system whose sole objective is agricultural production. Although the traditional agricultural scenario is primarily focused on crop production rather than energy generation, photovoltaic (PV) panels are included to supply electricity for irrigation pumping. In many rural or off-grid areas, farmers rely on solar-powered pumps as a cost-effective and sustainable alternative to diesel or grid electricity. The presence of PV panels in this scenario therefore reflects their role as an energy source supporting irrigation operations, rather than as a component of an integrated agrivoltaics system. This system achieves a yield of 3.7 tons/ha. The PV power plant is a plant whose sole purpose is energy production, and which uses polycrystalline photovoltaic solar panels, providing a peak power of 550 kW.
To assess the profitability of the systems, six (6) economic indicators were studied: (i) Net Present Value, (ii) Life Cycle Cost, (iii) Discounted Energy Cost, (iv) Profitability Index, (v) Internal Rate of Return, and (vi) Payback Period.
Furthermore, profitability was assessed by considering three discount rates, ranging from 6% to 12%, using a step size of 1 to compare profitability based on changes in the discount rate. This comparison was made using the approach adopted by N’Tsoukpoe and Lekombo [
34] based on the discount rate used for projects in Burkina Faso and the Sahel, which considered three discount rates in their study (6%, 8%, and 12%). The author indicated that for renewable energy projects, the discount rate used varies between 8% and 10% [
34,
35,
36]. However, a discount rate of 12% was adopted by the African Development Bank [
34,
37] and a discount rate of 6% was applied by the World Bank [
34,
38] for projects in the Sahel.
In addition, IRENA [
39] applied a discount rate of 10% for renewable energy projects in West Africa.
Discount rates ranging from 6% to 12% were therefore adopted. This study will enable policy makers, private investors, and lenders to make decisions regarding the implementation of agrivoltaics systems installation projects.
2.1. Net Present Value (NPV)
The most popular and sophisticated economic evaluation technique is undoubtedly the NPV approach. This consists of discounting all future cash flows (inflows and outflows) resulting from the innovation project at a given discount rate, then adding them together [
40]. In other words, NPV estimates the total amount of wealth created by the project. A positive NPV means that the investment will add value to the company and that the project can be accepted. A negative NPV means that the investment will reduce the value of the company and that the project should be rejected [
41]. NPV is calculated using Equation (1) [
41].
where n is the operational life of the investment, r is the discount rate (at 6%, 8%, and 12%), CI
t is the cash flow at time t, and CO
t is the cash outflow at time t (with CO
0, which is the initial investment).
2.2. Life Cycle Cost (LCC)
The life cycle cost corresponds to the cost of an asset or its parts throughout its life cycle, while meeting its performance requirements. It includes the initial investment, operating costs, all compliance-related costs, maintenance and servicing costs, and the cost of decommissioning or any capital disposal.
2.3. Levelized Cost of Energy (LCOE)
The levelized cost of energy calculates the unit cost of energy based on the present value of costs incurred over the lifetime of the power plant [
42]. In other words, the LCOE of photovoltaics refers to the actual average cost of producing electricity per kilowatt (kW) of unit capacity. It is calculated by dividing the total cost of the electricity generation facility by the total electricity generation based on present value. The LCOE considers costs incurred throughout the process, such as initial capital expenditures (CAPEX), as well as operating, maintenance, and decommissioning costs over the lifetime of the facility (OPEX) [
43]. In this study, the LCOE is determined for agrivoltaics systems and PV power plants. It is calculated using Equation (2) [
28,
29].
where CAPEX
0 corresponds to initial investment regarding the PV power plant, OPEX
t is the operating expenses at time t, n is the observation period, r is the discount rate, and M is the annual electrical yield (kWh/year).
2.4. Profitability Index (PI)
The Profitability Index is a criterion for measuring profitability and classifying projects. It measures profitability per unit initially spent. It represents a comparison between the value of net cash flows and the initial investment. In cases with multiple projects, the one with the highest Profitability Index is the most beneficial. The Profitability Index is calculated using Equation (3) [
44,
45].
The most profitable project is selected using the Profitability Index based on the following classification:
If the Profitability Index is less than 1, the project is not profitable [
44];
If it is equal to 1, there is no difference between the investment and a financial investment at a rate equal to the discount rate [
44];
If it is greater than 1, the project is profitable [
44].
2.5. Internal Rate of Return (IRR)
The IRR is the average annual rate generated by the project and corresponds to the discount rate that makes the NPV equal to 0. This is calculated as follows: r = IRR when NPV = 0. The IRR is expressed as a percentage (%). A project is profitable when the IRR is higher than the discount rate [
44].
2.6. Payback Period (PBP)
The payback period offers a different perspective on the project compared to other indicators. It assesses the time required to recover the initial investment made in the project. The payback period is expressed in years.
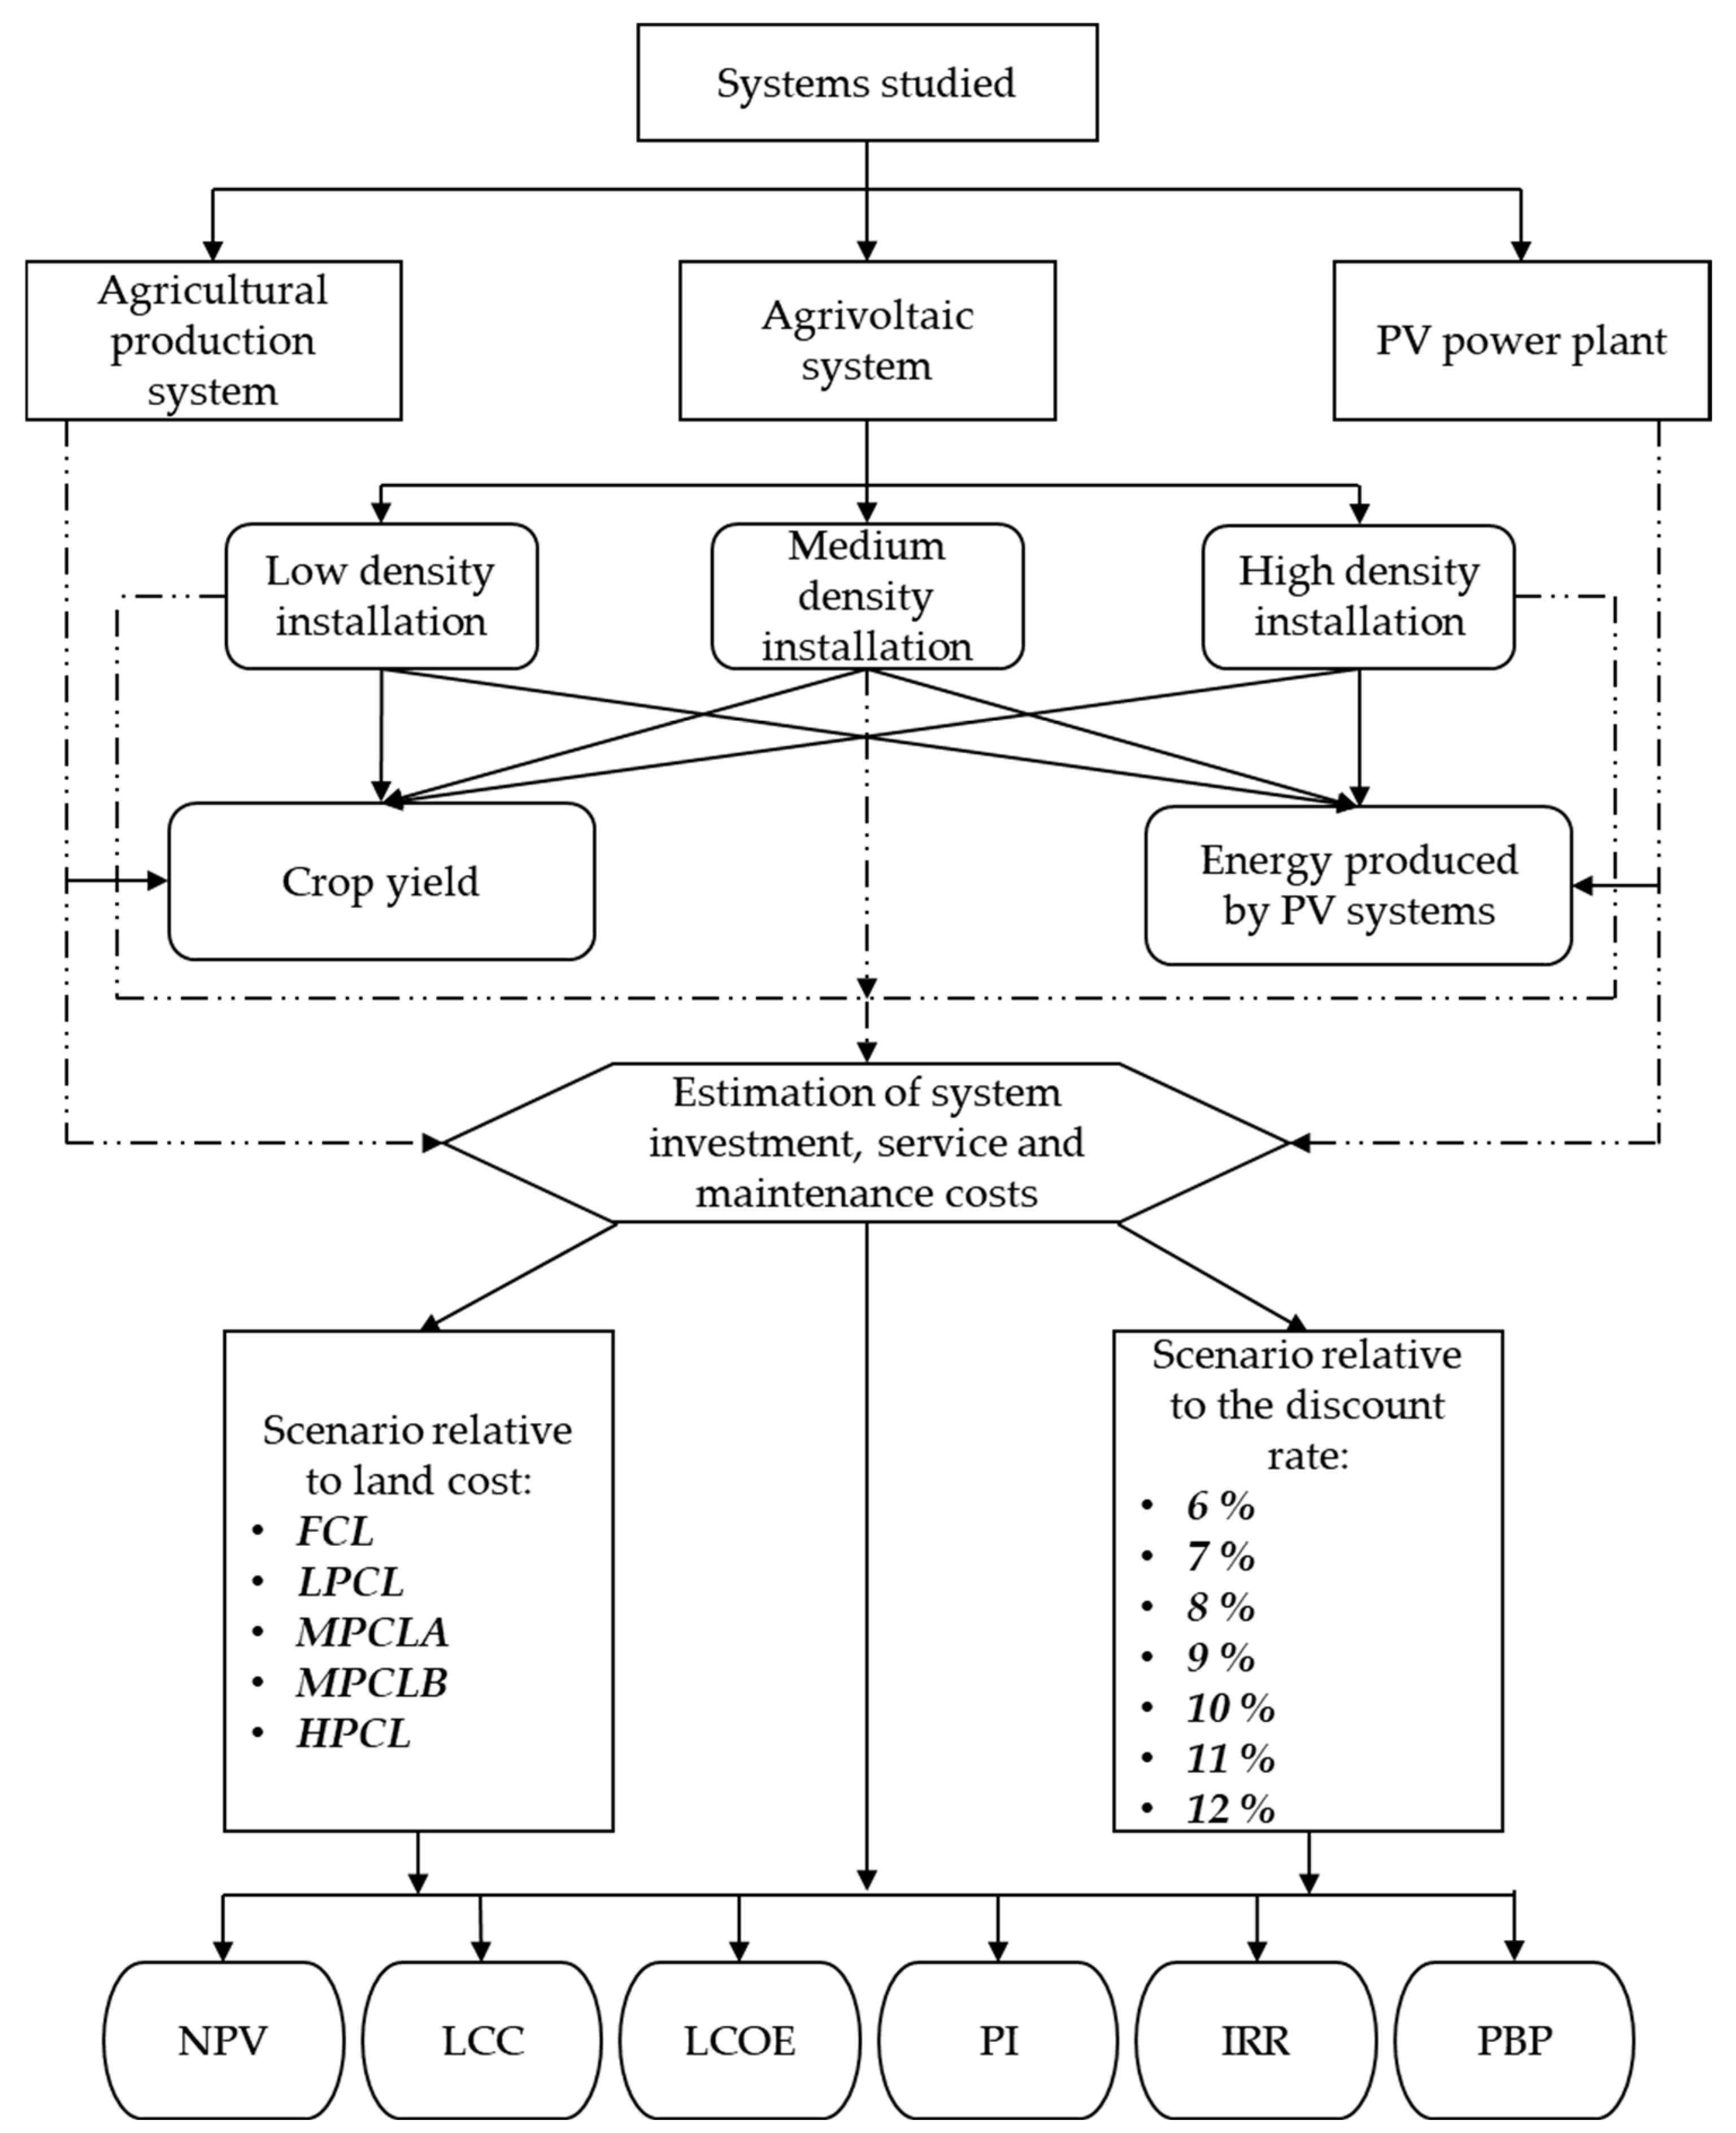
The methodology used is summarized in
Figure 4.
3. Results and Discussion
This section presents the results relating to investment costs and the five indicators studied for the three agrivoltaics system scenarios, the agricultural system, and the PV power plant for discount rates ranging from 6% to 12%.
3.1. Investment Costs
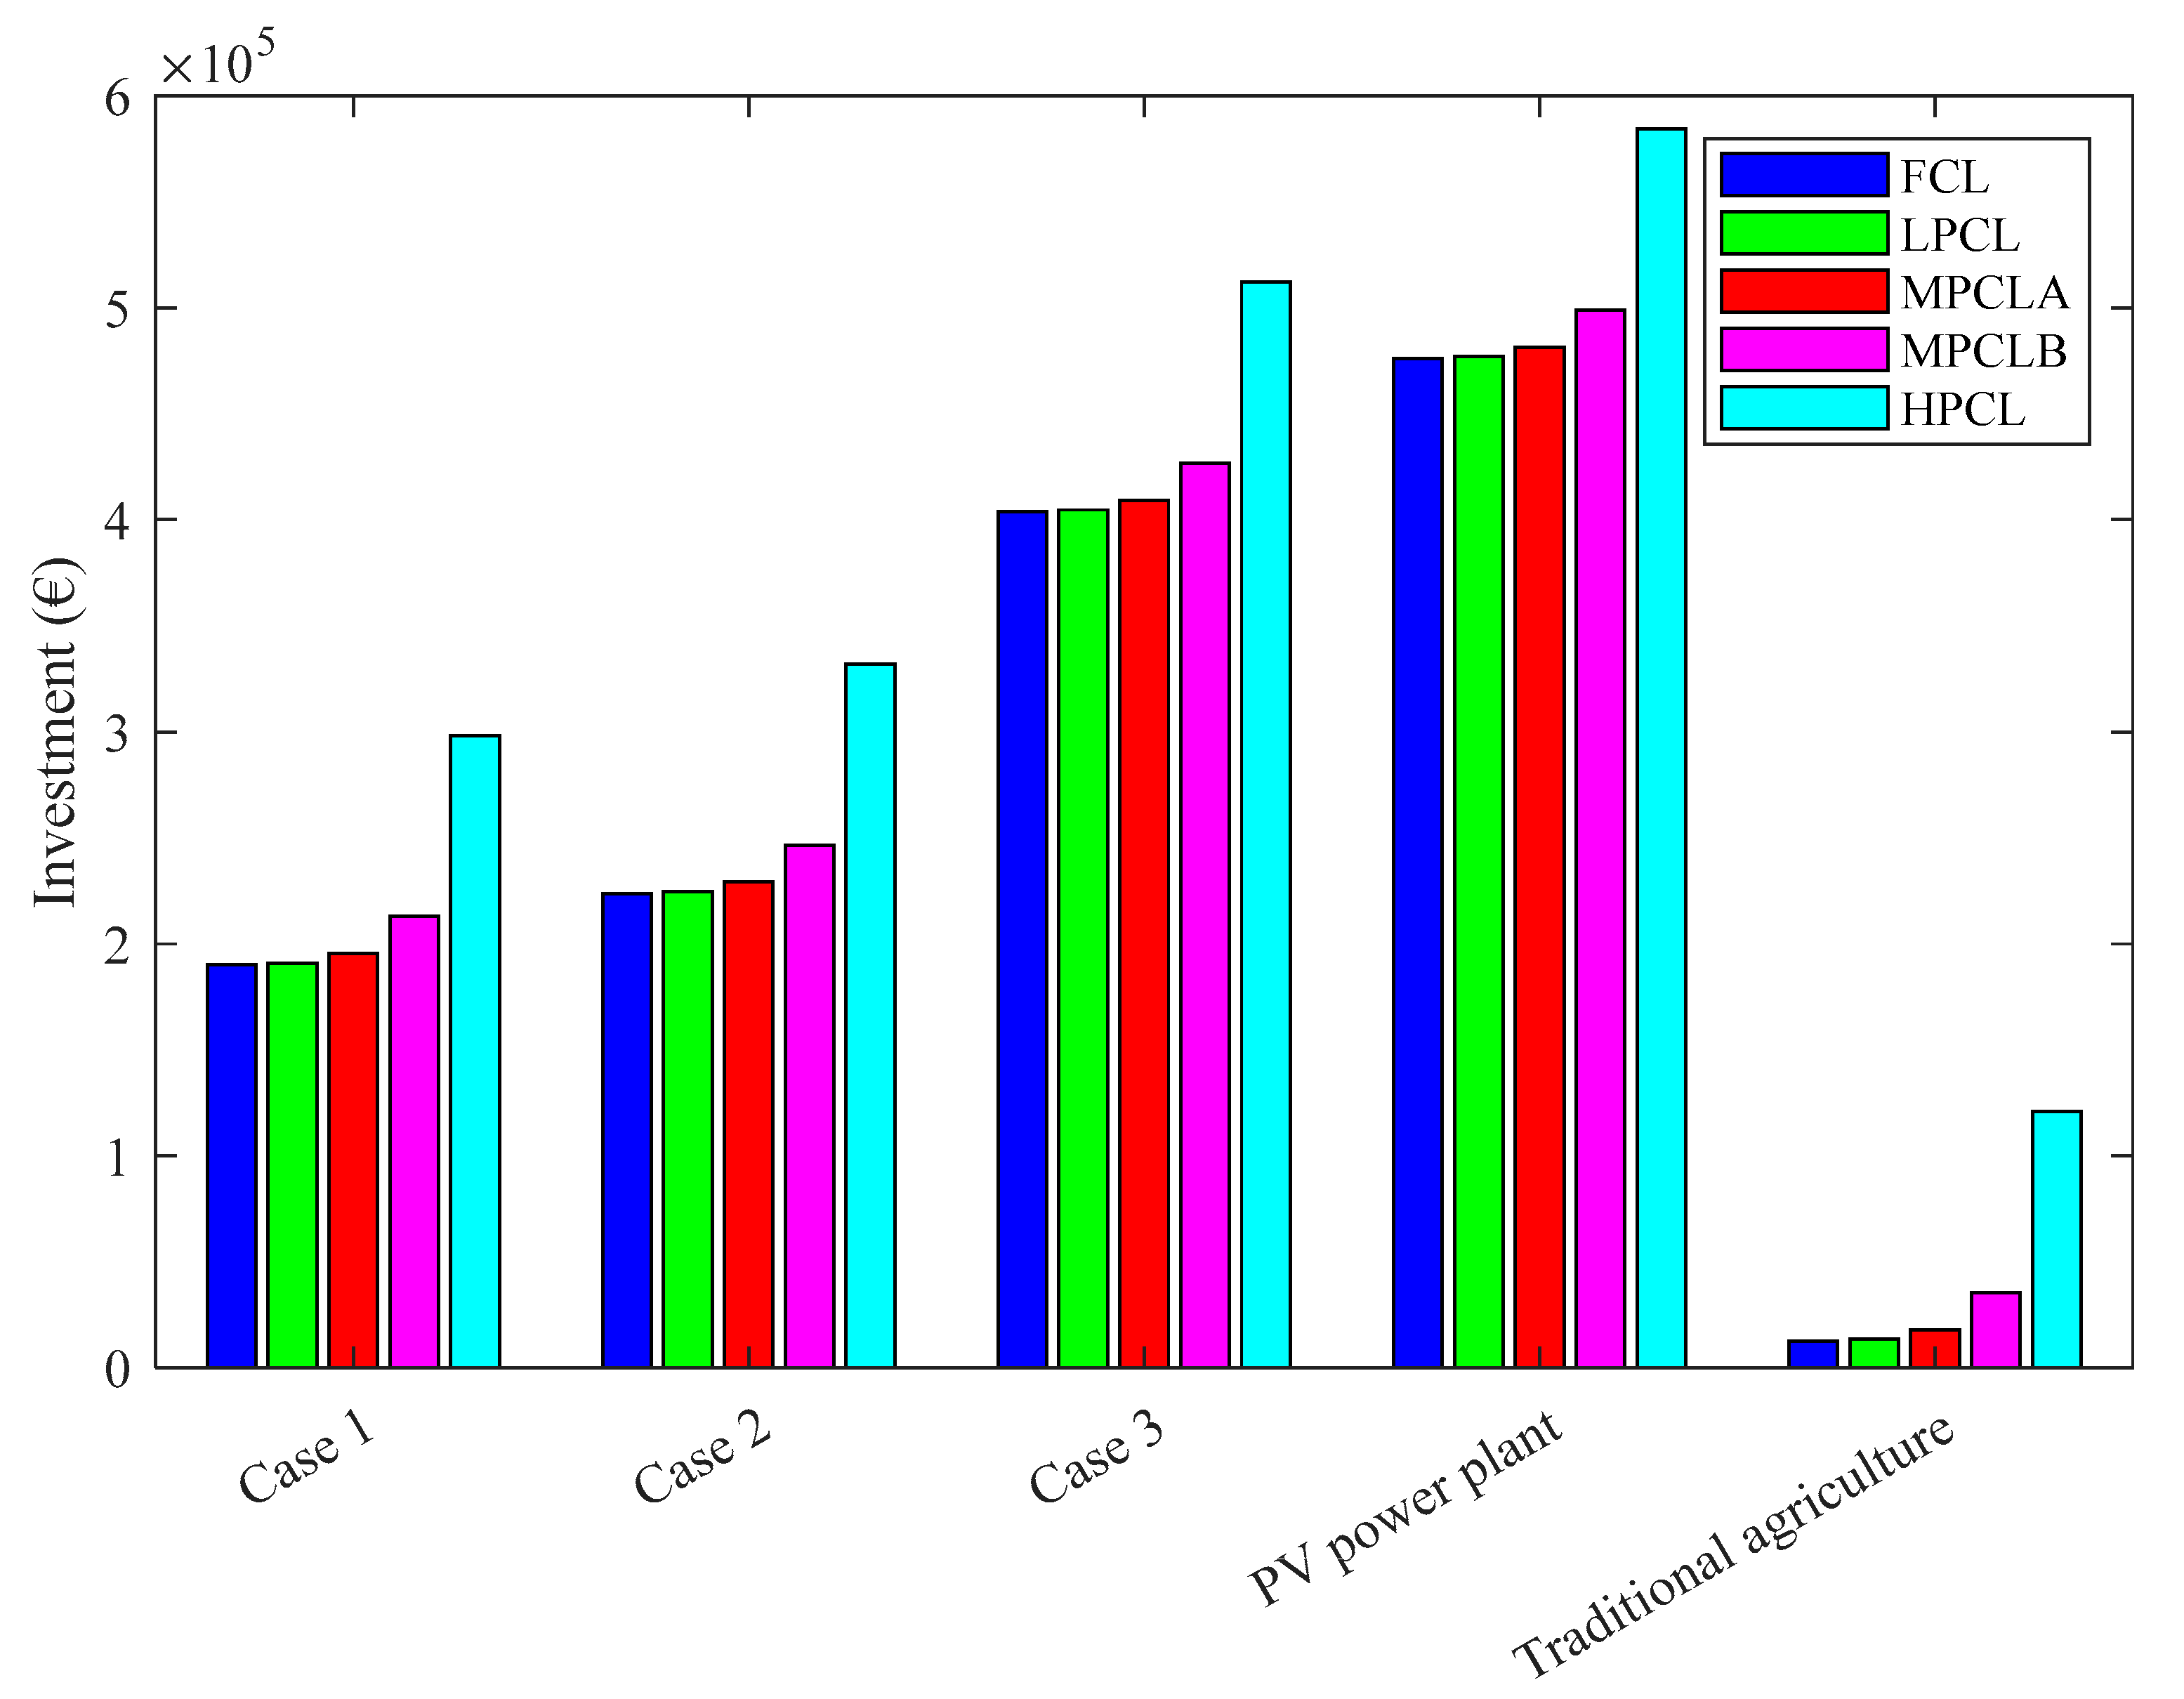
Figure 5 shows the investment cost when using 1 ha for the agricultural system, agrivoltaics systems, and the PV power plant, considering variations in land costs. The results show that the investment cost is highest for the PV power plant, followed by Case 3 of agrivoltaics, which represents 85% of the investment used to set up the PV power plant. This is followed by Cases 2 and 1 of agrivoltaics systems, whose investment costs are very similar. In addition, it should be noted that the cost of purchasing land can have a significant impact on the investment cost, particularly in the case of traditional agriculture.
Thus, considering the FCL scenario in which land is free, it can be seen that the investment cost is higher for the solar power plant, followed by Case 3 for agrivoltaics, where it is estimated at EUR 476,099.81 and EUR 403,777.00, respectively. These two systems are followed by Cases 1 and 2, with investment costs of EUR 223,841.18 for Case 2 and EUR 190,106.74 for Case 1. The case of traditional agriculture, where the land is used solely for agricultural production, recorded the lowest investment cost, estimated at EUR 12,718.82.
The same trend was observed in cases where land is not free. However, there was an increase in investment costs of 7.19% for traditional agriculture, 0.48% for Case 1, 0.41% for Case 2, 0.23% for Case 3, and 0.19% for the PV power plant in the LPCL scenario compared to the FCL scenario. The MPCLA scenario led to an increase in investment of 41.95% for traditional agriculture, 2.80% for Case 1, 2.38% for Case 2, 1.32% for Case 3, and 1.12% for the PV power plant. The MPCLB scenario led to an increase in investment of 179.8%, 12.03%, 10.22%, 5.66%, and 4.80% for traditional agriculture, Case 1, Case 2, Case 3, and the PV power plant, respectively, compared to the FCL scenario. The HPCL scenario also led to an increase in investment of 851%, 56.93%, 48.36%, 26.80%, and 22.73% for traditional agriculture, Case 1, Case 2, Case 3, and the PV power plant, respectively.
The higher investment cost for the PV plant is due to the fact that the plant has a higher peak power of 550 kW/ha. The expenses required to set up a PV field are much higher, even in agrivoltaics systems. Thus, the power plant requires a higher number of PV panels, and the inverters used are also larger, and the cabling system and ancillary equipment are more extensive. This is reinforced by the fact that Case 3 of agrivoltaics followed the PV power plant in terms of investment cost. In fact, the PV field in Case 3 of agrivoltaics has a peak power of 378.6 kW and represents 95.4% of the investment cost required to set up 1 ha for the FCL scenario and 75.2% for the HPCL scenario, considering the configuration proposed in this case study. For Cases 1 and 2, the investment for setting up the PV field represented 90.24% and 91.71% of the investment, respectively, for the FCL scenario. However, for traditional agriculture, the installation of the borehole entailed the highest expenditure for the FCL and LPCL scenarios, representing 44.95% and 41.94% of the investment, respectively. However, land costs account for the largest part of the investment costs for traditional agriculture in the MPCLB (64.26%) and HPCL (89.48%) scenarios. The cost of land also represents 36% of the investment for Case 1 of agrivoltaics and 33% of the investment for Case 2, considering the HPCL scenario.
For the PV plant, the entire investment was used to set up the PV field, including the purchase of equipment and expenses related to labor, transportation, and the purchase of land in scenarios where the land is not free. For agrivoltaics systems, the investment cost includes the costs associated with installing the PV field, irrigation equipment, drilling, automatic irrigation components, and the purchase of agricultural inputs and land. For agriculture, the investment is for the purchase of irrigation equipment, drilling, solar irrigation pumping equipment, agricultural inputs, and land purchase for the LPCL, MPCLA, MPCLB, and HPCL scenarios.
3.2. Net Present Value
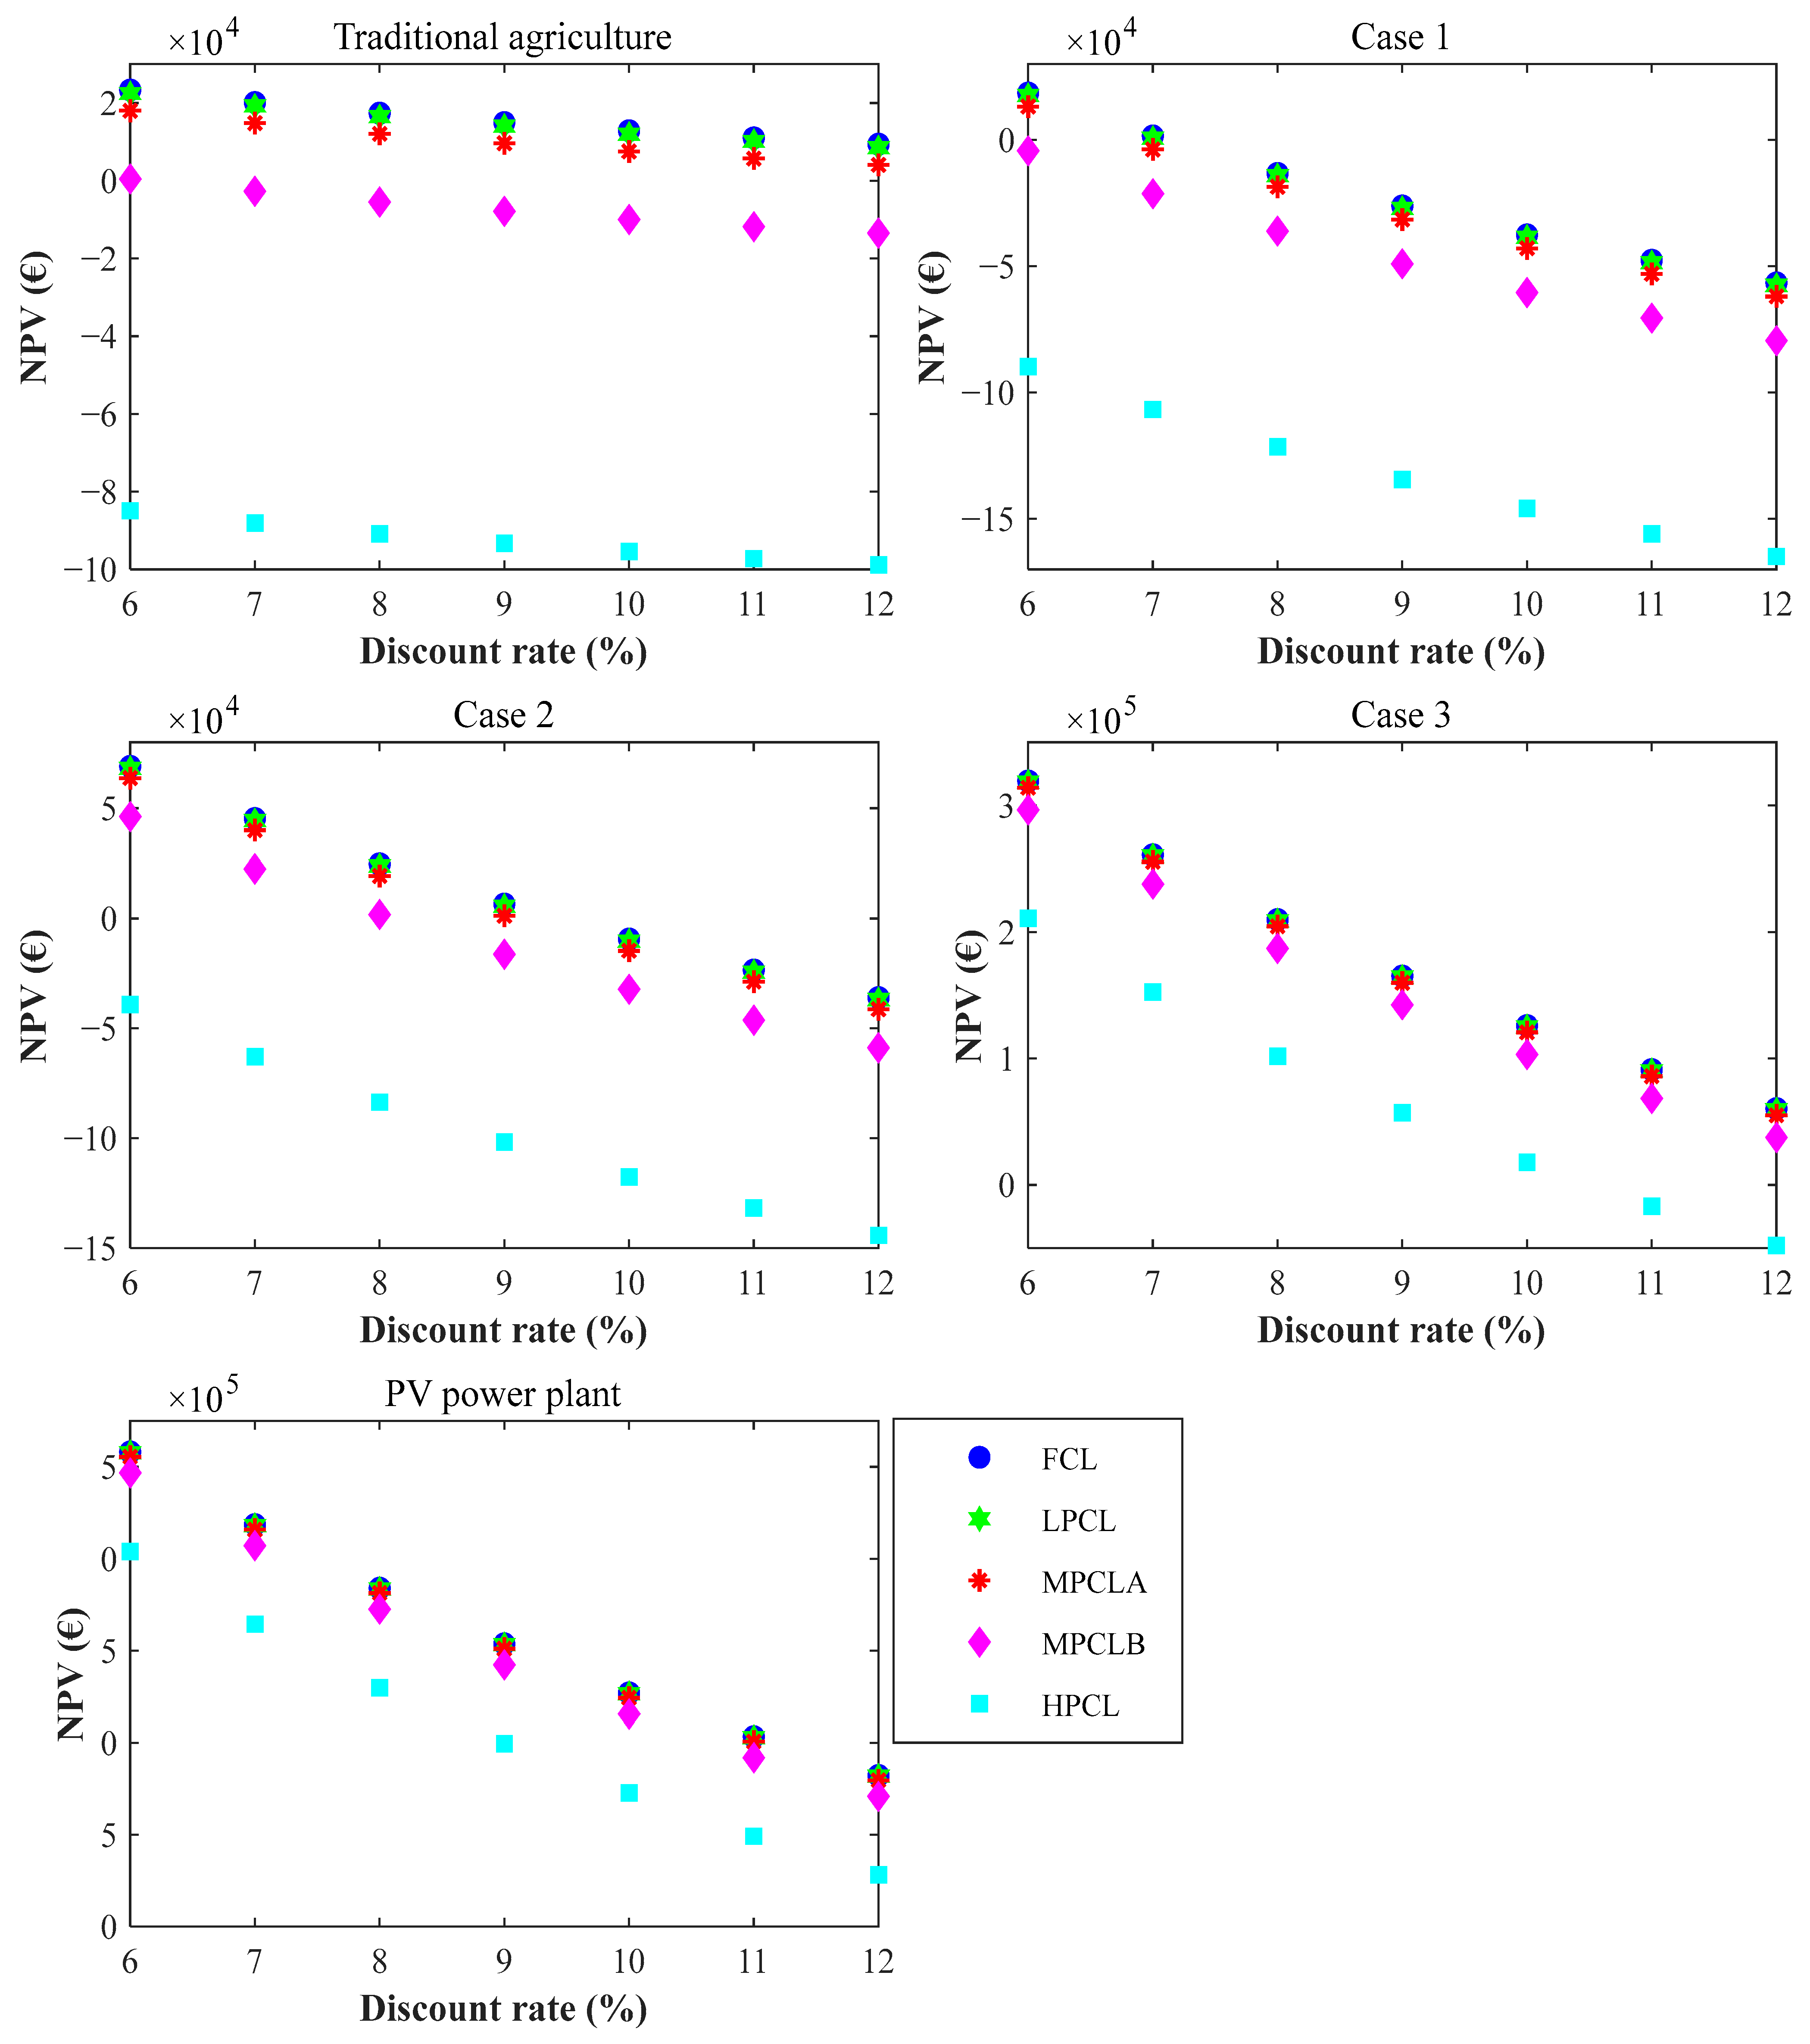
Figure 6 shows the variation in NPV when the discount rate varies between 6% and 12% for traditional agriculture, agrivoltaics systems, and the PV power plant for the FCL, LPCL, MPCLA, MPCLB, and HPCL scenarios.
The results show higher NPVs for the PV plant and Case 3 of agrivoltaics. The values decrease as the discount rate increases, resulting in negative NPVs for certain MPCLA, MPCLB, and HPCL scenarios for traditional agriculture, Case 1, and Case 2 of agrivoltaics.
Thus, for traditional agriculture, the HPCL scenario yielded negative NPVs for all discount rates. The NPV is higher for the FCL scenarios, where it is EUR 23,334.17 at 6%. The NPV decreased from EUR 20,147.86 to EUR 9401.24 when the discount rate changed from 7% to 12%. The LPCL scenario also led to a reduction in NPV. This NPV for LPCL decreased by 3.92%, 4.54%, 5.26%, 6.10%, 7.10%, 8.29%, and 9.73% when the discount rate was 6%, 7%, 8%, 9%, 10%, 11%, and 12%, respectively, compared to the FCL scenario. Also, this reduction was equal to 22.87% when the discount rate was 6% and 56.76% for a discount rate of 12% for MPCLA, compared to the FCL scenario.
Case 1 represents the least profitable system, yielding a positive NPV only when the discount rate is 6% for the FCL (EUR 18,536.32), LPCL (EUR 17,621.63) and MPCLA (EUR 13,200.61) scenarios, and 7% for the FCL (EUR 1565.91) and LPCL (EUR 651.22) scenarios. Thus, apart from the latter, all other cases obtained negative NPVs. Traditional agriculture is more profitable in comparison to this system.
Case 2 of agrivoltaics was more profitable than traditional agriculture for the FCL, LPCL, MPCLA, and MPCLB scenarios at discount rates of 6%, 7%, and 8%. Thus, at a discount rate of 6%, the NPV is EUR 69,056.30, EUR 68,141.60, EUR 63,720.58, and EUR 46,188.94 for the FCL, LPCL, MPCLA, and MPCLB scenarios, respectively. At a discount rate of 7%, the NPV decreased by 34.31% for the FCL scenario, 34.77% for the LPCL scenario, 37.19% for the MPCLA scenario and 51.30% for the MPCLB scenario, and at a discount rate of 8%, the NPV decreased by 64.23% for the FCL scenario, 65.09% for the LPCL scenario, 69.61% for the MPCLA scenario and 96.03% for the MPCLB scenario.
Case 3 was more profitable than Case 2 and traditional agriculture. The NPVs were positive for all cases except for the HPCL at an 11% (EUR −16,910.23) and 12% (EUR −47,826.93) discount rate. The FCL scenarios yielded an NPV of EUR 319,395.82, EUR 260,991.09, EUR 210,059.24, EUR 165,422.03, EUR 126,111.38, EUR 91,328.57, and EUR 60,411.88 at discount rates of 6%, 7%, 8%, 9%, 10%, 11%, and 12%, respectively. The NPV decreased slightly for the LPCL scenario, with reductions of 0.29%, 0.35%, 0.44%, 0.55%, 0.73%, 1%, and 1.51% when the discount rate was 6%, 7%, 8%, 9%, 10%, 11%, and 12%, respectively, in comparison to FCL. However, the MPCLB scenario led to a significant decrease in NPV of 7.16%, 8.76%, 10.89%, 13.82%, 18.13%, 25.04% and 37.85% when the discount rate was 6%, 7%, 8%, 9%, 10%, 11% and 12%, respectively.
The NPVs were higher for the PV plant, where the lowest values were obtained for the HPCL scenario. Thus, the latter presented NPVs of EUR 408,136.85 when the discount rate was 6%, EUR 328,949.09 when the rate was 7%, EUR 259,849.75 at 8%, EUR 199,250.09 at 9%, EUR 145,844.77 at 10%, EUR 98,556.79 at 11%, and EUR 56,493.84 at a 12% discount rate.
These results show that PV power plants are more profitable than agrivoltaics systems, and high-density agrivoltaics systems are more beneficial than low-density agrivoltaics installations. Low-density agrivoltaics systems require a high investment cost when the energy produced is very low. Indeed, these results show that energy production is the source of the greatest benefits, as can be seen from the higher NPV obtained for Case 3 of the agrivoltaics systems, which has a peak power of 378.6 kW. This case is very profitable, with high NPVs. Furthermore, Chalgynbayeva et al. [
3] showed that an agrivoltaic system with a peak power of 38 MWp can generate an NPV of EUR 70 million over a 30-year period in Hungary.
Furthermore, this idea is reinforced by the fact that the PV power plant, whose sole purpose is energy production, was more profitable, with a higher NPV, compared to Case 3 of agrivoltaics, which obtained the best performance among agrivoltaics cases. Thus, traditional agriculture is more profitable than low-density agrivoltaics systems when the discount rate is higher than 6%. Gautam et al. [
27] showed that the NPV of the agrivoltaic system exceeded the NPV of the ground-mounted PV system by an average of 17.5, confirming that high-density agrivoltaics systems are highly profitable. In fact, the higher NPV in their case study can be explained by the fact that they used systems with the same production capacity. In contrast, in our study, the energy generated by agrivoltaics systems is lower than the energy produced by the solar power plant. However, this study confirms that energy production has a strong impact on the profitability of agrivoltaics systems.
In addition, the cost of land can have a significant impact on the profitability of agrivoltaics systems and traditional farming systems. The impact is more pronounced in the case of traditional farming and low-density agrivoltaics systems. This is demonstrated by negative NPVs for the HPCL scenario in the case of traditional farming, Case 1, and Case 2 for all discount rates.
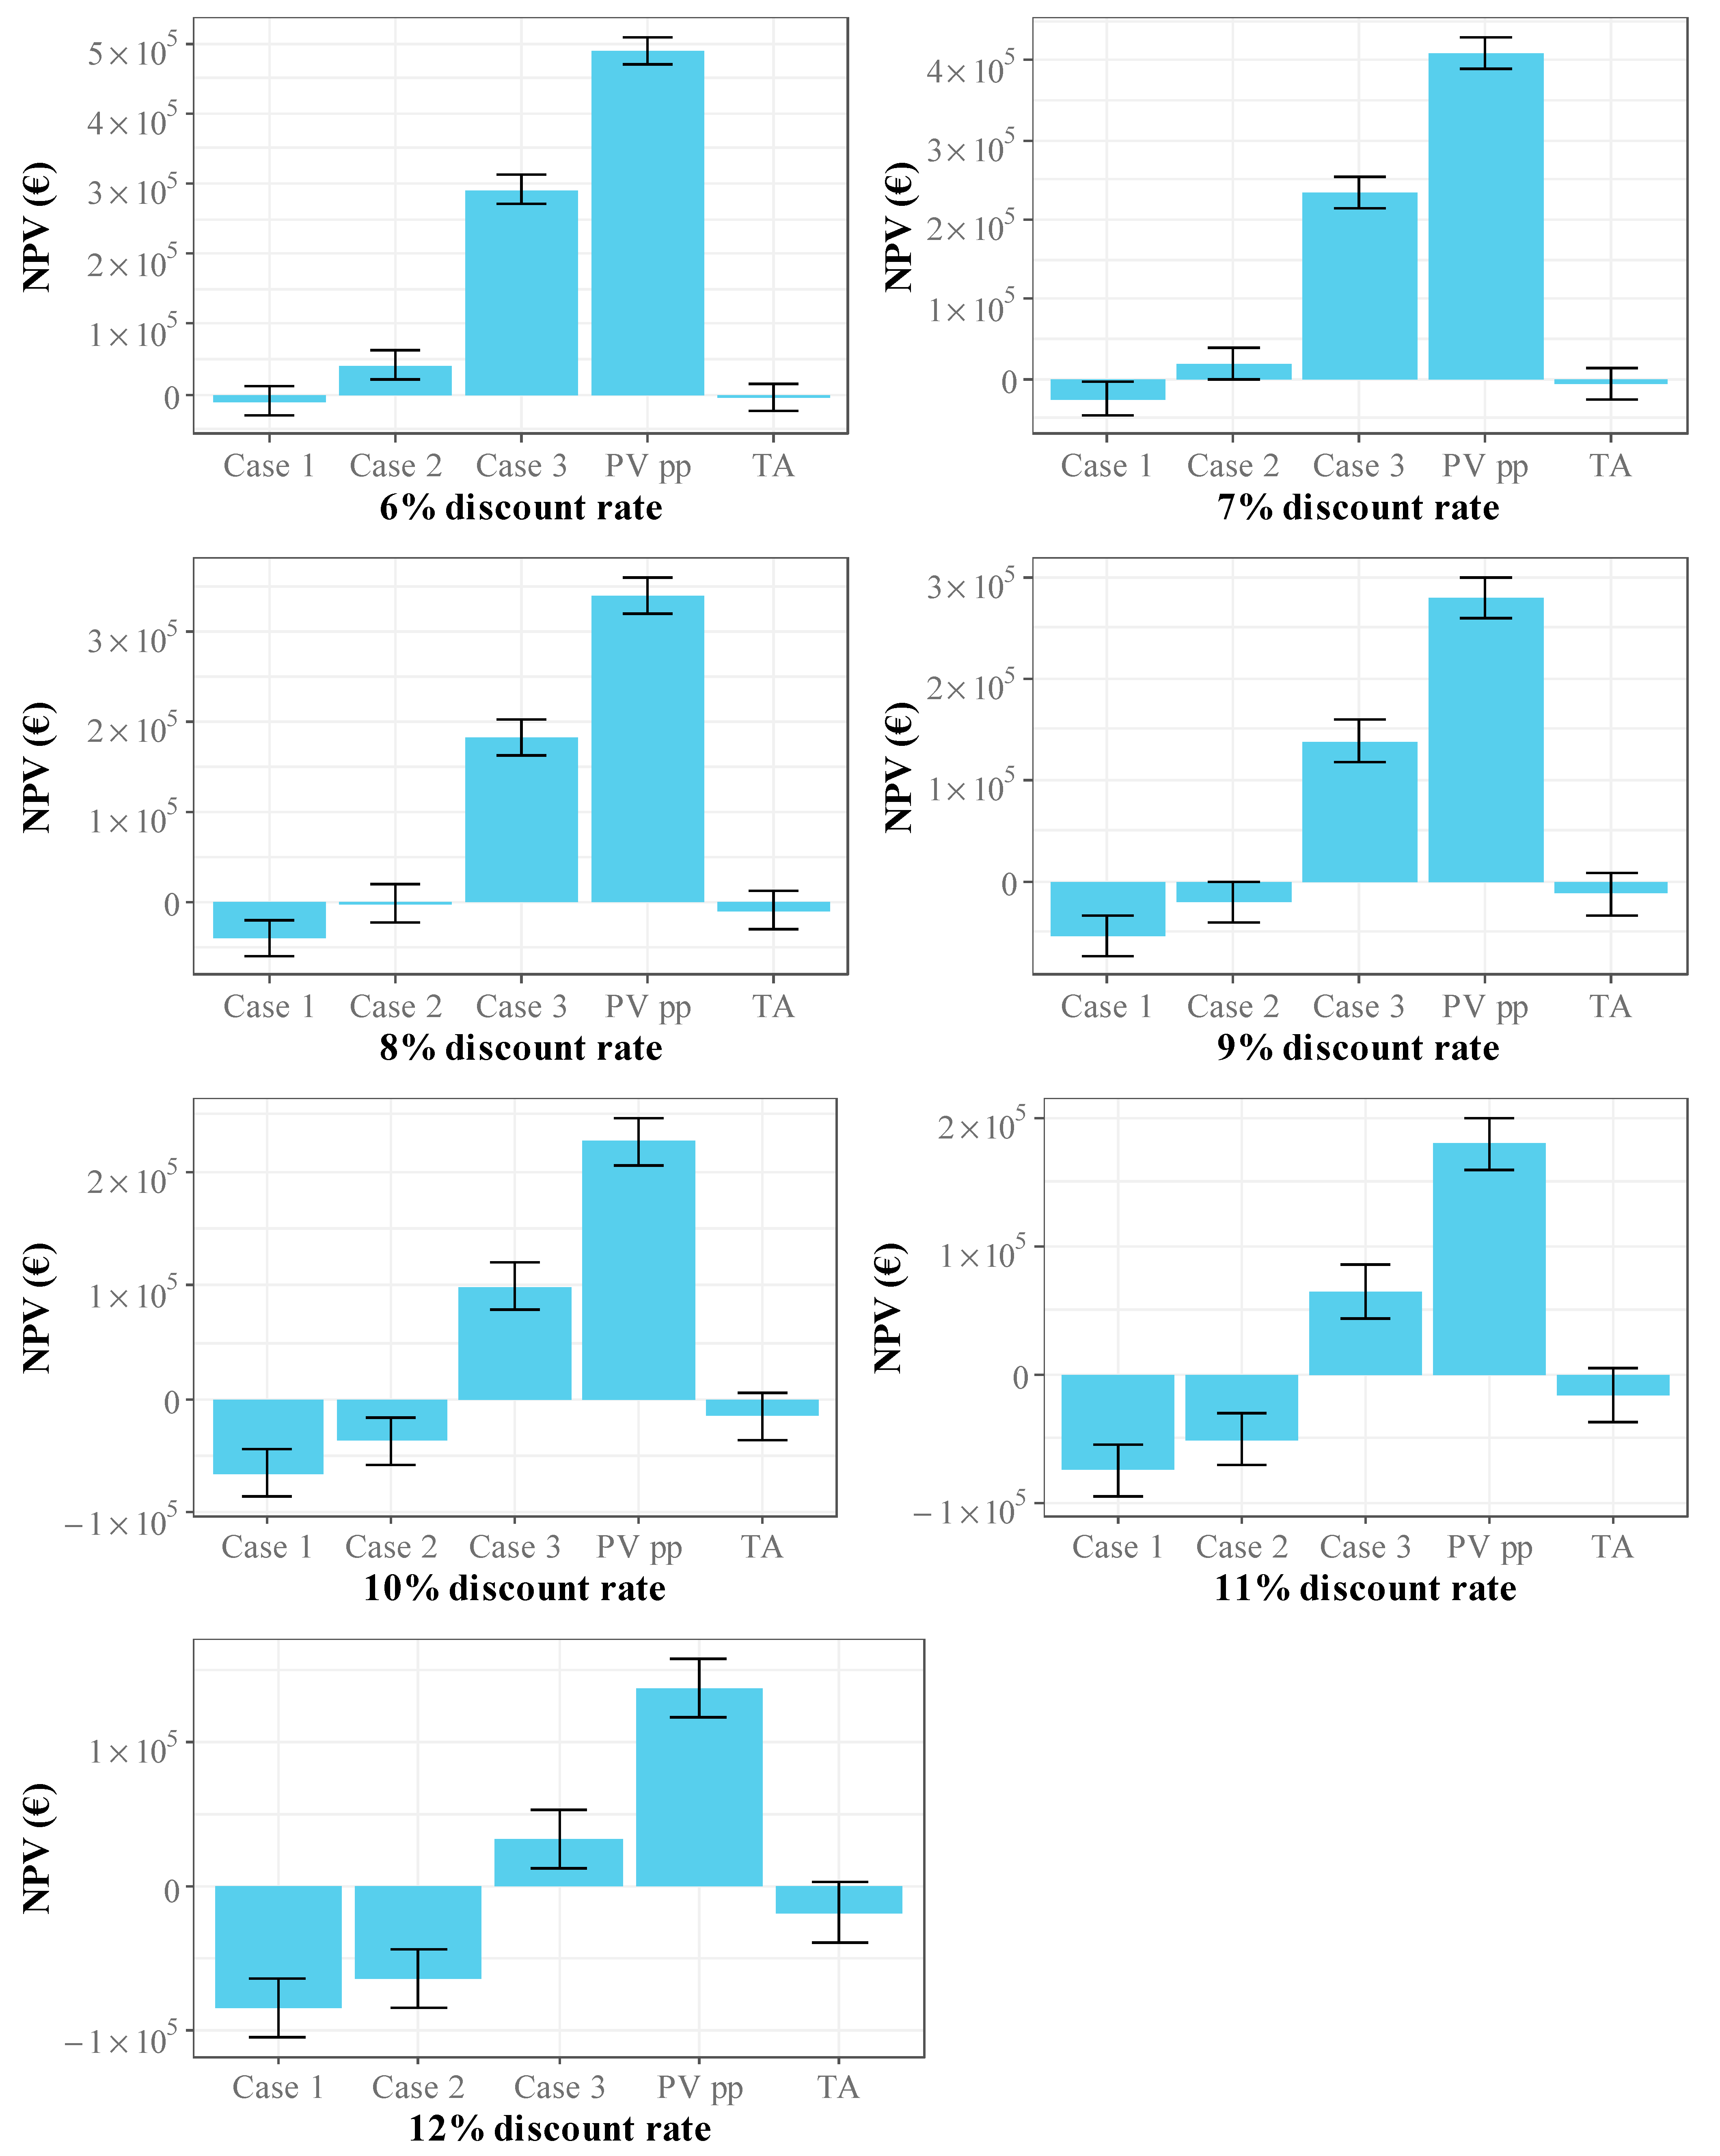
Figure 7 shows the average NPV based on land price for the systems studied with different discount rates. As shown in
Figure 6, the average NPV decreases as the discount rate increases. Thus, the average NPV is EUR −4137 for traditional agriculture, EUR −8935 for Case EUR 141,585 for Case 2, EUR 291,925 for Case 3, and EUR 488,904 for the PV power plant, with a standard error of approximately EUR 20,000. This shows that the cost of land can have a significant impact on the profitability of the system, especially agricultural production systems and low-density agrivoltaics systems characterized by low energy production, as observed in Case 1.
3.3. Life Cycle Cost
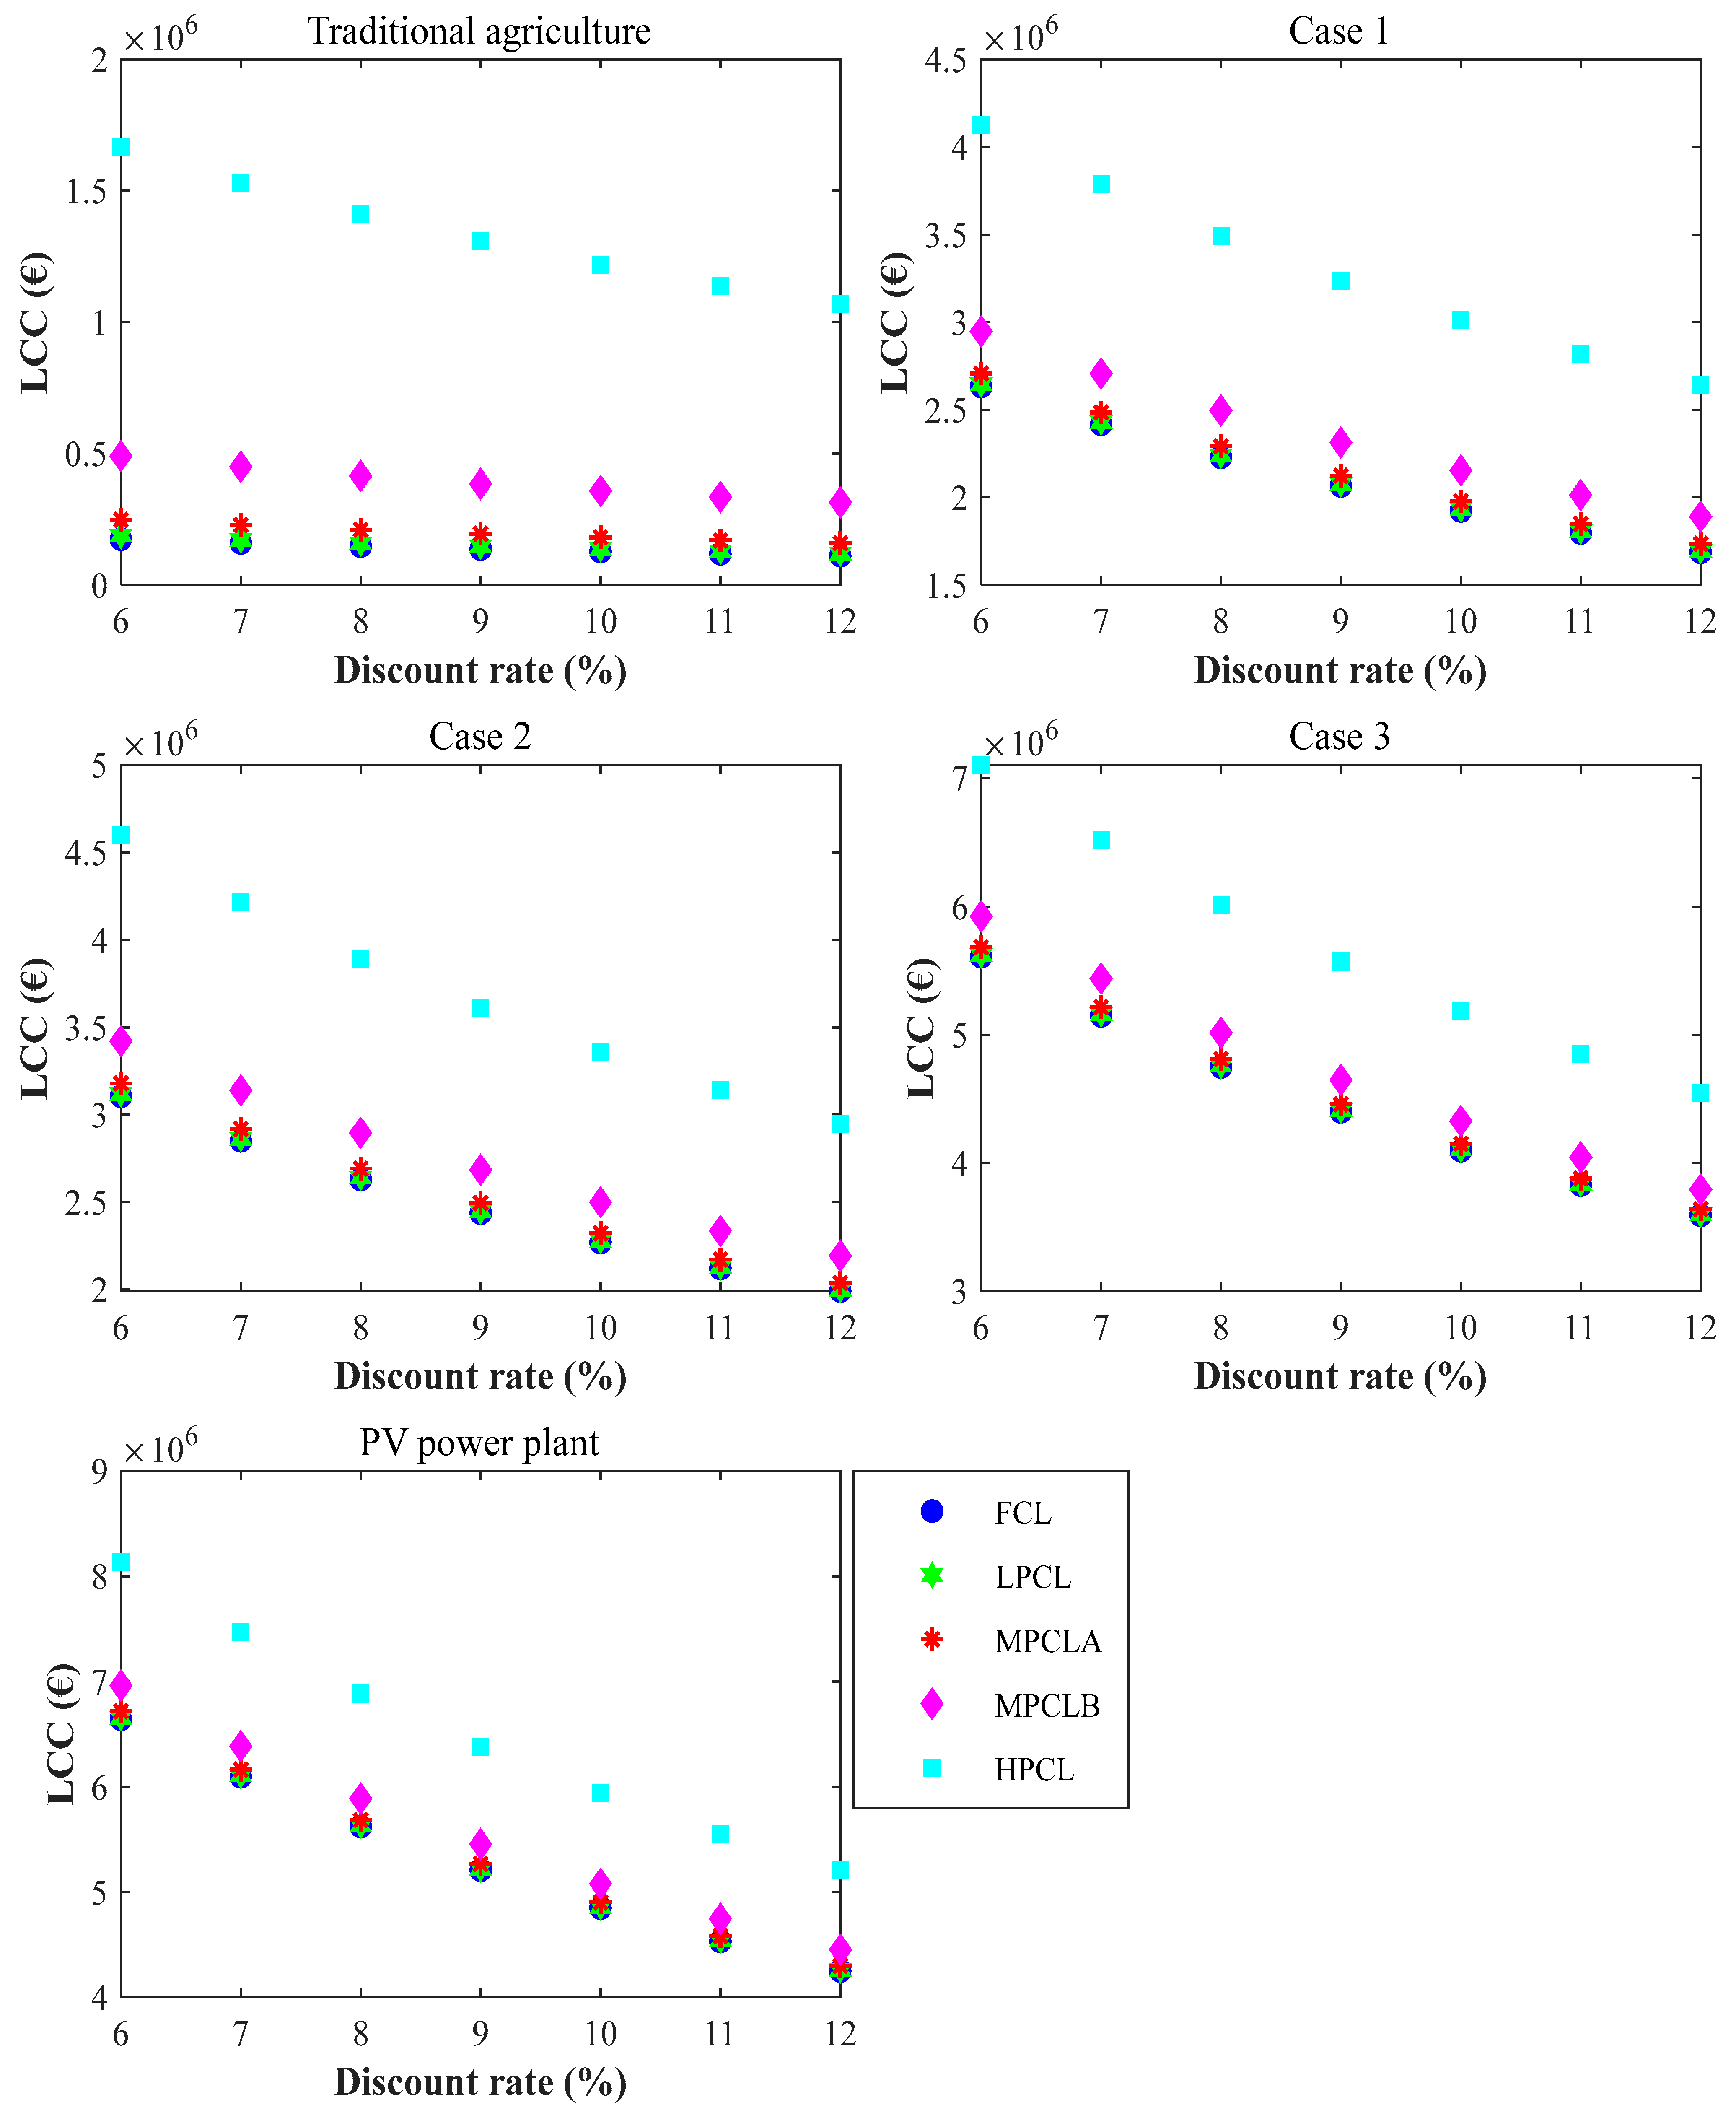
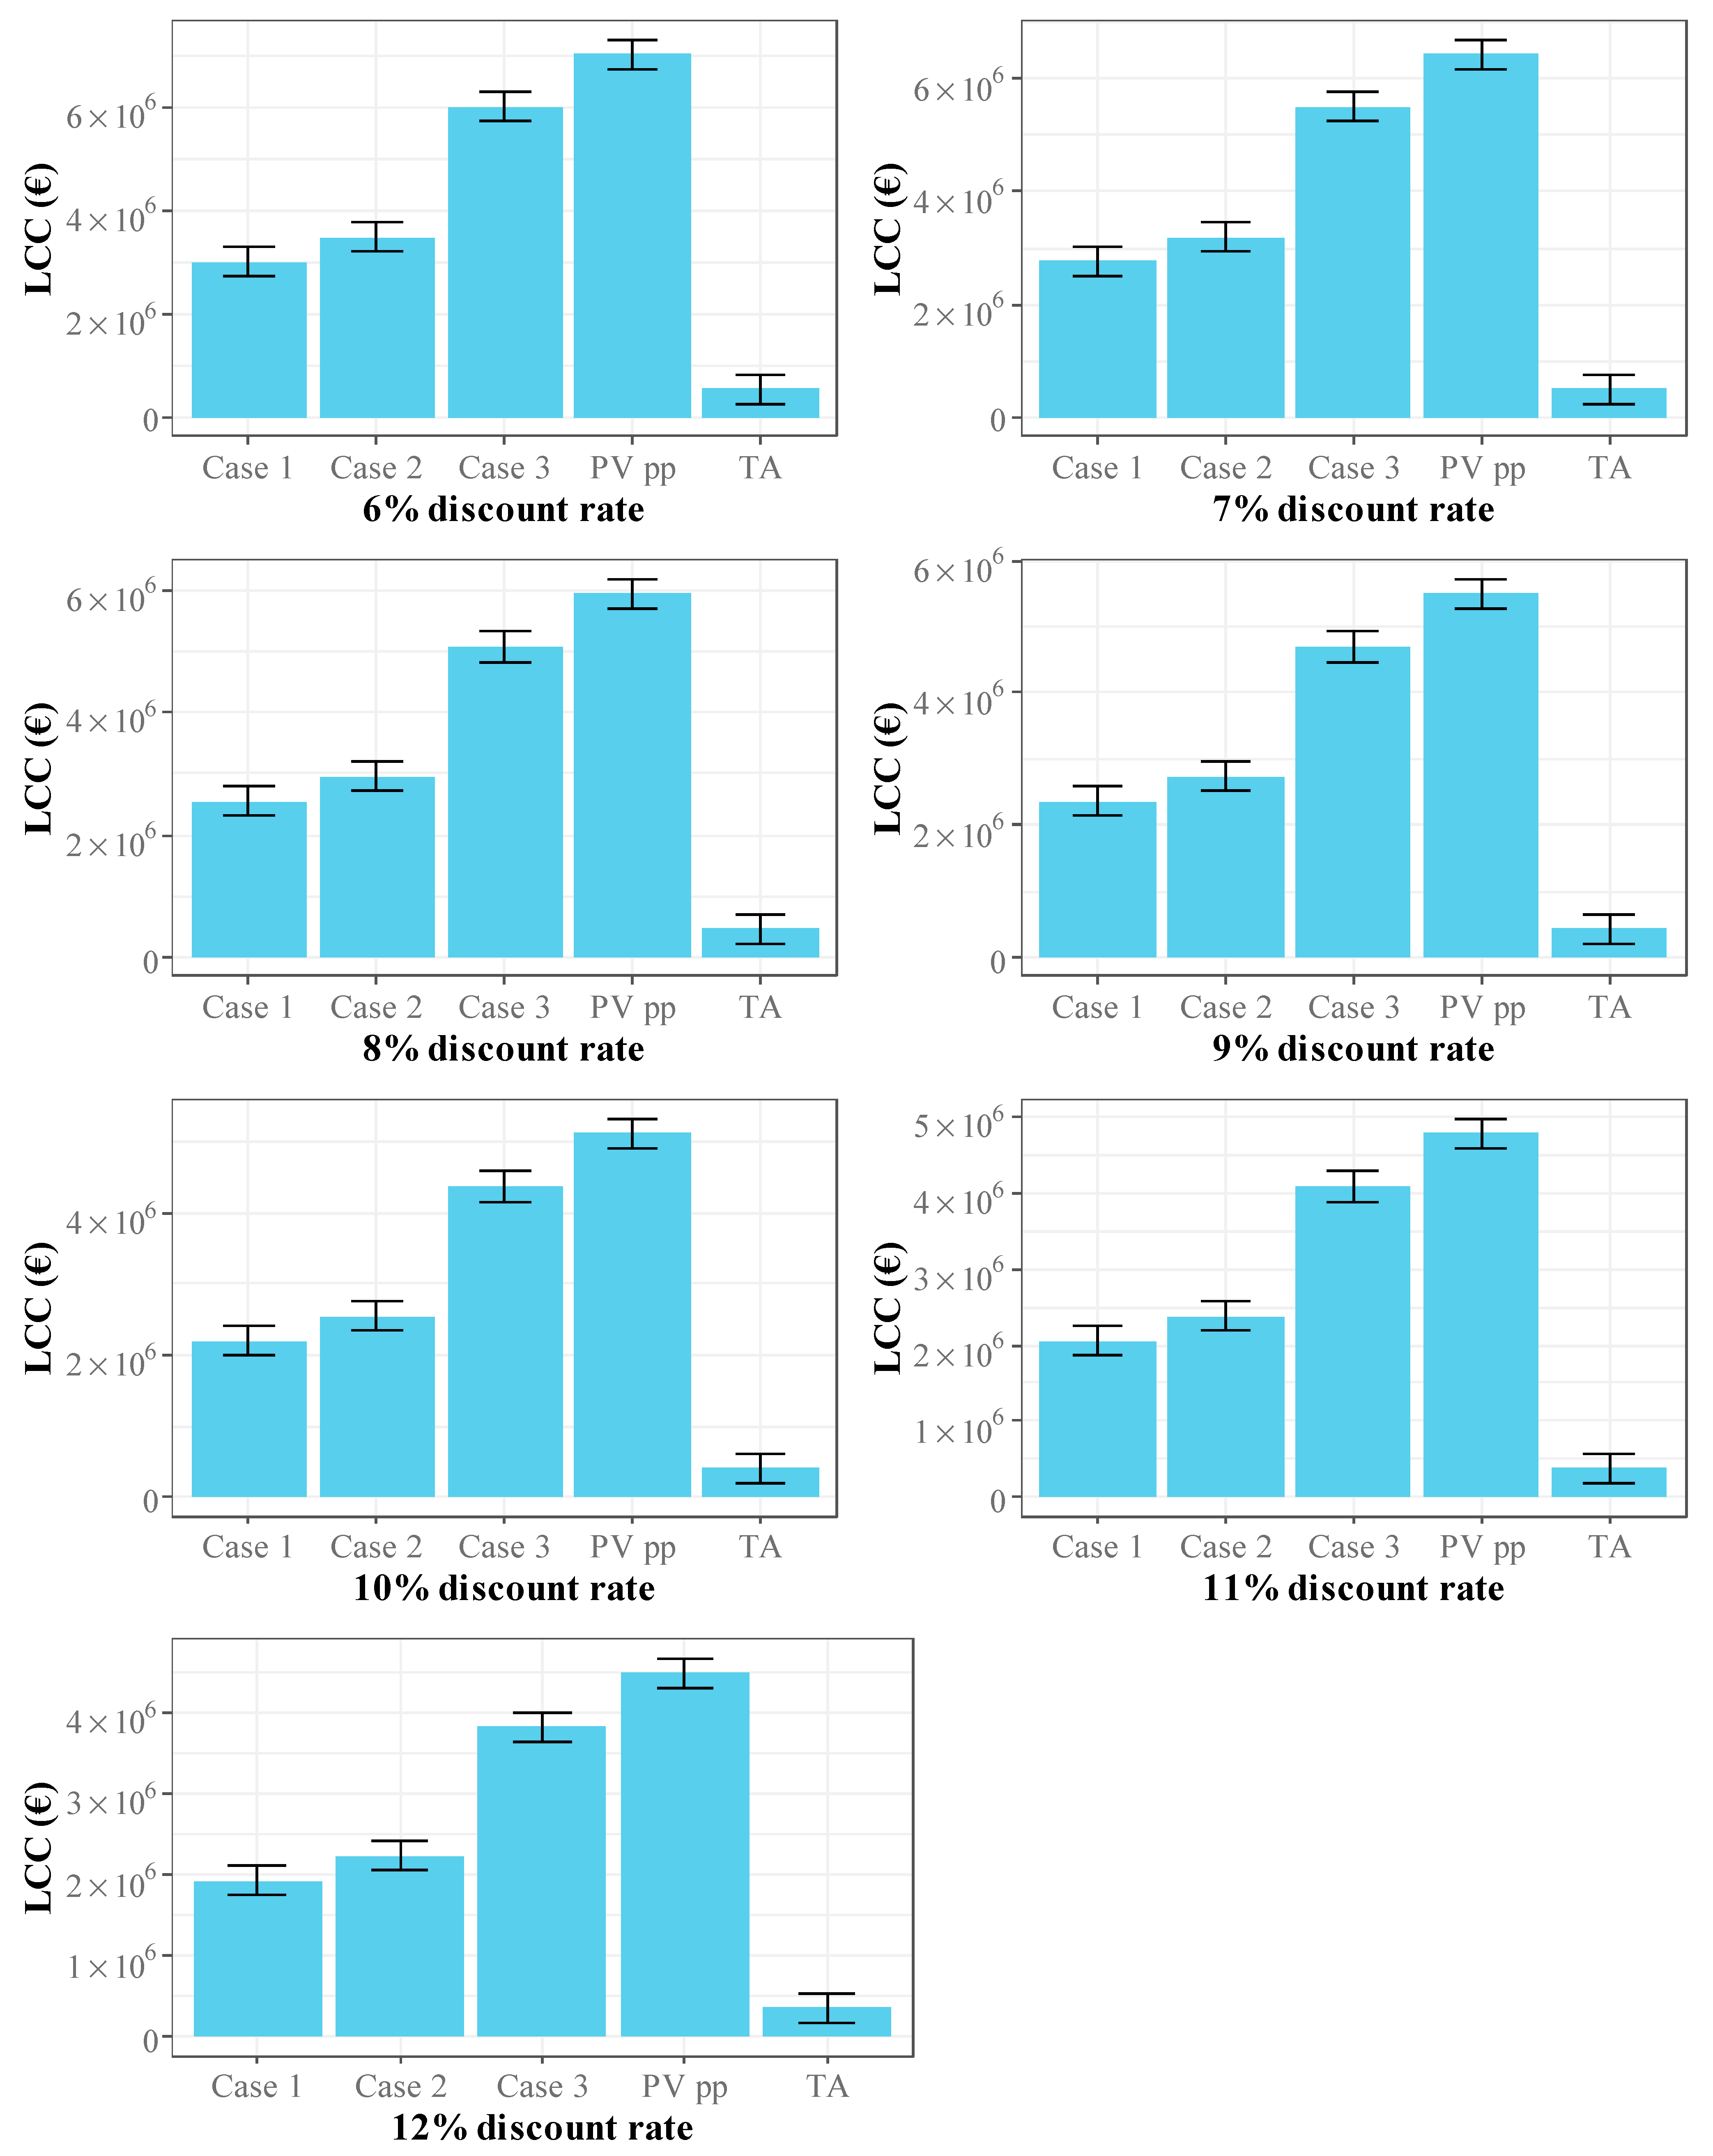
Figure 8 shows the variation in life cycle cost when the discount rate varies between 6% and 12% for traditional agriculture, agrivoltaics systems, and the PV power plant for the FCL, LPCL, MPCLA, MPCLB, and HPCL scenarios.
The results in the figure show a higher life cycle cost for the HPCL scenario in all cases compared to the other scenarios, which is more pronounced in the case of traditional agriculture and can be explained by the very high cost of land.
For traditional agriculture, the FCL generated a life cycle cost ranging from UER 175,308.05 to EUR 112,474.31 when the discount rate varied between 6% and 12%. The HPCL scenario, which recorded the highest life cycle cost, resulted in an 851% increase in cost compared to the FCL scenario. Thus, this cost was EUR 1,667,202.04, EUR 1,530,547.38, EUR 1,412,153.21, EUR 1,309,073.54, EUR 1,218,894.84, EUR 1,139,631.87, EUR and EUR 1,069,645.11 when the discount rate was 6%, 7%, 8%, 9%, 10%, 11%, and 12%, respectively.
Case 1 generated a life cycle cost ranging from EUR 2,633,948.84 to 1,687,831.25 for the FCL scenario, EUR 2,646,556.40 and EUR 1,695,920.02 for the LPCL scenario, EUR 2,707,492.91 and EUR 1,735,015.73 for the MPCLA scenario, EUR 2,949,137.71 and EUR 1,890,050.44 for the MPCLB scenario, and between EUR 4,125,842.83 and EUR 2,645,002.06 for the HPCL scenario when the discount rate varied between 6% and 12%.
Case 2 resulted in an increase in the life cycle cost compared to Case 1 for agrivoltaics of 17.9% for the FCL scenario, 17.8% for the LPCL scenario, 17.4% for the MPCLA scenario, 16.0% for the MPCLB scenario, and 11.4% for the HPCL scenario, for all discount rates.
Case 3 of agrivoltaics also led to an increase in the life cycle cost compared to Case 1 of 113.0% for the FCL scenario, 112.4% for the LPCL scenario, 110.0% for the MPCLA scenario, 100.9% for the MPCLB scenario, and 72.1% for the HPCL scenario for all discount rates.
The PV power plant generated a life cycle cost ranging from EUR 6,644,940.31 to EUR 4,250,661.51 for the FCL scenario, EUR 6,657,547.86 and EUR 4,258,750.28 for the LPCL scenario, EUR 6,718,484.38 and EUR 4,297,845.99 for the MPCLA scenario, EUR 6,960,129.18 and EUR 4,452,880.70 for the MPCLB scenario, and between EUR 8,136,834.29 and EUR 5,207,832.32 for the HPCL scenario when the discount rate varied between 6% and 12%.
The results indicate that the photovoltaic (PV) power plant exhibits the highest life cycle cost (LCC), followed by agrivoltaic Case 3, mirroring the trend observed for investment costs. Owing to the substantial capital required for PV field installation, the PV power plant consistently recorded the greatest cost, followed successively by agrivoltaic Cases 3, 2, and 1.
Figure 9 presents the variation in average LCC as a function of land price for the systems analyzed—namely traditional agriculture, agrivoltaic Cases 1 to 3, and the PV power plant. The trend observed is consistent with that shown in
Figure 7. Under the most favorable financial conditions, characterized by a 6% discount rate, the mean LCC values were EUR 553,955 for traditional agriculture, EUR 3,012,596 for Case 1, EUR 3,484,201 for Case 2, EUR 5,989,151 for Case 3, and EUR 7,023,587 for the PV power plant, with a standard error of approximately EUR 280,000. In contrast, under the least favorable condition with a 12% discount rate, the corresponding averages were EUR 355,407, EUR 1,930,764, EUR 2,232,306, EUR 3,835,650, and EUR 4,493,594, respectively, with a standard error of about EUR 180,000.
3.4. Levelized Cost of Energy
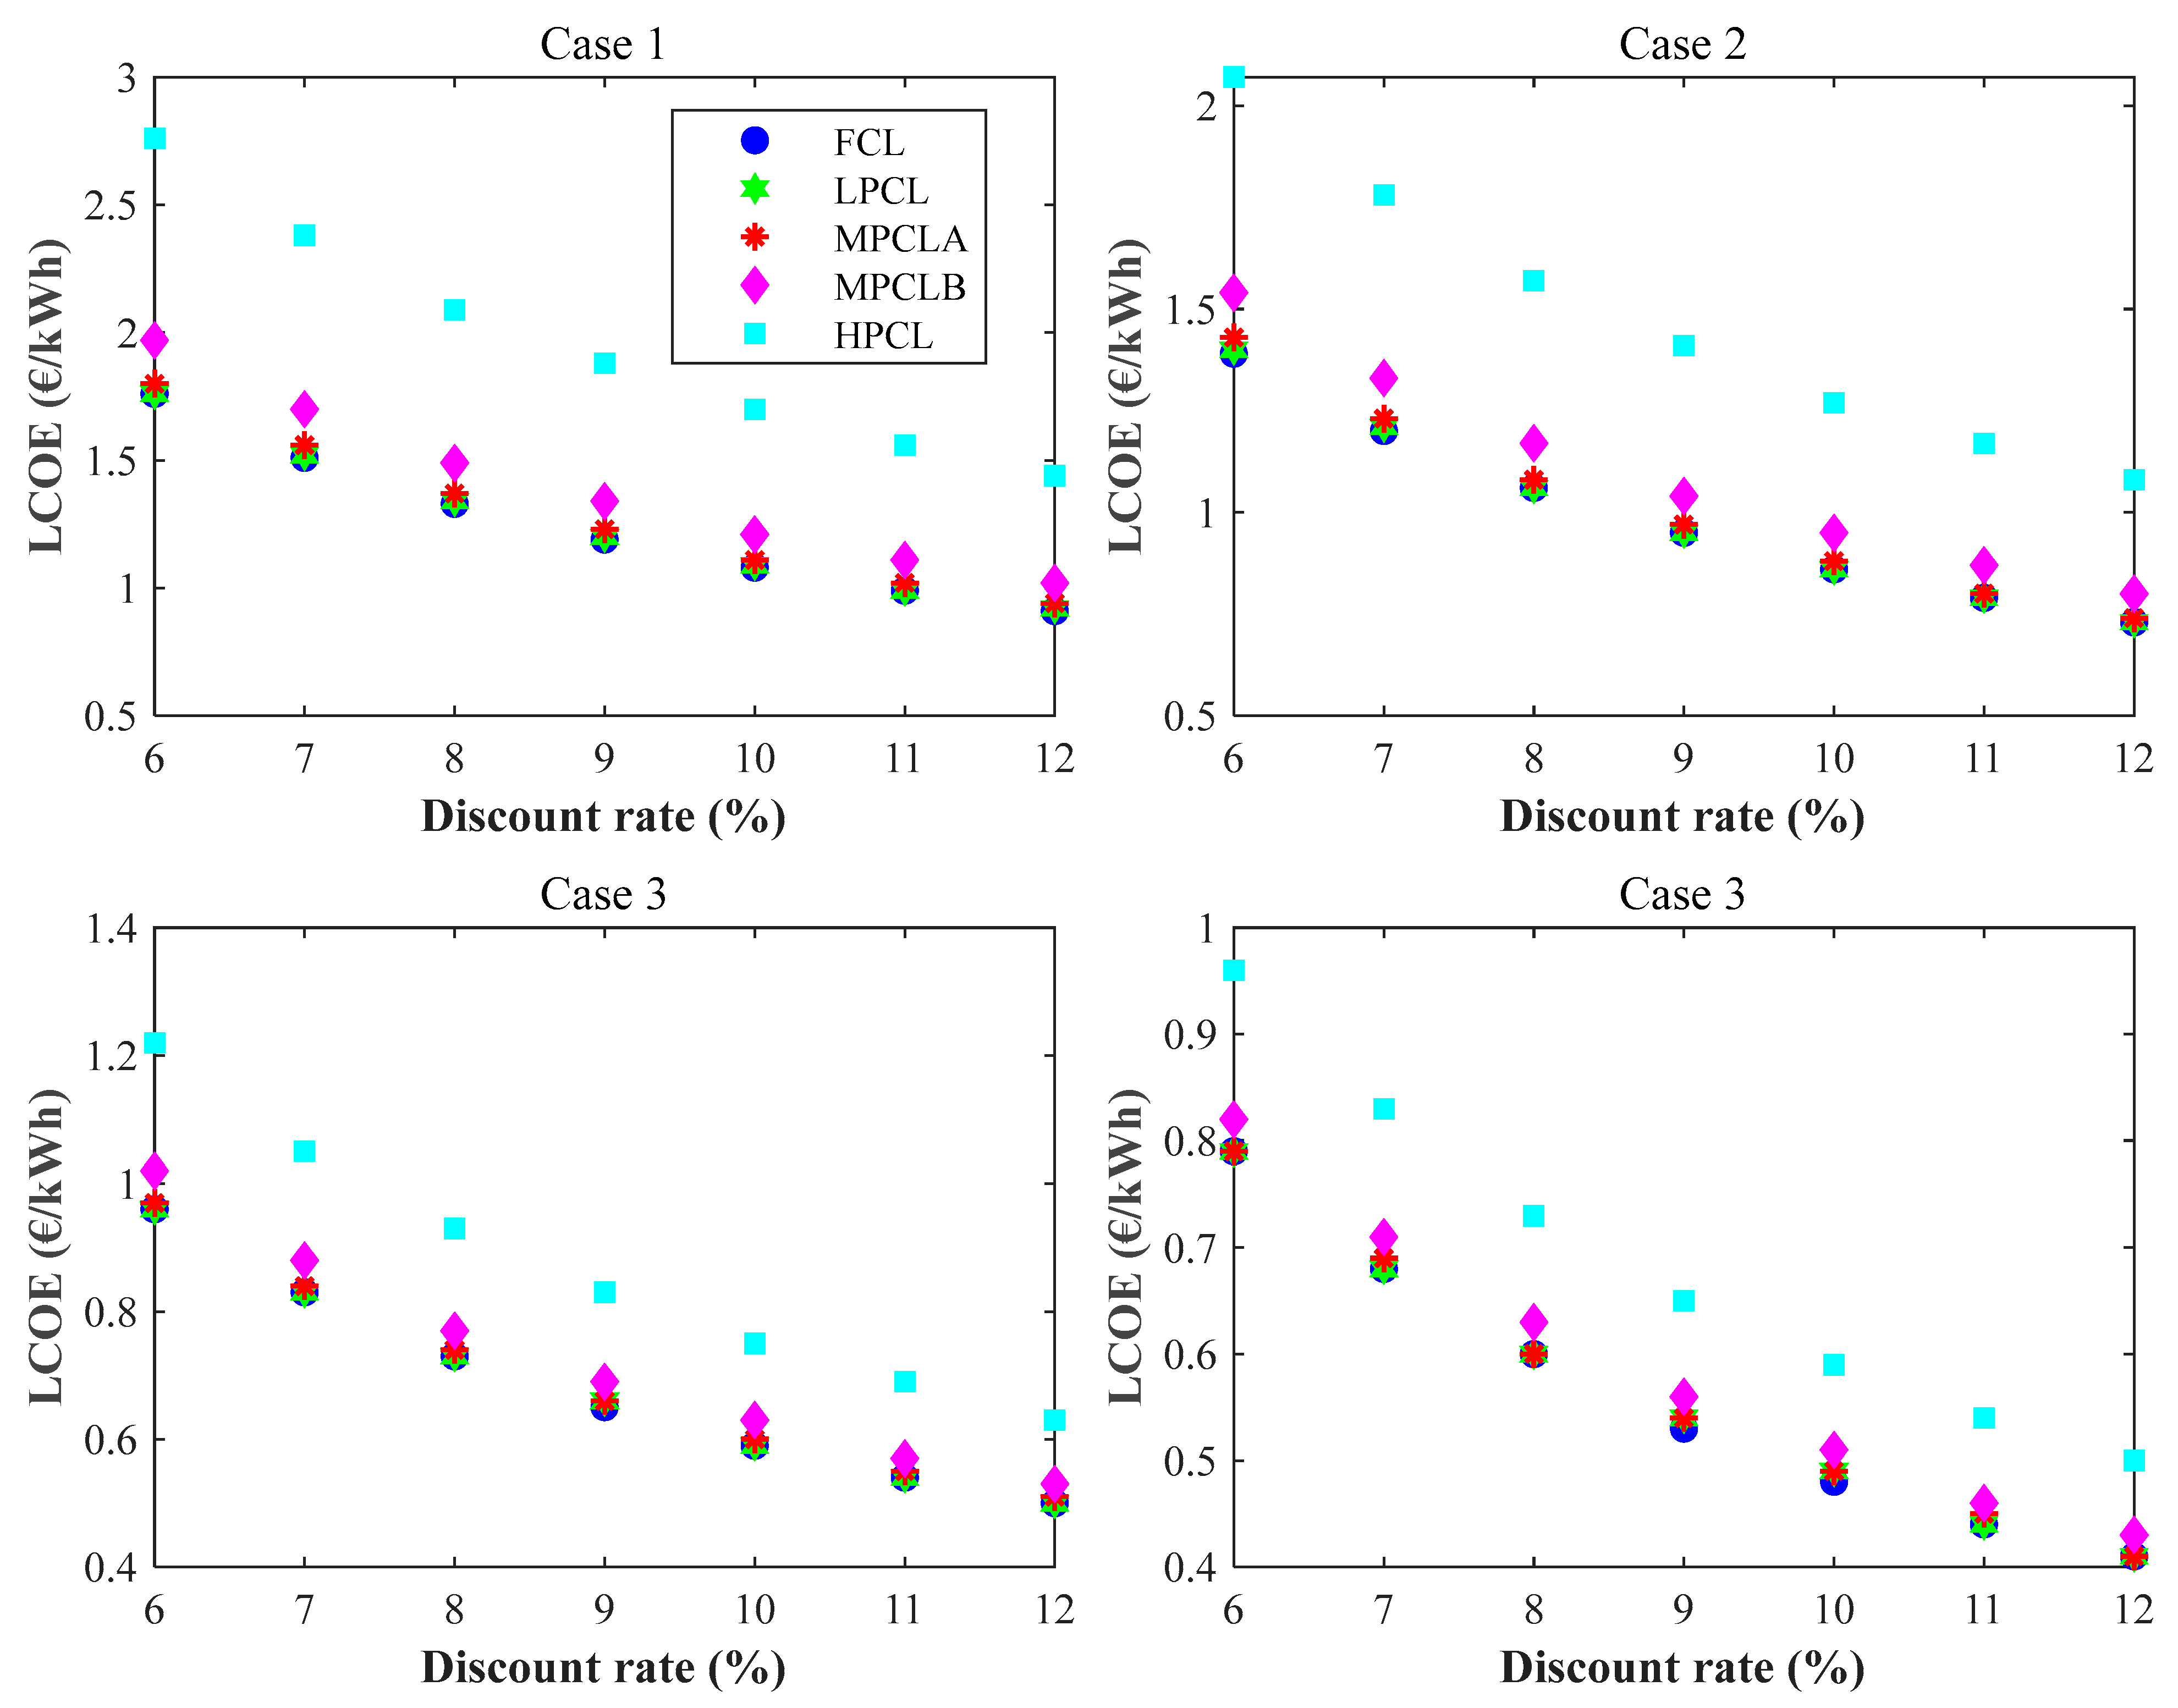
Figure 10 shows the levelized cost of energy for discount rates ranging from 6% to 12% for agrivoltaics systems and the PV power plant for the FCL, LPCL, MPCLA, MPCLB, and HPCL scenarios.
The results in
Figure 10 show that the levelized cost of energy is highest for Case 1, followed by Case 2. The PV plant had the lowest LCOE. Case 1 had an LCOE of 1.76 EUR/kWh, 1.51 EUR/kWh, 1.33 EUR/kWh, 1.19 EUR/kWh, 1.08 EUR/kWh, 0.99 EUR/kWh, and 0.91 EUR/kWh when the discount rate was 6%, 7%, 8%, 9%, 10%, 11%, and 12%, respectively, for the FCL scenario. The LCOE increased by 0.43%, 2.69%, 11.98% and 57.03% for the LPCL, MPCLA, MPCLB and HPCL scenarios, respectively, compared to the FCL scenario.
Regarding Case 2, the LCOE ranged from 1.39 EUR/kWh to 0.72 EUR/kWh for the FCL scenario, from 1.40 EUR/kWh to 0.71 EUR/kWh for the LPCL scenario, from 1.43 EUR/kWh to 0.74 EUR/kWh for the MPCLA scenario, between 1.54 EUR/kWh and 0.80 EUR/kWh for the MPCLB scenario, and between 2.07 EUR/kWh and 1.08 EUR/kWh for the HPCL scenario when the discount rate varied between 6% and 12%.
In Case 3, the LCOE varied between 0.96 CFA EUR/kWh and 0.50 CFA EUR/kWh for the FCL scenario for a discount rate varying between 6% and 12%. For the same variation in the discount rate, the LCOE varied between 0.96 EUR/kWh and 0.50 EUR/kWh for the LPCL scenario, between 0.97 EUR/kWh and 0.51 EUR/kWh for the MPCLA scenario, between 1.02 EUR/kWh and 0.53 EUR/kWh for the MPCLB scenario, and between 1.22 EUR/kWh and 0.63 EUR/kWh for the HPCL scenario.
For the PV plant that produced the lowest LCOE values, the values ranged from 0.79 EUR/kWh to 0.41 EUR/kWh for the FCL scenario, with a discount rate varying between 6% and 12%. Compared to the FCL scenario, the LCOE increased by 0.19%, 1.11%, 4.75%, and 22.46% for the LPCL, MPCLA, MPCLB, and HPCL scenarios, respectively.
The markedly higher levelized cost of energy (LCOE) observed for Cases 1 and 2 results from their elevated investment and life cycle costs combined with their relatively low revenues, as these configurations produce less energy than agrivoltaic Case 3 and the PV power plant. This reduced energy generation stems from the wider spacing between panel tables and between successive rows, which decreases the total number of installed panels and thus the overall power output. Gautam et al. [
27] reported that agrivoltaic systems can reduce LCOE by up to 55% compared with conventional ground-mounted PV systems; however, their comparison was based on systems with identical installed capacities.
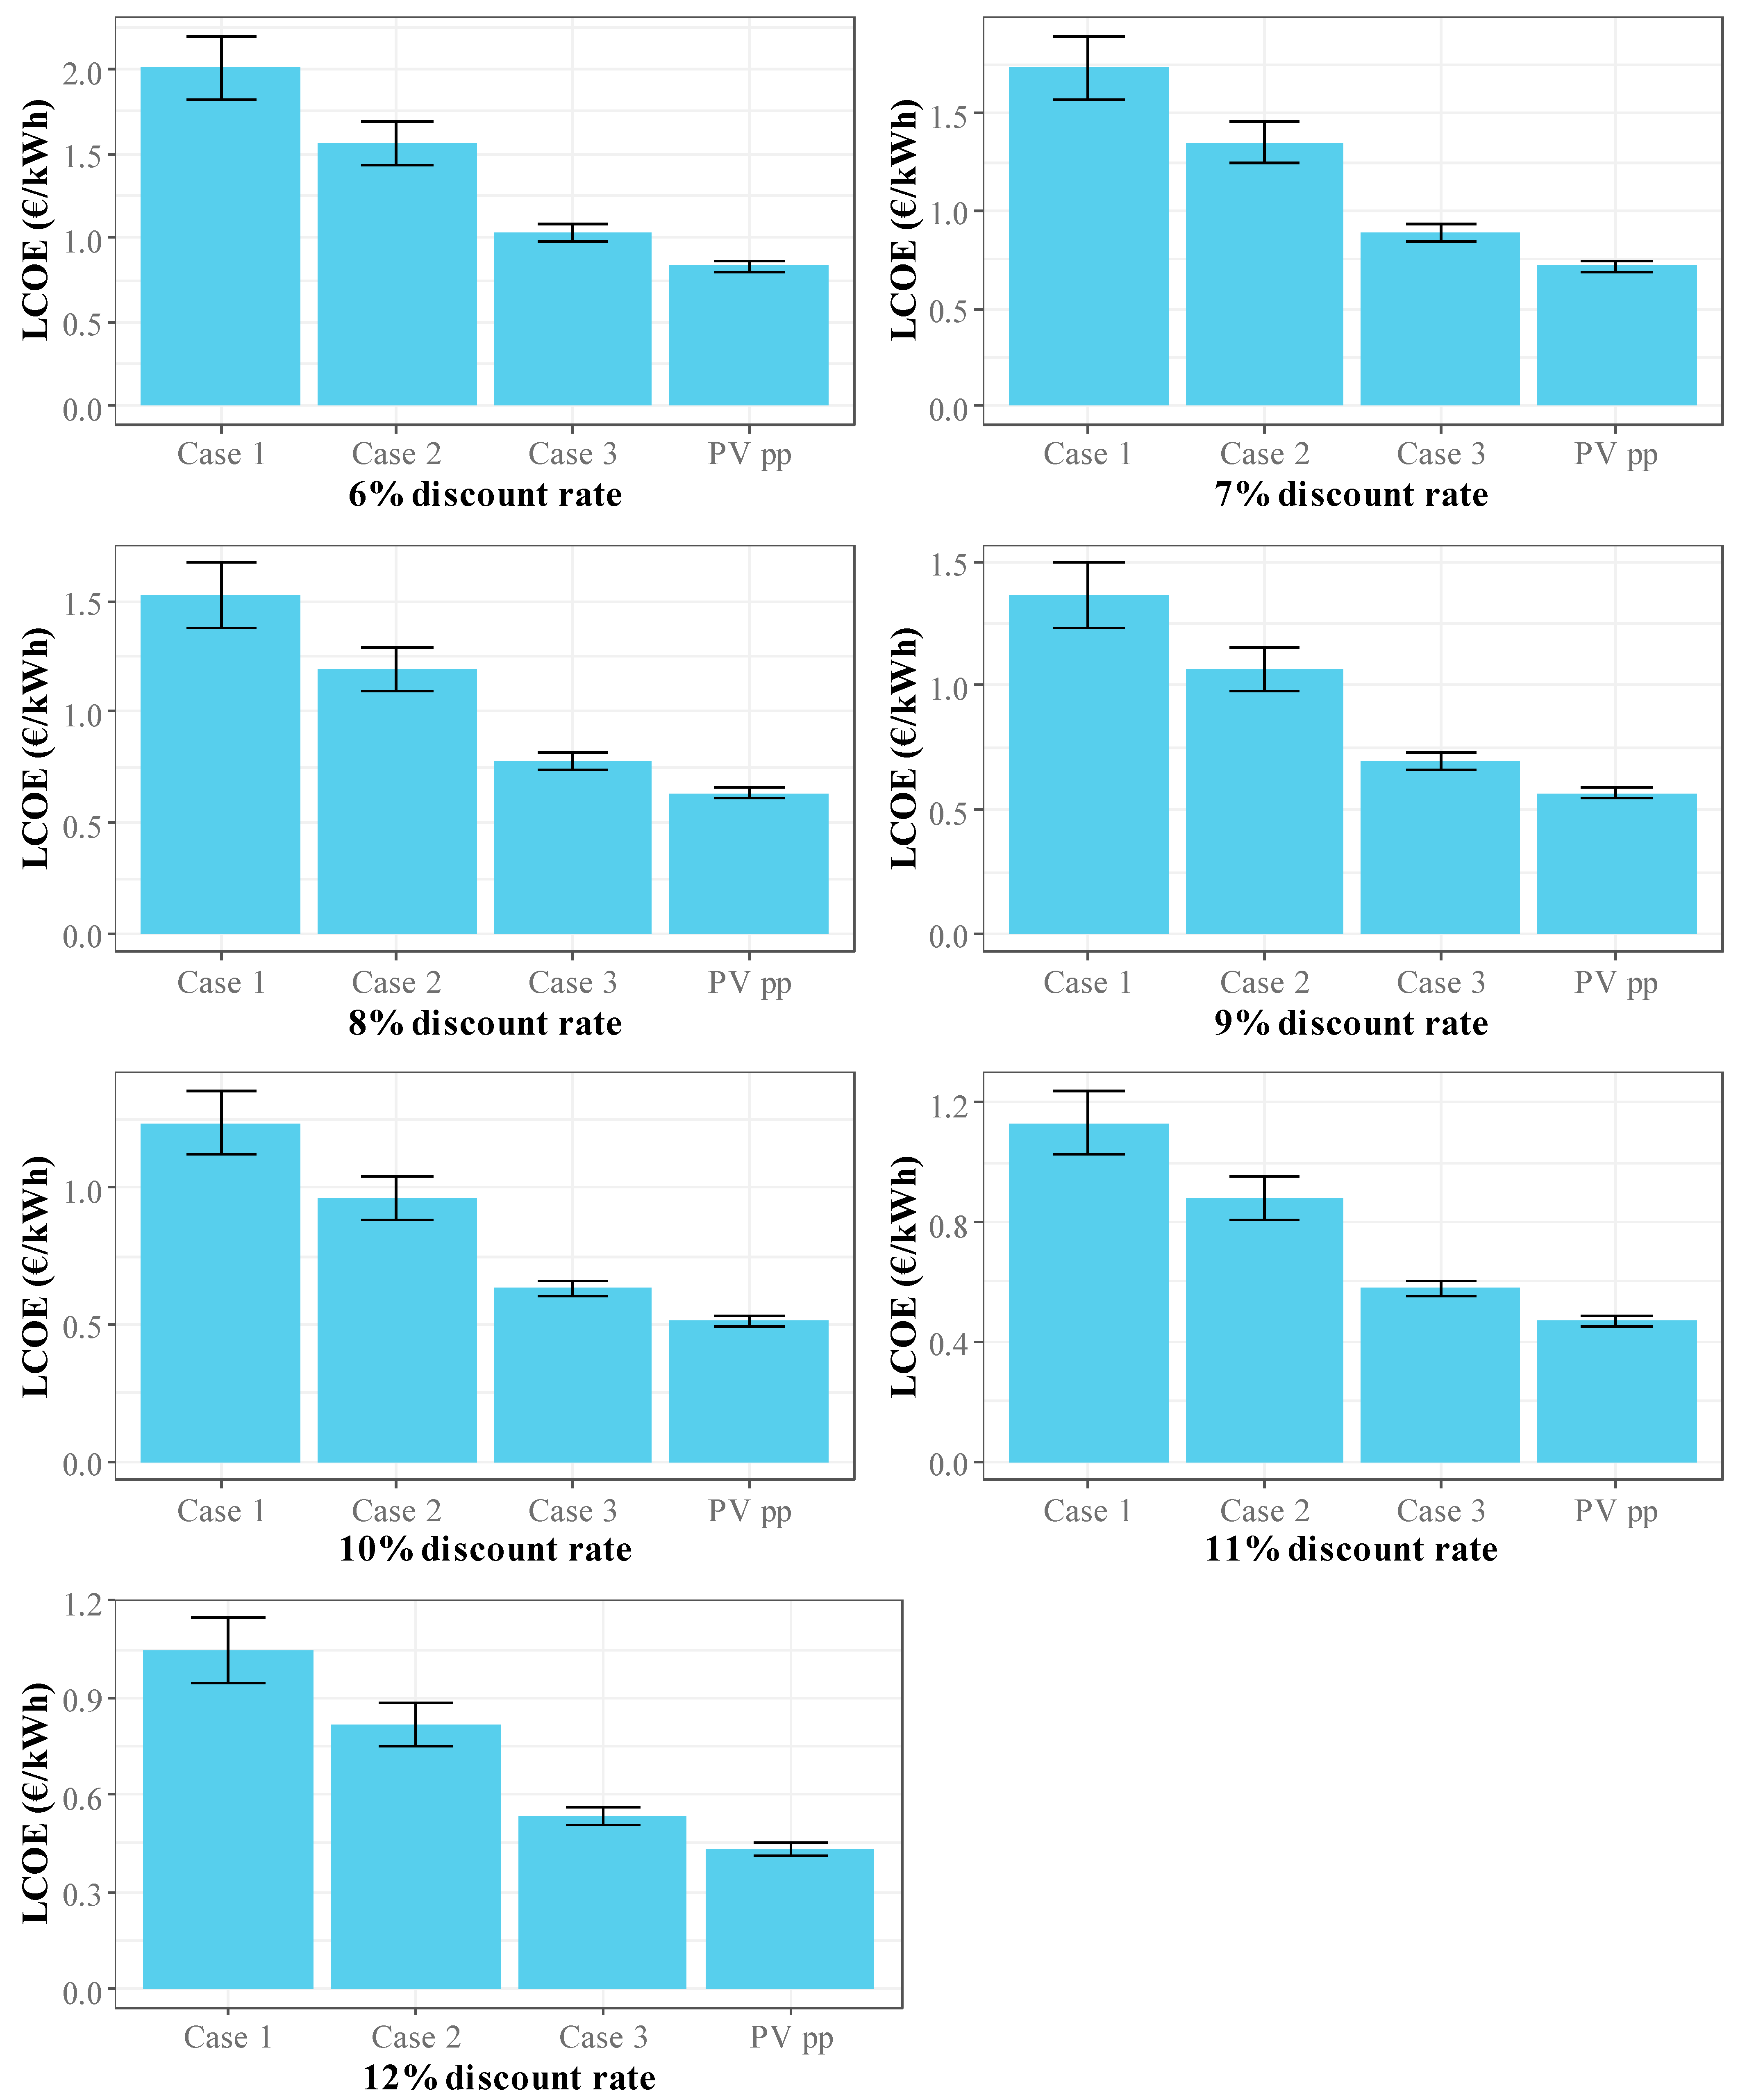
Figure 11 illustrates the relationship between average LCOE and land price for the systems analyzed—Cases 1 to 3 and the PV power plant. Under the favorable scenario with a 6% discount rate, the mean LCOE values are EUR 2.01/kWh for Case 1, EUR 1.57/kWh for Case 2, EUR 1.03/kWh for Case 3, and EUR 0.83/kWh for the PV power plant, with corresponding standard errors of 0.19, 0.13, 0.05, and 0.03, respectively. In the least favorable scenario, where the discount rate increases to 12%, the average LCOE decreases to EUR 1.05/kWh (standard error 0.10), EUR 0.82/kWh (0.07), EUR 0.54/kWh (0.03), and EUR 0.43/kWh (0.02) for Cases 1, 2, 3, and the PV power plant, respectively.
3.5. Profitability Index
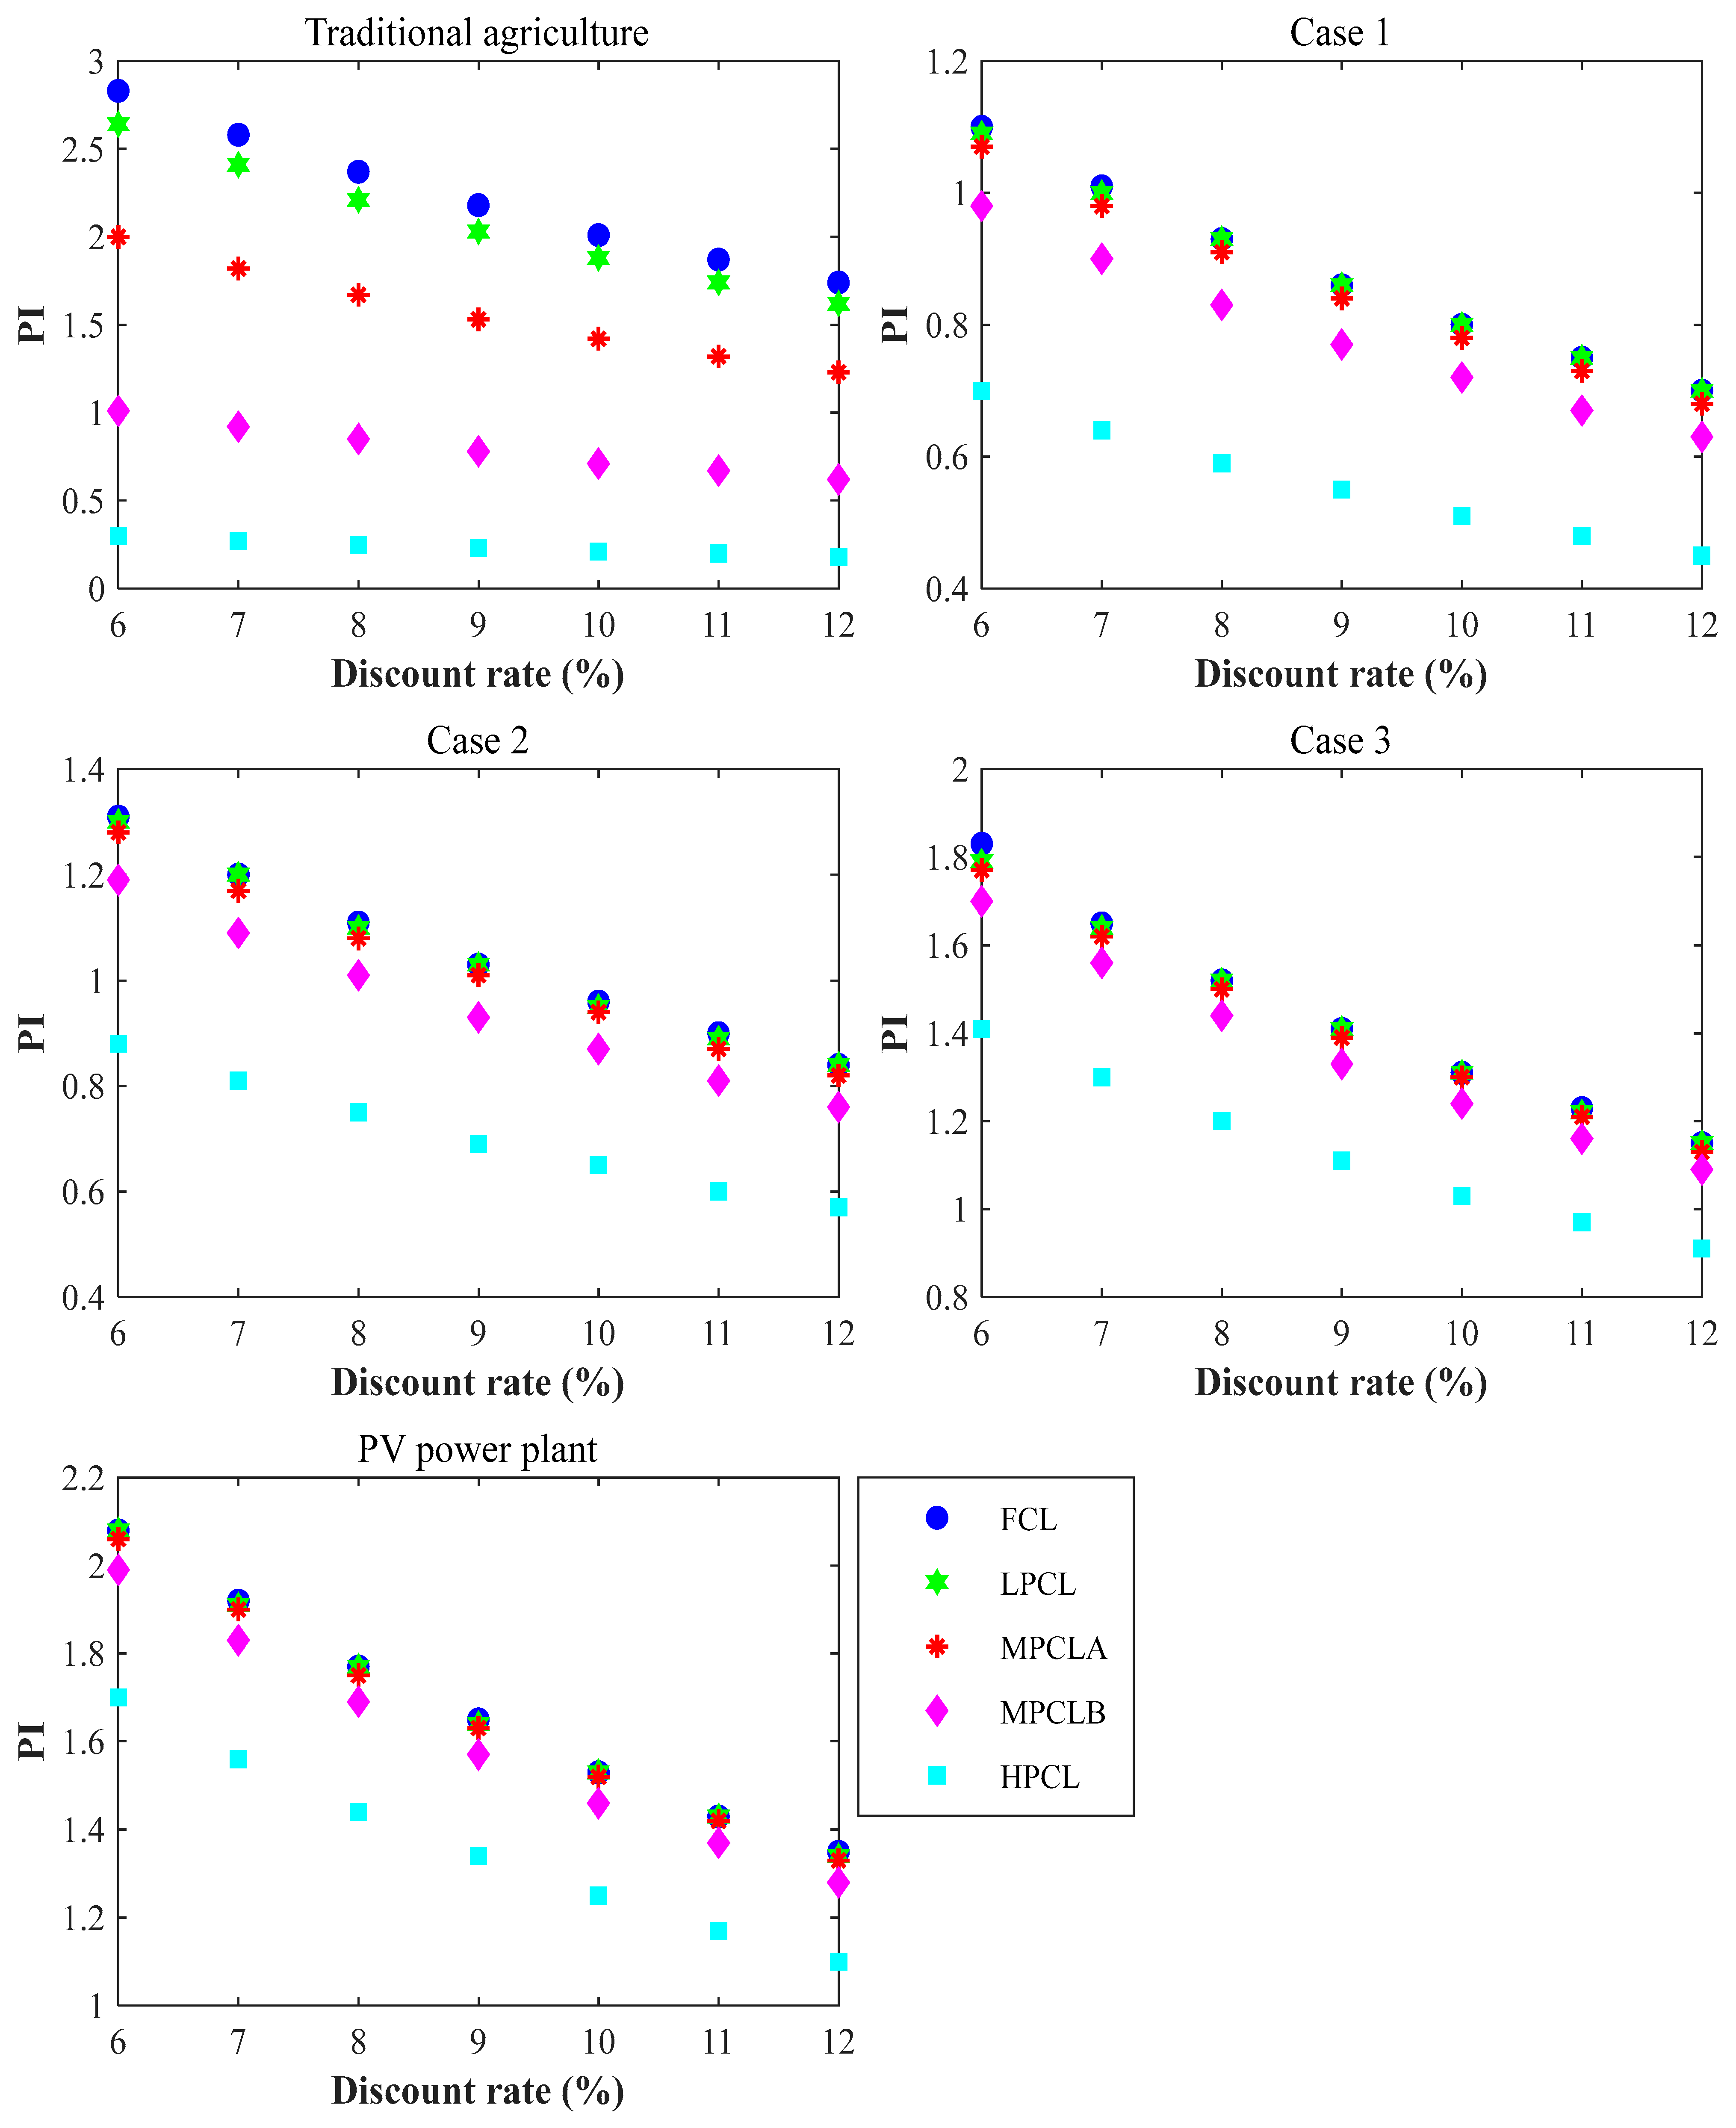
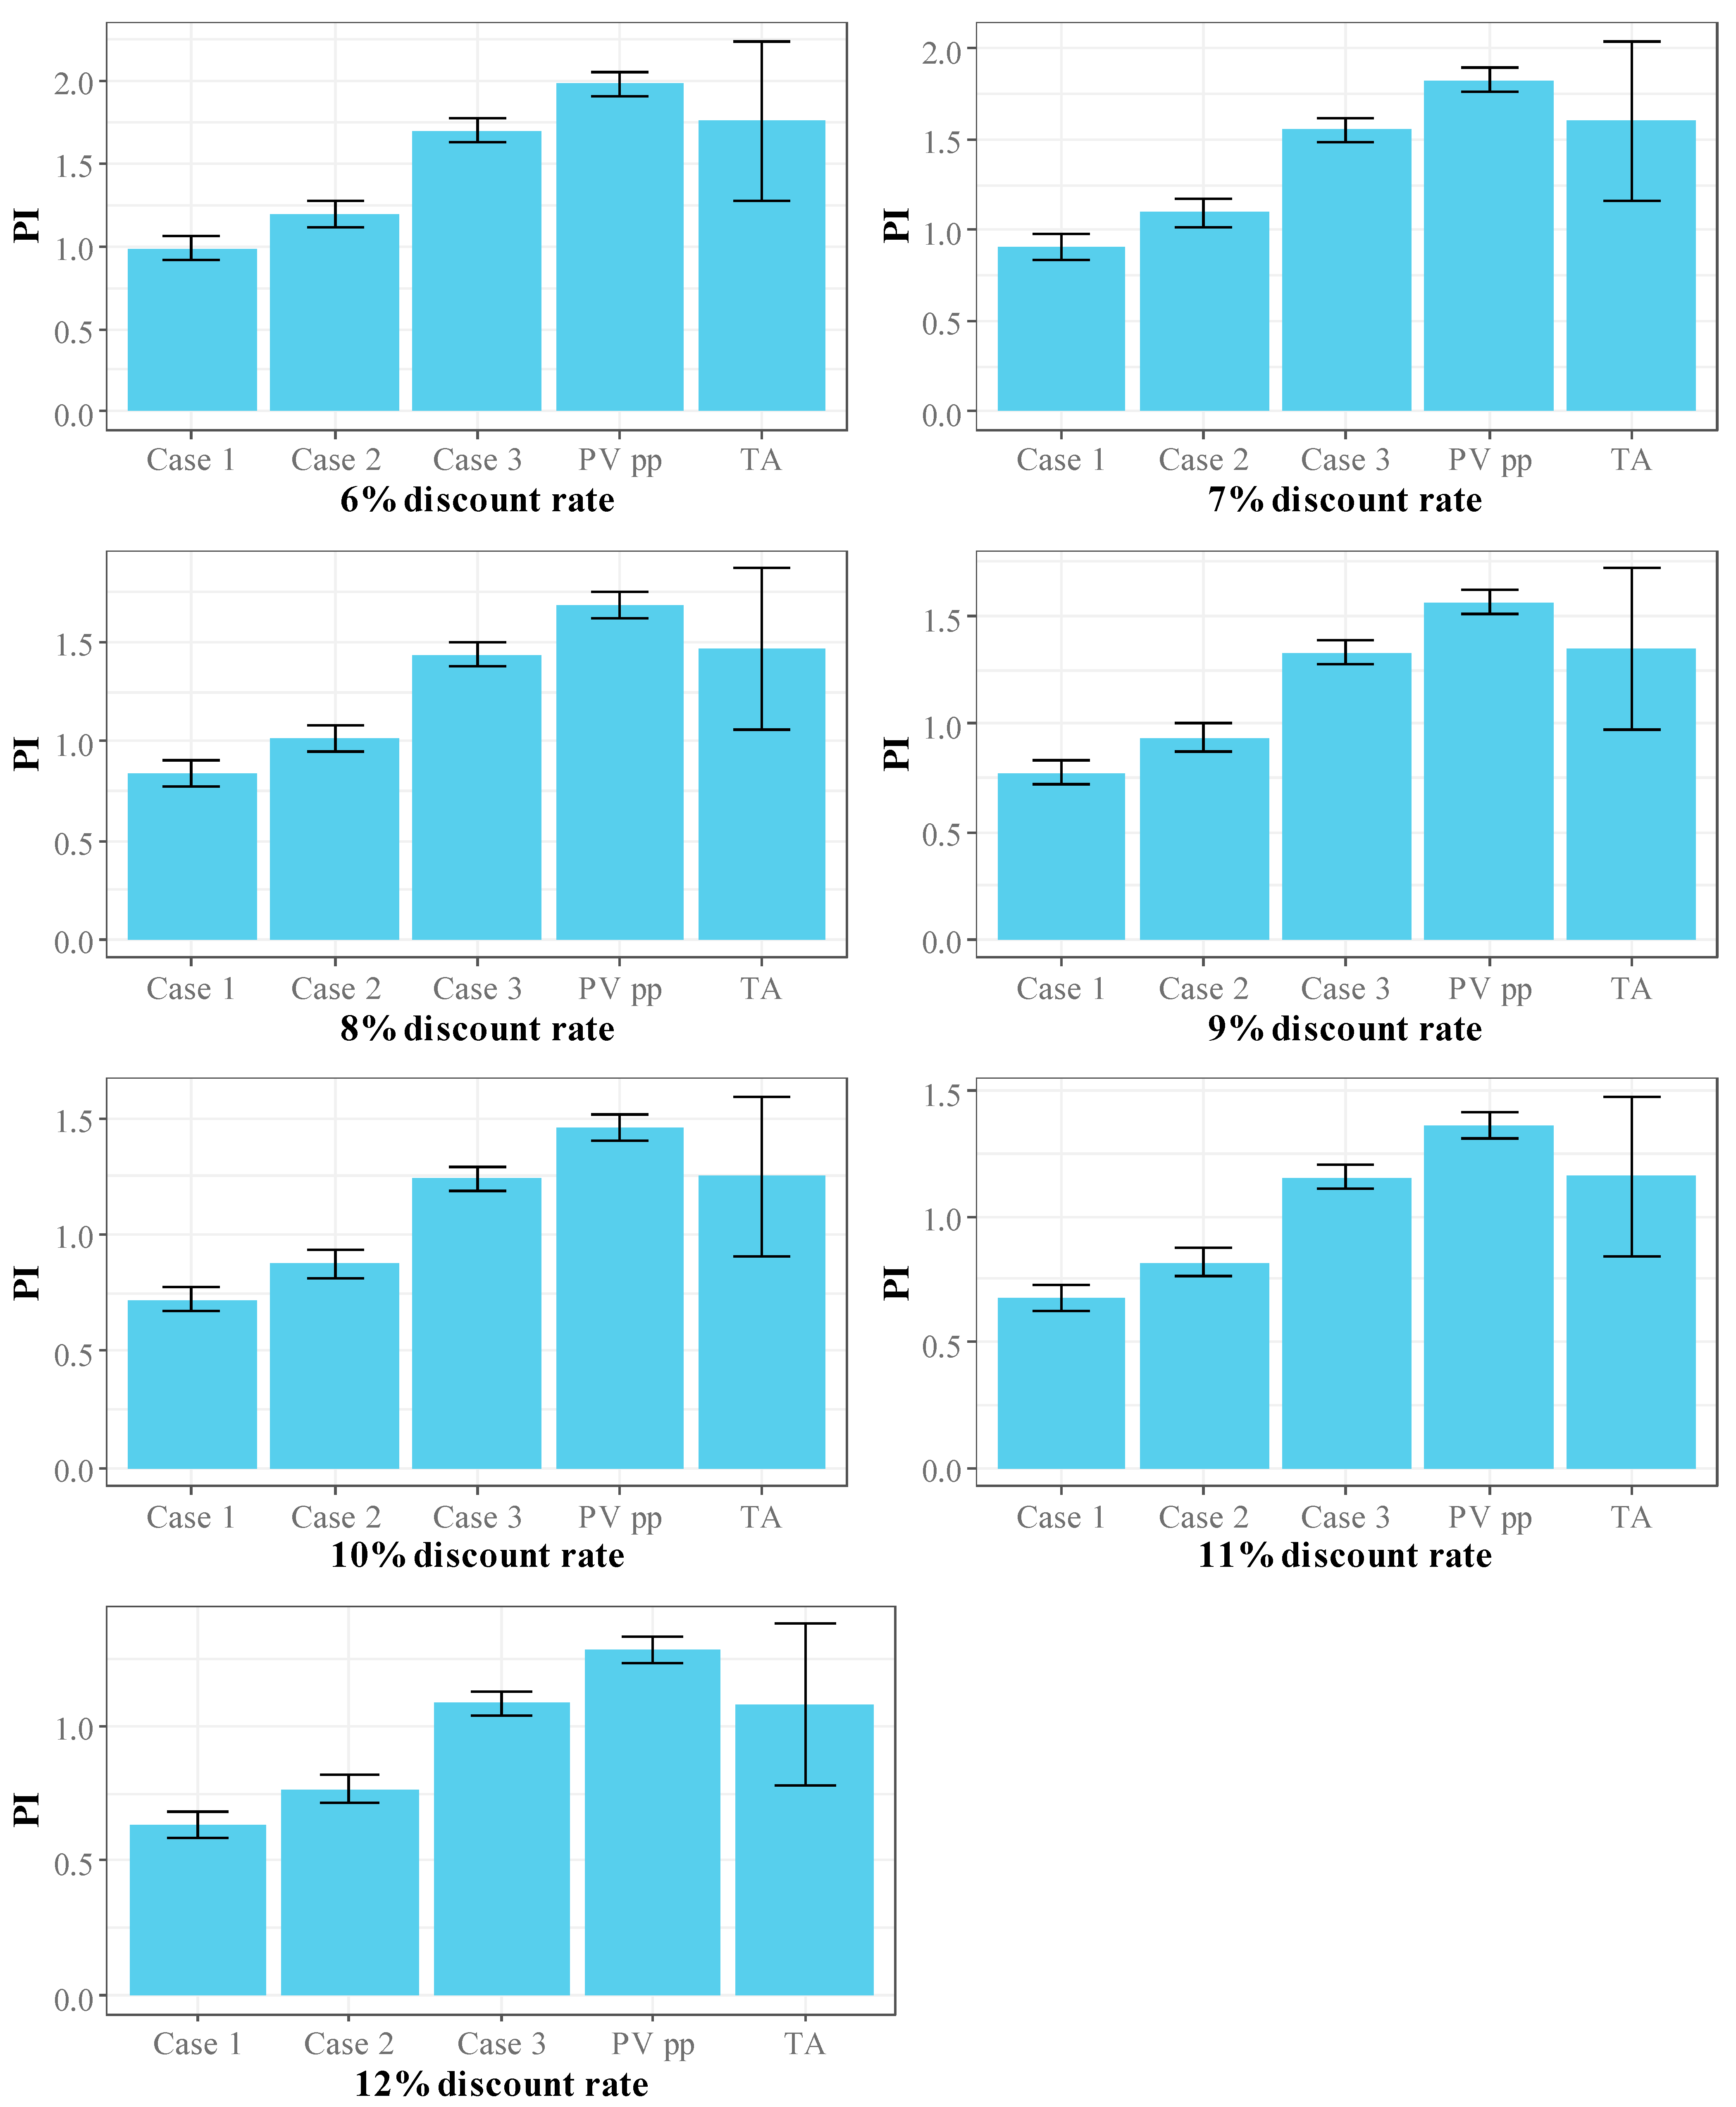
Figure 12 shows the variation in the Profitability Index for discount rates ranging from 6% to 12% for traditional agriculture, agrivoltaics systems, and the PV power plant for the FCL, LPCL, MPCLA, MPCLB, and HPCL scenarios.
The results in
Figure 12 show that the Profitability Index is highest for traditional agriculture, followed by the PV plant and Case 3 for the FCL scenario. However, the lowest values are also obtained in the case of traditional agriculture with the HPCL scenario.
Thus, traditional agriculture yielded Profitability Indices greater than 1 for the FCL, LPCL, and MPCLA scenarios for all discount rates. However, they were less than 1 for the MPCLB and HPCL scenarios. This index varied between 2.83 and 1.74 when the discount rate varied between 6% and 12% for the FCL scenario. It varied between 2.64 and 1.62 for the LPCL scenario and between 2 and 1.23 for the MPCLA scenario.
For Case 1 of agrivoltaics, the Profitability Index was less than 1 except in five (5) cases: (i) the FCL scenario with a discount rate of 6% (1.10), (ii) the FCL scenario with a discount rate of 6% (1.01), (iii) the LPCL scenario with a discount rate of 6% (1.09), (i) the LPCL scenario with a discount rate of 6% (1), and (i) the MPCLA scenario with a discount rate of 6% (1.07). However, the PI values were very close to 1 and equal to 1 for the LPCL scenario with a discount rate of 6%.
Case 2 of agrivoltaics yielded Profitability Index values greater than 1 for the FCL scenario (between 1.31 and 1.03), LPCL (between 1.30 and 1.03) and MPCLA (between 1.28 and 1.01) scenarios when the discount rate varied between 6% and 9%, and for the MPCLB scenario (1.19 and 1.01) when the discount rate varied between 6% and 8%. However, it was less than 1 in all other cases.
For Case 3 of agrivoltaics, the Profitability Index was greater than 1 in all cases except two: (i) the HPCL scenario with a discount rate of 11% (0.97), (ii) the HPCL scenario with a discount rate of 12% (0.91). Thus, for a discount rate varying between 6% and 12%, the PI varied between 2.83 and 1.15 for the FCL scenario, between 1.79 and 1.15 for the LPCL scenario, between 1.77 and 1.13 for the MPCLA scenario, and between 1.70 and 1.09 for the MPCLB scenario.
The PV plant, on the other hand, achieved Profitability Indices greater than 1 in all cases. The lowest value was obtained by the HPCL scenario with a discount rate of 12% (1.1). For a PI varying between 6% and 12%, the PI varied between 2.08 and 1.35 for the FCL scenario, 2.08 and 1.34 for the LPCL scenario, 2.06 and 1.33 for the MPCLA scenario, and 1.99 and 1.28 for the MPCLB scenario.
The PI results corroborate those of the NPV, with a higher value for the PV plant, followed by Case 3 for agrivoltaics and traditional agriculture, especially for the FCL and LPCL scenarios.
Figure 13 presents the variation in the average profitability index (PI) as a function of land price for the systems analyzed: traditional agriculture, agrivoltaic Cases 1 to 3, and the PV power plant. Under the favorable financial scenario with a 6% discount rate, the mean PI values were 1.76 for traditional agriculture, 0.99 for Case 1, 1.19 for Case 2, 1.67 for Case 3, and 1.98 for the PV power plant, with respective standard errors of 0.48, 0.08, 0.08, 0.075, and 0.073. In the least favorable case, corresponding to a 12% discount rate, the average PI values decreased to 1.08 (standard error 0.10) for traditional agriculture, 0.63 (0.10) for Case 1, 0.78 (0.07) for Case 2, 1.09 (0.03) for Case 3, and 1.28 (0.02) for the PV power plant.
3.6. Internal Rate of Return
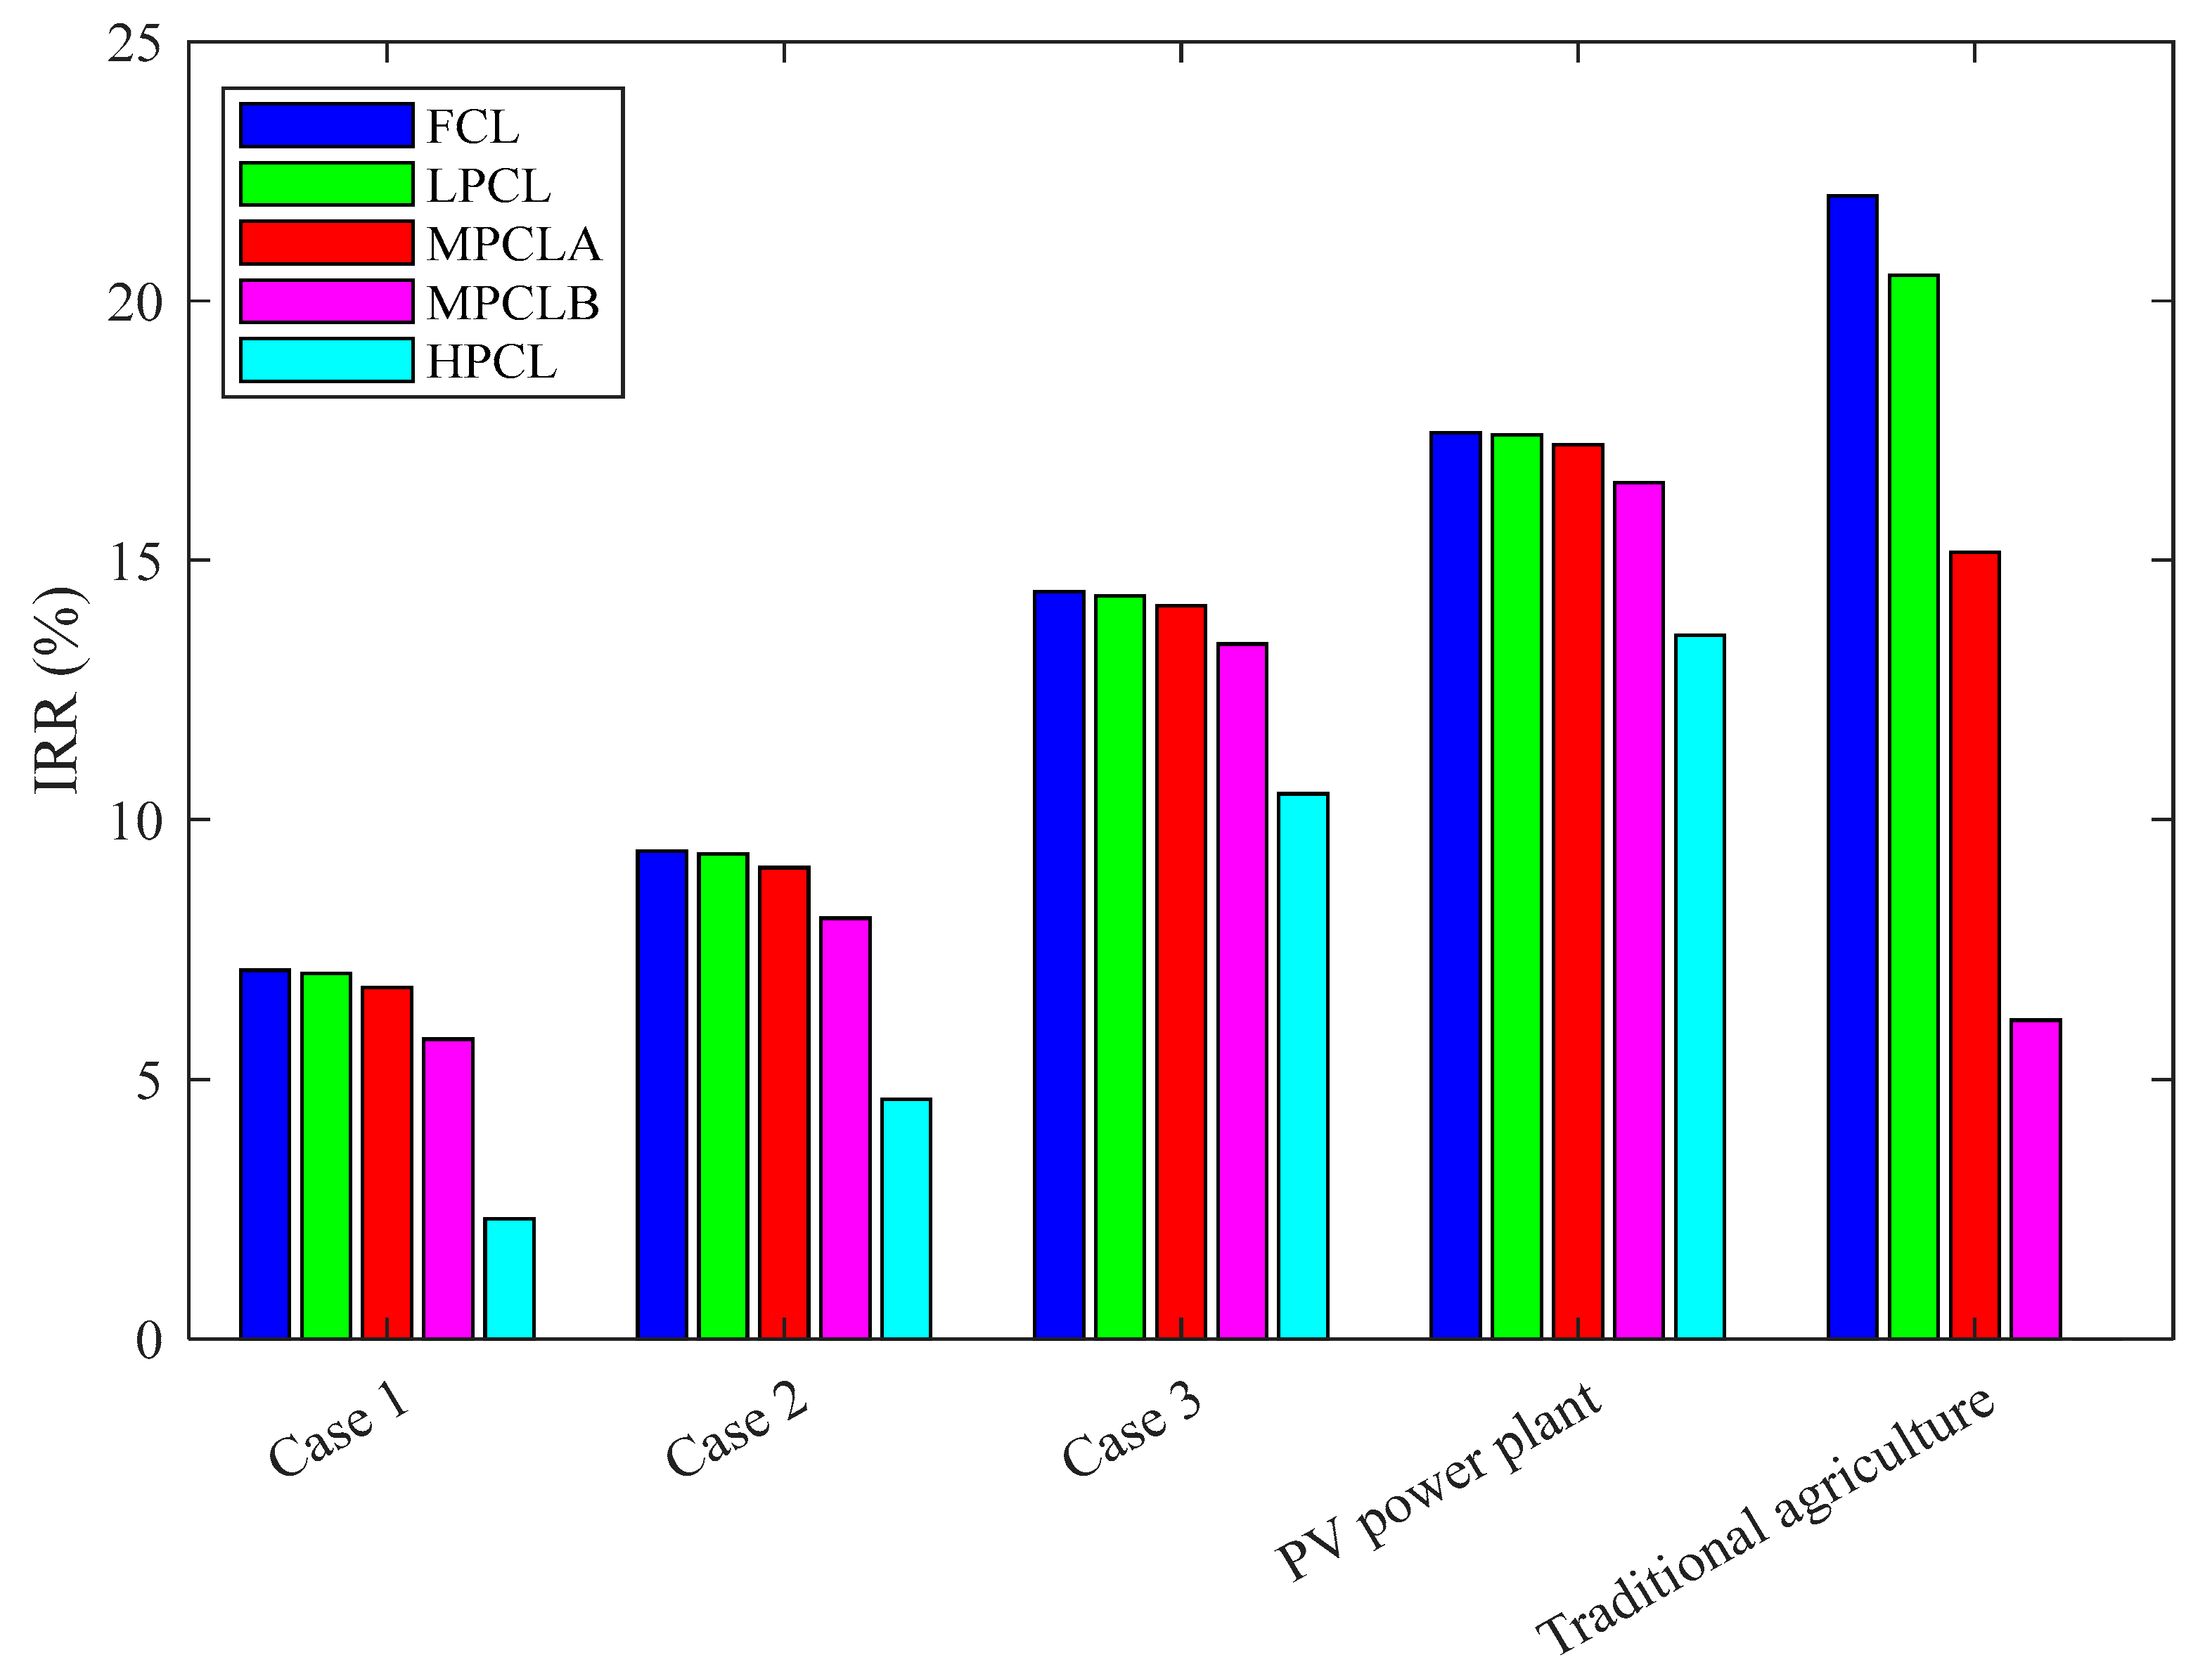
Figure 14 shows the variation in internal rate of return resulting from the use of 1 ha of land for the agricultural system, agrivoltaics systems, and the PV power plant, taking into account the variation in land costs.
The results show that the internal rate of return is higher for traditional agriculture, followed by the PV plant and agrivoltaic Case 3 for the FCL, LPCL, and MPCLA scenarios. However, the IRR is higher for the PV plant, followed by agrivoltaic Case 3 for the MPCLB and HPCL scenarios.
Traditional agriculture recorded an IRR of 22.02% for the FCL scenario, 20.49% for the LPCL scenario, 15.16% for the MPCLA scenario, and 6.14% for the MPCLB scenario. However, there is no discount rate that would cancel out the NPV for the HPCL scenario. Case 1 generated IRRs of 7.10%, 7.04%, 6.77%, 5.77%, and 2.31% for the FCL, LPCL, MPCLA, MPCLB, and HPCL scenarios, respectively. For Case 3, the IRR is 9.40%, 9.34%, 9.08%, 8.10%, and 4.61% for the FCL, LPCL, MPCLA, MPCLB, and HPCL scenarios, respectively. The IRR is 14.40% for the FCL scenario, and this rate decreased by 0.60% for the LPCL scenario, 1.96% for the MPCLA scenario, 7.02% for the MPCLB scenario, and 27.09% for the HPCL scenario. The same trend is observed for the PV plant, for which the IRR is 17.46% for the FCL scenario and decreased by 0.23% for the LPCL scenario, 1.32% for the MPCLA scenario, 5.49% for the MPCLB scenario, and 22.40% for the HPCL scenario.
These findings are consistent with the NPV and PI analyses, which indicate that Case 3, the PV power plant, and traditional agriculture are the most profitable systems. Both the PV power plant and Case 3 generate substantially more energy than Cases 1 and 2, confirming that higher energy output translates into greater economic performance, as reflected by NPV and IRR values. This outcome is primarily linked to system configuration: the PV power plant, which does not require spacing between panel tables due to the absence of crops, maximizes the installed photovoltaic area, while Case 3—a high-density agrivoltaic configuration—features reduced spacing between panel rows, allowing for greater energy generation compared to Cases 1 and 2.
3.7. Payback Period
Table 2 shows the payback period resulting from the use of 1 ha of land for the agricultural system, agrivoltaics systems, and the PV power plant for the FCL, LPCL, MPCLA, MPCLB, and HPCL scenarios. Blue indicates cases where the payback period varies between 1 and 9 years, gray indicates cases where it varies between 10 and 19 years, yellow indicates payback periods varying between 20 and 25 years, and red indicates payback periods greater than 25 years, which represents the duration of the projects in this study.
The results in
Table 1 show that the payback period is shortest for the PV plant, followed by Case 3 and traditional agriculture. Thus, the payback period varies between 5.42 years and 6.88 years for the FCL scenario, between 5.88 years and 7.67 years for the LPCL scenario, and between 8.32 years and 12.90 years when the discount rate varies between 6% and 12%. The payback period is longer than the project duration, which is 25 years for the MPCLB and HPCL scenarios for all discount rates, except for the MPCLB scenario when the discount rate is 6%. However, the latter recorded a payback period of 24.29 years, which shows that it is not profitable.
For Case 1 of agrivoltaics, the shortest payback period is 20.04 years. The payback period is also greater than 25 years in all but five (5) cases: the FCL scenario when the discount rate is 6% (20.04 years) and 7% (24.41 years), the LPCL scenario when the discount rate is 6% (20.21 years) and 7% (24.76 years), and the MPCLA scenario when the discount rate is 6% (21.43 years).
In Case 2, the payback period exceeds 25 years for the HPCL scenario for all discount rates. Thus, the shortest PBP is given by the FCL scenario when the discount rate is 6%, where it is 13.91 years. In fact, the PBP is less than 20 years for the FCL scenario when the discount rate varies between 6% (13.92 years) and 8% (17.57 years), the LPCL scenario when the discount rate varies between 6% (14.01 years) and 8% (17.74 years), the MPCLA scenario when the discount rate varies between 6% (14.47 years) and 8% (18.59 years), and the MPCLB scenario for discount rates of 6% (16.43 years) and 7% (18.82 years).
Case 3 for agrivoltaics yielded payback periods of less than 15 years, with the exception of five (5) cases: the MPCLB scenario with a discount rate of 12% (16.28 years) and the HPCL scenario with discount rates of 9% (16.94 years), 10% (21.55 years), 11% (over 25 years), and 12% (over 25 years). The lowest PBP is 8 years, obtained by the FCL and LPCL scenarios at 6%. Thus, the payback period varied between 8 and 13.87 years for the FCL scenario, 8 and 13.95 years for the LPCL scenario, 8.16 and 14.38 for the MPCLA scenario, and 8.64 and 16.28 years when the discount rate varied between 6% and 12%.
The PV plant recorded payback periods ranging from 6.38 years to 15.72 years, taking into account all the cases studied. The HPCL scenario, which represents the most unfavorable scenario, gave a payback period of 8.26 years when the discount rate was 6%, 8.85 years when the discount rate was 7%, 10.63 years when the discount rate was 8%, 11.42 years when the discount rate was 9%, 12.42 years when the discount rate is 10%, 12.76 years when the discount rate is 11%, and 15.72 years when the discount rate is 12%.
The PBP results are similar to those shown by the NPV, PI, and IRR. These results show that it is more profitable to adopt PV power plants in urban areas, as agriculture is not a dominant activity in urban areas. However, agrivoltaics systems can be very profitable in semi-urban and rural areas where access to electricity is limited and where agriculture remains the dominant activity of the population. High-density agrivoltaics systems can therefore ensure agricultural production and energy production in order to meet the population’s demand for energy and agricultural products in rural areas. In addition, these systems are economically profitable and can generate a source of income.
Gautam et al. [
27] obtained a payback period of 5.9 to 6.03 years using a discount rate of 10% for an agrivoltaic system and between 5.7 and 6 years for systems that have the same production capacity over a period of 20 years, showing that the profitability of agrivoltaics systems varies considerably depending on the configuration, location, and crops. Indeed, the cost of equipment varies considerably depending on the area. This confirms that the higher the density of the agrivoltaic installation, the more profitable it becomes.
3.8. Sensitivity Analysis
The sensitivity analysis was performed using Case 3 of agrivoltaics, which obtained the best performance. This analysis was conducted to assess sensitivity to variations in the cost of the PV system and the cost of land, which are the parameters with the highest impact.
The cost of the PV system represents 95.4% of the investment for the FCL scenario and 75.2% for the HPCL scenario. For Cases 1 and 2, the investment in setting up the PV system represented 90.24% and 91.71% of the investment, respectively, for the FCL scenario. In addition, land costs accounted for the largest part of the investment costs for traditional agriculture in the MPCLB (64.26%) and HPCL (89.48%) scenarios. It also represents 36% of the investment for Case 1 of agrivoltaics and 33% of the investment for Case 2, considering the HPCL scenario.
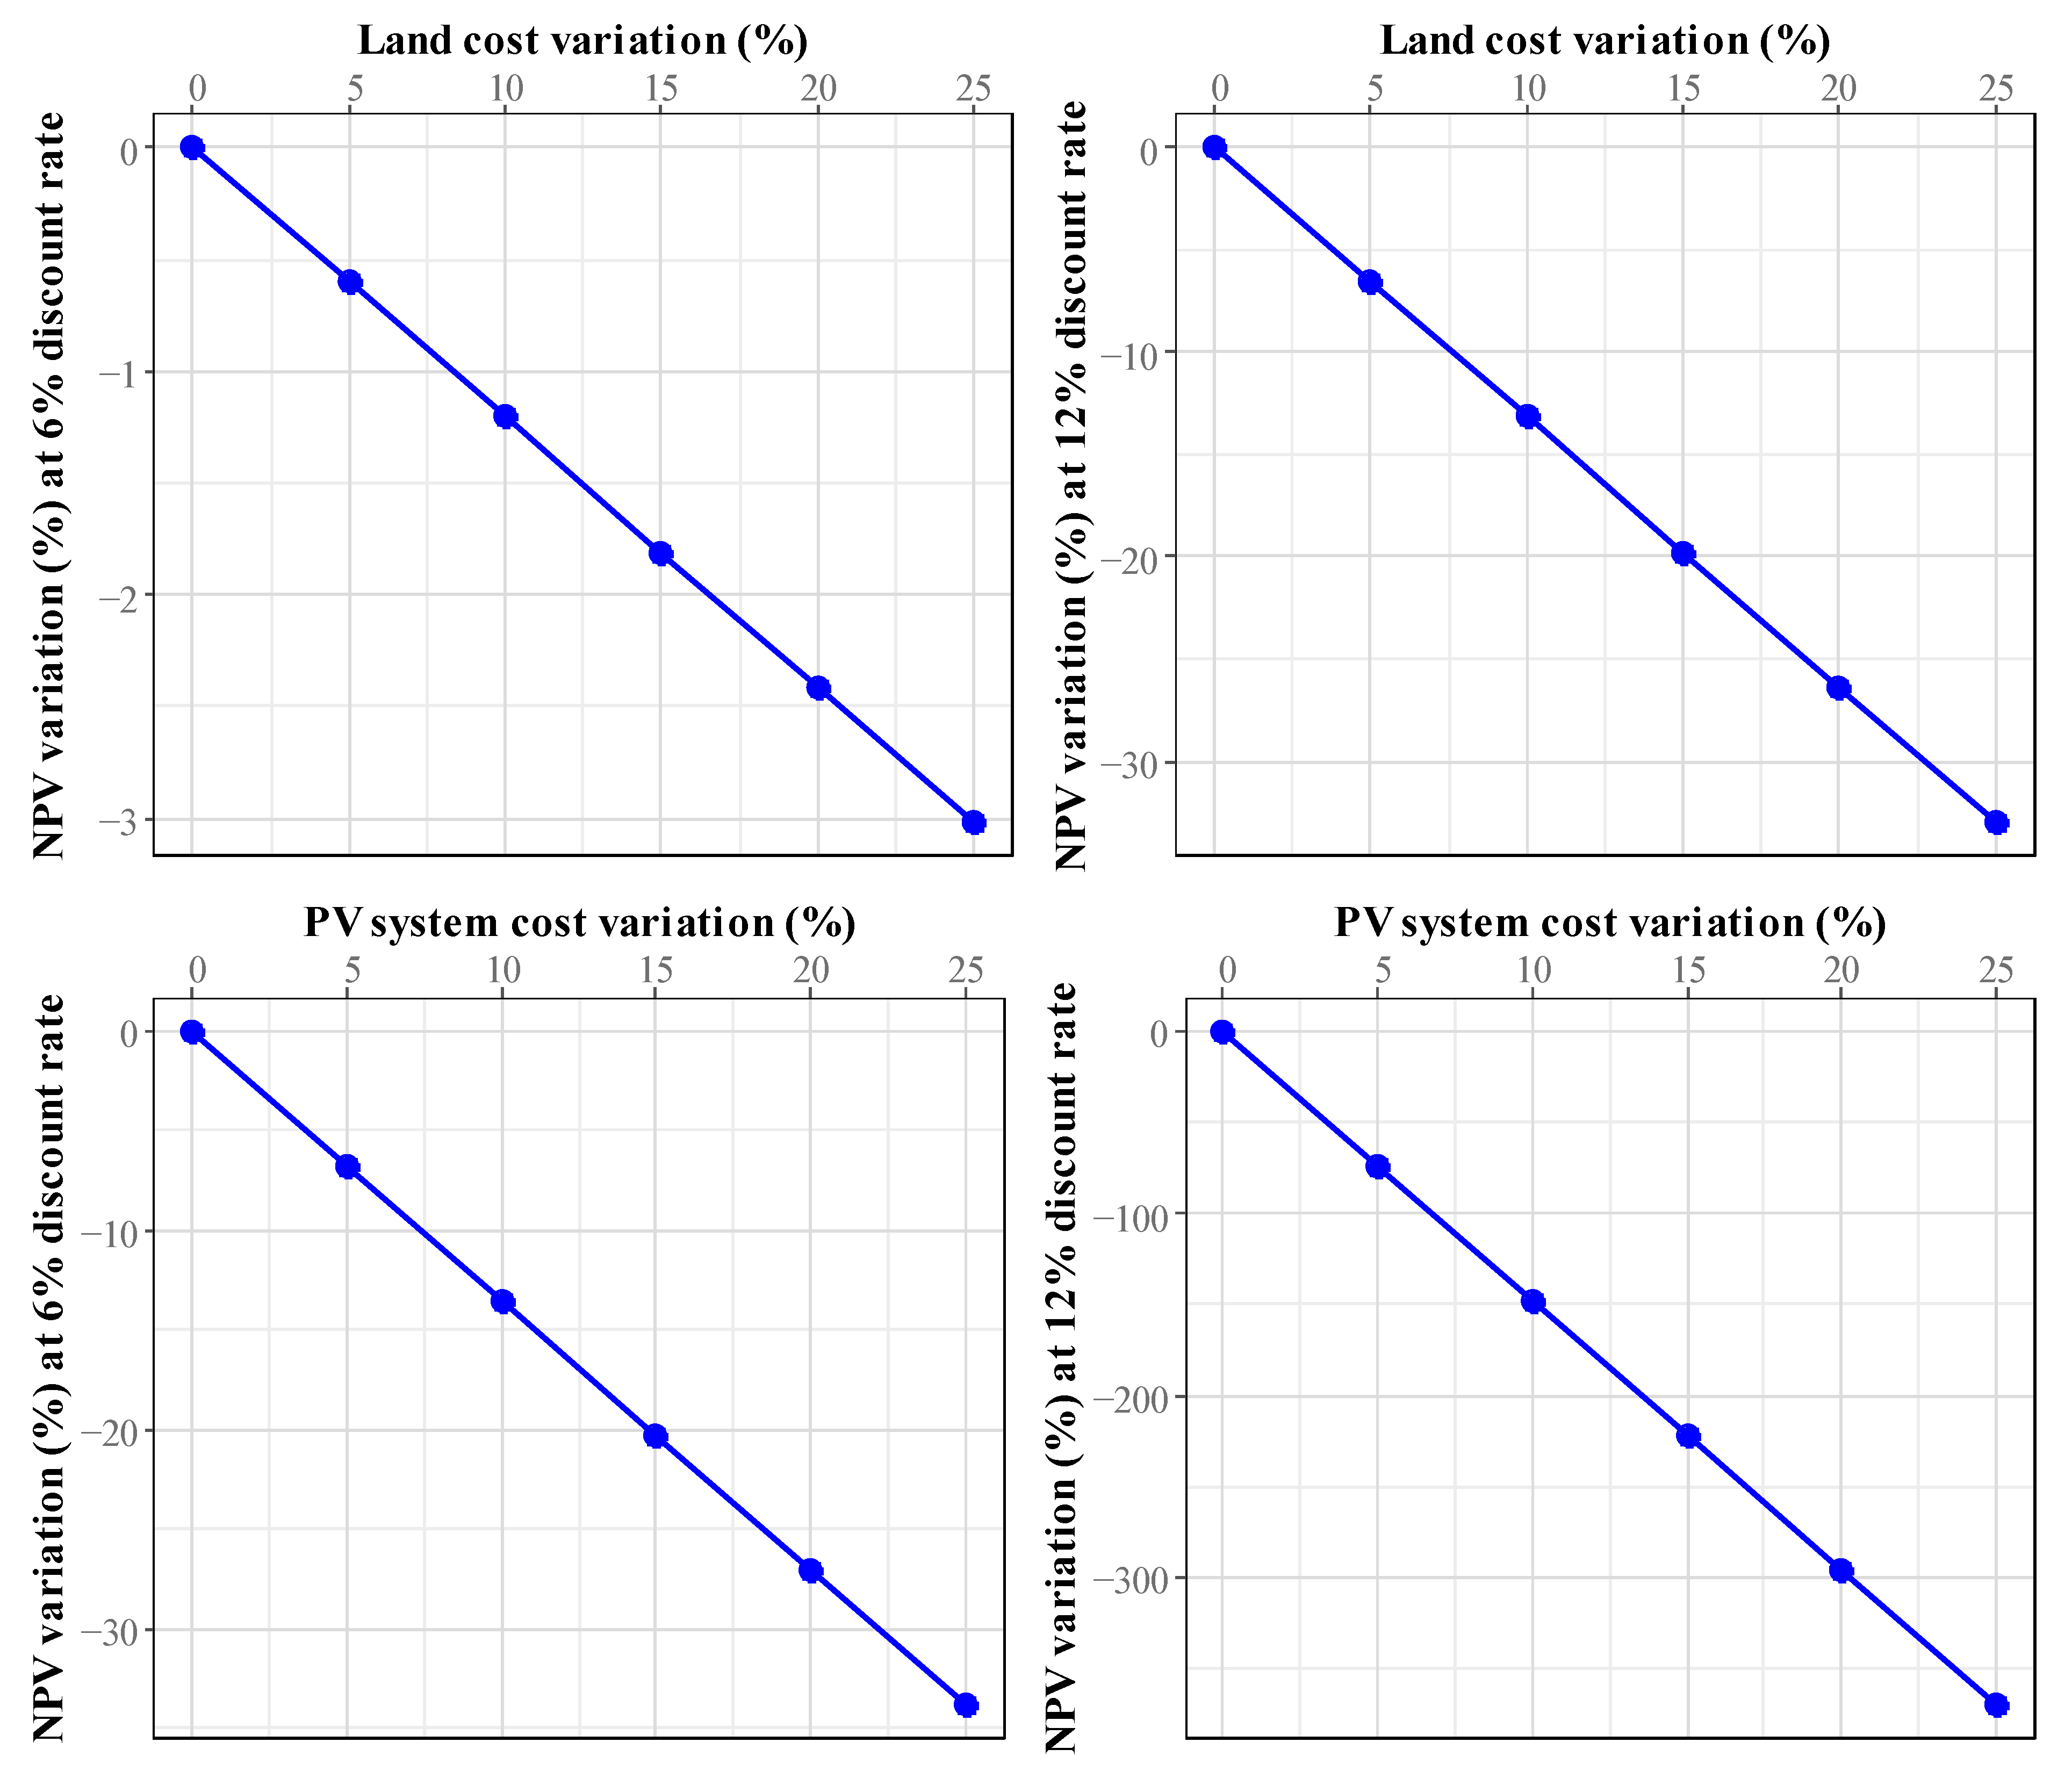
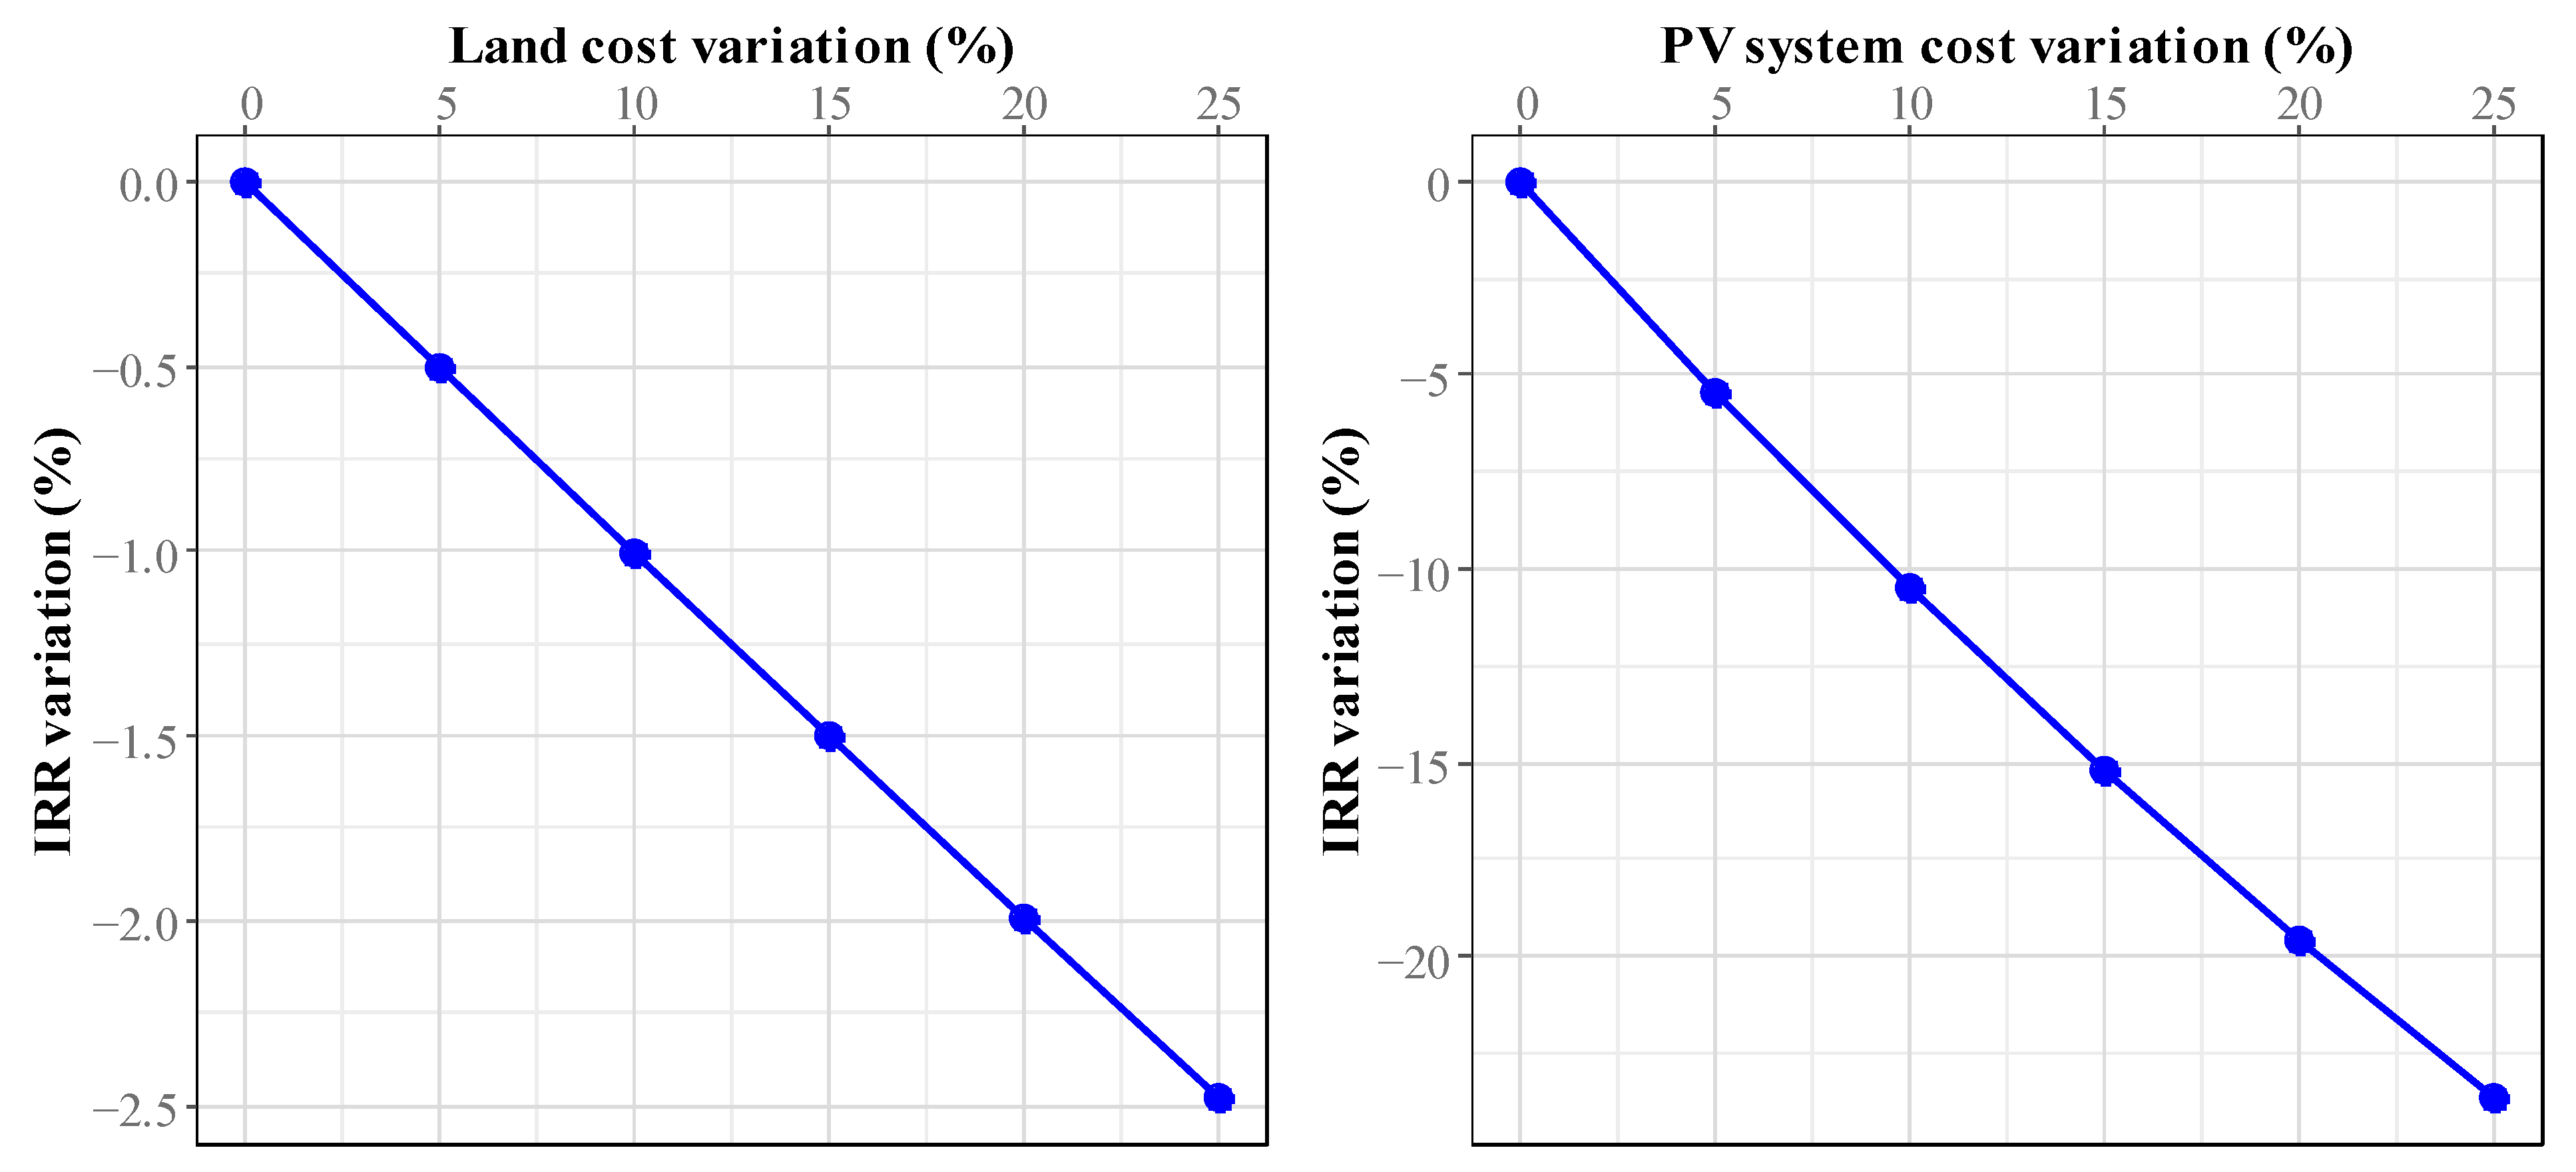
Sensitivity was assessed using NPV and IRR. For the PV system case, the initial cost (EUR 385,229.29 was increased by up to 25% using a step size of 5%. Regarding the impact of land cost variation, the average cost (EUR 34,339.14) was used and increased by up to 25% using a 5% step size as well.
Figure 15 and
Figure 16 show the impact of the PV system and land cost variation on NPV and IRR, respectively.
The results in
Figure 15 and
Figure 16 show that economic profitability is more sensitive to variations in the cost of the PV system. An increase in the cost of the PV system from 5% to 25% led to a reduction in Net present value (NPV) from 6.75% to 33.78% when the discount rate was 6% and from 73.87% to 369.38% when the discount rate was 12%. However, a lower sensitivity to variations in land costs was observed. Thus, there was a reduction in NPV from 0.6% to 3.01% when the discount rate was 6% and from 6.58% to 32.92% when the discount rate was 12%.
The same trend was observed in the case of the IRR, which fell by 5.45% when the cost of the PV system increased by 5% and by 23.67% when this cost increased by 25%. On the other hand, the increase in the cost of land from 5% to 25% led to a reduction in the IRR from 0.50% to 2.48%.
