Abstract
This study focuses on the assessment of the ecological vulnerability of lands in the western regions of Kazakhstan (WKR) using the MEDALUS (Mediterranean Desertification and Land Use) model in combination with satellite remote sensing data. Particular attention is given to the influence of climatic factors, soil properties, vegetation condition, and anthropogenic pressure. As part of the analysis, key indicators were calculated, including the Soil Quality Index (SQI), Vegetation Quality Index (VQI), Climate Quality Index (CQI), and Management Quality Index (MQI). Based on these parameters, an Environmental Sensitivity Area (ESA) index was developed, allowing the classification of the territory into five vulnerability classes ranging from low to critical sensitivity. The results indicate that 52.7% of the territory of the WKR falls within the high-risk zone for land degradation. The most pronounced changes were observed in the southern oblasts of the region, particularly in Mangystau oblast (MAN), where 98.7% of the land is classified as degraded and 74.3% of the territory falls under the category of extremely high ecological vulnerability. In addition, a steady decline in precipitation levels has been identified, contributing to the intensification of aridization processes across the region. Correlation analysis showed that the strongest relationships with the final ESA index were observed for the Vegetation Quality Index (VQI) and Climate Quality Index (CQI), both with correlation coefficients of r = 0.93 and an average coefficient of determination R2 = 0.87. The Soil Quality Index (SQI) also demonstrated a strong correlation (r = 0.86). In contrast, the Management Quality Index (MQI) exhibited a generally weak correlation, except in the MAN oblast, where within the Very Low Quality (VLQ) class areas, it showed a moderate correlation (r = 0.68, p < 0.0001). The results highlight the critical role of natural factors—particularly vegetation condition, climate, and soil quality—in shaping the ecological vulnerability of the region. Findings emphasize the need for a comprehensive, multi-criteria approach in developing strategies for sustainable land management under conditions of ongoing climate change.
1. Introduction
Assessment of ecological vulnerability is a critical component in understanding and preventing land degradation processes. Environmental degradation represents a dynamic and complex challenge that requires continuous monitoring to support ecological restoration and the sustainable use of natural resources. Desertification and land degradation are global-scale issues, particularly affecting arid and semi-arid regions, which together account for approximately 41% of the Earth’s terrestrial surface [1,2]. Desertification refers to land degradation resulting from the combined effects of climate change and human activities in arid, semi-arid, and dry sub-humid regions [3,4]. Estimates of the total area of degraded land worldwide range from 1 to over 6 billion hectares [5], and continued land degradation could result in a 12% decline in global food production over the next 25 years, potentially causing a nearly 30% increase in global food price [6].
Currently, around 2.5 billion people reside in arid and semi-arid regions [7], many of whom experience challenging socio-economic conditions. A considerable share of this population inhabits highly vulnerable territories, where the effects of desertification are particularly pronounced [8]. This issue is especially relevant for the Central Asian region, which is situated within the continental climatic zone and includes some of the largest temperate deserts globally, distinguished by their ecological fragility [9,10].
Central Asia is largely characterized by arid conditions, with landscapes dominated by pasture-based, semi-desert, and desert ecosystems, all of which are subject to limited water availability [11]. The region’s pastures, due to low soil productivity and sparse vegetation cover, are highly vulnerable to climatic fluctuations and anthropogenic pressures [12]. As a result, these fragile ecosystems are experiencing accelerated degradation driven by both natural and human-induced factors.
Given that over 70% of Kazakhstan’s territory lies within arid and semi-arid zones, desertification and land degradation remain critical ecological challenges, significantly constraining the prospects for sustainable socio-economic development. This is particularly relevant for rural regions, where local livelihoods and traditional livestock production are directly dependent on the availability and condition of natural land resources. According to the Committee on Land Resources Management under the Ministry of Agriculture of the Republic of Kazakhstan, degradation processes affect a significant portion of the national territory. In particular, 29.3 million hectares of land have been subjected to erosion (both wind and water), while 24.5 million hectares have been disturbed by mining, mineral processing, and exploration activities. In addition, approximately 9.6 million hectares have been polluted by industrial, energy, and defense sector waste [13].
Recurring drought is one of the most critical climatic stressors affecting the Republic of Kazakhstan, exerting a complex and multifaceted negative impact on living conditions, the agricultural sector, and overall socio-economic development. According to Dubovyk [14], between 2000 and 2016, droughts occurred six times across the region, with over 50% of the country’s territory exposed to varying levels of drought-related stress.
In this context, the WKR warrants particular attention due to its geographic location, arid climate, and high vulnerability to anthropogenic pressures, which together amplify the environmental sensitivity of the area.
Given the high frequency of drought events and their widespread impacts, particularly in ecologically vulnerable regions such as WKR, there is a clear need for a systematic assessment of land degradation levels and the resilience of ecosystems to climatic stressors. In response to these challenges, a range of methodological approaches have been actively developed and applied for mapping and assessing desertification and land degradation, including the use of vegetation dynamics [15,16,17], climatic and vegetation indices [18], soil quality indicators [19], and drought assessment techniques [20,21,22,23].
Among the various methodological approaches, the MEDALUS model (Mediterranean Desertification and Land Use), developed within the framework of the EU MEDALUS project, is considered one of the most widely recognized and effective tools for assessing land degradation and ecological vulnerability. The model has been successfully applied at national, regional, and local levels across different parts of the Mediterranean region. In recent years, it has also been extensively used in scientific research focused on monitoring and evaluating desertification processes under diverse environmental and climatic conditions, including selected regions of Africa [2,3,24] and various European countries [25,26,27,28,29]. However, a review of international peer-reviewed scientific databases reveals a notable absence of studies applying the MEDALUS model to the assessment or spatial mapping of desertification and land degradation in Kazakhstan. In light of this research gap, the present study focuses on the WKR as a case study for the application of the MEDALUS model. A significant portion of this region lies within desert and semi-desert zones and is characterized by a high degree of vulnerability to land degradation and desertification processes [30,31].
One of the main limitations in applying the MEDALUS model is its high requirement for the volume and quality of geospatial and temporal data, as well as the necessity of employing complex computational techniques for data processing and analysis [24]. To ensure efficient handling of large-scale geospatial datasets—particularly for wide-area mapping and automation of resource-intensive analytical workflows—this study uses the Google Earth Engine (GEE) cloud platform. GEE offers significant computational capacity and an extensive suite of tools for spatial and temporal data analysis [32,33,34,35,36,37]. The aim of this study is to conduct a comprehensive analysis of the ecological vulnerability of lands in Western Kazakhstan (WKR) using the MEDALUS model and remote sensing data.
2. Materials and Methods
2.1. Study Area
The Western Kazakhstan region (WKR) spans an area of approximately 736,000 km2, accounting for around 27% of the total land area of the Republic of Kazakhstan. Geographically, it extends between 41°21′08″ and 51°43′15″ N latitude, and 46°29′22″ to 64°08′57″ E longitude. Administratively, the region comprises the Aktobe (AKT), West Kazakhstan (WKO), Atyrau (ATR), and Mangystau (MAN) oblasts (Figure 1) [30,31].
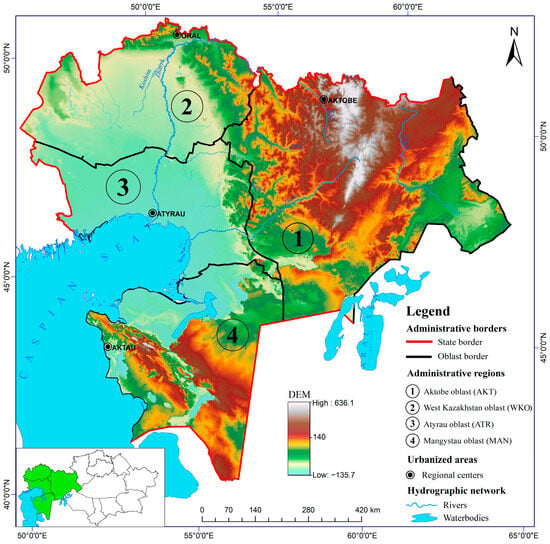
Figure 1.
Map of the study region.
Hypsometrically, the territory slopes from east to west, southwest, and northwest—descending from the Southern Urals toward the Caspian Lowland and ultimately the Caspian Sea. The landscape structure of the region encompasses three major natural zones: the southern subzone of feathergrass–chernozem steppe (often including a transitional dry-steppe belt), the semi-desert zone, and the desert zone, which is further subdivided into northern and southern subzones. This zoning reflects the combined influence of geographical position, climate, and ecological conditions.
Due to the significant latitudinal extent from north to south, the climate of the study area is markedly heterogeneous. In January, average air temperatures increase from −15 °C in the north to −7 °C in the south, while in July, temperatures rise from +22 °C to +27 °C. Precipitation shows a clear southward decline, decreasing from approximately 350 mm per year in the north to 150 mm in the southernmost parts of the region.
The hydrographic network of the WKR is predominantly developed in its northern areas, where the Zhaiyk (Ural) River, the largest and most significant watercourse in the region, flows. In addition to this permanent river, the region is traversed by a number of seasonal and ephemeral streams with periodically drying channels, including the Zhem, Sagyz, Irgyz, Emba, and others.
The soil cover of the region is marked by a high degree of zonal and intrazonal heterogeneity. In the northern steppe zone, the landscape is dominated by chestnut (brown) soils and southern low-humus chernozems, interspersed with various transitional and subtype soils. The northern portion of the desert zone is mainly composed of brown soils, whereas the southern desert belt is characterized by gray-brown soils. Along river valleys, meadow soils with high forage productivity are widespread, playing an important role in pastoral land use. In addition, large areas are occupied by saline landscapes, including solonchaks, salt marshes, and sandy massifs, which significantly influence both vegetation structure and land degradation dynamics.
The northern steppe belt of the study area is currently extensively cultivated, although it was historically dominated by grass-forb plant communities, with a prevalence of fescue (Festuca spp.). Tree and shrub vegetation is primarily confined to river floodplains, forming narrow, linear belts. Moving southward, the vegetation gradually transitions into semi-desert communities, composed mainly of wormwood-grass (Artemisia–Poaceae) associations.
Solonchak areas are characterized by halophytic plant species, adapted to saline soils, while meadow vegetation is dominant in river valleys, benefiting from relatively higher soil moisture and fertility. In the desert zones, vegetation is sparse and typically represented by monodominant and low-diversity xerophytic semi-shrubs, including various species of Artemisia, Kochia prostrata (izen), Halocnemum strobilaceum (sarsazan), and Alhagi spp. (camel thorn), among others. These formations reflect strong ecological specialization and adaptation to arid climatic conditions.
2.2. Data Source
This study utilized heterogeneous spatial datasets from many sources, which were subsequently harmonized to a spatial resolution of 500 m and transformed into a uniform coordinate reference system. Following the standardized methodology of the MEDALUS model, a set of key indicators was selected to characterize the main factors influencing land vulnerability. These indicators include attributes of soil cover, vegetation condition, climatic parameters, and anthropogenic pressure, allowing for a comprehensive assessment of ecological sensitivity across the study area.
2.2.1. Soil
The parameters Soil Texture (ST), Soil Depth (SD), and Soil Water Capacity (SWC) were derived from the World Soil Information Service (WoSIS) global database, which provides data at a spatial resolution of 250 m [38]. WoSIS data, maintained by ISRIC, are extensively utilized in global land degradation assessments [39,40,41,42]. Given the salinity-related constraints prevalent in the region [43]. Soil Salinity (SS) was incorporated as a key variable and estimated using the Normalized Difference Salinity Index (NDSI), calculated from MODIS Terra surface reflectance data (MOD09A1.061) for the period 2003–2023 [44]. Additionally, Soil Rainfall Erosivity (SRE) was computed based on the R-factor, derived from precipitation records of 41 meteorological stations operated by Kazhydromet over a 32-year period, using the empirical formulation developed by K.G. Renard and Freimund [45].
2.2.2. Vegetation
Vegetation cover in the study area was evaluated using MODIS Terra satellite data (Collection V6.1). To calculate the Vegetation Quality Index (VQI), 16-day NDVI composites from the MOD13A1.061 product were analyzed for the period 2003–2023. NDVI values were aggregated by month across the growing season, and the mean NDVI for the entire period was used to generate the Vegetation Cover (VC) map [46]. The Drought Resistance (DR) indicator was determined using long-term Vegetation Health Index (VHI) values, which provided insight into the vegetation’s ability to withstand drought conditions [47,48]. The Fire Risk Index (FR) was calculated using a combination of NDVI data (MOD13A1), Land Surface Temperature (LST) from MOD09A1, and historical fire boundaries based on the MODIS dataset MCD64A1 over the past 20 years [49,50]. The resistance of vegetation cover to erosion was assessed by analyzing the ratio between terrain slope, derived from the SRTM digital elevation model, and NDVI values (MOD13A1)—where higher slope values combined with lower NDVI indicate increased erosion risk [51]. Preliminary calculations of vegetation-related indicators (VAI) were conducted using the Google Earth Engine (GEE) cloud platform, while final data processing and cartographic visualization were performed in the ArcGIS Pro 3.4 geographic information system environment.
2.2.3. Climate Data
Long-term average values of key climatic indicators—including precipitation (P), air temperature (T), potential evapotranspiration (PET), climatic water deficit (CWD), and solar radiation (SR)—were derived from the global TerraClimate dataset for the past 20 years using the Google Earth Engine (GEE) platform [52]. The Aridity Index (AI) was calculated as the ratio of mean annual precipitation to mean annual potential evapotranspiration (P/PET) [53]. The resulting data were classified and used to produce spatial maps of climatic variables, which served as inputs for the computation of the Climate Quality Index (CQI).
In addition to global datasets, precipitation data from 41 meteorological stations collected over a 32-year period were used to calculate the R-factor, a key component of the Soil Quality Index (SQI-R), reflecting rainfall erosivity.
2.2.4. Land Cover
Land use and land cover (LULC) data were obtained from the GLAD Global Land Cover dataset, developed by the University of Maryland using multi-year Landsat satellite observations [54]. The dataset, covering the period from 2000 to 2024, was reclassified into eight land use categories. A change detection analysis was subsequently conducted, and each land use class was assigned a disturbance weight, reflecting the intensity of anthropogenic impact, for use in the assessment of the Management Quality Index (MQI).
2.2.5. Ancillary Data Sources
Considering the specific characteristics of anthropogenic pressure in the study area, the Management Quality Index (MQI) was calculated using the following indicators: Population Density (PD), Industrial Density (ID), Grazing Pressure (GP), and Linear Infrastructure Density (LI). The Population Density (PD) indicator was derived from the 2021 national population census, covering 1090 settlements within the Western Kazakhstan Region (WKR) [55]. To estimate the Industrial Density (ID), archival data on mineral deposits were used alongside attribute information extracted from OpenStreetMap API, Google Maps API, and Bing Maps databases [56]. As a result of attribute analysis and visual interpretation of high-resolution satellite imagery, a total of 2380 industrial facilities were manually digitized.
The Linear Infrastructure (LI) indicator was developed using spatial data on primary and secondary roads, railway lines, and oil and gas pipelines, obtained from archived topographic maps and publicly available sources, including OpenStreetMap and Google Maps APIs [57]. The Grazing Pressure (GP) indicator was calculated based on the identification of 5370 private livestock farms, digitized manually using satellite images available through Google Maps and Bing Maps [58].
The criteria for search farm recognition were defined based on insights derived from field research and aerial imagery. The primary features of operational farms included (A) a dwelling for the farmer and their family, (B) sheepfolds and enclosures for livestock, (C) water supply sources (wells, troughs), and, finally, additional elements such as auxiliary buildings for diverse functions, solar panels, and established roads showing evidence of use (Figure 2a). According to the specified criteria, 5370 farms were selected from more than 6000 discovered farms, including sparsely populated areas with a population of no more than 300 people (Figure 2b).
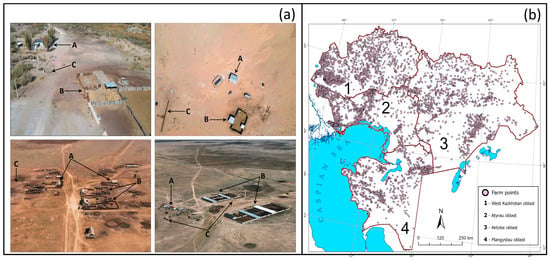
Figure 2.
(a) Aerial photographs of representative farms within the study region: (A) a dwelling for the farmer and their family, (B) sheepfolds and enclosures for livestock, (C) water supply sources, (b) Spatial distribution of farm locations across the study area.
The pasture load map was developed based on the selected farm locations, which underwent a multi-stage processing workflow in ArcGIS Pro v3.5 (Figure 3).

Figure 3.
Workflow for processing farm points to derive grazing pressure sensitivity.
2.2.6. Temporal Harmonization
The objective of the study is to delineate long-term environmental sensitivity (ESA), so the time series were standardized to a comparable baseline using long-term climate data and MODIS composites. We discerned three categories of indicators:
- Stable: soil characteristics (texture, depth, water retention from WoSIS, 250 m) and topography (SRTM). These markers are regarded as invariant during the study period.
- Gradually evolving: climate (precipitation, temperature, potential evapotranspiration, climatic moisture deficit, solar radiation)—20-year averages from TerraClimate were utilized; the aridity index was computed as P/PET. Sedimentary erosivity (SRE) was derived from the R-factor based on 32 years of station measurements.
- Highly variable: vegetation (NDVI, VQI, VHI for drought resilience), soil salinity (NDSI MODIS), fire risk (NDVI, LST, fire frequency), erosion resistance (slope-NDVI ratio), together with land use and land cover (LULC) and management indicators (population density, industrial activity, linear infrastructure, and grazing pressure).
Multi-year composites from the MODIS satellite series spanning 2003–2023 were utilized, aggregating to multi-year means to mitigate the effects of interannual variability and extreme years. Climate indicators were utilized as 20-year climate data to represent the regime, rather than focusing on years. The R-factor was derived using a 32-year precipitation dataset and is viewed as a property of the regime rather than a given year. Land Use and Land Cover (LULC) was derived using the worldwide GLAD dataset (2000–2020). For the baseline ESA calculation, we refer to the current situation to the most recent time (2020s) and utilize LULC dynamics to analyze and evaluate the robustness of the given weights. The management indicators are derived from contemporary sources (2021 census, revised infrastructure vector layers, and digitized farms), thereby reflecting the present pressure arrangement.
Anticipated effects of “temporal mixing”. At the regional scale (tens to hundreds of kilometers), the amalgamation of dates pertaining to the climate regime and averaged MODIS composite data has no impact, as the resultant ESA indicates consistent vulnerability elements. Local mixing may occur in the following scenarios: (i) in regions undergoing rapid changes due to flooding, (ii) fluctuations in the boundaries of minor water bodies throughout the seasons, and (iii) with a significant rise in infrastructure development. The zones were masked and excluded from further analysis to prevent the impact of unusual years on the overall ESA.
Limitations and directions for improvement. Despite the valuable results obtained, the application of the MEDALUS framework has several limitations that merit attention in future work: (i) A 500 m spatial resolution (MODIS) is suitable for covering such a large area and harmonizing ESA components, but it has a mixed-pixel effect: small and fragmented saline patches may remain undetected or become diluted in the average signal. Cross-scale validation against Landsat and Sentinel-2 resolution data is needed to refine mosaic hotspots. (ii) The Vegetation Health Index (VHI) was purposely averaged across multiple years to produce a stable baseline and assure comparability with other ESA components, although this smooths event-scale abnormalities and may disguise short-term extreme droughts. To better capture short-lived changes and their geographical imprint, event-oriented indicators including year-specific maps, minima, and lower VHI percentiles are interesting extensions. (iii) The Management Quality Index (MQI) weighting scheme—including industrial-density and linear-infrastructure density—was adopted from MEDALUS methodology and its recent applications in drylands. A sensitivity analysis should assess how weight choices affect the stability of mapped “hotspots” and territorial rankings. An analysis would improve openness and reproducibility and be the next step in developing the suggested approach.
2.3. Methods
In line with the MEDALUS methodological framework [24,25,59,60,61], a total of 20 indicators derived from remote sensing data were employed to assess Environmentally Sensitive Areas (ESA). These indicators were organized into four composite indices: the Vegetation Quality Index (VQI), Soil Quality Index (SQI), Climate Quality Index (CQI), and Management Quality Index (MQI) (Figure 4).
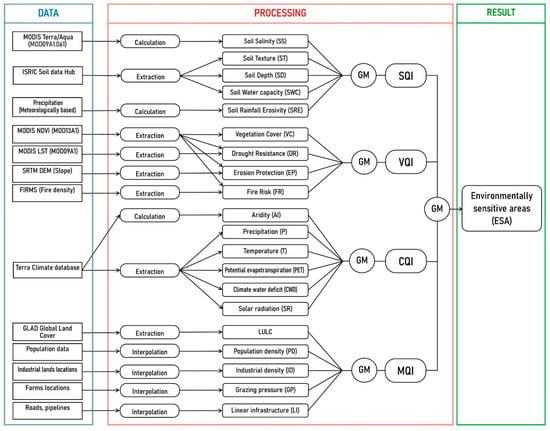
Figure 4.
Methodological framework.
2.3.1. Indicator Thresholds and Sensitivity Weights
MEDALUS indicators were established six sensitivity levels—very low, low, moderately low, moderately high, high, and very high—corresponding to weights ranging from 1.0 to 2.0 in uniform increments. The threshold intervals are obtained using long-term distributions of indicators for the research area (calculations performed in GEE and the ArcGIS Pro GIS platform) and are standardized as follows: for protective indicators (VC, DR, EP, SWC), a rise in value is associated with reduced sensitivity; for loading indicators (SS, SRE, FR, AI, P, T, PET, SWD, SR, and LUC, PD, ID, GP, LI), a rise in value is linked to heightened sensitivity (Table 1).

Table 1.
Threshold values and sensitivity weights of MEDALUS indicators.
MQI indicators (population density, industrial facility density, grazing pressure, linear infrastructure) are all derived from point or linear sources and were normalized to a range of 0–1 and subsequently classified utilizing a singular threshold value (Table 1). The application of identical intervals guarantees comparability within the MQI and eradicates concealed inconsistencies in sub-criterion weights.
The sensitivity of LULC components escalates in the subsequent sequence: wetland → dense short vegetation → semi-arid lands → true desert → forest → cropland → salt pan → urbanized areas (Table 2). A sensitivity score of 1.8 was exclusively attributed to forest massifs. This decision is interrelated and regionally specific; prior studies indicate that the high dynamics and vulnerability of narrow-leaved forest communities stem from their fragmentation, intensified human impact (increased settlement density), and hydrological disturbances in the Zhaiyk River basin [62].

Table 2.
Sensitivity weights assigned to LULC components.
2.3.2. Soil Quality Index (SQI)
The combined set of selected soil-related indicators forms the basis for evaluating the resistance of the territory to salinization and erosion processes. In this study, the SQI was computed using the geometric mean (GM) of six key soil parameters, as illustrated in Figure 5, and calculated according to Equation (1).
where SSs—soil salinity sensitivity index; STs—soil texture sensitivity index; SDs—soil depth sensitivity index; SWCs—soil water capacity sensitivity index; SREs—soil rainfall erosivity sensitivity index.
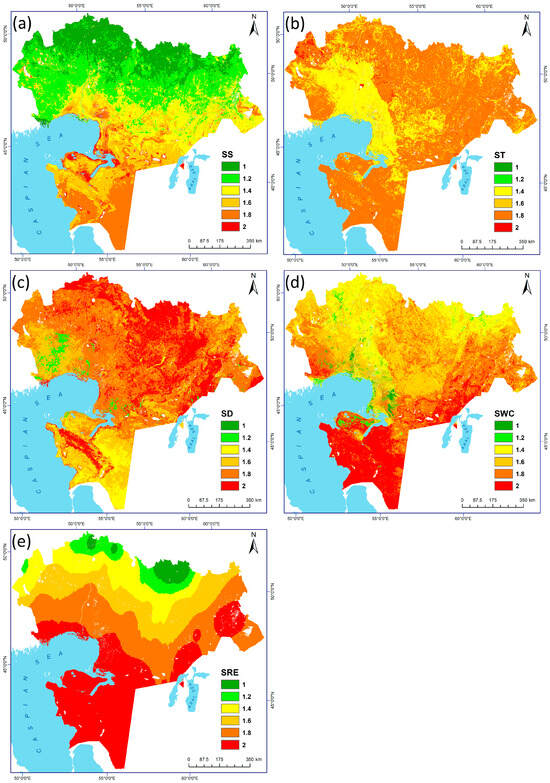
Figure 5.
Maps of the spatial distribution of different SQI indicator sensitivity scores ((a): SS; (b): ST; (c): SD; (d): SWC; (e): SRE).
2.3.3. Vegetation Quality Index (VQI)
The state of vegetation cover in the study region was assessed using four indicators as the most sensitive to the processes of degradation and desertification of the region. VQI was calculated using the geometric mean (GM) of the four soil indicators (Figure 6) in accordance with Equation (2).
where VCs—vegetation cover sensitivity index; DRs—drought resistance sensitivity index; ERs—erosion resistance sensitivity index; FRs—fire risk sensitivity index.
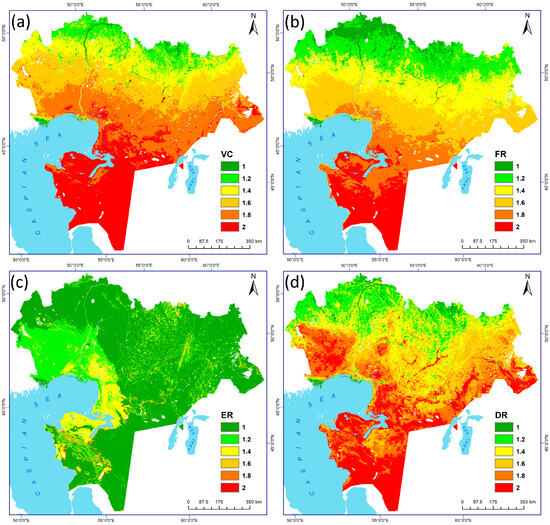
Figure 6.
Maps of the spatial distribution of different VQI indicator sensitivity scores ((a): VC; (b): FR; (c): ER; (d): DR).
The initial calculation of VQI indicators was carried out using the Google Earth Engine (GEE) cloud platform, while final data processing and map generation were performed within the ArcGIS Pro 3.4.
2.3.4. Climate Quality Index (CQI)
Six parameters contributing to desertification and land degradation processes were selected taking into account climatic peculiarities of the study region (Figure 7). Similarly to the previous CQIs, they were calculated using geometric mean according to Equation (3).
where Ps—sensitivity to precipitation; Ts—sensitivity to air temperature; PETs—sensitivity to potential evapotranspiration; AIs—sensitivity to aridity index; CWDs—sensitivity to climatic water deficit; SRs—sensitivity to solar radiation.
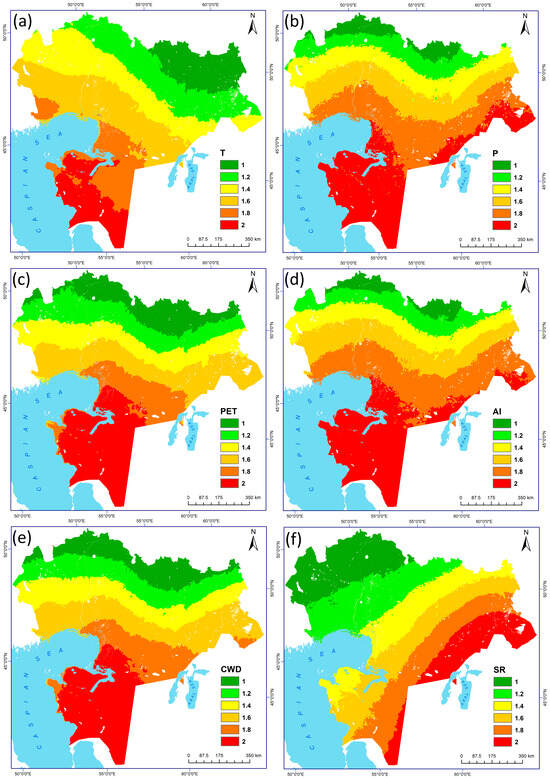
Figure 7.
Maps of the spatial distribution of different sensitivity scores of CQI indicators ((a): T; (b): P; (c): PET; (d): AI; (e): CWD; (f): SR).
2.3.5. Management Quality Index (MQI)
To characterize the degree of human influence on the acceleration or mitigation of desertification and land degradation processes, five management-related indicators were selected (Figure 8). The MQI was computed as the geometric mean of these indicators, in accordance with Equation (4).
where LULCs—sensitivity to land use and land cover intensity; PDs—sensitivity to population density; IDs—sensitivity to industrial pressure; GPs—sensitivity to grazing pressure; LIs—sensitivity to linear infrastructure density.
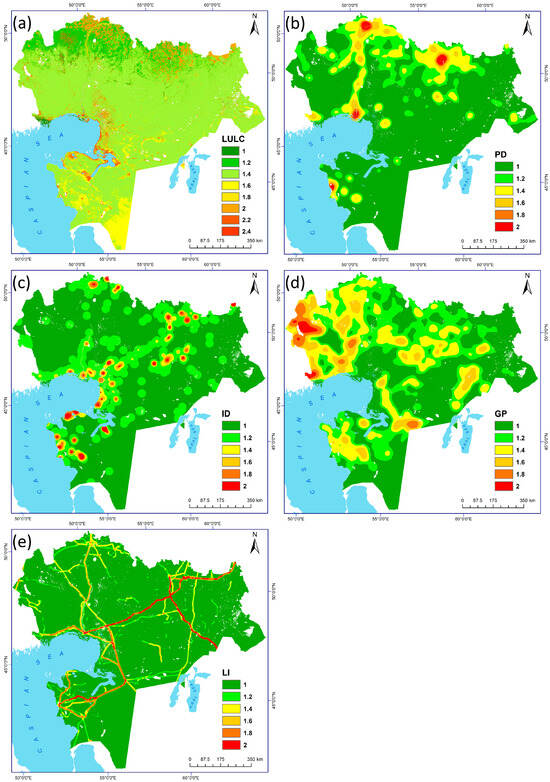
Figure 8.
Maps of the spatial distribution of various sensitivity estimates of MQI indicators ((a): LULC; (b): PD; (c): ID; (d): GP; (e): LI).
2.3.6. Environmentally Sensitive Areas (ESA)
The final output of the MEDALUS model integrates all previously calculated indices that reflect the condition of soil, vegetation, climatic factors, and the effectiveness of land degradation and desertification management in the study region. The ESA was calculated as the geometric mean of the four composite indices—SQI, VQI, CQI, and MQI—in accordance with Equation (5).
where ESA is the Environmental Sensitivity Index to desertification.
The indices SQI, CQI, and VQI represent the natural-environmental conditions of the region, while MQI reflects the socio-economic component, characterizing the pressure of anthropogenic activity on the environment.
3. Results
3.1. Spatial Distribution of Environmental Quality Indicators
As a result of the conducted analysis, a series of maps was produced, representing the spatial distribution of the Soil Quality Index (SQI), Vegetation Quality Index (VQI), Climate Quality Index (CQI), and Management Quality Index (MQI). Each map was classified into five environmental quality classes describing the condition of the landscape: Very High Quality (VHQ), High Quality (HQ), Moderate Quality (MQ), Low Quality (LQ), and Very Low Quality (VLQ) (Figure 9).
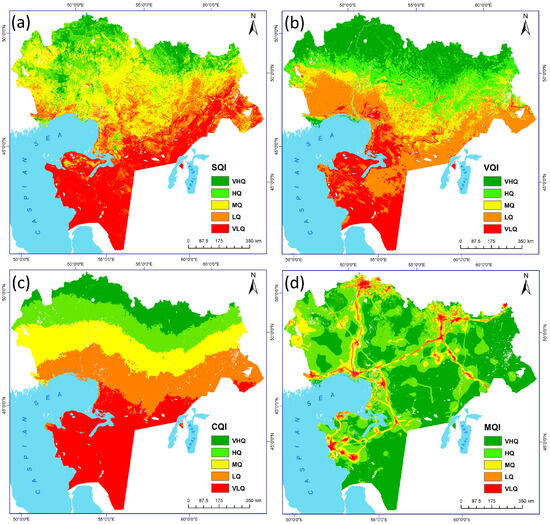
Figure 9.
Spatial distribution maps of the quality indices ((a): SQI; (b): VQI; (c): CQI; (d): MQI).
Given the extensive size of the study area, classification into five clearly defined threshold classes enables a more comprehensive and detailed assessment of the region’s natural and ecological conditions (Table 1). In contrast, many previous studies limit their index classifications to just three levels [3,24,61].
The results of the SQI show well-defined spatial boundaries of soil condition across the region. The most degraded soils are found in the MAN and the southern parts of AKT, where areas classified as LQ and VLQ account for 95.3% and 45.2% of the territory, respectively (Table 3).

Table 3.
Areal distribution of SQI classes in the oblasts of WKO, AKT, ATR, and MAN.
The best soil conditions, according to the results, were observed in the WKR where 64.6% of the territory falls under the VHQ and HQ soil quality classes (Table 3). In the ATR, the spatial distribution of SQI classes displays a highly mosaic structure, with the Caspian coastal zone exhibiting the greatest vulnerability (Figure 9a).
Historically, the soil cover across the study area has been marked by elevated salinity levels, which have been further aggravated in recent decades by increased anthropogenic pressure and climate change. These trends have contributed to the ongoing degradation of soil properties, which in turn has had an adverse impact on groundwater quality [62,63,64]. In addition to salinization, erosion processes—particularly those associated with spring floods—have accelerated the loss of humus-rich topsoil, further compromising soil health and reducing its suitability for agricultural use [65,66].
Given the climatic and geographical characteristics of western Kazakhstan, the vegetation cover in the region is marked by high ecological fragility and pronounced zonal contrast. Vegetation in the northern regions (WKO and AKT) is significantly more developed than in the southern areas, as reflected by higher NDVI values and greater resistance to environmental stressors (Figure 6a).
The spatial distribution of the VQI closely mirrors that of the SQI, demonstrating a clear northward improvement trend. The southern part of the WKO, particularly MAN, exhibits the lowest vegetation quality, with no areas classified under MQ, HQ or VHQ categories. This pattern underscores the region’s harsh climatic conditions and high vegetation sensitivity. In ATR, conditions are somewhat more favorable due to the presence of coastal delta zones in the Caspian Sea basin and seasonally flooded floodplains along the Ural and Zhem rivers. Nevertheless, the area of stable vegetation cover is limited to approximately 13,000 km2, accounting for just 11% of ATR’s total land area (Table 4).

Table 4.
Areal distribution of Vegetation Quality Index (VQI) classes in the oblasts of WKO, AKT, ATR, and MAN.
An opposite trend is observed in the WKO, where areas classified as VHQ and HQ in terms of vegetation quality account for 82% of the region’s total territory. In contrast, in the neighboring AKT, this share is significantly lower only 51% (Table 4). This discrepancy is largely attributed to the presence of arid zones in the Aral Sea basin, which extends into the southern part of AKT [66].
The climatic conditions of the study area are strongly continental, a characteristic that is clearly reflected in the final CQI map, which was generated based on six key climatic indicators over the past 20 years (Figure 7 and Figure 9c). Similarly to the previously discussed indices (SQI and VQI), the spatial distribution of CQI reveals a distinct latitudinal zonality, showing a gradient from the most arid southern regions to the more favorable northern territories. As indicated in Table 5, nearly the entire territory of MAN (97.5%) and 66% of the ATR are classified as areas with very high climatic vulnerability.

Table 5.
Areal distribution of Climate Quality Index (CQI) classes in the oblasts of WKO, AKT, ATR, and MAN.
Although MAN has a relatively low population, it hosts a concentration of large mineral deposits, including Zhetybai, Kalamkas, Karazhanbas, Rakushechnoye, Karakudyk, Severnoye Buzachi, Tamdy, and Uzen. The exploitation of these fields has stimulated the development of linear infrastructure, such as road networks and oil pipelines, which together occupy approximately 5% of the region’s total area (Table 6). The ATR oblast hosts several major oil fields, including S. Balgimbaev, Southwestern Kamyshitovoye, Rovnoye, Southeastern Novobogatskoye, and Zhanatalap, along with oil refineries located within the city of Atyrau. Areas classified as having LQ and VLQ of MQI values cover approximately 8.4% of the region’s total area. Among the western regions of Kazakhstan, the AKT demonstrates the most favorable MQI performance, with only 4.2% of its territory falling under the VLQ and LQ categories. The WKO ranks third, with a total area of 9535.8 km2 classified in these lower MQI categories (Table 6).

Table 6.
Areal distribution of Management Quality Index (MQI) classes in the oblasts of WKO, AKT, ATR, and MAN.
3.2. ESA Index Assessment
The final outcome of the assessment conducted in the territory of Western Kazakhstan Region using the MEDALUS model was the development of the Environmental Sensitivity Area (ESA) Index, which was subsequently classified into five levels of ecological vulnerability (Figure 10).
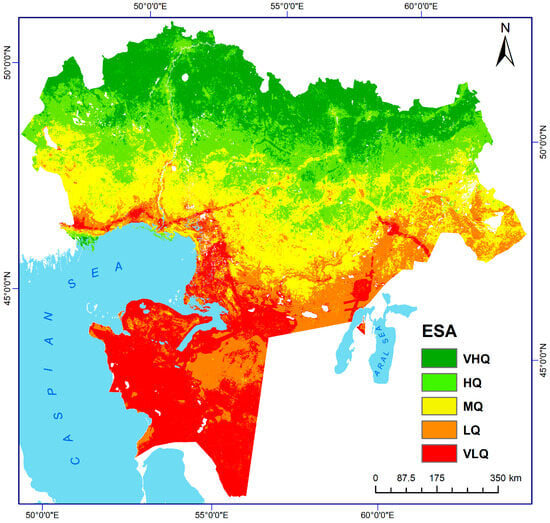
Figure 10.
Spatial distribution map of the Environmental Sensitivity Area (ESA) Index.
The spatial distribution of ESA index classes across the WKO, AKT, ATR, and MAN oblasts reveals pronounced spatial heterogeneity. Among all oblasts, WKO stands out for its high level of environmental stability, with a clear dominance of areas classified as VHQ at 45.8% and HQ at 44.5%. In contrast, the shares of areas with MQ, LQ, and VLQ are minimal—9.5%, 0.1%, and 0%, respectively. This distribution reflects the favorable ecological status of most of the WKO territory and indicates a relatively low risk of land degradation (Table 7).

Table 7.
Areal distribution of Environmental Sensitivity Area (ESA) Index classes in the oblasts of WKO, AKT, ATR, and MAN.
In the AKT oblast, the distribution of areas by environmental stability classes is more balanced. Moderate (MQ—30.8%) and High (HQ—28.7%) stability classes dominate, followed by Very High stability (VHQ—20.1%). However, a considerable portion of the oblast is classified as having Low (LQ—18.3%) and Very Low (VLQ—2.1%) environmental stability, indicating the presence of vulnerable zones and a potential risk of further degradation.
In the ATR oblast, MQ areas clearly prevail, covering 58.0% of the territory. In contrast, HQ and VHQ stability zones occupy only 12.9% combined, while areas with Low (LQ—20.2%) and Very Low (VLQ—8.9%) stability make up significant shares. This distribution points to pronounced environmental degradation risks (Figure 8).
The MAN oblast exhibits an extremely unfavorable ecological condition, with Very Low stability (VLQ) zones covering 74.3% of the territory. Low stability (LQ) areas account for an additional 24.4%, while Moderate stability (MQ) is barely represented (1.3%), and High and Very High stability classes are practically absent. These patterns indicate critical levels of environmental vulnerability and a very high risk of ongoing degradation (Table 7).
3.3. Consistency of the MEDALUS Assessment
An analysis of the consistency of the MEDALUS model outputs was conducted through a correlation matrix comparing the Environmental Sensitivity Area (ESA) index with the underlying quality indices—SQI, VQI, CQI, and MQI (Figure 11).
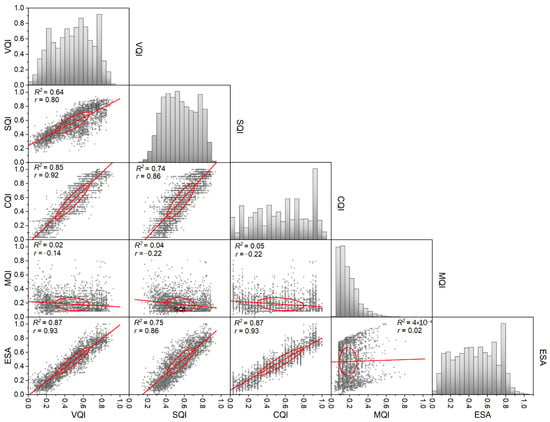
Figure 11.
Correlation matrix between the quality indices (SQI, CQI, VQI, MQI) and the Environmental Sensitivity Area (ESA) index at a significance level of 0.001. Red line: least-squares fit; red ellipse: 95% confidence ellipse.
The results revealed strong and statistically significant correlations between the main natural quality indices and the final ESA index. The VQI and the CQI showed the strongest positive correlations with ESA, both with correlation coefficients of r = 0.93 and an average coefficient of determination R2 = 0.87. These findings highlight the dominant role of climatic and vegetation conditions in shaping the ecological sensitivity of the study area. A significant correlation was also observed between the SQI and ESA (r = 0.86, R2 = 0.75), confirming the importance of soil factors in land degradation and environmental resilience (Figure 11).
In contrast, the MQI showed low correlation with the other quality indices, including ESA, suggesting that the spatial distribution of anthropogenic pressure operates independently of natural environmental gradients.
To further investigate the consistency between MQI and ESA, an additional correlation analysis was conducted across the five environmental quality classes: VHQ, HQ, MQ, LQ, and VLQ. The analysis was applied to all calculated quality indices—VQI, SQI, CQI, and MQI—within the classified ESA zones (Figure 12).
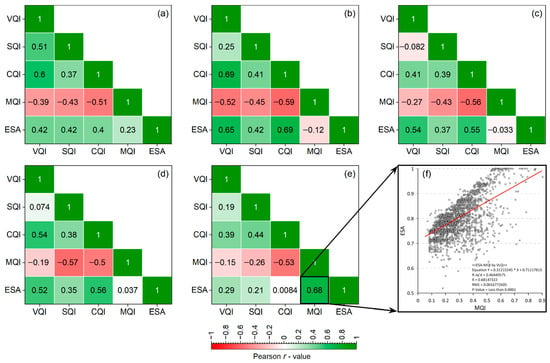
Figure 12.
Correlation consistency between the quality indices (SQI, CQI, VQI, MQI) and the ESA index across environmental quality classes: (a) Very High (VHQ), (b) High (HQ), (c) Moderate (MQ), (d) Low (LQ), (e) Very Low (VLQ), and (f) Detailed correlation between ESA and MQI in the Very Low Quality (VLQ) class. Red line is the least-squares regression fit.
Environmental Sensitivity Area (ESA) is chiefly governed by broad natural gradient vegetation condition, climate, and soils (VQI, CQI, SQI)—which vary smoothly across space and exhibit a strong association with ESA (correlation up to r ≈ 0.93). By contrast, the Management Quality Index (MQI) captures predominantly localized and clustered pressures, including industrial facilities, linear infrastructure (pipelines, highways, railways), settlement-adjacent zones of intensive resource use, and grazing force near farms. Consequently, pixels with high MQI values are often embedded within landscapes with moderate ESA, which lowers the global correlation between the indices.
Stratified correlation analysis by environmental-quality classes confirms the overall consistency of MQI with the natural components of ESA (see Figure 10). A notable exception is the VLQ (Very Low Quality) class, where MQI and ESA display a strong relationship (r = 0.68; p < 0.0001; Figure 12e,f). The high concordance within VLQ indicates spatial co-location of anthropogenic “hotspots” (oil and gas fields, pipeline–road corridors, urban–industrial agglomerations) with inherently fragile settings—extremely arid climate, sparse vegetation, and erodible soils. These results therefore point to elevated environmental vulnerability to anthropogenic impacts under unfavorable climatic conditions, a pattern particularly pronounced in the MAN oblast.
4. Discussion
The results of the present study confirm a consistent trend of soil and vegetation cover degradation in the WKR: approximately 52.7% of the territory exhibits signs of deterioration, while only 47.3% is characterized by stability or positive dynamics. Similar conclusions regarding pasture degradation under anthropogenic and climatic pressures were reported by Nasiyev et al. [67] who noted that prolonged land use without grazing rotation leads to a decline in productivity and vegetation diversity [67].
Historically, the region has been used as pastureland, and as noted by Tao et al. [68], this has been accompanied by increasing pressures, particularly under arid climate conditions [68]. Field observations and remote sensing data indicate that signs of overgrazing are becoming increasingly pronounced, confirming the expansion of areas with disrupted biomass and species composition of vegetation [69].
An additional destructive factor is steppe fires. According to Shinkarenko et al. [70] more than 18,000 fire incidents were recorded in the region between 2001 and 2020, with many occurring repeatedly in the same areas. This recurrence indicates a disruption in the adaptive mechanisms of the landscape and the intensification of degradation processes [70].
Simultaneously, significant climate changes are being observed. Xu et al. [71] report that climate trends in Central Asia are most pronounced in arid zones. In particular, in Western Kazakhstan, the average annual precipitation over the past three decades amounted to only 205.7 mm, with a declining trend across all administrative oblasts. The largest decrease in precipitation was recorded in the ATR oblast (−14.2 mm), and the smallest in the WKR (−6.0 mm). A reduction of 14.2 mm in the average annual precipitation has a significant negative impact on the ecological conditions of the ATR oblast, which is located in an arid desert zone. The average annual precipitation in this area amounts to only about 150–180 mm. Over the past thirty years, the average annual precipitation in the region has decreased by approximately 7%. Such changes have led to an increased frequency of natural drought phenomena. Dubovyk et al. [14] (2000–2016) recorded six drought events during this period, impacting up to 50% of Kazakhstan’s territory. These droughts were particularly pronounced in the western part of the country.
Temperature regimes show a positive trend: on average, an increase of 0.073 °C per year, equivalent to 2.21 °C over 30 years. This aligns with assessments by Pilifosova et al. [72] and Salnikov et al. [73] which point to the growth of climate extremes that exacerbate desertification processes.
Against the backdrop of climatic challenges, anthropogenic pressure is also intensifying. Buketova et al. [74] and Bazarbayeva [75] emphasize that the expansion of mineral extraction and industrial infrastructure leads to significant transformations of the natural environment.
In recent decades, the increased development of mineral deposits and the intensive growth of the extractive and processing industries have amplified human impact on the environment and call for optimization for the sustainable development of the region [62,76]. The results of the Management Quality Index (MQI) calculation reflect the level of anthropogenic load in the western regions, which at first glance appears less pronounced compared to other quality indices. However, the localized impact of industrial facilities and linear infrastructure leads to significant, and in some cases, irreversible changes to adjacent areas [77,78,79].
The active development of industrial sectors in the region has both direct and indirect impacts on public health, as major raw material processing enterprises are located in large cities or in their immediate vicinity [80,81]. A special case is the MAN oblast, where, despite low population density, the largest oil and gas fields are concentrated. According to Yermenbay et al. [79] the linear infrastructure accompanying their development fragments natural landscapes and reduces the resilience of ecosystems to external influences.
Thus, climate shifts, anthropogenic pressure, and pyrogenic processes together form a multifactorial mechanism of degradation in WKR, which requires the implementation of adaptive sustainable land use strategies based on the integration of geoinformation analysis, monitoring, and management solutions.
5. Conclusions
The present study enabled a comprehensive assessment of environmental vulnerability across the western regions of Kazakhstan through the application of the MEDALUS model and the use of remote sensing data. The calculation and spatial analysis of the SQI, VQI, CQI, and MQI made it possible to identify spatial degradation patterns and delineate the most ecologically vulnerable areas.
The findings indicate that the MAN and ATR oblasts exhibit the highest levels of vulnerability, where natural limitations—such as arid climate and low bioproductive potential—are compounded by intense anthropogenic pressures, including mining activities, the expansion of linear infrastructure, and overgrazing.
In the context of accelerating climate change and intensifying anthropogenic impacts, the study’s results highlight the urgent need to implement sustainable environmental management practices and to support large-scale geoecological research. Future efforts should focus on a more detailed analysis of the spatial and temporal dynamics of degradation processes, systematic mapping of high-risk areas, and the development of scientifically grounded strategies to stabilize environmental conditions through the use of advanced monitoring technologies and ground-based data. In this context, it seems appropriate to focus on a number of specific directions: the expansion of satellite observation time series for a more detailed analysis of vegetation index dynamics; the integration of remote sensing data with ground-based geobotanical surveys for reliable validation; the development of predictive models of pasture degradation using machine learning methods; and the evaluation of the effectiveness of pilot measures of sustainable land use in arid ecosystems. The implementation of these approaches will significantly enhance both the scientific validity and the practical relevance of the results obtained. Furthermore, to provide a more detailed assessment of ecological vulnerability in the WKR, it is essential to consider individual administrative units. Specifically, for MAN and ATR oblasts, a deeper investigation of technogenic processes is required; for WKO, particular attention should be given to the intensity of pasture load, while for AKT oblast, a comprehensive analysis of the combined impact of technogenic factors and grazing pressure should be undertaken.
Thus, the MEDALUS model has proven to be a highly effective tool for the spatial assessment of environmental vulnerability in the WKR, offering a robust scientific foundation for strategic land use planning and the sustainable development of ecologically sensitive territories.
Author Contributions
Conceptualization, R.S. and K.Z.; methodology, A.T.; software, R.S.; validation, K.Z., R.S. and D.K.; formal analysis, A.T. and D.K.; investigation, R.S. and K.Z.; resources, B.B.; data curation, B.B.; writing—original draft preparation, R.S. and K.Z.; writing—review and editing, R.S.; visualization, A.T. and K.Z.; supervision, A.T.; project administration, A.T.; funding acquisition, A.T. All authors have read and agreed to the published version of the manuscript.
Funding
This research was funded by the Committee of Science of the Ministry of Science and Higher Education of the Republic of Kazakhstan (Grant No. BR21882122 «Sustainable development of natural-industrial and socio-economic systems of the West Kazakhstan region in the context of green growth: a comprehensive analysis, concept, forecast estimates and scenarios»).
Institutional Review Board Statement
Not applicable.
Informed Consent Statement
Not applicable.
Data Availability Statement
Data are contained within the article.
Acknowledgments
We acknowledge the funding received from Committee of Science of the Ministry of Science and Higher Education of the Republic of Kazakhstan.
Conflicts of Interest
The authors declare no conflicts of interest.
References
- Jafari, R.; Bakhshandehmehr, L. Quantitative Mapping and Assessment of Environmentally Sensitive Areas to Desertification in Central Iran. Land Degrad. Dev. 2016, 27, 108–119. [Google Scholar] [CrossRef]
- Ogbue, C.; Igboeli, E.; Ajaero, C.; Ochege, F.U.; Yahaya, I.I.; Yeneayehu, F.; You, Y.; Wang, Y. Remote Sensing Analysis of Desert Sensitive Areas Using MEDALUS Model and GIS in the Niger River Basin. Ecol. Indic. 2024, 158, 111404. [Google Scholar] [CrossRef]
- Ait Lamqadem, A.; Pradhan, B.; Saber, H.; Rahimi, A. Desertification Sensitivity Analysis Using MEDALUS Model and GIS: A Case Study of the Oases of Middle Draa Valley, Morocco. Sensors 2018, 18, 2230. [Google Scholar] [CrossRef]
- UNCCD. Desertification: The Invisible Frontline; UNCCD: Bonn, Germany, 2014. [Google Scholar]
- Gibbs, H.; Salmon, J.M. Mapping the World’s Degraded Lands. Appl. Geogr. 2015, 57, 12–21. [Google Scholar] [CrossRef]
- Pender, J.L. The World Food Crisis, Land Degradation, and Sustainable Land Management: Linkages, Opportunities, and Constraints; CGIAR: Montepellier, France, 2009. [Google Scholar]
- Gaur, M.K.; Squires, V.R. Geographic Extent and Characteristics of the World’s Arid Zones and Their Peoples. In Climate Variability Impacts on Land Use and Livelihoods in Drylands; Springer: Cham, Switzerland, 2018; pp. 3–20. [Google Scholar]
- Assessment, Millennium Ecosystem. Ecosystems and Human Well-Being: Wetlands and Water; World Resources Institute: Washington, DC, USA, 2005; ISBN 1-56973-597-2. [Google Scholar]
- Jiang, L.; Bao, A.; Jiapaer, G.; Guo, H.; Zheng, G.; Gafforov, K.; Kurban, A.; De Maeyer, P. Monitoring Land Sensitivity to Desertification in Central Asia: Convergence or Divergence? Sci. Total Environ. 2019, 658, 669–683. [Google Scholar] [CrossRef]
- Jiang, L.; Jiapaer, G.; Bao, A.; Kurban, A.; Guo, H.; Zheng, G.; De Maeyer, P. Monitoring the Long-Term Desertification Process and Assessing the Relative Roles of Its Drivers in Central Asia. Ecol. Indic. 2019, 104, 195–208. [Google Scholar] [CrossRef]
- Loboda, T.V.; Giglio, L.; Boschetti, L.; Justice, C.O. Regional Fire Monitoring and Characterization Using Global NASA MODIS Fire Products in Dry Lands of Central Asia. Front. Earth Sci. 2012, 6, 196–205. [Google Scholar] [CrossRef]
- Lioubimtseva, E.; Henebry, G.M. Climate and Environmental Change in Arid Central Asia: Impacts, Vulnerability, and Adaptations. J. Arid Environ. 2009, 73, 963–977. [Google Scholar] [CrossRef]
- Temirzhanov, M.B.; Alpamyshov, A.Z.; Abdrakhmanov, A.R.; Mukasheva, M.M.; Ramazanov, M.D. Summary Analytical Report of the Ministry of Agriculture of Kazakhstan on the State and Use of Land in the Republic of Kazakhstan for 2023; Ministry of Agriculture of Kazakhstan: Astana, Kazakhstan, 2023.
- Dubovyk, O.; Ghazaryan, G.; González, J.; Graw, V.; Löw, F.; Schreier, J. Drought Hazard in Kazakhstan in 2000–2016: A Remote Sensing Perspective. Environ. Monit. Assess. 2019, 191, 1–17. [Google Scholar] [CrossRef]
- Higginbottom, T.P.; Symeonakis, E. Assessing Land Degradation and Desertification Using Vegetation Index Data: Current Frameworks and Future Directions. Remote Sens. 2014, 6, 9552–9575. [Google Scholar] [CrossRef]
- Symeonakis, E.; Drake, N. Monitoring Desertification and Land Degradation over Sub-Saharan Africa. Int. J. Remote Sens. 2004, 25, 573–592. [Google Scholar] [CrossRef]
- Yengoh, G.T.; Dent, D.; Olsson, L.; Tengberg, A.E.; Tucker, C.J., III. Use of the Normalized Difference Vegetation Index (NDVI) to Assess Land Degradation at Multiple Scales: Current Status, Future Trends, and Practical Considerations; Springer: Berlin/Heidelberg, Germany, 2015; ISBN 3-319-24112-5. [Google Scholar]
- Eskandari Dameneh, H.; Gholami, H.; Telfer, M.W.; Comino, J.R.; Collins, A.L.; Jansen, J.D. Desertification of Iran in the Early Twenty-First Century: Assessment Using Climate and Vegetation Indices. Sci. Rep. 2021, 11, 20548. [Google Scholar] [CrossRef]
- Khanamani, A.; Fathizad, H.; Karimi, H.; Shojaei, S. Assessing Desertification by Using Soil Indices. Arab. J. Geosci. 2017, 10, 1–10. [Google Scholar] [CrossRef]
- Ancona, V.; Bruno, D.E.; Lopez, N.; Pappagallo, G.; Uricchio, V.F. A Modified Soil Quality Index to Assess the Influence of Soil Degradation Processes on Desertification Risk: The Apulia Case. Ital. J. Agron. 2010, 5, 45–55. [Google Scholar] [CrossRef]
- Emadodin, I.; Reinsch, T.; Taube, F. Drought and Desertification in Iran. Hydrology 2019, 6, 66. [Google Scholar] [CrossRef]
- Sidiropoulos, P.; Dalezios, N.R.; Loukas, A.; Mylopoulos, N.; Spiliotopoulos, M.; Faraslis, I.N.; Alpanakis, N.; Sakellariou, S. Quantitative Classification of Desertification Severity for Degraded Aquifer Based on Remotely Sensed Drought Assessment. Hydrology 2021, 8, 47. [Google Scholar] [CrossRef]
- Tsesmelis, D.E.; Karavitis, C.A.; Oikonomou, P.D.; Alexandris, S.; Kosmas, C. Assessment of the Vulnerability to Drought and Desertification Characteristics Using the Standardized Drought Vulnerability Index (SDVI) and the Environmentally Sensitive Areas Index (ESAI). Resources 2018, 8, 6. [Google Scholar] [CrossRef]
- Elnashar, A.; Zeng, H.; Wu, B.; Gebremicael, T.G.; Marie, K. Assessment of Environmentally Sensitive Areas to Desertification in the Blue Nile Basin Driven by the MEDALUS-GEE Framework. Sci. Total Environ. 2022, 815, 152925. [Google Scholar] [CrossRef]
- Ladisa, G.; Todorovic, M.; Trisorio Liuzzi, G. A GIS-Based Approach for Desertification Risk Assessment in Apulia Region, SE Italy. Phys. Chem. Earth Parts A/B/C 2012, 49, 103–113. [Google Scholar] [CrossRef]
- Trotta, C.; Menegoni, P.; Manfredi Frattarelli, F.M.; Iannetta, M. Assessing Desertification Vulnerability on a Local Scale: The Castelporziano Study Case (Central Italy). Rend. Fis. Acc. Lincei 2015, 26, 421–450. [Google Scholar] [CrossRef]
- Contador, J.F.; Schnabel, S.; Gutiérrez, A.; Pulido, M. Mapping Sensitivity to Land Degradation in Extremadura, SW Spain. Land Degrad. Dev. 2009, 20, 129–144. [Google Scholar] [CrossRef]
- Karamesouti, M.; Panagos, P.; Kosmas, C. Model-Based Spatio-Temporal Analysis of Land Desertification Risk in Greece. CATENA 2018, 167, 266–275. [Google Scholar] [CrossRef]
- Lukic, S.; Baumgertel, A.; Obradovic, S.; Kadović, R.; Beloica, J.; Pantić, D.; Miljković, P.; Belanovic Simic, S. Assessment of Land Sensitivity to Degradation Using MEDALUS Model—A Case Study of Grdelica Gorge and Vranjska Valley (Southeastern Serbia). Iforest—Biogeosci. For. 2022, 15, 163–170. [Google Scholar] [CrossRef]
- Hu, Y.; Han, Y.; Zhang, Y. Land Desertification and Its Influencing Factors in Kazakhstan. J. Arid Environ. 2020, 180, 104203. [Google Scholar] [CrossRef]
- Seitkazy, M.; Beisekenov, N.; Rakhimova, M.; Tokbergenova, A.; Zulpykharov, K.; Kaliyeva, D.; Taukebayev, O.; Levin, E. Soil Erosion Prediction in Western Kazakhstan Through Deep Learning with a Neural Network Approach to LS-Factor Analysis. J. Indian Soc. Remote Sens. 2024, 53, 1215–1226. [Google Scholar] [CrossRef]
- Tokbergenova, A.; Kaliyeva, D.; Askarova, M.; Taukebayev, O.; Salmurzauli, R.; Zulpykharov, K. Analysis of Agricultural Land Condition in Western Kazakhstan from 1991 to 2023: The Impact of Climate Change. Environ. Monit. Assess. 2025, 197, 186. [Google Scholar] [CrossRef] [PubMed]
- Elnashar, A.; Wang, L.; Wu, B.; Zhu, W.; Zeng, H. Synthesis of Global Actual Evapotranspiration from 1982 to 2019. Earth Syst. Sci. Data 2021, 13, 447–480. [Google Scholar] [CrossRef]
- Elnashar, A.; Zeng, H.; Wu, B.; Zhang, N.; Tian, F.; Zhang, M.; Zhu, W.; Yan, N.; Chen, Z.; Sun, Z.; et al. Downscaling TRMM Monthly Precipitation Using Google Earth Engine and Google Cloud Computing. Remote Sens. 2020, 12, 3860. [Google Scholar] [CrossRef]
- Gorelick, N.; Hancher, M.; Dixon, M.; Ilyushchenko, S.; Thau, D.; Moore, R. Google Earth Engine: Planetary-Scale Geospatial Analysis for Everyone. Remote Sens. Environ. 2017, 202, 18–27. [Google Scholar] [CrossRef]
- Khan, R.; Gilani, H. Global Drought Monitoring with Big Geospatial Datasets Using Google Earth Engine. Environ. Sci. Pollut. Res. 2021, 28, 17244–17264. [Google Scholar] [CrossRef]
- Wang, C.; Jia, M.; Chen, N.; Wang, W. Long-Term Surface Water Dynamics Analysis Based on Landsat Imagery and the Google Earth Engine Platform: A Case Study in the Middle Yangtze River Basin. Remote Sens. 2018, 10, 1635. [Google Scholar] [CrossRef]
- Batjes, N.H.; Calisto, L.; de Sousa, L.M. Providing Quality-Assessed and Standardised Soil Data to Support Global Mapping and Modelling (WoSIS Snapshot 2023). Earth Syst. Sci. Data 2024, 16, 4735–4765. [Google Scholar] [CrossRef]
- Ivushkin, K.; Bartholomeus, H.; Bregt, A.K.; Pulatov, A.; Kempen, B.; de Sousa, L. Global Mapping of Soil Salinity Change. Remote Sens. Environ. 2019, 231, 111260. [Google Scholar] [CrossRef]
- Prăvălie, R. Exploring the Multiple Land Degradation Pathways across the Planet. Earth-Sci. Rev. 2021, 220, 103689. [Google Scholar] [CrossRef]
- Radočaj, D.; Jurišić, M.; Rapčan, I.; Domazetović, F.; Milošević, R.; Plaščak, I. An Independent Validation of SoilGrids Accuracy for Soil Texture Components in Croatia. Land 2023, 12, 1034. [Google Scholar] [CrossRef]
- Schillaci, C.; Perego, A.; Valkama, E.; Märker, M.; Saia, S.; Veronesi, F.; Lipani, A.; Lombardo, L.; Tadiello, T.; Gamper, H.A.; et al. New Pedotransfer Approaches to Predict Soil Bulk Density Using WoSIS Soil Data and Environmental Covariates in Mediterranean Agro-Ecosystems. Sci. Total Environ. 2021, 780, 146609. [Google Scholar] [CrossRef] [PubMed]
- Hassani, A.; Azapagic, A.; Shokri, N. Global Predictions of Primary Soil Salinization under Changing Climate in the 21st Century. Nat. Commun. 2021, 12, 6663. [Google Scholar] [CrossRef]
- Mehla, M.K.; Kumar, A.; Kumar, S.; Jhorar, R.K. Chapter 27—Soil Salinity Assessment and Mapping Using Spectral Indices and Geostatistical Techniques—Concepts and Reviews. In Remote Sensing of Soils; Dharumarajan, S., Kaliraj, S., Adhikari, K., Lalitha, M., Kumar, N., Eds.; Elsevier: Amsterdam, The Netherlands, 2024; pp. 429–437. ISBN 978-0-443-18773-5. [Google Scholar]
- Renard, K.G.; Freimund, J.R. Using Monthly Precipitation Data to Estimate the R-Factor in the Revised USLE. J. Hydrol. 1994, 157, 287–306. [Google Scholar] [CrossRef]
- Hu, Y.; Cui, C.; Liu, Z.; Zhang, Y. Vegetation Dynamics in Mainland Southeast Asia: Climate and Anthropogenic Influences. Land Use Policy 2025, 153, 107546. [Google Scholar] [CrossRef]
- Ghobadi, M.; Badehian, Z. Assessment of Agricultural Drought Severity Using Multi-Temporal Remote Sensing Data in Lorestan Region. Sci. Rep. 2025, 15, 18528. [Google Scholar] [CrossRef]
- Gidey, E.; Dikinya, O.; Sebego, R.; Segosebe, E.; Zenebe, A. Analysis of the Long-Term Agricultural Drought Onset, Cessation, Duration, Frequency, Severity and Spatial Extent Using Vegetation Health Index (VHI) in Raya and Its Environs, Northern Ethiopia. Environ. Syst. Res. 2018, 7, 13. [Google Scholar] [CrossRef]
- Bostani, A.M.; Pourebrahim, S. Integrated Fire Risk Assessment Using Time-Series Satellite Data and Multi-Criteria Decision-Making Techniques. Environ. Sustain. Indic. 2025, 28, 100916. [Google Scholar] [CrossRef]
- Chepashev, D.; Nurakynov, S.; Sharma, D.; Sydyk, N.; Kabdulova, G. Mapping Fire Hazard Potential in Kazakhstan: A Machine Learning and Remote Sensing Perspective. Int. J. Wildland Fire 2025, 34, WF24232. [Google Scholar] [CrossRef]
- Zhao, H.; Cheng, Y.; Zhang, X.; Yu, S.; Chen, M.; Zhang, C. A Probabilistic Statistical Risk Assessment Method for Soil Erosion Using Remote Sensing Data: A Case Study of the Dali River Basin. Remote Sens. 2024, 16, 3491. [Google Scholar] [CrossRef]
- Abatzoglou, J.T.; Dobrowski, S.Z.; Parks, S.A.; Hegewisch, K.C. TerraClimate, a High-Resolution Global Dataset of Monthly Climate and Climatic Water Balance from 1958–2015. Sci. Data 2018, 5, 170191. [Google Scholar] [CrossRef]
- Yu, H.; Wang, L.; Zhang, J.; Chen, Y. A Global Drought-Aridity Index: The Spatiotemporal Standardized Precipitation Evapotranspiration Index. Ecol. Indic. 2023, 153, 110484. [Google Scholar] [CrossRef]
- Potapov, P.; Hansen, M.C.; Kommareddy, I.; Kommareddy, A.; Turubanova, S.; Pickens, A.; Adusei, B.; Tyukavina, A.; Ying, Q. Landsat Analysis Ready Data for Global Land Cover and Land Cover Change Mapping. Remote Sens. 2020, 12, 426. [Google Scholar] [CrossRef]
- Bureau of National Statistics of the Republic of Kazakhstan. National Statistics Portal—2021. Available online: https://stat.gov.kz/en/national/2021/ (accessed on 7 September 2025).
- Hu, T.; Yang, J.; Li, X.; Gong, P. Mapping Urban Land Use by Using Landsat Images and Open Social Data. Remote Sens. 2016, 8, 151. [Google Scholar] [CrossRef]
- Liu, B.; Hu, X.; Zhang, Z.; Yu, M. Characterizing Spatio-Temporal Changes of OpenStreetMap Road Networks Using Kernel Density Estimation in China (2014–2021). J. Geovis. Spat. Anal. 2025, 9, 21. [Google Scholar] [CrossRef]
- Bey, A.; Sánchez-Paus Díaz, A.; Maniatis, D.; Marchi, G.; Mollicone, D.; Ricci, S.; Bastin, J.-F.; Moore, R.; Federici, S.; Rezende, M.; et al. Collect Earth: Land Use and Land Cover Assessment through Augmented Visual Interpretation. Remote Sens. 2016, 8, 807. [Google Scholar] [CrossRef]
- Lee, E.J.; Piao, D.; Song, C.; Kim, J.; Lim, C.H.; Kim, E.; Moon, J.; Kafatos, M.; Lamchin, M.; Jeon, S.W.; et al. Assessing Environmentally Sensitive Land to Desertification Using MEDALUS Method in Mongolia. For. Sci. Technol. 2019, 15, 210–220. [Google Scholar] [CrossRef]
- Ferrara, A.; Kosmas, C.; Salvati, L.; Padula, A.; Mancino, G.; Nolè, A. Updating the MEDALUS-ESA Framework for Worldwide Land Degradation and Desertification Assessment. Land Degrad. Dev. 2020, 31, 1593–1607. [Google Scholar] [CrossRef]
- Aboukota, M.; Hassaballa, H.; Elhini, M.; Ganzour, S. Land Degradation, Desertification & Environmental Sensitivity to Climate Change in Alexandria and Beheira, Egypt. Egypt. J. Soil Sci. 2024, 64, 167–180. [Google Scholar] [CrossRef]
- Tokbergenova, A.; Skorintseva, I.; Ryskeldiyeva, A.; Kaliyeva, D.; Salmurzauly, R.; Mussagaliyeva, A. Assessment of Anthropogenic Disturbances of Landscapes: West Kazakhstan Region. Sustainability 2025, 17, 573. [Google Scholar] [CrossRef]
- Adenova, D.; Sapargaliyev, D.; Sagin, J.; Absametov, M.; Murtazin, Y.; Smolyar, V. Assessing Groundwater and Soil Quality in West Kazakhstan amid Climate Impacts and Oil Industry Contamination Risks. Sci. Rep. 2025, 15, 6663. [Google Scholar] [CrossRef]
- Issanova, G.; Abuduwaili, J.; Mamutov, Z.; Kaldybaev, A.; Saparov, G.; Bazarbaeva, T. Saline Soils and Identification of Salt Accumulation Provinces in Kazakhstan. Arid Ecosyst. 2017, 7, 243–250. [Google Scholar] [CrossRef]
- Ramazanova, N.; Ozgeldinova, Z.; Turyspekova, E.; Akhmedova, A.; Tursynova, T.; Toksanbaeva, S.; Demeuov, A.; Ayapbekova, A. The Influence of Recreation on the Processes of Soil Erosion in the Forests of the West Kazakhstan Region. Geoj. Tour. Geosites 2023, 50, 1350–1355. [Google Scholar] [CrossRef]
- Ramazanova, N.; Turyspekova, E.; Ozgeldinova, Z.; Akhmedova, A.; Ayapbekova, A.; Samarkhanov, T.; Khamzaeva, J. Soil Erosion and Impact on Recreational Resources in the Shyngyrlau Basin, Western Kazakhstan: A Multi-Analytical Assessment. Geoj. Tour. Geosites 2023, 51, 1812–1822. [Google Scholar] [CrossRef]
- Nasiyev, B.; Shibaikin, V.; Bekkaliyev, A.; Zhanatalapov, N.; Bekkaliyeva, A. Changes in the Quality of Vegetation Cover and Soil of Pastures in Semi-Deserts of West Kazakhstan, Depending on the Grazing Methods. J. Ecol. Eng. 2022, 23, 50–60. [Google Scholar] [CrossRef]
- Tao, D.; Shi, H.; Gao, C.; Zhan, J.; Ke, X. Water Storage Monitoring in the Aral Sea and Its Endorheic Basin from Multisatellite Data and a Hydrological Model. Remote Sens. 2020, 12, 2408. [Google Scholar] [CrossRef]
- Yesmagulova, B.Z.; Assetova, A.Y.; Tassanova, Z.B.; Zhildikbaeva, A.N.; Molzhigitova, D.K. Determination of the Degradation Degree of Pasture Lands in the West Kazakhstan Region Based on Monitoring Using Geoinformation Technologies. J. Ecol. Eng. 2023, 24, 179–187. [Google Scholar] [CrossRef]
- Shinkarenko, S.; Berdengalieva, A.; Doroshenko, V.; Naichuk, Y. An Analysis of the Dynamics of Areas Affected by Steppe Fires in Western Kazakhstan on the Basis of Earth Remote Sensing Data. Arid Ecosyst. 2023, 13, 29–38. [Google Scholar] [CrossRef]
- Xu, Y.; Lin, Z.; Wu, C. Spatiotemporal Variation of the Burned Area and Its Relationship with Climatic Factors in Central Kazakhstan. Remote Sens. 2021, 13, 313. [Google Scholar] [CrossRef]
- Pilifosova, O.V.; Eserkepova, I.B.; Dolgih, S.A. Regional Climate Change Scenarios Under Global Warming in Kazakhstan. Clim. Change 1997, 36, 23–40. [Google Scholar] [CrossRef]
- Salnikov, V.; Talanov, Y.; Polyakova, S.; Assylbekova, A.; Kauazov, A.; Bultekov, N.; Musralinova, G.; Kissebayev, D.; Beldeubayev, Y. An Assessment of the Present Trends in Temperature and Precipitation Extremes in Kazakhstan. Climate 2023, 11, 33. [Google Scholar] [CrossRef]
- Buketova, N.; Mazhitova, Z.; Saktaganova, Z.; Zhanbossinova, A. The State of Natural Resources of the West Kazakhstan Region (1990s–Early 2000s). E3S Web Conf. 2024, 524, 02003. [Google Scholar] [CrossRef]
- Bazarbayeva, S.M. Dataset on Industrial Waste Compositions in West Kazakhstan and Conditions for Processing Them into Construction Materials. Data Brief 2024, 54, 110265. [Google Scholar] [CrossRef]
- Baubekova, A.; Akindykova, A.; Mamirova, A.; Dumat, C.; Jurjanz, S. Evaluation of Environmental Contamination by Toxic Trace Elements in Kazakhstan Based on Reviews of Available Scientific Data. Environ. Sci. Pollut. Res. Int. 2021, 28, 43315–43328. [Google Scholar] [CrossRef]
- Yessenamanova, M.S.; Kulzhanova, G.; Tlepbergenova, A.E.; Yessenamanova, Z.S.; Batyrbayeva, G. Environmental Monitoring of Water Quality in the Interstate Ural River. J. Phys. Conf. Ser. 2021, 1889, 032007. [Google Scholar] [CrossRef]
- Kakimzhanov, Y.K.; Kyrgyzbay, K.T.; Zhumatayev, S.M.; Bazarbayeva, A.; Kunypiyaeva, G.T. Assessment of Soil Contamination of the West Kazakhstan Region with Heavy Metals as a Result of Industrial Activity. News Natl. Acad. Sci. Repub. Kazakhstan Ser. Geol. Tech. Sci. 2025, 2025, 72–90. [Google Scholar] [CrossRef]
- Yermenbay, A.; Osipov, S.; Livinsky, Y. Groundwater Anthropogenic Pollution in the Oil And Gas Fields of Kazakhstan. In Proceedings of the International Multidisciplinary Scientific GeoConference SGEM 2020, Albena, Bulgaria, 18–24 August 2020; pp. 561–568. [Google Scholar]
- Umarova, G.; Batyrova, G.; Tlegenova, Z.; Kononets, V.; Balmagambetova, S.; Umarov, Y.; Yessengaliyeva, I.; Mamyrbayev, A. Essential Trace Elements in Scalp Hair of Residents across the Caspian Oil and Gas Region of Kazakhstan. Toxics 2022, 10, 364. [Google Scholar] [CrossRef] [PubMed]
- Batyrova, G.A.; Tlegenova, Z.S.; Umarova, G.A.; Kononets, V.I.; Umarov, Y.A.; Kudabayeva, K.I.Y.; Aitmaganbet, P.Z.; Amanzholkyzy, A. Microelement Status of the Adult Population in Western Kazakhstan. Ekol. Cheloveka (Hum. Ecol.) 2021, 28, 42–49. [Google Scholar] [CrossRef]
Disclaimer/Publisher’s Note: The statements, opinions and data contained in all publications are solely those of the individual author(s) and contributor(s) and not of MDPI and/or the editor(s). MDPI and/or the editor(s) disclaim responsibility for any injury to people or property resulting from any ideas, methods, instructions or products referred to in the content. |
© 2025 by the authors. Licensee MDPI, Basel, Switzerland. This article is an open access article distributed under the terms and conditions of the Creative Commons Attribution (CC BY) license (https://creativecommons.org/licenses/by/4.0/).