Abstract
As an important economic growth pole and ecological security barrier in western China, the urban agglomeration in the upper Yellow River has significant strategic significance for regional coordinated development. This research combines the exploratory geographic analysis method, stepwise regression analysis and geographic detector model to reveal the spatial pattern and driving mechanism of the linear river valley urban agglomeration and the band-shaped overall pattern of the urban agglomeration in the upper Yellow River from the perspective of integrated development. The research shows that the integrated development of the urban agglomeration in the upper reaches of the Yellow River presents the spatial characteristics of multi-point linkage and point-axis superposition. The core cities such as Lanzhou, Xining, and Yinchuan drive the multi-dimensional linkage of regional economy, transportation, and ecology, and promote the coordinated development of economy and ecology in the region. High-value areas are concentrated in provincial capitals and areas rich in ecological resources, while edge city cities are in urgent need of policy support due to insufficient infrastructure and resource endowment and low level of development. Progressive regression analysis and geographic detector analysis show that seven factors, such as resource endowment, natural conditions and traffic accessibility, are the key driving forces of regional integrated development, and the research results provide theoretical basis and empirical support for promoting the sustainable development of regional ecology and economy in western China.
1. Introduction
As highly integrated spatial and economic entities, urban agglomeration has become crucial platforms for enhancing global competitiveness, promoting coordinated regional development, and achieving sustainable growth [,]. With the acceleration of the urbanization process, how to balance economic growth and ecological protection in the region has become the key topic of the current research []. The integrated development of urban agglomeration in the upper reaches of the Yellow River is a key strategy to promote regional coordination, ecological security, and economic growth. The Lan-Xi urban agglomeration is increasingly demonstrating its scale advantages and is steadily evolving into a highly integrated metropolitan region centered on Lanzhou and Xining, connected by the Lan-Xi high-speed railway as its central axis []. According to the theory of integrated development, which emphasizes the synergistic evolution of economy, ecology, and society under spatial interdependence, coordinated regional development has become the foundation for sustainable growth []. The integrated development of the urban agglomeration in the upper reaches of the Yellow River holds significant strategic importance for safeguarding national ecological security, supporting the Belt and Road Initiative, and promoting the modernization of Northwest China. The urban agglomeration in the upper reaches of the Yellow River has two functions: it is not only an important ecological barrier in the Yellow River basin, but also a potential support pole for regional economic growth [], in the context of national strategies such as the “Belt and Road” initiative and the construction of new land and sea corridors in western China. The integrated development of the urban agglomeration in the upper reaches of the Yellow River has created new opportunities for regional coordination and sustainable growth []. However, how to effectively integrate the diversified resources, industries, and ecological functions inside and outside the region, and promote the coordinated development of regions, is still a key problem to be solved [].
Existing research has explored various aspects of urban agglomeration development, ranging from ecological–economic coordination to infrastructure and resource allocation, but few have addressed their interrelations. Ecological protection in urban agglomeration can not only guarantee environmental quality, but also provide support for long-term economic growth []. To explore the relationship between transportation infrastructure and regional development, infrastructure construction is recognized as crucial to promoting regional coordination and economic integration []. The study also explores the dynamic coupling relationship between transportation network and urban vitality, and emphasizes the role of transportation infrastructure in promoting the economic integration of urban agglomeration []. The issue of resource allocation within urban agglomerations has also attracted widespread attention. Optimizing the allocation of resource elements and realizing their effective flow is considered to be the basis for promoting regional integrated development []. Several studies have also demonstrated that the relationship between regional coordination, ecological protection, and industrial integration has become increasingly interrelated []. For instance, several studies have examined the spatio-temporal dynamics of resource and environmental carrying capacity [], the quantitative characteristics of construction land [], and spatial patterns of water use efficiency through the Human Green Development Index [].
Although existing studies provide valuable insights into the integrated development of the urban agglomeration in the upper reaches of the Yellow River, most of them analyze ecological, economic, or infrastructural factors separately. What remains insufficiently understood is how these factors interact and jointly influence the integrated development of a loosely connected urban agglomeration in western China. This constitutes the central scientific problem that this study seeks to address. Accordingly, this paper focuses on three specific scientific questions: (1) what is the spatial structure of the upper Yellow River urban agglomeration?, (2) what driving mechanisms determine the degree and pattern of regional integration?, (3) how do economic, ecological, and social subsystems interact to shape coordinated development when interpreted through fusion development theory? By addressing these scientific questions, this study not only deepens the understanding of integrated development dynamics in western China’s emerging urban agglomerations, but also offers insights that are applicable to other ecologically sensitive and spatially fragmented regions worldwide.
2. Materials and Methods
2.1. Research Area
The Yellow River basin originates from the Bayan Kala Mountains in Qinghai Province, China, with a total length of 5464 km and an area of 795,000 square kilometers (including an inland area of 42,000 square kilometers). The main stream of the Yellow River is 3472 km long, with a basin area of 428,000 square kilometers. It is an important ecological barrier and a multi-ethnic integration area in China, but its ecological resource endowment is relatively fragile.
This study refers to the basin division standards of the Yellow River Conservancy Commission and, in combination with natural geographic features and economic linkages, defines the area above Hekou Town in Tuoketuo County as the upper reaches of the Yellow River. Specifically, it includes the Lanzhou–Xining urban agglomeration and the Ningxia Along–Yellow River urban agglomeration. The delineation is based on the guiding documents Development Plan for the Lanzhou–Xining Urban Agglomeration [] and Development Plan for the Ningxia Along–Yellow River Urban Belt []. The study area included 3 provinces, 13 prefecture-level cities, and 52 counties (districts) (Figure 1).
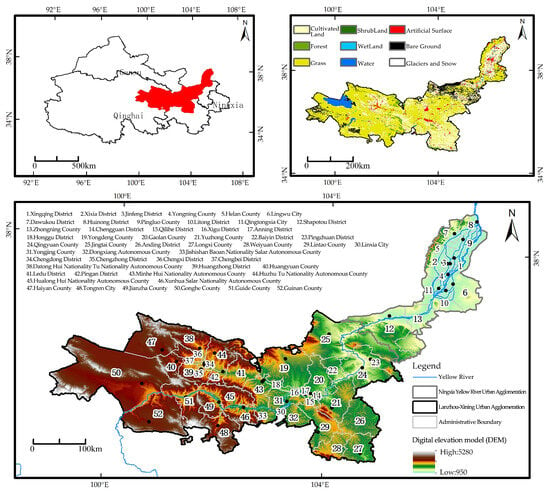
Figure 1.
Location and spatial extent of the study area in the upper reaches of the Yellow River.
2.2. Data Sources
The statistical data used in this study are from the following yearbooks: 2021 China City Statistical Yearbook, China County Statistical Yearbook, Urban Statistical Yearbook of Gansu, Qinghai, and Ningxia provinces, and urban statistical Yearbook of prefecture-level and county-level cities.
Remote sensing data: 2020 Net Primary Productivity of Visible Infrared Imaging Radiometer Suite (NPP-VIIRS) night light data, from the National Aeronautics and Space Administration (NASA) website. We selected the “stable_lights.avg_vis” data, which was used to determine the night light brightness values. Normalized difference vegetation index (NDVI) data, from MODIS13Q1 remote sensing data of NASA, the data is a 16-day synthetic product, used to calculate the vegetation coverage of the upper reaches of the Yellow River in 2018. Elevation and slope data were obtained from the Resources and Environment Data Cloud of the Chinese Academy of Sciences, with a spatial resolution of 30 m and a time period of 2020. Road data are obtained from the Open Street Map (OSM) platform. Raster data of land use status are from Globe Land30 data set in 2020, and nine data types include cultivated land, woodland, grassland, shrub, land, wetland, water body, tundra, man-made surface, and bare land (Table 1).

Table 1.
List of data sources.
The ecosystem service value was evaluated based on the methodology and findings presented in a previously published study by the author [,]. The area with the same attributes in the grid is extracted, and transformed into vector graphics of polygons, and superposition the range of 52 counties (districts) to calculate the ecosystem service value data in the research area.
2.3. Study Methods
2.3.1. Entropy Method
This study uses the entropy value method to measure the integrated development of the urban agglomeration in the upper reaches of the Yellow River.
- (1)
- Standardization of data. To eliminate the effect of different dimensional metrics and ensure that the normalized data are non-zero, the standardized data are translated with the minimal values. The formula for normalization is as follows []:where xij is the original value of the index data for the i-th sample under the j-th indicator, rij is the normalized value of the i-th sample for the j-th indicator, max(xj) and min(xj) are the minimum and maximum values of the j-th indicator, respectively. All index values after normalization are in the range [0, 1].
- (2)
- Calculation of normalized index. For each normalized index, the formula is as follows:where is the normalized value of the i-th sample under the j-th index, is the original value of the i-th sample under the j-th index, n is the number of samples, is the sum of all values of the j-th index.
- (3)
- Calculation of the entropy value. The entropy value for each indicator is calculated as follows:where is the entropy value of the j-th index, is the normalized proportion of the i-th sample under the j-th index, n is the number of samples, ln is the natural logarithm.
Note that 0 < < 1, and the entropy value reflects the uncertainty or information content in the index j.
- (4)
- Calculation of the redundancy. The redundancy of the entropy value is calculated as follows:where is the redundancy of the j-th index, is the entropy value of the j-th index.
- (5)
- Calculation of the weight of each index. The weight of each index is calculated as follows:where wj is the weight of item j-th index, is the redundancy of the j-th index, m is the total number of indicators.
2.3.2. The Spatial Autocorrelation
- (1)
- The global spatial autocorrelation analysis method mainly measures the degree of average correlation between cities. The common Moran index (Moran I) measures the spatial correlation of the integrated development of urban agglomeration in the upper reaches of the Yellow River. The specific calculation formula is as follows []:where n is the total number of cities in the study area, is the observed value of the study index of the i city in the study area, is the spatial weight matrix, (i, j) elements represent the spatial distance difference between cities i and j, and Z is the distance difference. Moran I index reflects spatial autocorrelation: value less than 0 indicates negative spatial autocorrelation, large difference and discretization; value greater than 0 indicates positive spatial autocorrelation, close relationship and strong aggregation; index of 0 indicates no spatial autocorrelation and random distribution. is the element of the spatial weight matrix , which represents the spatial adjacency relationship between cities i and j; was constructed based on the Contiguity-based spatial weight matrix, meaning that two prefecture-level cities are considered neighbors if they share a common boundary or vertex. The weight matrix was row-standardized to ensure comparability.
- (2)
- The local spatial autocorrelation analysis method mainly measures the degree of spatial correlation between a certain city and neighboring cities []. The spatial correlation of the integrated development of the urban agglomeration in the upper reaches of the Yellow River was measured using Moran’s I.
- (3)
- In addition, to test the statistical significance and robustness of the spatial clustering results, we referred to the comparative analytical framework of Akbar et al. (2025) [], which provides a methodological reference for quantitative spatial analysis under complex environmental conditions.
2.3.3. Kernel Density Analysis
Kernel density analysis is a spatial analysis method to estimate the concentration degree of the points with a regular moving square. The calculation formula is as follows []:
where f (s) is the kernel density calculation function of regional spatial position s; h is the distance decay threshold; n is the number of element points whose distance from spatial position s is less than or equal to h; k function is a function of spatial weight.
2.3.4. Stepwise Regression Model
Through stepwise regression analysis, the independent variables with significant effects were screened one by one to establish the best regression equation and study the influence factor. The calculation formula is as follows []:
where y is the dependent variable, x1, x2, … xn is an independent variable, b0 is a constant term.
2.3.5. Geographic Detector
- (1)
- Factor detection
The geographic detector reveals the influence of spatial heterogeneity by calculating the explanatory force (q-value) of the driver factor on the target variable, as expressed in Formula []:
where q is the influence of the spatial connection in the study area; N is the number of cities in the city cluster; Nh is the sample number of sub-level cities; L is the number of secondary cities; σ is the variance of spatial connection in the study area; and σh is the variance of spatial connection in the study area. The range of q is [0, 1], the higher the value indicates that the stronger the explanatory power of different independent variables X on the dependent variable Y, and the weaker the opposite.
- (2)
- Interactive detection
It can quantitatively represent whether the explanatory power of two dependent factors is enhanced or decreased, or independent of each other []. The detection method is to calculate the q-values of the two variables Xi and Xj in the study area, q (Xi) and q (Xj), and calculate the q-value, q(Xi∩Xj), and compare them.
In this study, both regression analysis and the GeoDetector model were employed to comprehensively examine the driving mechanisms of regional development. Regression analysis was used to quantify the direction and magnitude of the relationships among variables under parametric assumptions, while the GeoDetector model was applied to detect spatial heterogeneity and assess the explanatory power of each factor without assuming linearity. The combination of these two approaches allows for complementary insights—linking statistical inference with spatial pattern detection—to ensure a more robust and integrated methodological framework.
3. Results
3.1. Establish the Index System
The upper reaches of the Yellow River are not only the ecological barrier of the country, but also the potential support pole of regional economic growth. The construction of the index system should be based on policy orientation, regional characteristics, and scientific principles [,], and reflect the core concept of ecological priority and sustainable development. Therefore, this study comprehensively considers the four dimensions of ecology, economy, society, and resources, and constructs a multi-level index system (Table 2), aiming to comprehensively evaluate the integrated development level and synergistic effect of the urban agglomeration in the upper reaches of the Yellow River, and provide theoretical support and practical guidance for regional coordinated development.
Table 2.
Evaluation index of the integrated development of urban agglomeration in the upper reaches of the Yellow River.
3.2. Level of Integrated Development
The calculation results of the entropy weight method (Formulas (1)–(5)) in the upper reaches of the Yellow River are shown in Table 1. The weights of resource endowment, economic development, social people’s livelihood, and ecological environment were 0.156, 0.251, 0.338, and 0.255, respectively. Therefore, the integrated development level of the urban agglomeration in the upper reaches of the Yellow River was evaluated accordingly. We performed a spatial analysis of the results, and Figure 2 shows the final results. It is divided into five categories by the natural fracture method.
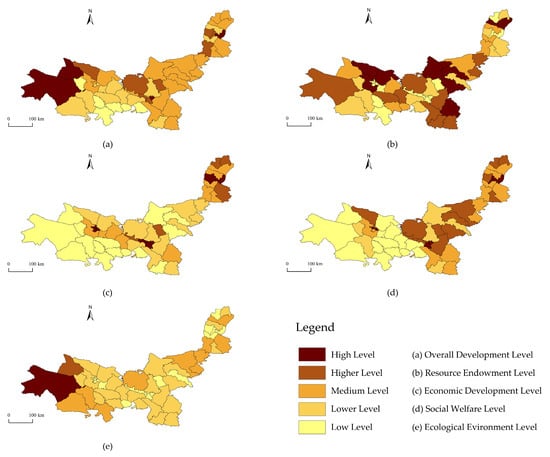
Figure 2.
Spatial distribution of integration development level.
The results show that the upper reaches of the Yellow River show the spatial characteristics of “multi-point linkage” and “point-axis” superposition. The three provincial capitals—Lanzhou, Xining, and Yinchuan—have played a leading role in promoting regional economic and ecological development and driving growth in the upper reaches of the Yellow River. High-level cities such as Republic County and Haiyan County promote green development through the efficient use of ecological resources. However, some remote cities, such as Tongren City and Xunhua County, still face the challenges of weak economic foundation and insufficient infrastructure. In terms of resource endowment, the upper reaches of the Yellow River have formed a stable agricultural industrial economic belt in the core areas of Gansu, Ningxia, and Qinghai provinces, promoting the combination of modern agriculture and ecological protection. High-level cities improve the efficiency of resource utilization through agricultural resources and ecological advantages. Higher level cities such as Hualong County and Gonghe County represent the development mode of circular agriculture and animal husbandry in the surrounding area of Qinghai, which further expands the influence of areas with high-resource endowment. The level of economic development has been significantly improved, and the provincial capitals Lanzhou, Yinchuan, and Xining have become the core of the multi-center economic pattern. Gradually through the radiation effect of Lanbai metropolitan circle, Yinchuan and Xining economic circle through the central city, promoting the linkage and integrated development of surrounding cities. However, some remote areas, such as Dongxiang County and Hualong County, are still weak in transportation and industrial foundation in a relatively backward state. In terms of people’s livelihood, the upper reaches of the Yellow River present a multi-core development pattern. High-level cities are mainly concentrated in the provincial capitals of Lanzhou, Yinchuan, and Xining and their surrounding areas. The number of cities of higher level accounted for 26.92%, forming a people’s livelihood development belt along the upper reaches of the Yellow River. However, some remote areas in Qinghai, especially Haiyan and Republican counties, still face great challenges in terms of infrastructure and social security. There are obvious spatial differences in the ecological environment level. High-level cities such as Republic County and Haiyan County rely on high-quality ecological resources to promote green development. Some medium-level cities, such as Guide, Yongdeng, and Pingluo counties, have achieved good results in ecological protection and resource restoration, forming an ecological restoration belt along the Yellow River. However, the economically developed cities, such as Chengguan District, Anning District, and Qilihe District, face great ecological pressure in the process of resource development and urban construction, and the ecological environment problems are relatively severe.
3.3. Spatial Pattern of Integrated Development
3.3.1. Global Autocorrelation
Using Formula (6), the ArcGIS10.8 was used to calculate Moran’s I index, Z-score, and p value for the integrated development level of the urban agglomeration in the upper reaches of the Yellow River. The results are shown in Figure 3. Moran’s I values for overall development, resource endowment, economic growth, social people’s livelihood, and ecological environment are all positive, and their p value are below 0.1. This indicates a statistically significant global positive spatial autocorrelation at the 90% confidence level.
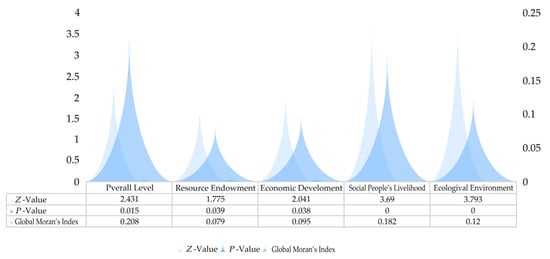
Figure 3.
Global Moran index of urban agglomeration in the upper reaches of the Yellow River.
Resource endowment and economic development: The advantages of resource endowment and economic development are concentrated in core cities such as Lanzhou, Yinchuan, and Xining, and their surrounding areas. These cities exhibit a strong agglomeration effect that promotes efficient resource allocation and regional economic clustering. Economic activities are increasingly concentrated spatially, with nearby cities gradually integrating into the radiation zone of the economic core.
Social people’s livelihood and ecological environment: With the improvement of infrastructure and public services, disparities in living standards among cities have narrowed, forming a more concentrated pattern of social people’s livelihood. In contrast, the ecological environment shows a relatively dispersed spatial distribution. High-value ecological areas—such as Haiyan County and Gonghe County in Qinghai Province—are spatially clustered, but overall distribution remains uneven. Some cities face great ecological pressure, reflecting the imbalance between ecological protection and resource development.
3.3.2. Local Autocorrelation
Based on Moran scatter plot analysis of GeoDA software (version 1.20), the spatial autocorrelation in the upper reaches of the Yellow River showed significant agglomeration distribution characteristics, as shown in Figure 4. The integrated development and resource endowment of the upper reaches of the Yellow River show an obvious trend of spatial agglomeration.
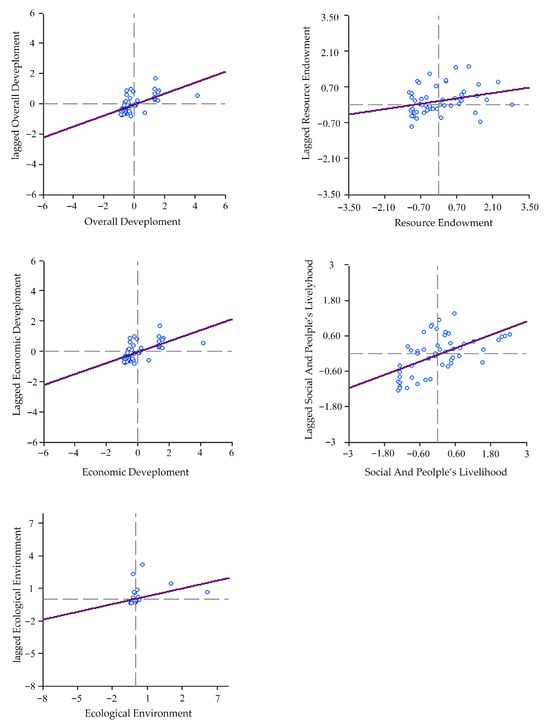
Figure 4.
Moran’s I scatter plots of the integrated development and its four dimensions of urban agglomeration in the upper reaches of the Yellow River.
The core cities (Lanzhou, Xining, Yinchuan) and surrounding areas form high-value gathering areas with prominent advantages in resource endowment, which promote the effective allocation and development of resources. Despite the relative concentration of high-value areas, they still show some dispersion overall, and some low-value areas are scattered. Economic activities show the agglomeration effect of provincial capitals, and Lanzhou, Xining, and Yinchuan promote the economic growth of surrounding cities through the radiation effect, forming a centralized economic space model. The ecological environment shows a discrete distribution, and the high-value ecological areas, such as Republican counties and Haiyan counties, are concentrated, but the overall distribution is relatively scattered, reflecting the imbalance between resource development and ecological protection. The social people’s livelihood level shows a gathering trend, and the social welfare of provincial capitals and their surrounding areas is relatively high, while remote cities (such as parts of Qinghai and Gansu) have a large gap in people’s livelihood, which is manifested as scattered spatial distribution.
3.3.3. Kernel Density Distribution Analysis
The agglomeration and distribution characteristics of the upper reaches of the Yellow River are calculated by the kernel density (Formula (7)). Figure 5 shows the use of the natural fracture method to classify the results into five categories.
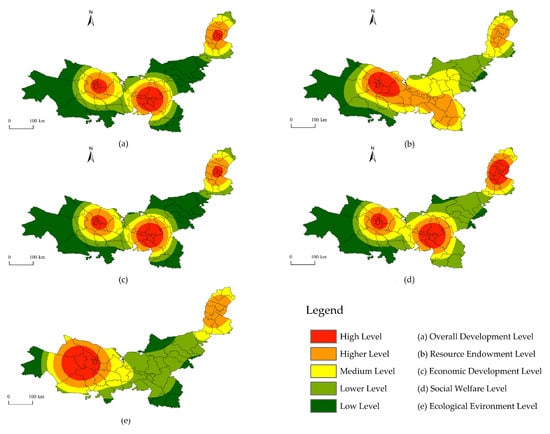
Figure 5.
Kernel density estimation of the spatial distribution.
- (1)
- Spatial agglomeration and multi-center development. The urban agglomeration in the upper reaches of the Yellow River presents a spatial structure of “multi-center agglomeration”. Lanzhou, Xining, and Yinchuan, as the core cities, promote the integration and agglomeration of the surrounding areas. Through the “point-axis” mode, the core city and the surrounding cities form different linkage effects. The high-density area of Gansu revolves around Lanzhou, Linxia, and Baiyin, forming a diamond-shaped spatial structure. In Qinghai, the high-density area is centered on Xining and presents a linear (“one-shaped”) spatial distribution pattern. The agglomeration area of Ningxia surrounds Yinchuan with a “back character” structure. These high-density areas concentrate resources, economic and social functions, and promote the coordinated development of the urban agglomeration in the upper reaches of the Yellow River.
- (2)
- Formation of resource endowment and agricultural economic belt. The spatial distribution of resource endowment in the upper reaches of the Yellow River shows a significant agglomeration effect. Datong County, Huzhu County, and Ledu District in Qinghai Province have formed an efficient development area where agriculture and ecological resources gather. Especially under the mode of “integrated planting and breeding”, the output of grain and cash crops has been significantly increased. Relying on the advantages of agricultural industry and resources, Lanzhou, Linxia and Baiyin in Gansu province have promoted the win-win development of modern agriculture and ecological protection, forming a green agricultural economic belt along the Yellow River. The “inverted U-shaped” and “diamond-shaped” structures in Qinghai and Gansu provinces strengthen the agglomeration effect of high-resource endowment areas, improve the efficiency of resource utilization, and promote the construction of a green and efficient agricultural system.
- (3)
- Economic development and regional integration. The economic development of the urban agglomeration in the upper reaches of the Yellow River shows the strong agglomeration effect of Lanzhou, Xining, and Yinchuan. These core cities drive the economic growth of surrounding areas through a spillover effect, forming a multi-core economic circle centered on the provincial capitals and gradually expanding outward. Lanbai metropolitan area, Yinchuan, Xining economic circle, and other regions, by promoting the city scale economy and radiation effect, promote the integration and coordinated development of regional economy.
- (4)
- Social people’s livelihood and unbalanced development. The high-density areas of the upper reaches of the urban agglomeration of the Yellow River have formed a multi-center radiation of social people’s livelihood promotion belt, mainly concentrated in provincial capitals and peripheral areas. However, remote cities, such as Haiyan County in Qinghai Province and Dongxiang County in Gansu Province, despite their good resource endowment, still face challenges from infrastructure and social security, which are reflected in the low level of social people’s livelihood and scattered spatial distribution.
- (5)
- The spatial distribution of the ecological environment is strongly discrete in Xining City, Haidong City, and Huangnan Prefecture, especially in Huangzhong District, Haiyan County, and Guide County. The ecological environment quality has been significantly improved, forming the ecological “green belt” in the upper reaches of the Yellow River. Through the agglomeration effect of ecological restoration zones, these regions not only provide important support for ecological protection, but also ensure the sustainable management of the water source of the Yellow River. The Hehuang Valley and the Pan-Gonghe Basin, as comprehensive treatment areas, have promoted the construction of a green ecological corridor in the Yellow River basin and realized the restoration of the ecological environment. The river ecological belt of the Yellow River is formed in Ningxia and Gansu provinces, connecting Huinong District and Zhongning County, forming the ecological security barrier of Helan Mountain extending to the north and south, providing a key guarantee for the ecological security of the Yellow River basin.
3.4. Influencing Factors
The urban agglomeration in the upper reaches of the Yellow River has unique geographical, ecological, and economic characteristics, faces challenges such as water shortage and ecological fragility, and also has rich agricultural resources and geographical advantages. The integrated development of the region needs to find a balance between promoting economic growth and ecological protection, and make full use of the resource advantages and industrial potential in the region. For this reason, referring to relevant documents [,], this study selected key impact factors including natural resource utilization, ecological and environmental protection, economic structure optimization, infrastructure connectivity, and government coordination ability (Table 3) to deeply analyze how to achieve efficient integration and sustainable development under resource endowment and environmental pressure.
Table 3.
Index system of influencing factors.
3.4.1. Analysis of the Influencing Factors Based on the Stepwise Regression Model
- (1)
- Correlation Test
The correlation test results were obtained by using the city group level (y) in the upper reaches of the Yellow River as the dependent variable and 13 influencing factors (X) as the independent variables (Table 4).
Table 4.
Correlation analysis between the integrated development index and its influencing factors.
The results show that the integrated development level of the upper reaches of the Yellow River was positively correlated with X5, X8, X11, X12, and X6, and the correlation coefficient was 0.895, 0.846, 0.810, 0.610, and 0.397, respectively, and all reached the significance level of 0.01. However, there was a significant negative correlation with X1 and X10 with correlation coefficients of −0.492 and −0.474, and a significance level of 0.01. There was no significant correlation with X2, X3, X4, X7, X9, and X13, and the correlation coefficient was close to 0, and the p-values were all greater than 0.05.
- (2)
- Stepwise regression analysis
The dependent variables and independent variables that passed the correlation test were sorted out, and the gradual regression analysis was conducted using Statistical Package for the Social Science (SPSS) software (version 19.0) platform to select the regression equations with high goodness of fit and good model interpretation power. The results are shown in Table 5.
Table 5.
Summary of stepwise regression models.
According to the model treatment, the X1, X5, X8, X11, X13, by explaining 89.3% of the changes in the upper reaches of the Yellow River, the R square value was 0.893, and the model passed the F test (F = 76.466, p = 0.000 < 0.05).
The final model formula of the stepwise regression is y = 0.095 − 0.001 X1 + 0.001 X5 + 0.000 X8 − 0.000 X11 + 0.048 X12, as shown in Table 6.
Table 6.
Stepwise regression model results.
The multicollinearity test indicates that while most VIF values are below 10, variables X8 and X11 exceed this threshold (17.654 and 18.438), revealing potential multicollinearity. Stepwise regression, though effective in identifying key predictors, may introduce overfitting and collinearity risks. Considering both statistical and theoretical criteria, the final model is deemed acceptable, with the D-W value (−2) suggesting no autocorrelation. X1 and X11 negatively influence the spatial differentiation of the upper Yellow River urban agglomeration, while X5, X8, and X12 show positive impacts.
The results show that X1 has a significant negative effect (β = −0.001, t = −4.072, p = 0.000); X5, X8, and X12 are 0.001 (p = 0.001), 0.000 (t = 3.072, p = 0.004), and 0.048 (t = 2.0288, p = 0.027); X11 has a significant negative effect (β = −0.000, and t = −2.171, p = 0.035).
3.4.2. Analysis of the Influencing Factors Based on the GeoDetector Model
The level of integrated development was used as the independent variable. Since the raw data are all numerical quantity, the combination of expert scoring method and natural fracture method is adopted to change the type-quantity. The results are summarized below, and Figure 6 presents the factor detection outcomes.
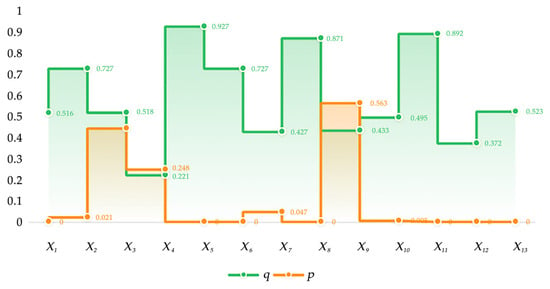
Figure 6.
The single-factor detection results of the influencing factors of the integrated development level.
The results show that the highest q-values were observed for X5 (0.927), X11 (0.871), and X8 (0.892). Among them, X5 representing the economic level, serves as the core driving force of integration, playing the most significant role. In the upper reaches of the Yellow River, where water and agricultural resources are abundant, industrial diversification and the improvement of market mechanisms promote factor mobility and optimize resource allocation. X11 (q = 0.871) reflects the degree of openness. Under the framework of the Belt and Road Initiative, it has generated a strong radiation effect, promoting regional cooperation and international development. X2 (q = 0.727) and X1 (q = 0.516) provide material support for water-intensive industries and agricultural production, thereby improving the efficiency of water resource utilization. X7 (q = 0.427) enhances spatial connectivity and transportation mobility between cities. However, X3 (q = 0.518) and X4 (q = 0.221) exert relatively weak driving effects. This suggests that balancing the development of resource-intensive industries with ecological sustainability remains a major challenge for the region.
Figure 7 shows the interaction detection results. Results: It can be seen that among all the influencing factors (independent variables) of the integrated development of the upper reaches of the Yellow River, the interaction between the two independent variables and the spatial pattern of the integrated development level is greater than the separate effect of a single independent variable. In particular, the four factors X2, X5, X8, and X11 showed significant enhancement effects under both isolation and interaction.
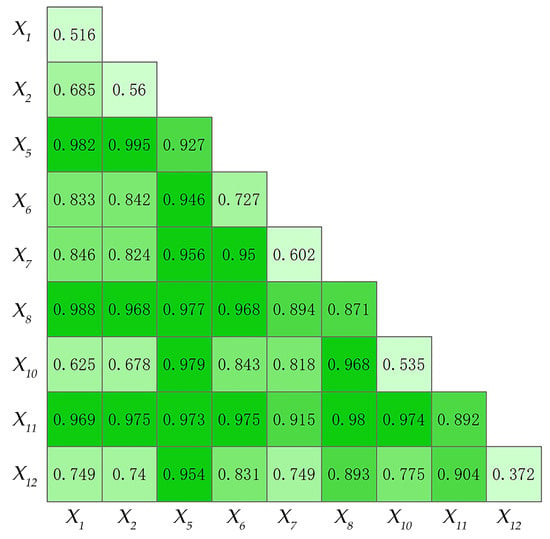
Figure 7.
Interaction detection results of influencing factors on the integrated development level.
From the perspective of interaction types, first, there is a strong linear correlation between X5 and X1, X8, X7, and X11, reflecting the close relationship between Gross Domestic Product (GDP) and economy and transportation. The interaction has an enhancement effect, indicating that the economic aggregate is the key factor to promote the level of urban agglomeration in the upper reaches of the Yellow River, emphasizing the synergistic effect of food security, agricultural ecological modernization, and transportation infrastructure construction, and providing empirical support for policy making. Second, the linear correlation between X11 and X7, X12, and X11 shows that the traffic highway network promotes the linkage development of regional economy by optimizing the relationship between time efficiency and spatial distance. At the same time, strengthening the economic radiation effect of provincial capital cities can accelerate the expansion of provincial foreign economy, and then improve the overall integrated development level of the upper reaches of the Yellow River urban agglomeration.
3.4.3. Comparison of the Results
Through gradual regression analysis and different methods of geographic detector, the results of the driving mechanism are compared. There are five common independent variables, namely, X1, X5, X8, X11, and X12, which are also the main factors affecting the level change in the urban agglomeration in the upper reaches of the Yellow River. The results of the GeoDetector heterogeneity analysis further indicate that X2, X13, X10, X6, and X7 also serve as important driving factors influencing the level of integrated development in the upper reaches of the Yellow River. These variables act as complementary mechanisms to the main driving factors identified earlier, jointly shaping the regional development pattern. In total, ten key driving factors were identified, which can be classified into seven major categories: resource endowment, natural conditions, ecological–economic dynamics, consumer demand, transportation accessibility, policy impetus, and locational potential (Figure 8).
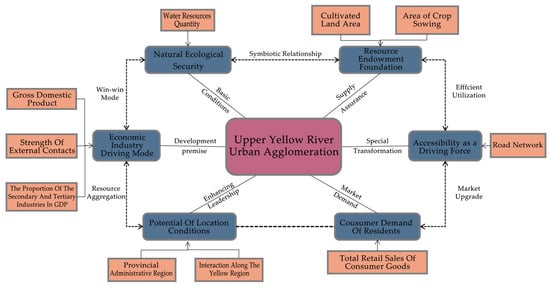
Figure 8.
Dynamic mechanism analysis of the integrated development.
The integrated development of the urban agglomeration in the upper reaches of the Yellow River is driven by multiple factors. Resource endowment optimizes agricultural industrial structure, promotes spatial differentiation and forming industrial clusters. Natural ecological conditions, especially the allocation of water resources, support land use, ecological protection, and agricultural production. Economic industry promotes gross production, external economy, and industrial structure. Industrial adjustment through consumer demand. Traffic accessibility enhances the urban linkage and agglomeration effect through highway network construction. Policy and location pattern promote the interaction of provincial administrative regions and central cities along the Yellow River. These driving factors cooperate to promote regional integration and economic and efficient allocation, providing theoretical support and empirical basis.
4. Discussion
- (1)
- This study reveals the spatial structure of “multi-core, axial, and ribbon” organization in the upper reaches of the Yellow River, highlighting a development model led by Lanzhou as the core and Xining and Yinchuan as sub-centers. Unlike the compact polycentric systems of the Yangtze River Delta or the Beijing–Tianjin–Hebei region [], this configuration demonstrates a looser but ecologically interdependent structure. Such differentiation suggests that integration here is driven not only by economic agglomeration but also by ecological constraints and resource complementarity, expanding the theoretical understanding of coordinated regional development.
- (2)
- Compared with previous studies emphasizing transportation and industrial specialization as integration drivers [,], this study identifies a dual mechanism of ecological interdependence and economic linkage. The Lanbai metropolitan area functions as an economic growth pole, while ecological corridors such as the Pan-Republican Basin and Helan Mountain enhance spatial connectivity. This model illustrates how urban agglomeration in the upper reaches of the Yellow River can achieve integration through ecological–economic synergy rather than pure market density, offering a new conceptual framework for sustainable regional development.
- (3)
- Sub-central cities such as Xining and Yinchuan serve as mediating hubs balancing ecological protection and socioeconomic growth. This pattern contrasts with coastal agglomerations dominated by economic efficiency, suggesting that integration under ecological constraints requires coordination between environmental carrying capacity and industrial upgrading. From an integration perspective, ecological and economic systems in inland areas can evolve jointly rather than competitively.
- (4)
- Policy implications. Economic level (X5, q = 0.927), openness (X11, q = 0.871), and innovation capacity (X8, q = 0.892) are key drivers. Policies should promote industrial upgrading, innovation, and openness in core cities. Resource endowment (X1, q = 0.516) and water resources (X2, q = 0.727) call for integrating ecological corridors such as Helan Mountain and the Pan-Republican Basin into planning. Transportation (X7, q = 0.427) and location (X12) highlight the need to improve infrastructure in peripheral areas.
- (5)
- Overall, the findings support innovation-led, eco-coordinated, and well-connected regional development. This case study also offers insights for other ecologically constrained and spatially dispersed urban regions worldwide, showing that integrated development can be achieved through ecological–economic coupling, corridor-based spatial linkages, and coordinated governance approaches. Nevertheless, the study has limitations: it relies on regional-scale data that may not fully reflect micro-level interactions, employs spatial models that emphasize static patterns, and applies a theoretical framework that could be complemented by more dynamic or multi-scalar analytical tools. Future research should incorporate finer-scale ecological and socioeconomic data, utilize dynamic modeling to explore long-term integration trajectories, and conduct comparative analyses across different global ecological regions to further test the applicability of the mechanisms identified in this study.
5. Conclusions
This study aimed to explore the spatial structure, influencing factors, and driving mechanisms of the integrated development of the urban agglomeration in the upper reaches of the Yellow River, by combining spatial autocorrelation analysis, regression analysis, and the GeoDetector model. The results provide empirical insights into the spatial coordination and sustainable development of northwestern China.
- (1)
- The integrated development level of the urban agglomeration in the upper reaches of the Yellow River exhibits a spatial pattern characterized by “multi-point linkage” and “point–axis superposition,” reflecting economic, ecological, and social agglomeration. High-value areas are concentrated in Lanzhou, Xining, Yinchuan, and ecologically rich regions such as Gonghe and Haiyan. Marginal areas such as Tongren, Xunhua, and Jishishan require targeted policy and infrastructure support.
- (2)
- The spatial structure exhibits a “multi-center and axial agglomeration” pattern. Provincial capitals serve as regional growth poles, forming industrial, transport, and ecological linkages through radiation effects. Lanzhou drives Dingxi and Baiyin, Xining extends through the Hehuang Valley, and Yinchuan develops along the Yellow River corridor. The Pan-Republican Basin and Helan Mountain corridors act as key ecological and green development nodes.
- (3)
- Regression and GeoDetector analyses jointly identify the key driving factors of integrated development. Regression results highlight the importance of economic and ecological variables, while GeoDetector results emphasize natural conditions, resource endowment, and transport accessibility. Together, they reveal the complementary roles of economic growth and ecological protection.
- (4)
- Overall, integrated development is driven by seven potential forces: resource endowment, natural conditions, ecological–economic linkages, consumer demand, transportation accessibility, policy support, and locational advantage. These factors jointly enhance regional integration, improve resource allocation efficiency, and strengthen economic connectivity, offering practical insights for regional policy and planning.
Author Contributions
H.G.: Conceptualization; Data curation; Funding acquisition; Visualization; Software; Writing—original draft; D.W.: Validation; X.Z.: Formal analysis; Z.W.: Data curation; Software assistance; Visualization; Z.Y.: Investigation; F.G.: Methodology. All authors have read and agreed to the published version of the manuscript.
Funding
This work was supported by the Gansu Provincial Department of Education university teachers innovation fund project grant number 2025B-066; Lanzhou youth science and technology talent innovation project grant number 2024-QN-169.
Institutional Review Board Statement
Not applicable.
Informed Consent Statement
Not applicable.
Data Availability Statement
The original contributions presented in this study are included in the article. Further inquiries can be directed to the corresponding author.
Acknowledgments
We thank our colleagues for their insightful comments on an earlier version of this manuscript.
Conflicts of Interest
Authors Xing Zhen Zang was employed by the company Gansu Provincial Transportation Planning and Surveying Design Institute Co., Ltd.
References
- Meng, Q.X.; Zhang, Z.H.; Fei, X.F.; Guo, Y.X.; Rui, X. Scale Optimization of Urban Agglomeration Based on the Connection Strength Between Cities Under the Framework of Sustainable Development. Environ. Dev. Sustain. 2023, 26, 20209–20232. [Google Scholar] [CrossRef]
- Liu, A.B.; Tan, T.T.; Shi, S.X.; Zhao, W.J.; Ke, S.H.; Zhang, F.S. Trade-Off and Coordination Between Development and Ecological Protection of Urban Agglomeration Along Rivers: A Case Study of Urban Agglomeration in the Shandong Section of the Lower Yellow River. Land 2024, 13, 1368. [Google Scholar] [CrossRef]
- Tong, H.L.; Shi, P.J.; Luo, J.; Liu, X.X. The Structure and Pattern of Urban Network in the Lanzhou-Xining Urban Agglomeration. Chin. Geogr. Sci. 2020, 30, 59–74. [Google Scholar] [CrossRef]
- Li, G.; He, X.; Feng, Y. The Coordination of Beijing-Tianjin-Hebei Region: Analysis Framework, Practice Progress and Path Optimization. Urban Dev. Stud. 2024, 31, 19–27. [Google Scholar]
- Brierley, G.J.; Han, M.Q.; Li, X.L.; Li, Z.W. Geo-Eco-Hydrology of the Upper Yellow River. Wires Water 2022, 9, e1587. [Google Scholar] [CrossRef]
- Fulton, J. Regions in the Belt and Road Initiative. Indian Ocean Reg. 2020, 16, 371–373. [Google Scholar] [CrossRef]
- Zha, Q.F.; Liu, Z.; Song, Z.H.; Wang, J. A Study on Dynamic Evolution, Regional Differences and Convergence of High-Quality Economic Development in Urban Agglomeration: A Case Study of Three Major Urban Agglomerations in the Yangtze River Economic Belt. Front. Environ. Sci. 2022, 10, 1012304. [Google Scholar] [CrossRef]
- Zhang, H.; Wei, X. Border Effects Within a City and Regional Coordinated Development in Emerging Economies. Financ. Res. Lett. 2022, 50, 103304. [Google Scholar] [CrossRef]
- Yang, Y.; Li, S.M.; Su, Z.X.; Fu, H.; Wang, W.B.; Wang, Y. Research on the Ecological Innovation Efficiency of the Zhongyuan Urban Agglomeration: Measurement, Evaluation and Optimization. Sustainability 2023, 15, 14236. [Google Scholar] [CrossRef]
- Smith, J.; Johnson, L.; Lee, T. River Valley Urban Network and Morphology: A Study on the Urban Morphology Evolution of Lanzhou. PLoS ONE 2024, 19, e0302686. [Google Scholar] [CrossRef]
- Liang, Z.; Wang, S. Dynamic Coupling Between Transportation Networks and Urban Vitality in the Lanzhou–Xining Urban Agglomeration. Front. Earth Sci. 2024, 12, 1349398. [Google Scholar] [CrossRef]
- Zhou, H.Y.; Zhang, L.T.; Yang, Y.W.; Li, Q.F.; Qian, F.Y. Review of Spatial Layout Planning Methods for Regional Multi-Station Integration. Front. Energy Res. 2024, 12, 1501450. [Google Scholar] [CrossRef]
- Wang, Y.; Fan, J. A Systematic Review of One Hundred Years of Research on Resource and Environmental Carrying Capacity. Acta Geogr. Sin. 2023, 78, 2676–2693. [Google Scholar]
- Zhang, H.X.; Zhao, X.J.; Ren, J.; Hai, W.J.; Guo, J.; Li, C.Y.; Gao, Y.P. Research on the Slope Gradient Effect and Driving Factors of Construction Land in Urban Agglomerations in the Upper Yellow River: A Case Study of the Lanzhou–Xining Urban Agglomerations. Land 2023, 12, 745. [Google Scholar] [CrossRef]
- Li, P.; Shi, P.J. Spatiotemporal Evolution of Water Use Efficiency in Water Conservation Areas in the Upper Reaches of the Yellow River: A Case Study of the Lanzhou-Xining Urban Agglomeration. IOP Conf. Ser. Mater. Sci. Eng. 2020, 768, 052080. [Google Scholar] [CrossRef]
- State Council of the People’s Republic of China. Development Plan for the Lanzhou-Xining Urban Agglomeration; State Council of the People’s Republic of China: Beijing, China, 2018; Volume 8, pp. 8–9.
- People’s Government of Ningxia Hui Autonomous Region. Notice of the People’s Government of the Autonomous Region on Agreeing to Implement the Development Plan for the Yellow River-Alongside Cities Corridor in Ningxia; People’s Government of Ningxia Hui Autonomous Region: Yinchuan, China, 2009; Volume 21, pp. 23–24.
- Guan, H.Y.; Bai, Y.P.; Zhang, C.Y. Research on Ecosystem Security and Restoration Pattern of Urban Agglomeration in the Yellow River Basin. Sustainability 2022, 14, 11599. [Google Scholar] [CrossRef]
- Guan, H.Y.; Bai, Y.P.; Tang, Y.Y. Spatial Identification and Optimization of Ecological Network in Desert-Oasis Area of Yellow River Basin, China. Ecol. Indic. 2023, 147, 109999. [Google Scholar] [CrossRef]
- Wang, H.; Yue, P. Short-Term Traffic Flow Prediction of Coastal Cities Based on Entropy Weight Method. J. Coast. Res. 2020, 103, 739–743. [Google Scholar] [CrossRef]
- Shen, Z.J.; Zeng, J. Spatial Relationships Between Urban Development and Land Surface Temperature in Three Cities in Southern Fujian. Acta Geogr. Sin. 2021, 76, 566–583. [Google Scholar] [CrossRef]
- Akbar, Z.; Murtaza, N.; Pasha, G.A.; Iqbal, S.; Ghumman, A.R.; Abbas, F.M. Predicting Scour Depth in a Meandering Channel with Spur Dike: A Comparative Analysis of Machine Learning Techniques. Phys. Fluids 2025, 37, 045158. [Google Scholar] [CrossRef]
- Brandes, G.; Sieg, C.; Sander, M.; Henze, R. Driving Domain Classification Based on Kernel Density Estimation of Urban Land Use and Road Network Scaling Models. Urban Sci. 2024, 8, 48. [Google Scholar] [CrossRef]
- Zhou, X.J.; Jiang, T. Metamodel Selection Based on Stepwise Regression. Struct. Multidiscip. Optim. 2020, 54, 641–657. [Google Scholar] [CrossRef]
- Wang, J.F.; Xu, C.D. Geodetector: Principles and Prospects. Acta Geogr. Sin. 2017, 72, 116–134. [Google Scholar] [CrossRef]
- Lu, Y.; Yang, Y.Y.; Sun, G.B.; Gou, Z.H. Associations between overhead-view and eye-level urban greenness and cycling behaviors. Cities 2019, 88, 10–18. [Google Scholar] [CrossRef]
- Zhang, W.; Shi, P.; Zhao, W.; Huang, W. Spatiotemporal Differentiation and Obstacle Factor Diagnosis of Resource and Environmental Carrying Capacity in the Lanzhou–Xining Urban Agglomeration of the Upper Yellow River. Chin. J. Appl. Ecol. 2022, 33, 2501–2510. [Google Scholar] [CrossRef]
- Li, X.; Wang, Y. Sustainable Development in the Yellow River Basin: A Pathway Towards Green Growth and Resource Efficiency. J. Clean. Prod. 2021, 279, 123879. [Google Scholar] [CrossRef]
- Chen, X.; Bai, Y.; Song, L.; Gao, Z. Comparative Analysis of Economic Linkages and Network Structures among the Four Major Urban Agglomerations in the Middle and Upper Reaches of the Yellow River Basin. Areal Res. Dev. 2021, 40, 18–23. [Google Scholar]
- Ni, W.; Chai, H.; Sun, J.; Zhuang, T. Reconsideration of Collaborative Innovation in Beijing-Tianjin-Hebei Region from the Perspectives of System Coupling and Regional Cooperation. Urban Dev. Stud. 2025, 32, 1–11. [Google Scholar]
- Dong, J.; Peng, S.; Cui, B.; Jin, R. Multi-Scale Coupling Characteristics and Driving Mechanisms of “Three Types of Life” Spatial Patterns in Mountainous Urban Agglomerations. J. Nat. Resour. 2025, 40, 3182–3200. [Google Scholar]
- Hou, Z.; Fan, H.; Ma, Y.; Wan, T. Spatial Pattern of High-Quality Development of the Urban Cluster in Central Shanxi Region of the Yellow River Basin. J. Taiyuan Norm. Univ. (Nat. Sci. Ed.) 2025, 24, 70–79. [Google Scholar]
Disclaimer/Publisher’s Note: The statements, opinions and data contained in all publications are solely those of the individual author(s) and contributor(s) and not of MDPI and/or the editor(s). MDPI and/or the editor(s) disclaim responsibility for any injury to people or property resulting from any ideas, methods, instructions or products referred to in the content. |
© 2025 by the authors. Licensee MDPI, Basel, Switzerland. This article is an open access article distributed under the terms and conditions of the Creative Commons Attribution (CC BY) license (https://creativecommons.org/licenses/by/4.0/).