Abstract
Achieving net-zero greenhouse gas emissions by 2050 under the European Green Deal requires the full mobilisation of industry, especially energy-intensive sectors such as cement. This study provides an accurate quantification of the environmental performance of Ordinary Portland cement produced in mainland Portugal using industrial data and a cradle-to-gate life-cycle model compliant with EN 15804:2012+A2:2019. The results show that clinker is the main contributor and that the principal hotspots are associated with thermal and electrical energy supply and the calcination reaction. External factors such as the electricity generation mix materially influence results, so these processes should be accurately described and representative of the geographical boundaries associated with plant operation. Climate change is the most relevant impact category, and the carbon footprint is 733 kg CO2 per tonne of cement, with 97% attributable to the identified hotspots. The choice of impact assessment methodology is crucial in life-cycle assessment, and EN 15804:2012+A2:2019 is not compatible with the earlier A1 revision, which affects comparability of Environmental Product Declarations. Overall, the study enhances the measurement and monitoring of sustainability within the cement sector by providing an explicit industry-wide environmental profile with clear system boundaries and hotspot resolution, enabling targeted mitigation. It also clarifies the methodological implications of Environmental Product Declarations, helping to avoid biased comparisons and supporting procurement, disclosure and policy tracking towards sectoral carbon neutrality.
1. Introduction
The European Green Deal aims to achieve net-zero greenhouse gases emissions by 2050, with a reduction of at least 50% in 2030, compared with 1990 [], and this target was updated to a reduction of 55% in the same period, by the ‘Fit for 55’ package. Achieving carbon neutrality and true economic circularity will require the full mobilisation of industry, particularly energy-intensive sectors, such as cement manufacturing [], which is responsible for around 5–7% of global anthropogenic CO2 emissions, while it is an indispensable sector supplying key value chains for societal development [,].
Therefore, understanding how to decarbonise cement manufacturing using Life Cycle Assessment (LCA) is an essential step towards the worldwide green transition endeavour [,,]. Adopting an LCA approach enables the systematic measurement and monitoring of sustainability within an industrial sector. By supporting comparability across technologies and sites, it provides relevant markers for sectoral roadmaps and policy tracking.
1.1. Literature Gap
There are numerous LCA studies concerning cementitious products; however, the majority tend to study specific cases (i.e., single factories or a single company) or use generic data (i.e., ‘hypothetical’ production units) [,,,,,,,,]. Very few studies analyse how a national or regional industrial sector, composed of multiple companies and factories, can contribute to national CO2 emissions reduction targets. This is because no study that was found has attempted complete coverage of the entire national industrial sector; rather, some studies have only analysed part of it, such as Moretti et al.’s analysis of the Italian sector [].
In addition, while there is literature investigating the effect of using different rotary kiln fuel mixes, reducing the clinker content or maximising the use of alternative raw materials [,,,,], the effect of changing unratified model parameters has not yet been evaluated. Variables such as the electricity generation mix are overlooked by the other studies and could potentially have a significant impact on the results. Another often-ignored aspect is the choice of a suitable Life Cycle Impact Assessment (LCIA) method. This step is crucial in any LCA research, as it can have a major impact on the results obtained and therefore on the interpretation by the reader []. The EN 15804:2012+A2:2019 [] standard, which offers guidance for the development of Environmental Product Declarations (EPD) for construction products, has been amended in its A2 revision to require the use of a different LCIA method. Due to its recency, a low number of references were found that assessed the implications of this revised standard compared to previous releases.
In the context of a lack of studies evaluating the impact of different LCIA methodologies on results, and in addition to the quantification of the environmental performance of Ordinary Portland cement, this article also provides a thorough analysis of each impact assessment method. Particularly, it aims to compare the EN 15804:2012+A2:2019 EF 3.1 (Environmental Footprint) with the previously recommended CML-IA (Centre for Environmental Sciences of Leiden University) used in EN 15804:2012+A1:2013, examining the results obtained with each method. Other methods such as TRACI (Tool for Reduction and Assessment of Chemicals and Other Environmental Impacts), IMPACT World+ and older revisions of the Environmental Footprint (EF 3.0) are also considered, and thus a new perspective in the implications of the use of different assessment methods is provided.
This paper uses real-world data to provide a highly detailed and accurate quantification of the environmental performance of producing Ordinary Portland cement in an entire sector, based on six state-of-the-art plants located in Portugal, which operate the full production cycle.
1.2. Technical Description of the Product
Cement is a hydraulic binder, i.e., a very fine mineral powder which, when mixed with water forms a paste that sets and hardens through a reaction of hydration, attaining strength and longstanding volume stability, even underwater [,]. When properly mixed with aggregates it produces concrete, mortar or cement screed that retains its workability for an adequate period [,]. Ordinary Portland cement is grey in colour and is the most common cementitious product, the other being ‘white cement’, whose main difference is the specific raw materials and manufacturing procedures necessary to remove colouring from the final product.
1.2.1. Main Constituents
Every cement that conforms to the standard EN 197-1:2012 “Cement—Part 1: Composition, specifications, and conformity criteria for common cements” are termed CEM cement [], which, depending on the mixture ratios and constituents used, result in several blends of cement with different properties, being grouped into six main classes [,].
|
|
The hydraulic hardening properties are due to the hydration of calcium silicates, and therefore the mass proportion of calcium oxide (CaO) and silicon dioxide (SiO2) must be at least 50% []. The specification also includes references to mechanical strength starting with three main classes: 32.5; 42.5; and 52.5, which are related with the standard compressive strength (expressed in MPa), 28 days after setting []. Furthermore, there are three additional classes to represent its early strength (2 to 7 days after setting): ordinary early strength (indicated by N); high early strength (indicated by R); and low early strength (indicated by L). Finally, the notation ‘SR’ refers to sulphate resisting cements, and ‘VLH’ relates to very low heat special cements [].
The following list describes the most common constituents that make up an Ordinary Portland cement, which is produced throughout the industry using different recipes depending on the desired blend:
- Portland Cement Clinker (K)—Material with hydraulic properties and the main constituent. At least 2/3 by mass are calcium silicates (3CaO.SiO2 and 2CaO.SiO2). The ratio CaO/SiO2 must not be lower than 2 and the magnesium oxide (MgO) content must not exceed 5% [].
- Fly Ashes (V, W)—Dust-like particles from pulverised coal furnaces flue gases with pozzolanic and hydraulic properties. By-product that may be silicious (SiO2 > 25%) or calcareous (CaO > 10%) [].
- Limestone (L, LL)—Common carbonate sedimentary rock, its calcium carbonate (CaCO3) content shall be larger than 75% by mass and the clay content must be less than 1.2% [].
- Calcium Sulphate—Natural or by-product material that is added to cement to control setting. It can be either gypsum (calcium sulphate dihydrate, CaSO4. 2H2O), anhydrite (anhydrous calcium sulphate, CaSO4), or hemihydrate (CaSO4. ½H2O) [].
- Ground Granulated Blast Furnace Slag (S)—Product obtained by rapid cooling of molten iron slag of suitable composition from blast furnace operations with hydraulic properties. The sum of CaO, MgO, and SiO2 constitutes at least two-thirds by mass, with (CaO + MgO)/SiO2 ratio exceeding 1.0 [].
- Other Minor Constituents—Designation that covers other constituents, its total quantity must not exceed 5% of the cement mass [].
1.2.2. Manufacturing Process
Cement manufacturing is an industrial process that transforms its raw materials input, normally a combination of limestone, marl, clay, and non-clinker main constituents (or ‘additives’) into cement, whose properties depend on the raw materials and its mixture ratio, as well as other process variables [,]. There are four main manufacturing methods [,]:
- Dry Process—Raw materials (already with low moisture content) are dried while being ground to a fine powder denoted raw meal. The dry feed is fed to a pre-heater or pre-calciner rotary kiln system to produce clinker.
- Semi-Dry Process—The dried raw meal is pelletised with water and fed to a preheater.
- Semi-Wet Process—A slurry of raw materials is dewatered in filter presser, resulting in a ‘cake’ that is extruded into pellets and fed into a pre-heater.
- Wet Process—A slurry of raw materials with very high levels of moisture are crushed in water and fed to a kiln or a slurry dryer.
As most European production plants employ variants of the dry process, only this method is considered hereafter. The cement production units are usually installed close to the quarries where limestone and marl are extracted through controlled explosions to create chunks with an average diameter of one metre.
Trucks then move the chunks to a crusher, being pulverised into smaller diameters in the range of 0 to 80 mm, and from this stage the materials move through conveyor belts. After crushing, raw materials are stored in pre-homogenising hangars that fine tune its average composition to improve the overall process efficiency. An X-ray analyser continuously verifies its composition and, depending on the results, corrective materials may be inserted to correct deviations [,].
In the factory building, production starts with the insertion of raw materials into a mill, called ‘raw mill’, where material input is mixed and crushed to a particle size less than 50 μm, being simultaneously dried using heat from the kiln exhaust.
The resulting output is a homogenised fine powder denoted ‘raw meal’ that is promptly stored in a silo. A permanent stock is essential to allow the production process to occur without using all equipment simultaneously, as about 90–150 kWh of electricity are consumed per tonne of cement at this stage, representing a significant portion of the total production cost [,].
The raw meal arrives at a cyclone system for pre-heating before entering the rotary kiln, where it is heated up to 1450 °C, causing reactive materials like limestone to undergo numerous chemical reactions to produce an artificial rock designated clinker which is composed of four main constituents [,]. The main reactions are calcining (1) and clinkering (2)–(5) [,].
Keeping the feed heated up requires a constant high caloric input consuming 60 to 130 kg of fuel oil equivalent per tonne. Fuels also need to be prepared in a ‘fuel mill’ to make them suitable for injection into the burner [,]. The most common fuel is petroleum coke (petcoke), although there is a widespread use of alternatives, as around 45–50% of the calorific input is generated from waste-based fuels or biomass [,]. At the exit, the hot clinker is rapidly cooled in a ‘clinker cooler’ to maintain the desired properties and, after cooling, the clinker is subsequently stored in a silo and heat waste can be redirected to a pre-calciner [,].
Calcining consumes around 60% of the heat supplied, and an optional pre-calciner system can improve efficiency by promoting the reaction before entering the kiln. This reaction is also responsible for the bulk CO2 emissions, as around 525 kg of CO2 per tonne of clinker are released solely through decarbonation [,,,].
Together with emissions from fuel combustion and the rotary kiln system, these operations are responsible for almost all GHG emissions from the cement industry, with a significant portion of them originating from a reaction associated with clinker production. For producing cement blends, a large mill denoted ‘Cement Mill’ is used and, depending on the desired blend, a controlled combination of clinker and non-clinker main constituents (additives) (such as gypsum or fly ash) are mixed and milled to reach grain sizes of 1–50 μm [,]. After manufacturing, finished products are stored in silos before dispatch [,].
1.3. Analysis Context and Research Questions
In March 2021, ATIC (Associação Técnica da Indústria do Cimento), the technical association for the Portuguese cement industry, published its carbon neutrality roadmap, claiming the possibility to achieve a 48% CO2 emissions reduction in the production chain by 2030 and carbon neutrality by 2050 []. It should be noted that in May 2024, Cement Europe (previously known as CEMBUREAU) updated its net-zero roadmap. The update considers the progress made since the publication of the report in May 2020, with the aim of achieving approximately a 78% reduction in CO2 emissions by 2040 and full carbon neutrality by 2050 []. At the time of writing, ATIC had not updated its carbon neutrality roadmap to include a projection for the year 2040. However, it should remain aligned with its European counterparts, as its objectives for 2030 (404 kg CO2/ton cement) closely followed those of Cement Europe (399 kg CO2/ton cement) [,].
ATIC intends to accomplish its goals by enhancing current technologies, such as increased use of alternative fuels and through the investment in emerging technologies, for instance, Carbon Capture, Use and Storage (CCUS) [].
This paper provides an accurate quantification of the environmental performance of Ordinary Portland cement produced in mainland Portugal, taken as a case study, which is representative of the technology used globally, and sets a baseline for assessing the effectiveness of innovations to be promoted by the industry. The paper looks at the data required to register an Environmental Product Declaration (EPD), which is an independently verified document that conveys transparent, credible, and comparable data regarding the environmental impact during the life cycle of products [,], and this is critical to provide public evidence of the efforts that industry is developing. In accordance with the sectoral roadmaps, the study improves the measurement and monitoring of sustainability within the cement sector by providing an explicit, industry-wide environmental profile with clear system boundaries and hotspot identification, enabling targeted mitigation. It also clarifies the methodological implications for EPD, helping to avoid biased comparisons and supporting the tracking of procurement, disclosure and policy towards carbon neutrality.
Along these lines, the paper has been designed to address specific research questions related to the topic under review:
- (a)
- What is the environmental impact of manufacturing Ordinary Portland cement?
- (b)
- What are the environmental hotspots within the production chain?
- (c)
- Could the chosen electricity mix influence the environmental profile of cement?
- (d)
- Would different LCIA methods affect the impact assessment results?
- (e)
- Does the revised EN 15804:2012+A2:2019 specification produce a significant difference in results when compared to the previous A1 revision?
Essentially, this paper aims to conduct an accurate LCA of ordinary Portland cement produced in mainland Portugal. The main goal is to establish a baseline to promote circularity and contribute to achieving carbon neutrality.
2. Environmental Assessment Procedures and Methods
Life Cycle Assessment (LCA) is defined as a compilation and assessment of inputs, outputs and potential environmental impacts of a given product system during its life cycle. LCA models can be flexible and cover specific phases of a product life cycle (e.g., from extraction of raw materials to dispatch) [,,]. ‘Life cycle’ includes any procedure inherent to the ‘life’ of a product, from extraction and production to use, maintenance, disposal or waste management, and any of its effects upon the environment, such as resource consumption or hazardous emissions, are considered [,,].
By examining each different environmental impact category, it is possible to assess the sustainability of a product and detect critical assets. The framework for LCA involves 4 main interconnected stages [,,]:
- Goal and scope describe the target of the assessment and establishes the context in which the analysis will be implemented and what is its limits.
- Inventory analysis (LCI) identifies and quantifies the inputs and outputs within the system (energy and material consumption, emissions and others).
- Impact assessment (LCIA) calculates and quantifies the ecological and human health effects of the system inputs and outputs stipulated in the Inventory Analysis.
- Interpretation stage gathers the results, interprets them and delivers deductions that can provide the recipients of the report the ability to make informed decisions about the product’s environmental status considering its production system.
In the present work, LCA was implemented with the support of the software SimaPro® version 9.5 in compliance with the standard EN 15804:2012+A2:2019 “Sustainability of construction works—Environmental product declarations—Core rules for the product category of construction products” [,,,].
System Boundaries
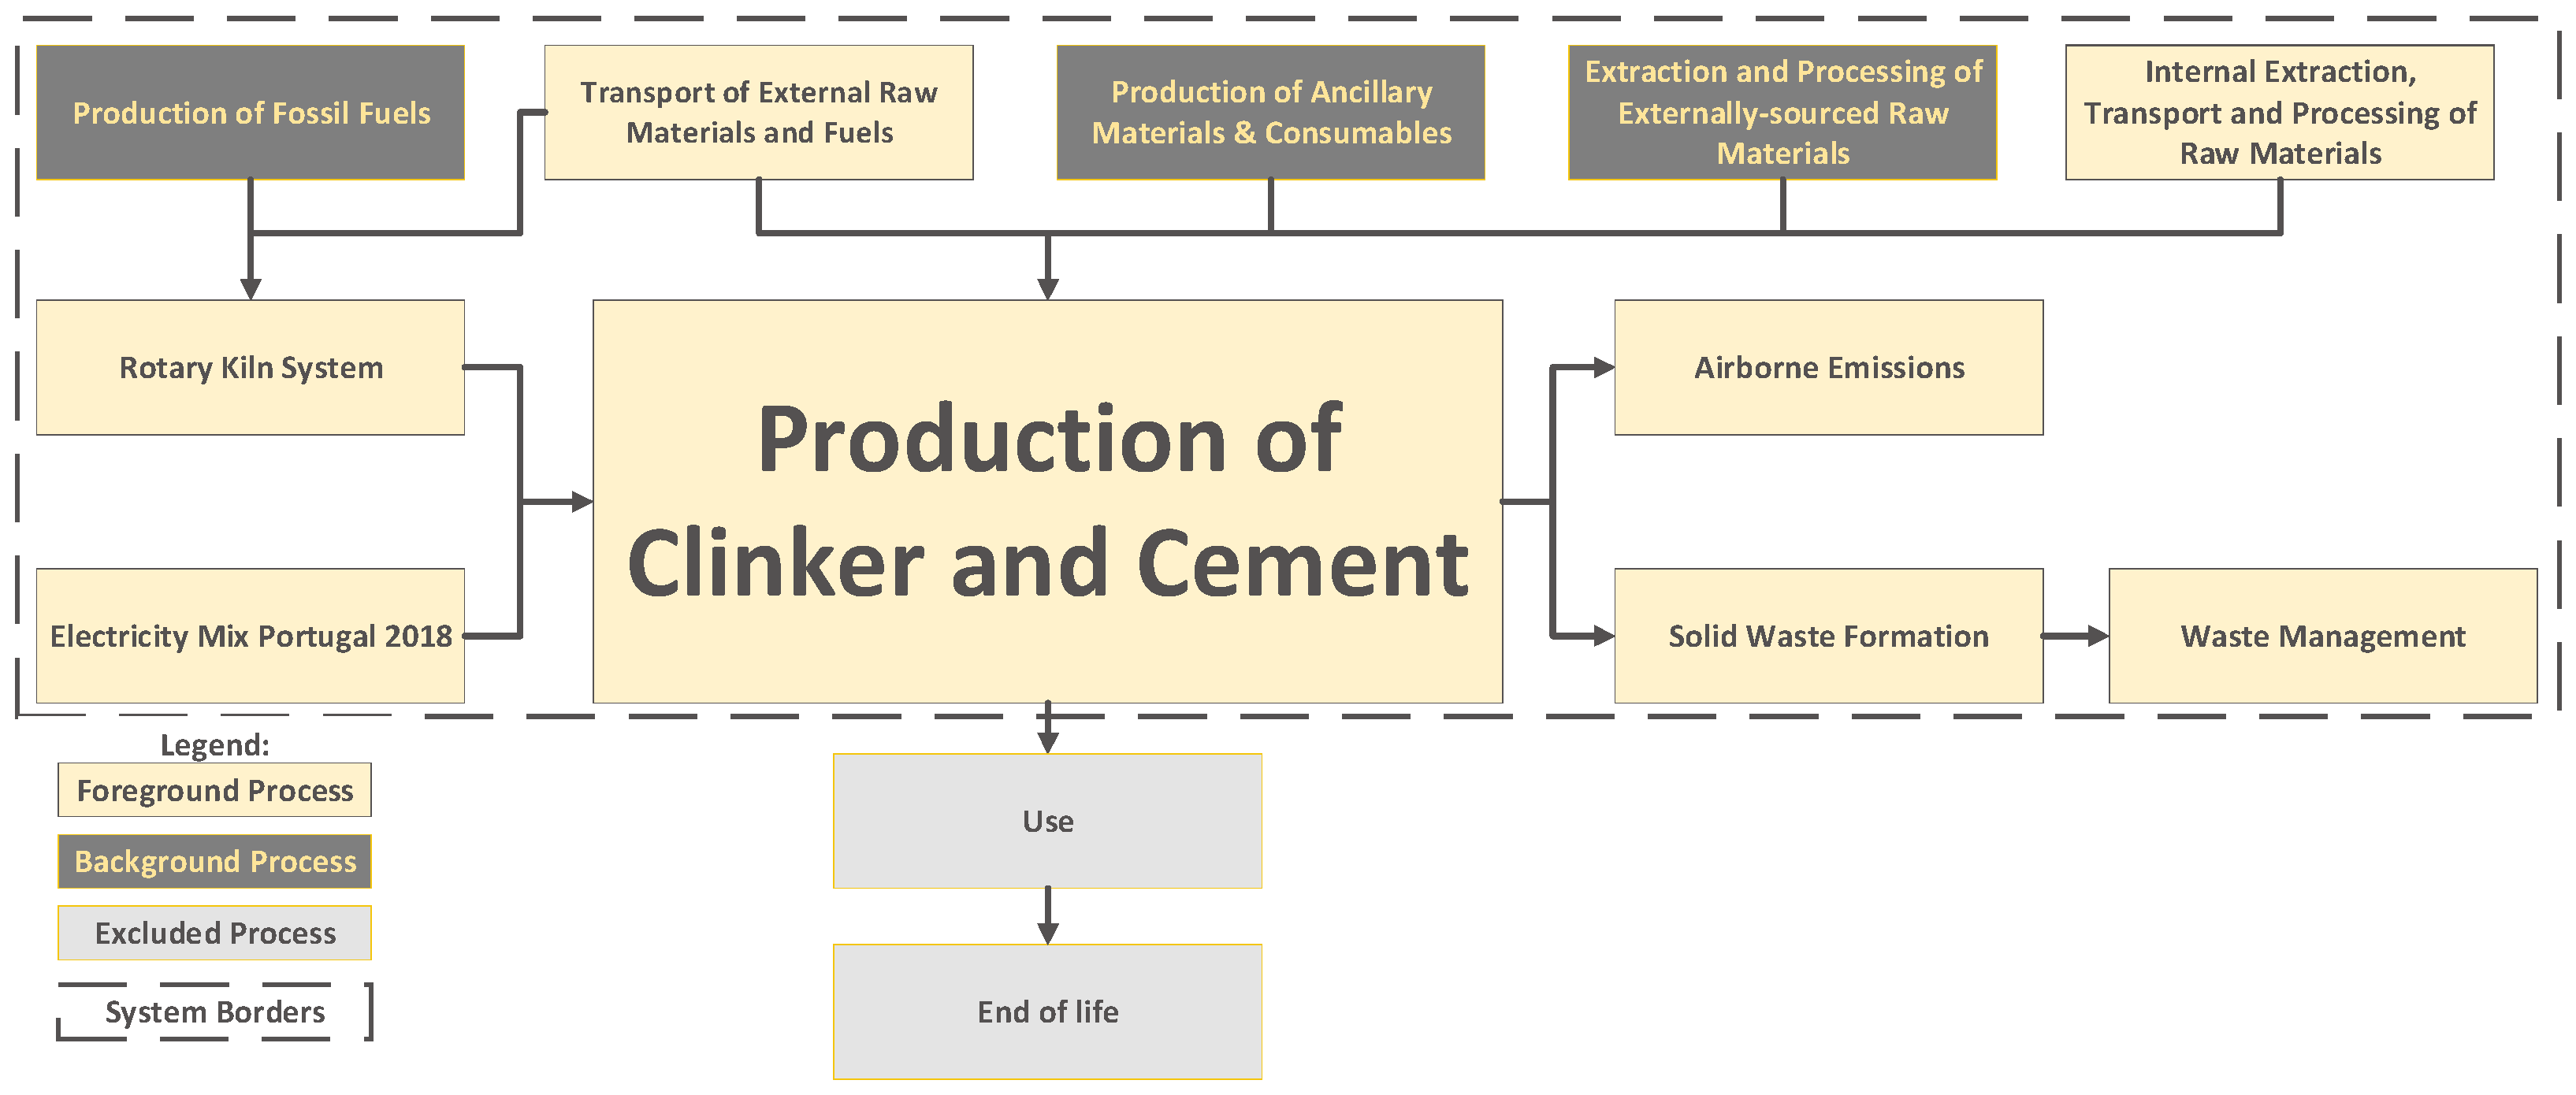
This LCA study is a “Cradle-to-Gate” analysis covering the Product Stage modules (A1–A3) for the cement manufacturing procedure (see Figure 1) [,]. The packaging and dispatch procedure are out of the system boundaries and are not assessed.
Figure 1.
System boundaries.
The functional and declared units are used to provide a clearly defined and measurable reference for the material inputs and outputs during its life cycle, and if a product function cannot be unequivocally described, a ‘declared unit’ is utilised [,]. It enables the comparison with equivalent products, and it must be related to typical measuring units used to assess its consumption. As an intermediary product in the construction sector, cement can be used in various applications and, as such, a mass-based declared unit of one metric tonne of Ordinary Portland cement was selected.
Figure 2 provides a simplified overview of the system considered and its boundaries, discerning the foreground and background processes. All the processes the manufacturers have influence over are considered as ‘foreground’ and are characterised based on primary and relevant data obtained directly from real-world industrial statistics of the producers.
Figure 2.
Visual representation of the foreground and background processes.
Upstream processes that producers cannot influence are considered as background, and are thus modelled using generic data denoted ‘Secondary Data’, and its input and outputs are automatically calculated based on the declared unit. Secondary data was extracted from version 3.9.1 of Ecoinvent database and was selected according to its plausibility and representativeness [], with the exception of the subproduct ‘Fly Ash’, which was characterised making use of an EPD from ‘BauMineral GmbH’ for a hard coal fly ash product [].
Processes that are relevant but indirectly involved in the production, such as the generation of electricity, are also considered foreground, and its characterisation was based on data obtained from the producers (e.g., electricity consumption) and other relevant entities. In this case, the unit processes used in the model are obtained from ecoinvent (e.g., hydropower generation) with its flows being customised to correspond to the supplied input–output data.
3. Life Cycle Inventory (LCI)
The LCI stage involves procedures to quantify the most relevant input and outputs for the product system [,]. The EN 15804:2012+A2:2019 [] data quality requirements requires the model to reflect the physical reality and the set of data provided to be as recent as possible [,].
3.1. Geographic and Temporal Coverage
The Portuguese clinker and cement industry served as a real word case study representative of global technologies, as it is composed of six plants, making use of data collected in 2018.
The expert judgement from the industrial partners is that no perceptible change occurred within the sector, and no substantial technological enhancements were introduced between the reference year of 2018 and the time of writing. This assertion can be substantiated by referring to the ‘Community Eco-Management and Audit Scheme’ (EMAS) environmental declarations for the years 2018 [,,,,,] and 2023 [,,,,] (the most recent available) for the production centres of each Portuguese cement company (CIMPOR and SECIL). Please note that these declarations are only available in Portuguese.
These findings serve to confirm that the majority of inputs and outputs remain within a reasonable range, with differences lower than 20%;. The bigger differences lie in the fuel mix, with an increase in biomass, a decrease (or no-change) in non-biomass alternative fuels and a decrease in petcoke. The most significant variations are attributable to the fuel mix, which is characterised by an increase in biomass, a decrease (or no change) in non-biomass alternative fuels and a decrease in petcoke.
Therefore, the specific datasets concerning the year of 2018 are still considered valid for modelling the current cement manufacturing processes globally.
3.2. Representativeness and Significance
The technological characteristics of Portland cement production are similar across the whole sector, and the differences are associated with manufacturing details such as production capacity, variants of the equipment used, the mineral characteristic of the quarries or ancillary materials consumption.
This technological homogeneity allows the model to fully cover all main technological features from every production plant, thus reflecting accurately the physical reality of the product. Essentially, all inputs and outputs obtained from the plants are combined into a single model to provide results for an average product, while simultaneously maintaining a high technological representativeness for any of the plants. The entire population of interest was sampled, and the model is highly representative of the Portuguese clinker and cement industry; therefore, no sampling error shall be reported.
3.3. Missing Data
Missing data is limited to a few details about secondary raw materials and alternative fuels, in which information regarding consumption and transportation is available, but there is not enough data to accurately model the unit processes. Fortuitously, these are classified as waste from other sectors; therefore, the ‘polluter pays principle’ is applied, and only the impact incurring from transport to the factory gate shall be modelled [,,,].
3.4. Clinker-to-Cement Ratio
The industry does often commercialise clinker, so not all manufactured clinker was used to produce cement within the system boundaries. Yet, all the supplied data related with the clinker phase concerns the production of all clinker, including the portion that was not consumed to produce cement. To guarantee that the results are obtained according to the declared unit of one tonne of cement, the clinker phase was modelled based on an ‘intermediary unit’ of one tonne of clinker.
Being subsequently converted to the declared unit by applying the ‘clinker-to-cement ratio’ (CtCR), which determines the average clinker content in cement [,]. Using data supplied by the producers, the ‘clinker-to-cement ratio’ was determined to be 0.779 for the reference year of 2018.
3.5. Mass and Energy Balances
This section evaluates the material and energy input–output flows for the product system, following the manufacturing process procedure explained in Section 1.2.2, which describes all the interactions between the unit processes and the system boundaries within modules A1–A3. Module A1 corresponds to the supply of raw materials and primary energy, A2 relates to the freight transport of raw materials or fuel to the factory gate and the internal transport within the factory premises [,].
Module A3 describes the flows related with manufacturing of the intermediary product (clinker) and the main product (cement). Lastly, the flows concerning the management of solid waste produced within the factory premises across modules A1–A3 are also defined [,].
3.5.1. Module A1—Supply of Raw Materials and Primary Energy
Being a resource-consuming process, the extraction and processing of raw materials play an essential role in cement manufacturing, with Table 1 providing the material flows during clinker and cement production phase. It addresses the supply from internal and external quarries, the use of waste-based alternatives and the consumption of additives to manufacture each blend. As a foreground process, the internal quarries activities were modelled in higher detail to include the extraction procedure, namely the use of ANFO explosives (a mixture containing 96% ammonium nitrate and 6% diesel) and the use of the quarry machinery [].
Table 1.
Module A1: Extraction and processing of raw materials for clinker and cement phase.
As an energy-intensive process, consuming around 147.8 kWh of electricity per tonne of cement, the electricity mix of the grid used to supply the plants will have a significant impact on its environmental impact assessment. Therefore, it is essential that the electricity mix of the reference year reflects reality, especially considering that Portugal has a relatively high penetration rate of renewable energy. Using publicly available information from REN, the Portuguese energy company, Figure 3 depicts the electricity generation mix by type of energy source for the reference year []. This information was then employed as a foundation for modelling energy flows relevant to Module A1, concerning electricity generation. To achieve this, the ecoinvent process ‘market for electricity, medium voltage PT’ was modified and updated, ensuring its alignment with the most recent data available. This modification ensured that the contribution of each electricity generation method reflected the real electricity consumption patterns in the reference year []. Note that Section 4.2 will analyse the effects of utilising a more recent electricity mix.
Figure 3.
Electricity generation mix in Portugal for the year 2018 [].
Inarguably the major step in cement manufacturing, clinker sintering is a highly energy intensive process, requiring around 2.9 GJ of heat being used to convert the raw meal input into the necessary produce the clinker requires to manufacture one tonne of cement [].
Table 2 provides the consumption of fuels, the energy output from its ignition and the subsequent emissions to air incurring from the combustion reactions within the kiln. Detailed information concerning the aggregation of Secondary Raw Materials into three groups (External, Internal and ‘Subproduct’), as well as the fuels classification into four categories (Fossil, Biomass, Industrial and RDF) are available in the Supplementary Materials. Additionally, data regarding net calorific value, CO2 emission factors and biogenic content for each fuel type are also accessible on the Supplementary Materials.
Table 2.
Module A1: Generation of heat in the rotary kiln to produce one tonne of OPC.
3.5.2. Modules A2—Transport
Even though most raw materials are obtained internally and transported mainly through conveyor belts within the premises, around 36% of the raw material input and 112 kg of fuel must still be transported to the factory gate from external suppliers.
Table 3 depicts the freight transport of raw materials and fuels based on average transport distance provided by the producers.
Table 3.
Module A2: Freight transport of raw materials and fuels.
To approach the transport of goods, the concept of tonne-kilometre (tkm) was used, which represents the transport of one tonne of materials over a distance of one kilometre. It should be noted that the use of conveyor belts for internal transport is integrated in the electricity consumption, and the internal quarry transportation is modelled using the ‘Diesel, Burned in Machinery’ process.
3.5.3. Modules A3—Manufacturing
Module A3 concerns the manufacture of the intermediary product (clinker) and the final product (cement), with Table 4 evaluating the required material and energy flows to produce 779 kg of clinker and one tonne of cement, respectively. The ensuing emissions occurring from the decarbonation reaction within the rotary kiln and formation of particulates in the mills and kiln system are also considered.
Table 4.
Module A3: Manufacturing.
Electricity consumption was aggregated to represent the total usage for the whole production chain and, as such, every equipment usage (e.g., the crusher, mills, rotary kiln, conveyor belts, cooling fans, among others) is integrated in the model through its contribution to the electricity consumption.
As for the disaggregation between production phases, industrial sources indicate that the consumption of electric energy is usually distributed as 60% for the clinker phase and 40% for the cement phase.
In a dry manufacturing method, water is mainly consumed for cooling the rotary kiln and mills, being used during both production phases, usually in a closed loop []. As in the case of electricity, data was aggregated encompassing water consumption during the full manufacturing chain. Consumption is divided between use of tap water from the supply network and water abstraction from nature, and water consumption was assigned to the last downstream process (‘Cement Phase’), which provides the final product.
3.5.4. Modules A1–A3—Solid Waste Management
There is formation of solid waste across all phases of cement manufacturing, and although most of it is valorised internally, a small portion is sent for landfilling. As in the previous cases, data was aggregated, comprising the waste formation during the entire manufacturing process, and the solid waste formed was assigned to the Cement Phase.
Since the overall waste flows are negligible compared with the useful output (about 0.6%), the external valorisation and disposal of waste are considered to be out of the system boundaries. Table 5 lists the amount of waste sent for these procedures that was considered, and the ‘avoided product’ approach was used to model the internal re-use of waste.
Table 5.
Module A1–A3: Solid waste management.
3.5.5. Energy and Mass Flowchart
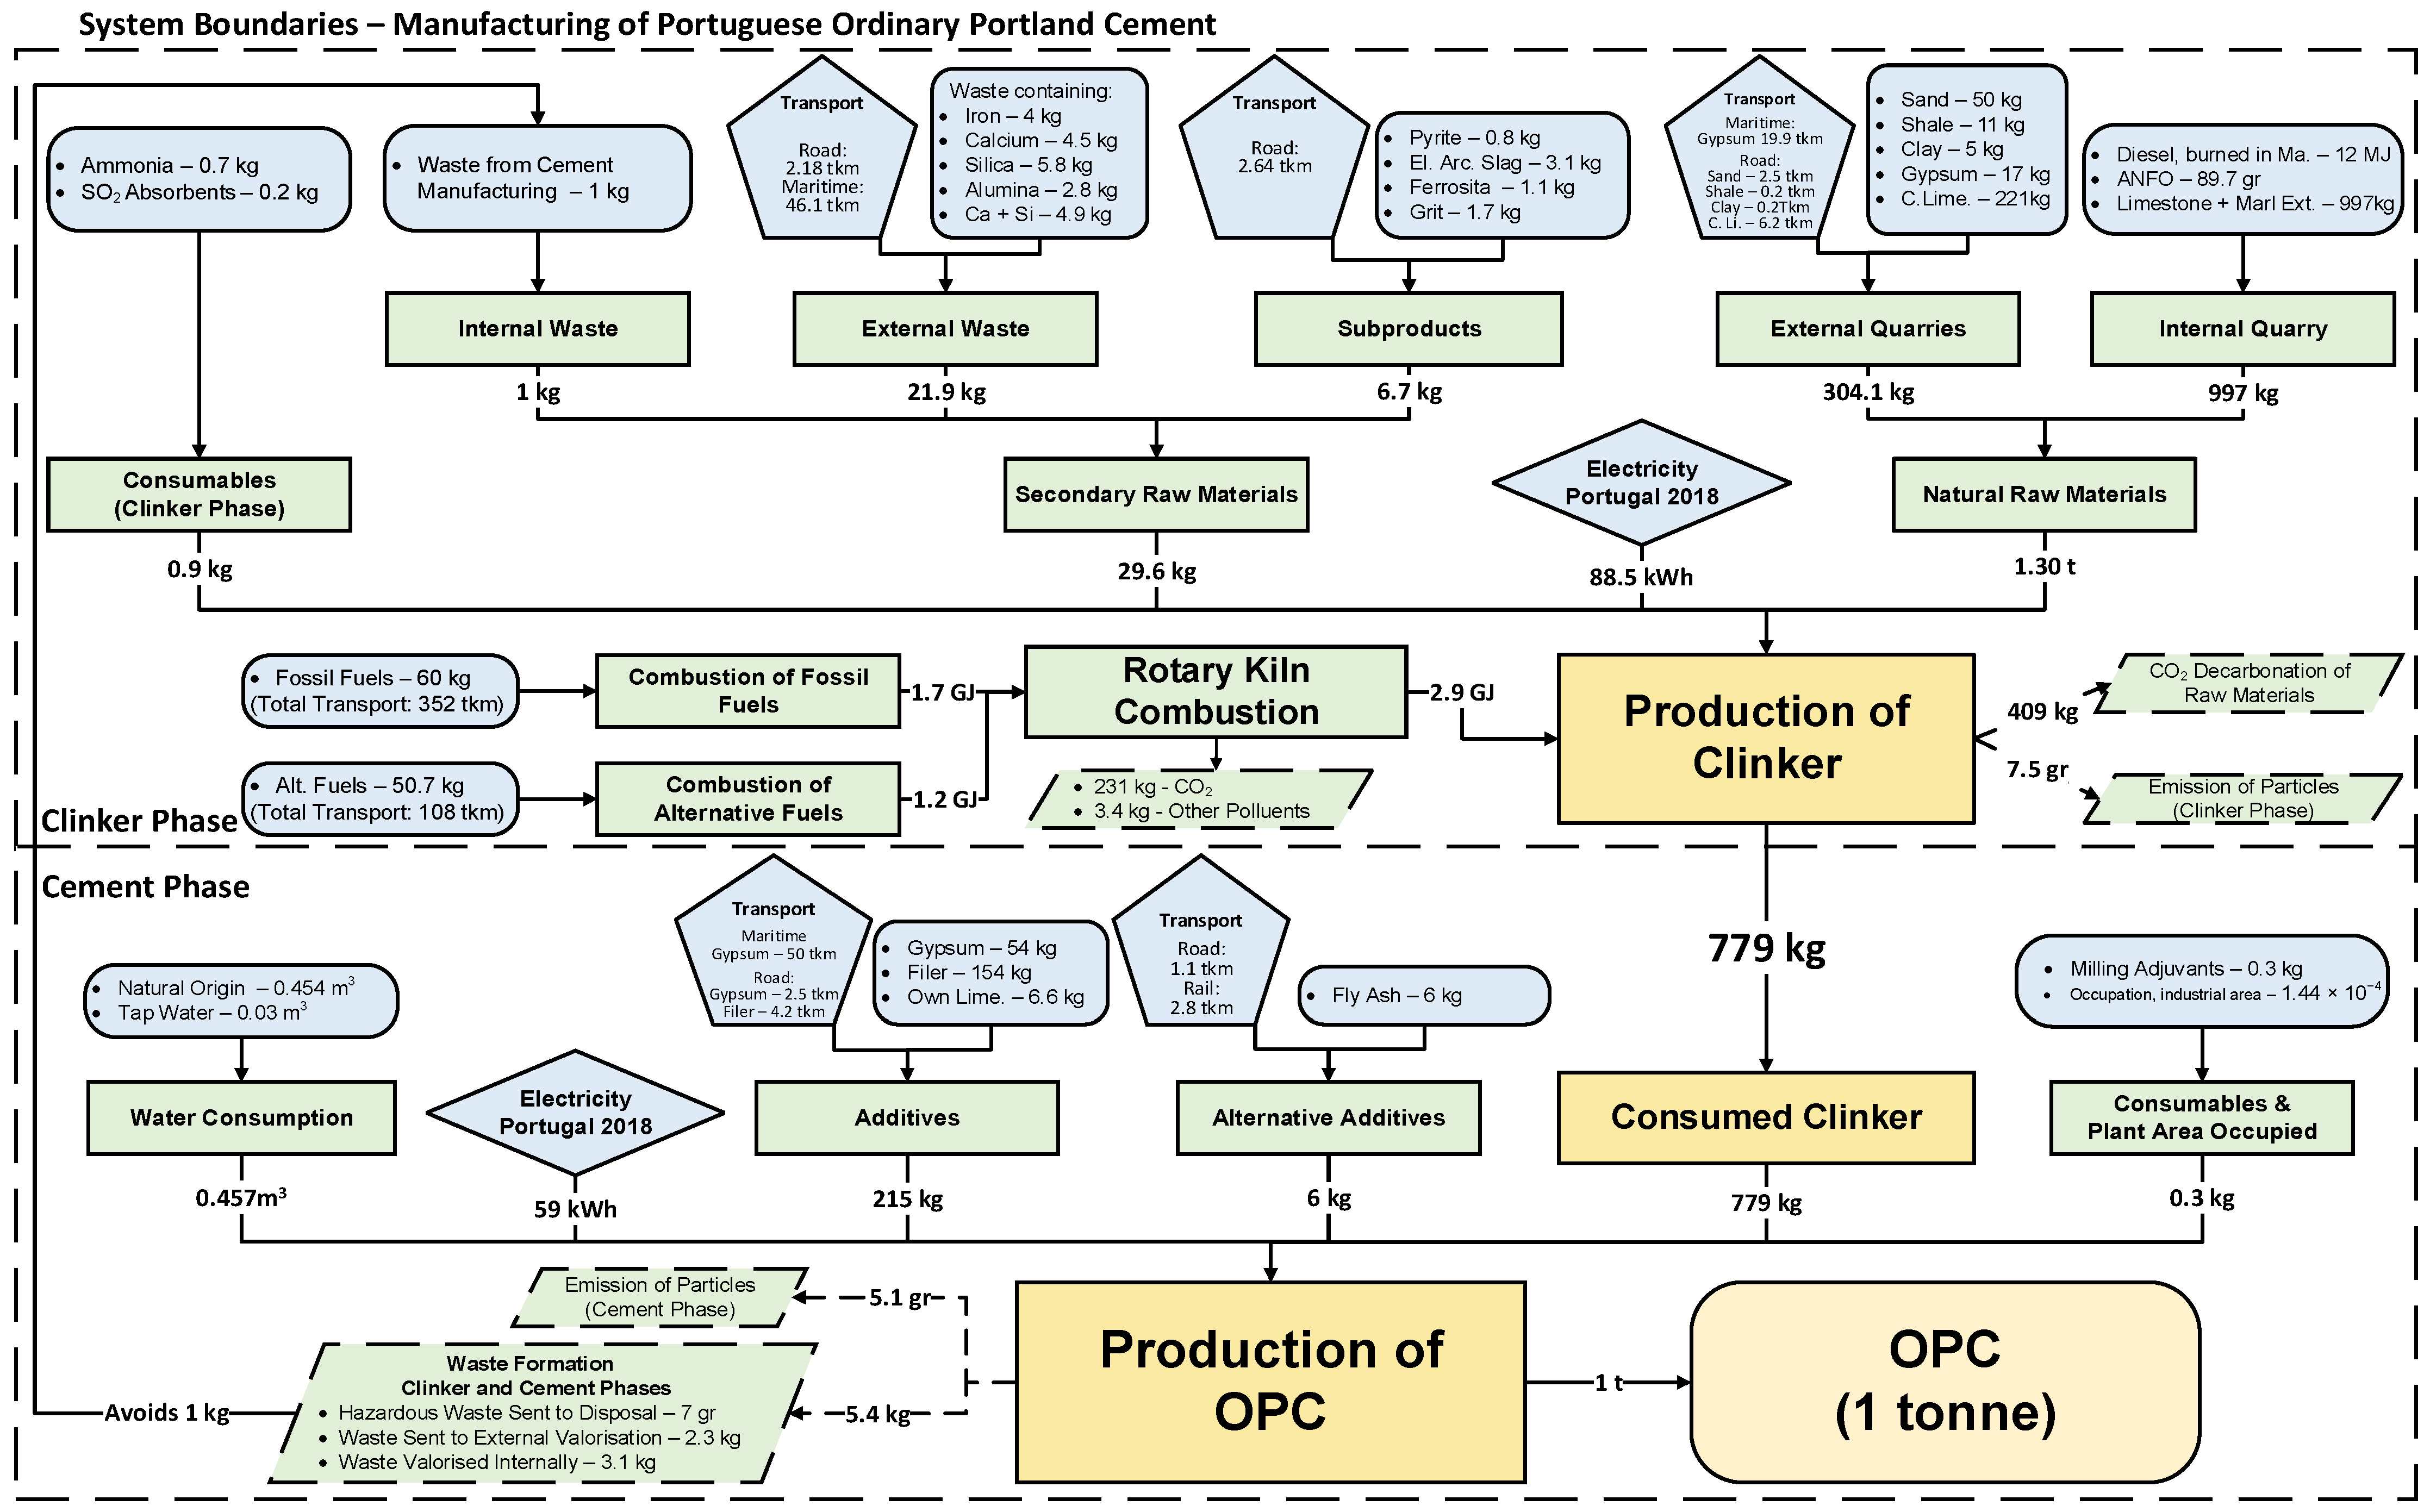
Figure 4 illustrates the primary material, consumables, water, energy, transportation and waste flows for a cradle-to-gate LCA study encompassing the information modules A1–A3. This provides an overview of the full cement manufacturing process in Portugal for the year 2018, providing insights on how the inventory and its associated flows were modelled.
Figure 4.
Overall flowchart for the LCA model.
3.6. Lifecycle Impact Analysis (LCIA)
LCIA is a procedure to quantify the environmental burden of a product system based on a declared unit of reference; it includes a collection of different impact categories (IC), which composes the LCIA profile. As required by the PCR, the core impact indicators are selected based on the requirements of EN 15804:2012+A2:2019 [] specification and presented in Table 6 [,]. The characterisation was performed in the LCA software SimaPro 9.5 using the method ‘EN 15,804 + A2 (adapted) V1.00/EF 3.1’ which aligns its methodology with the Environmental Footprint method (EF 3.1) from the European Commission, except for the handling of the biogenic carbon. In EN 15804:2012+A2:2019, biogenic carbon is considered to cause the same amount of Climate change as fossil carbon; however, its effect can be neutralised by its posterior removal from the atmosphere [,].
Table 6.
Core environmental impact indicators for ‘EN 15,804 + A2 (adapted) V1.00/EF 3.1’ method [,].
4. Results
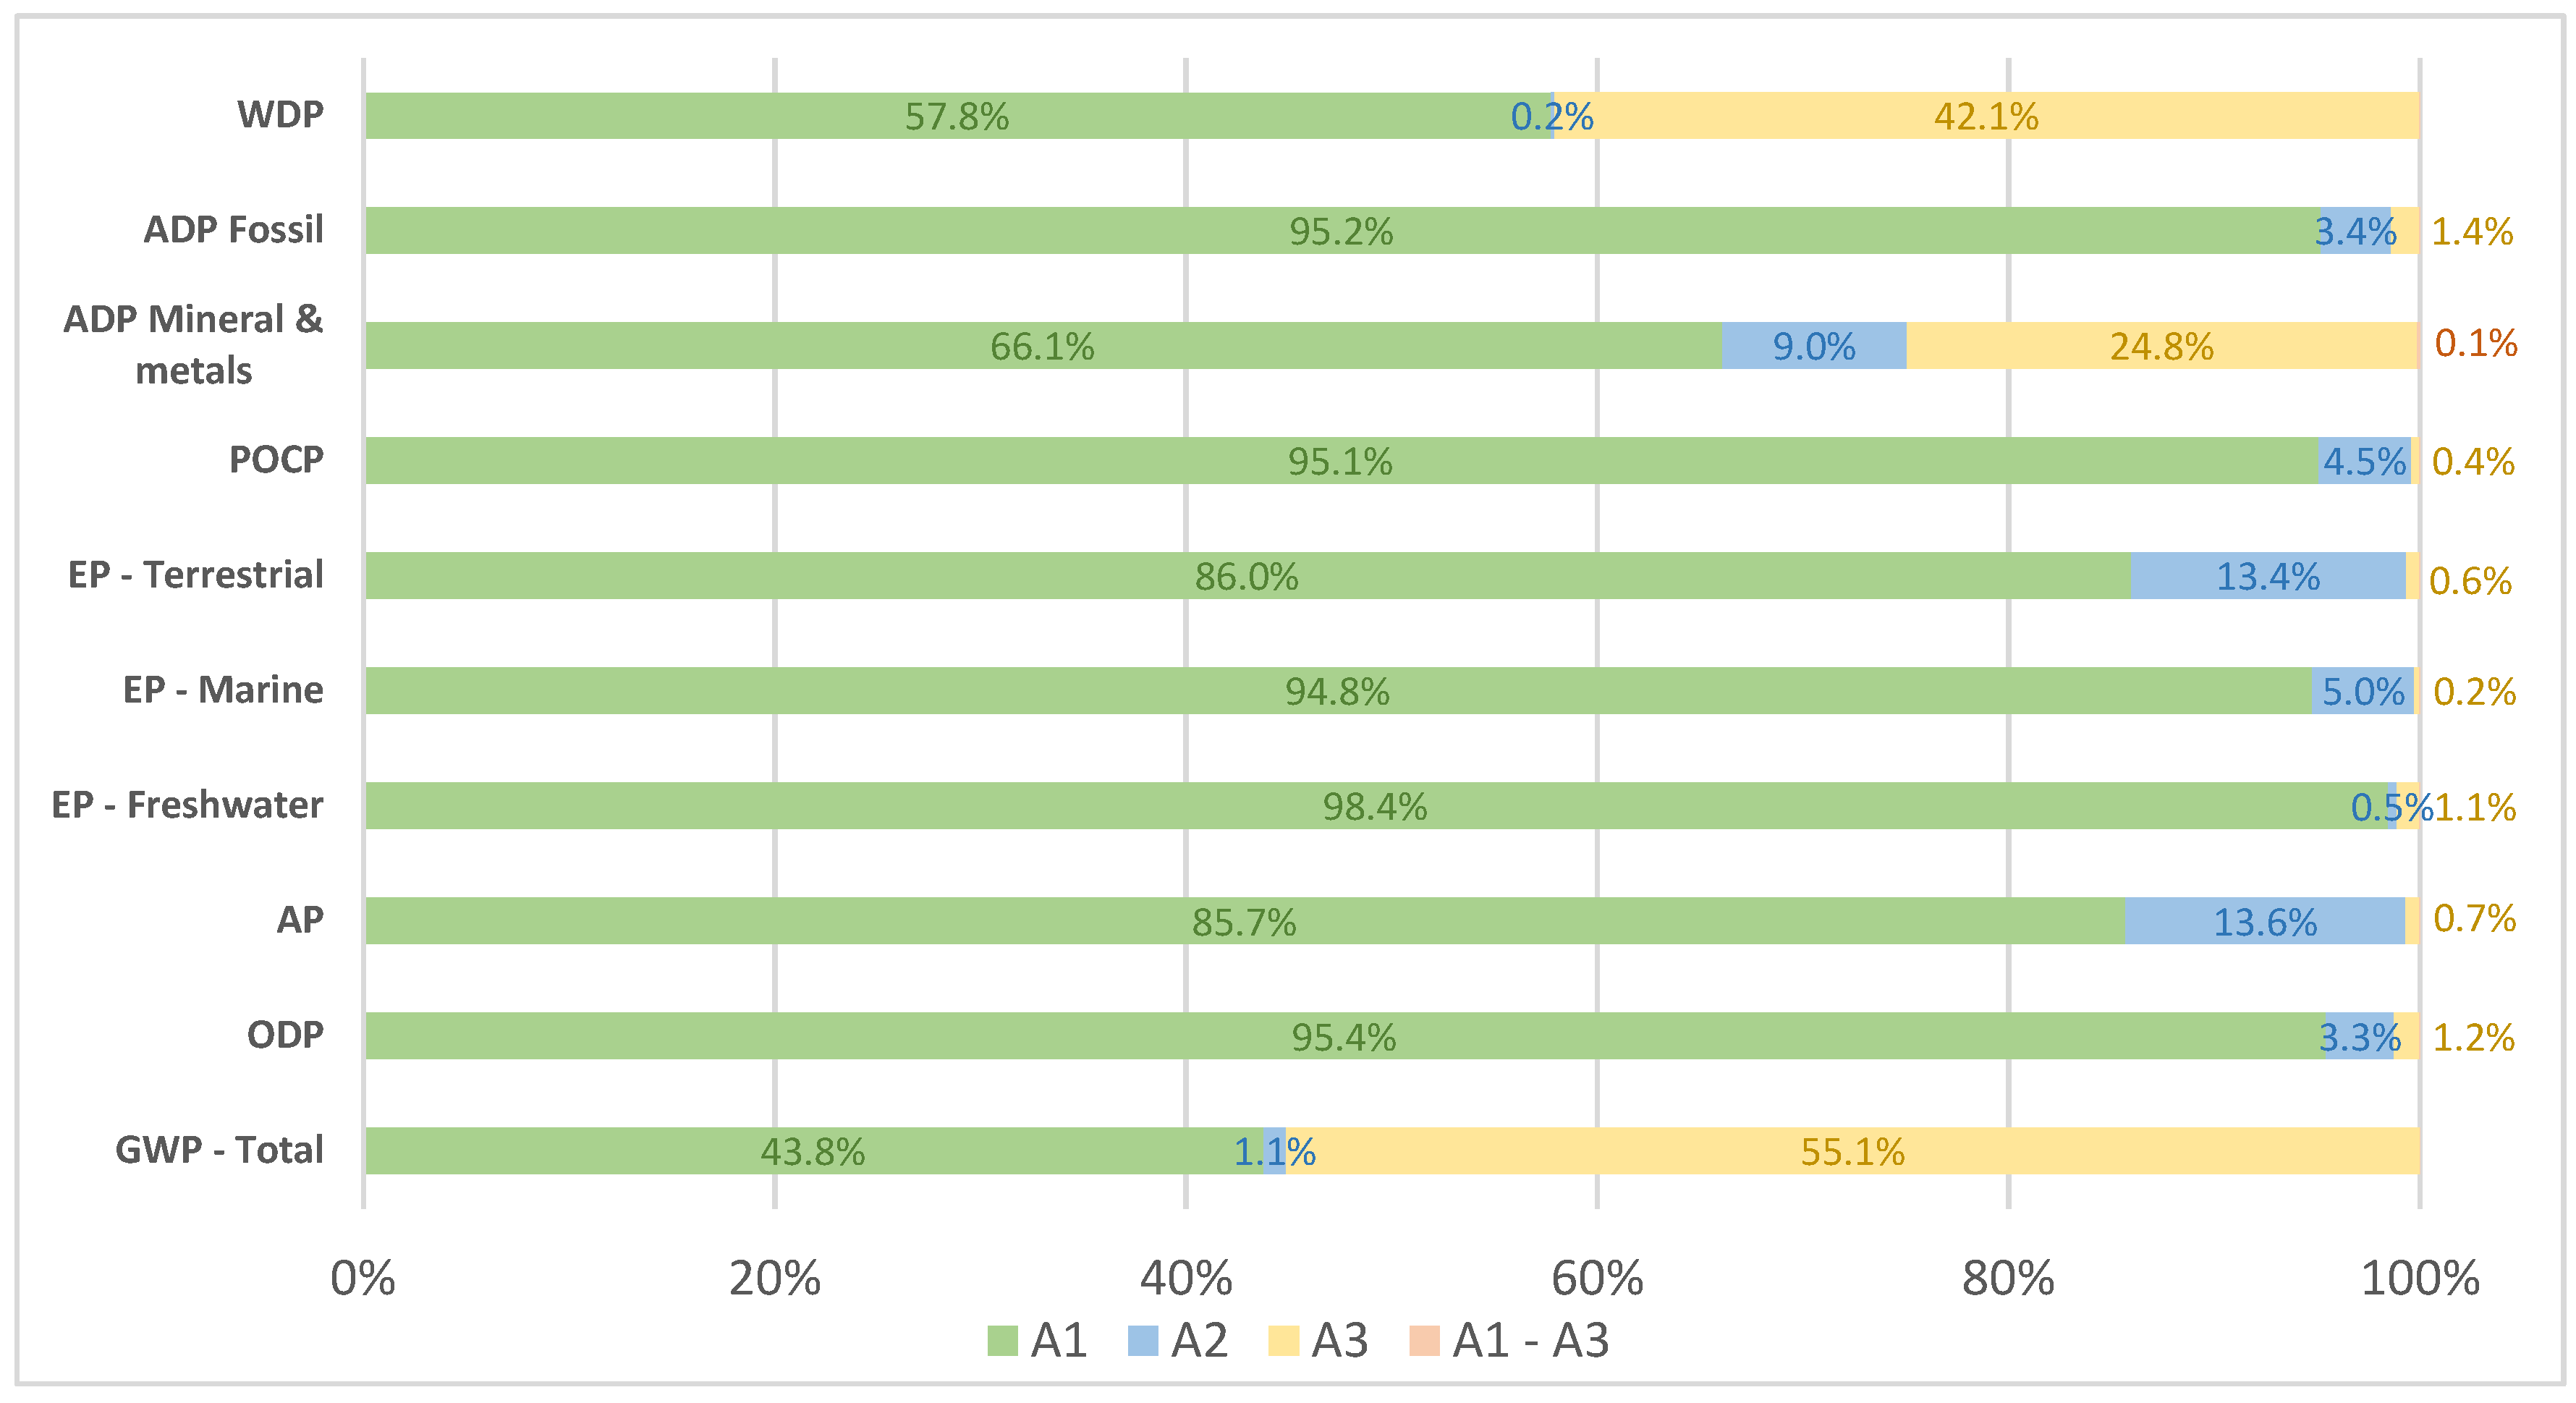
Table 7 and Figure 5 summarise the LCIA results for core environmental impacts incurring from producing one tonne of ordinary Portland cement. Upon first observation it becomes clear that the processes corresponding to Module A1, namely the extraction, supply and processing of raw materials together with the generation of primary energy (heat and electricity), have the largest contribution in all but one category (GWP-Total). Module A2, which corresponds to transportation, has a modest effect on some impact categories, such as Acidification; Eutrophication—terrestrial; and Abiotic Depletion—minerals and metals, but always with a contribution lower than 14%.
Table 7.
LCA results for the core environmental impact categories. Obtained from running the inventory in SimaPro 9.5 using ‘EN 15804 + A2 (adapted) V1.00/EF 3.1’ method.
Figure 5.
Contribution of each Product Stage Module (A1–A3) to the environmental profile of Ordinary Portland cement. Calculated using data from Table 7.
Typically, in LCA studies for cementitious products, Module A3 tends to have the major impact, and indeed, in the current case, Module A3 has a substantial effect on Climate change [,,,,,,,] but not on other environmental impact categories.
This is due to the compliance with EN 15804:2012+A2:2019 [], which suggests the incorporation of energy use (i.e., electricity generation) into Module A1 rather than A3 []. In fact, the modularity principle states that processes affecting the final product’s environmental performance throughout its life cycle shall be assigned to the module where it occurs, and that all environmental characteristics and impacts shall be declared in the life cycle stage where they appear.
Since energy (like raw materials) is an input in the manufacturing stage, and not a product, the impact incurring from its generation should be assigned to the module A1 []. Module A3 only concerns the consumption of energy, raw materials, other consumables, machinery use and subsequent direct emissions (e.g., CO2 from raw materials decarbonation) for manufacturing the product []. Finally, waste formation, which impacts across all modules A1–A3, is found to have a negligible effect in any of the core impact categories.
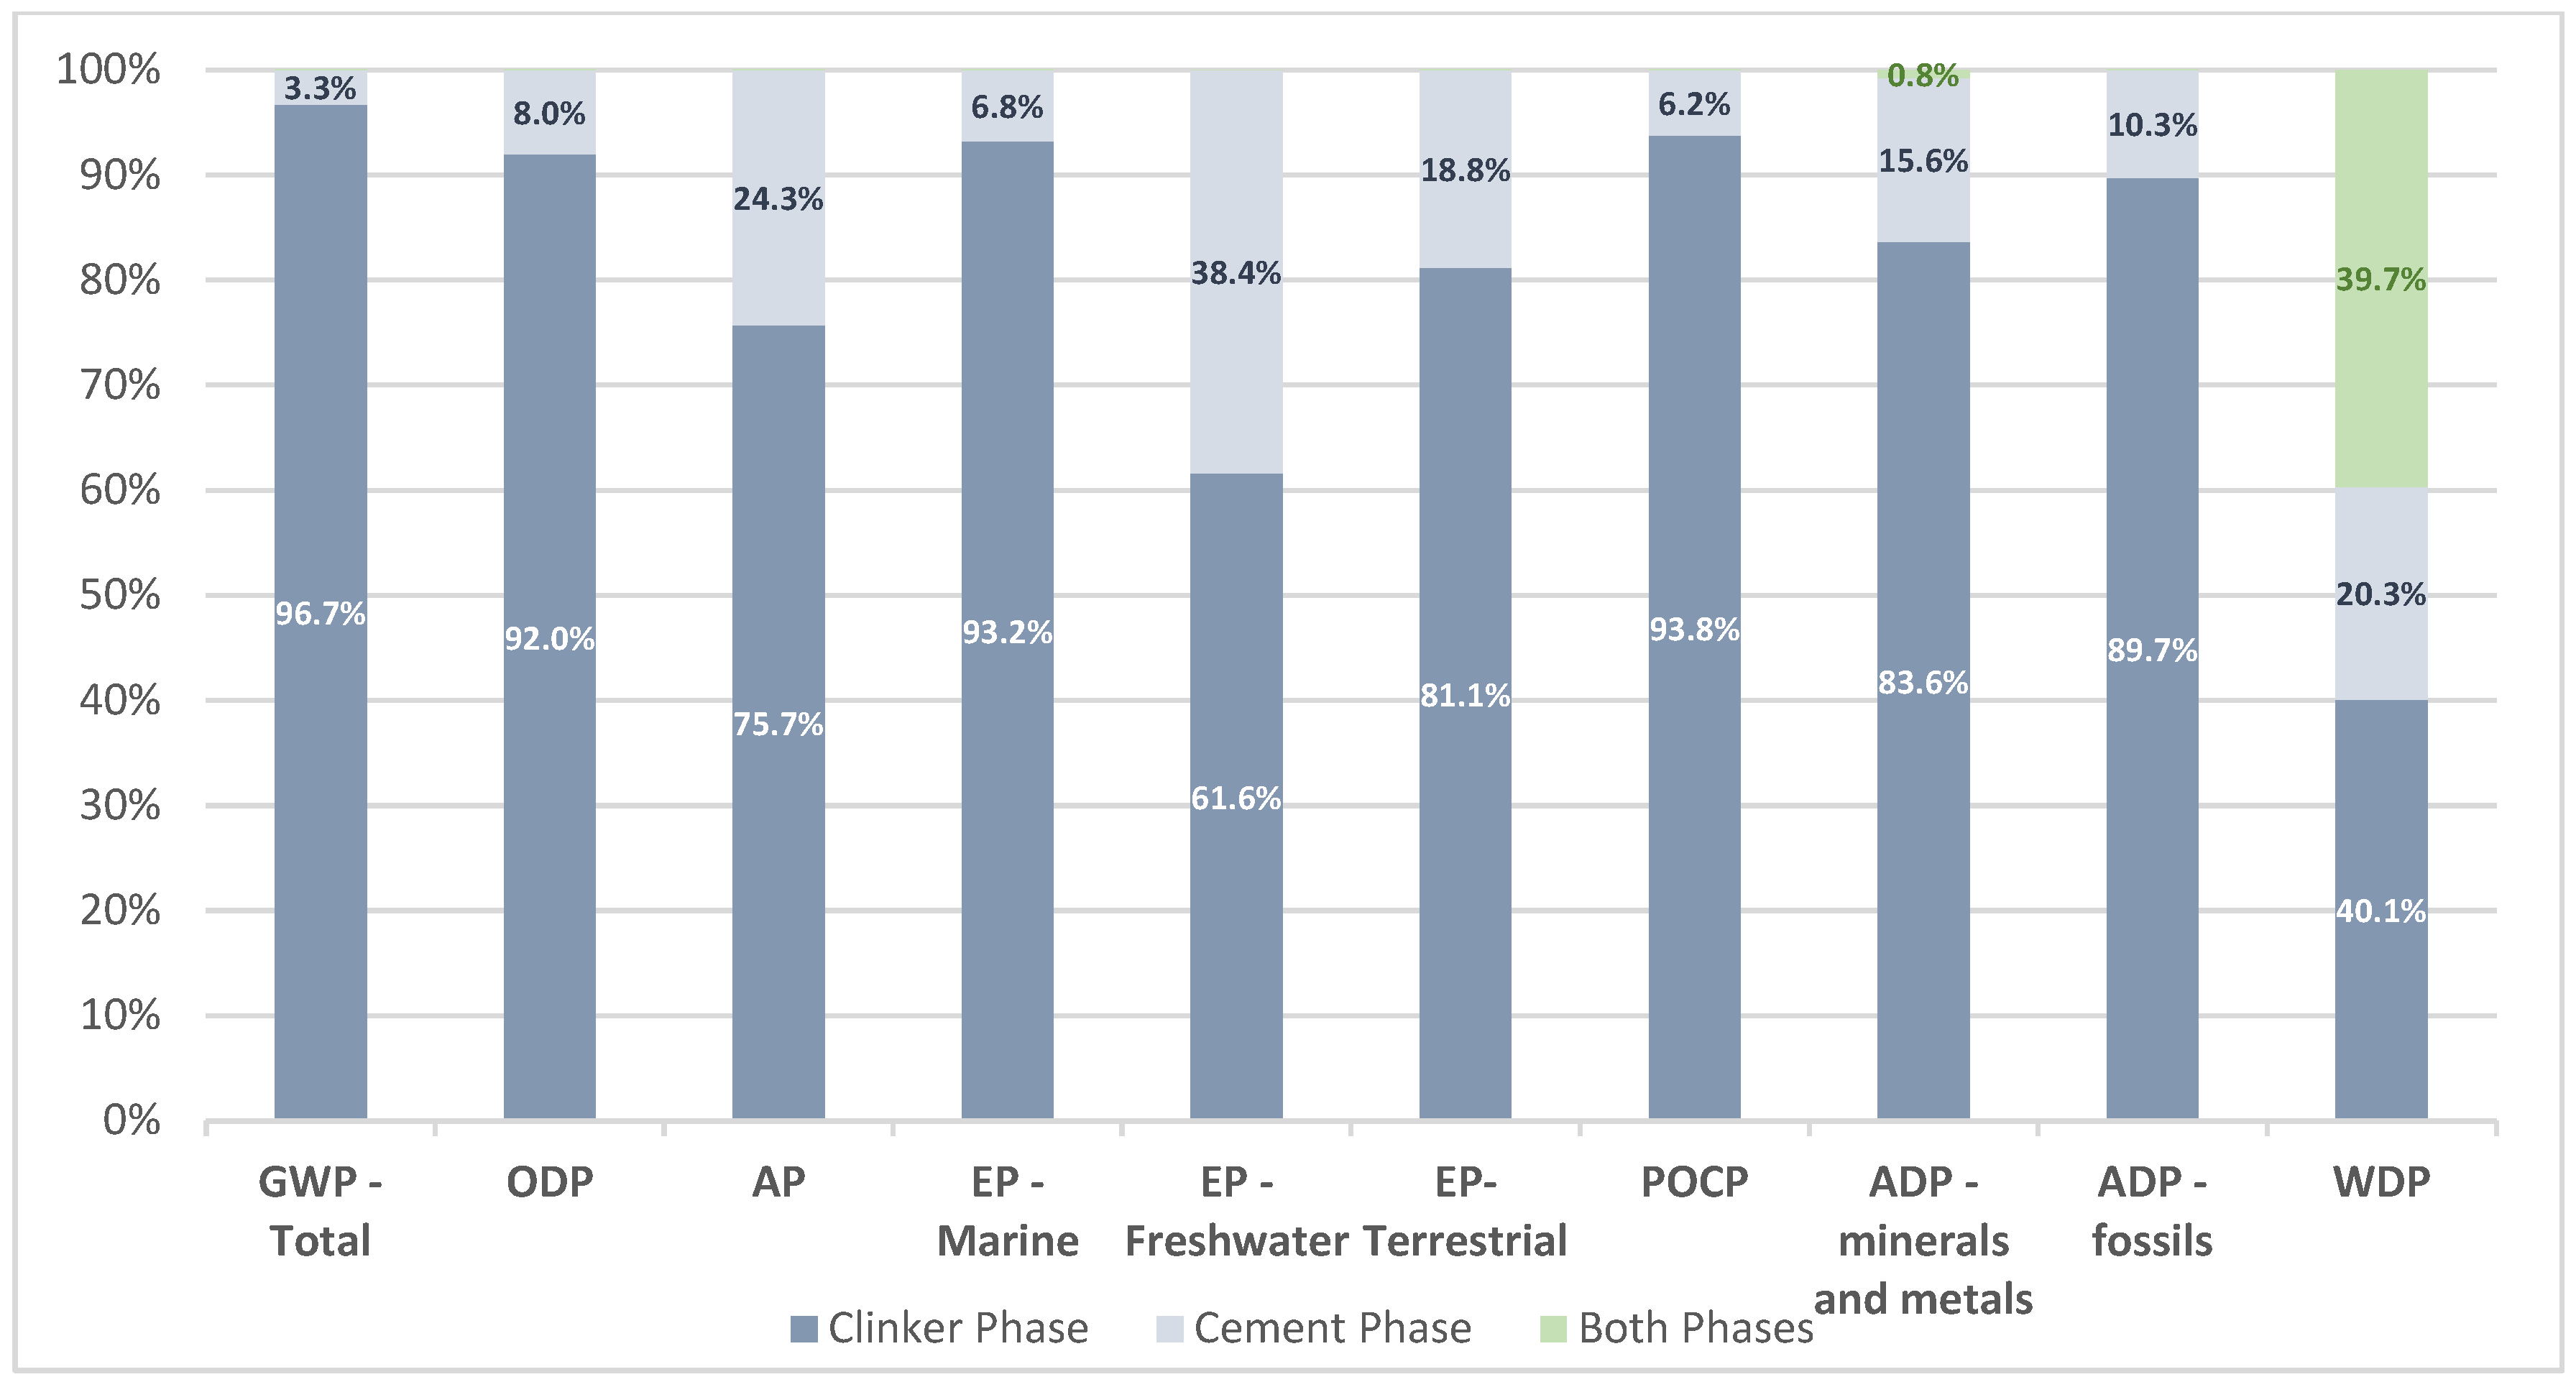
Analysing Figure 6, it is evident that the clinker phase is a major contributor for the overall environmental impact profile. With exception of three impact categories (Acidification, EP—freshwater and Water Depletion), the environmental burden incurring from clinker manufacturing is markedly higher (over 80%), particularly in the case of Climate change where its contribution is over 96%. Such an outcome is not surprising, being in line with expectations from the literature, as clinker content is a well-known factor that dominates the carbon footprint of cement and is regularly referred as a main pathway for decarbonisation [,,].
Figure 6.
Contribution of clinker and cement phases to the core environmental impact LCIA results.
Nonetheless, clinker is the main constituent of cement, and, to current knowledge, it is not feasible to fully substitute it with less impactful alternatives while attaining the same mechanical and chemical properties [,]. There are indeed promising developments on ‘low clinker cements’ such as Limestone Calcined Clay Cement or using other binders, but even these alternatives would still require a clinker content of 50–65% [,,,,,].
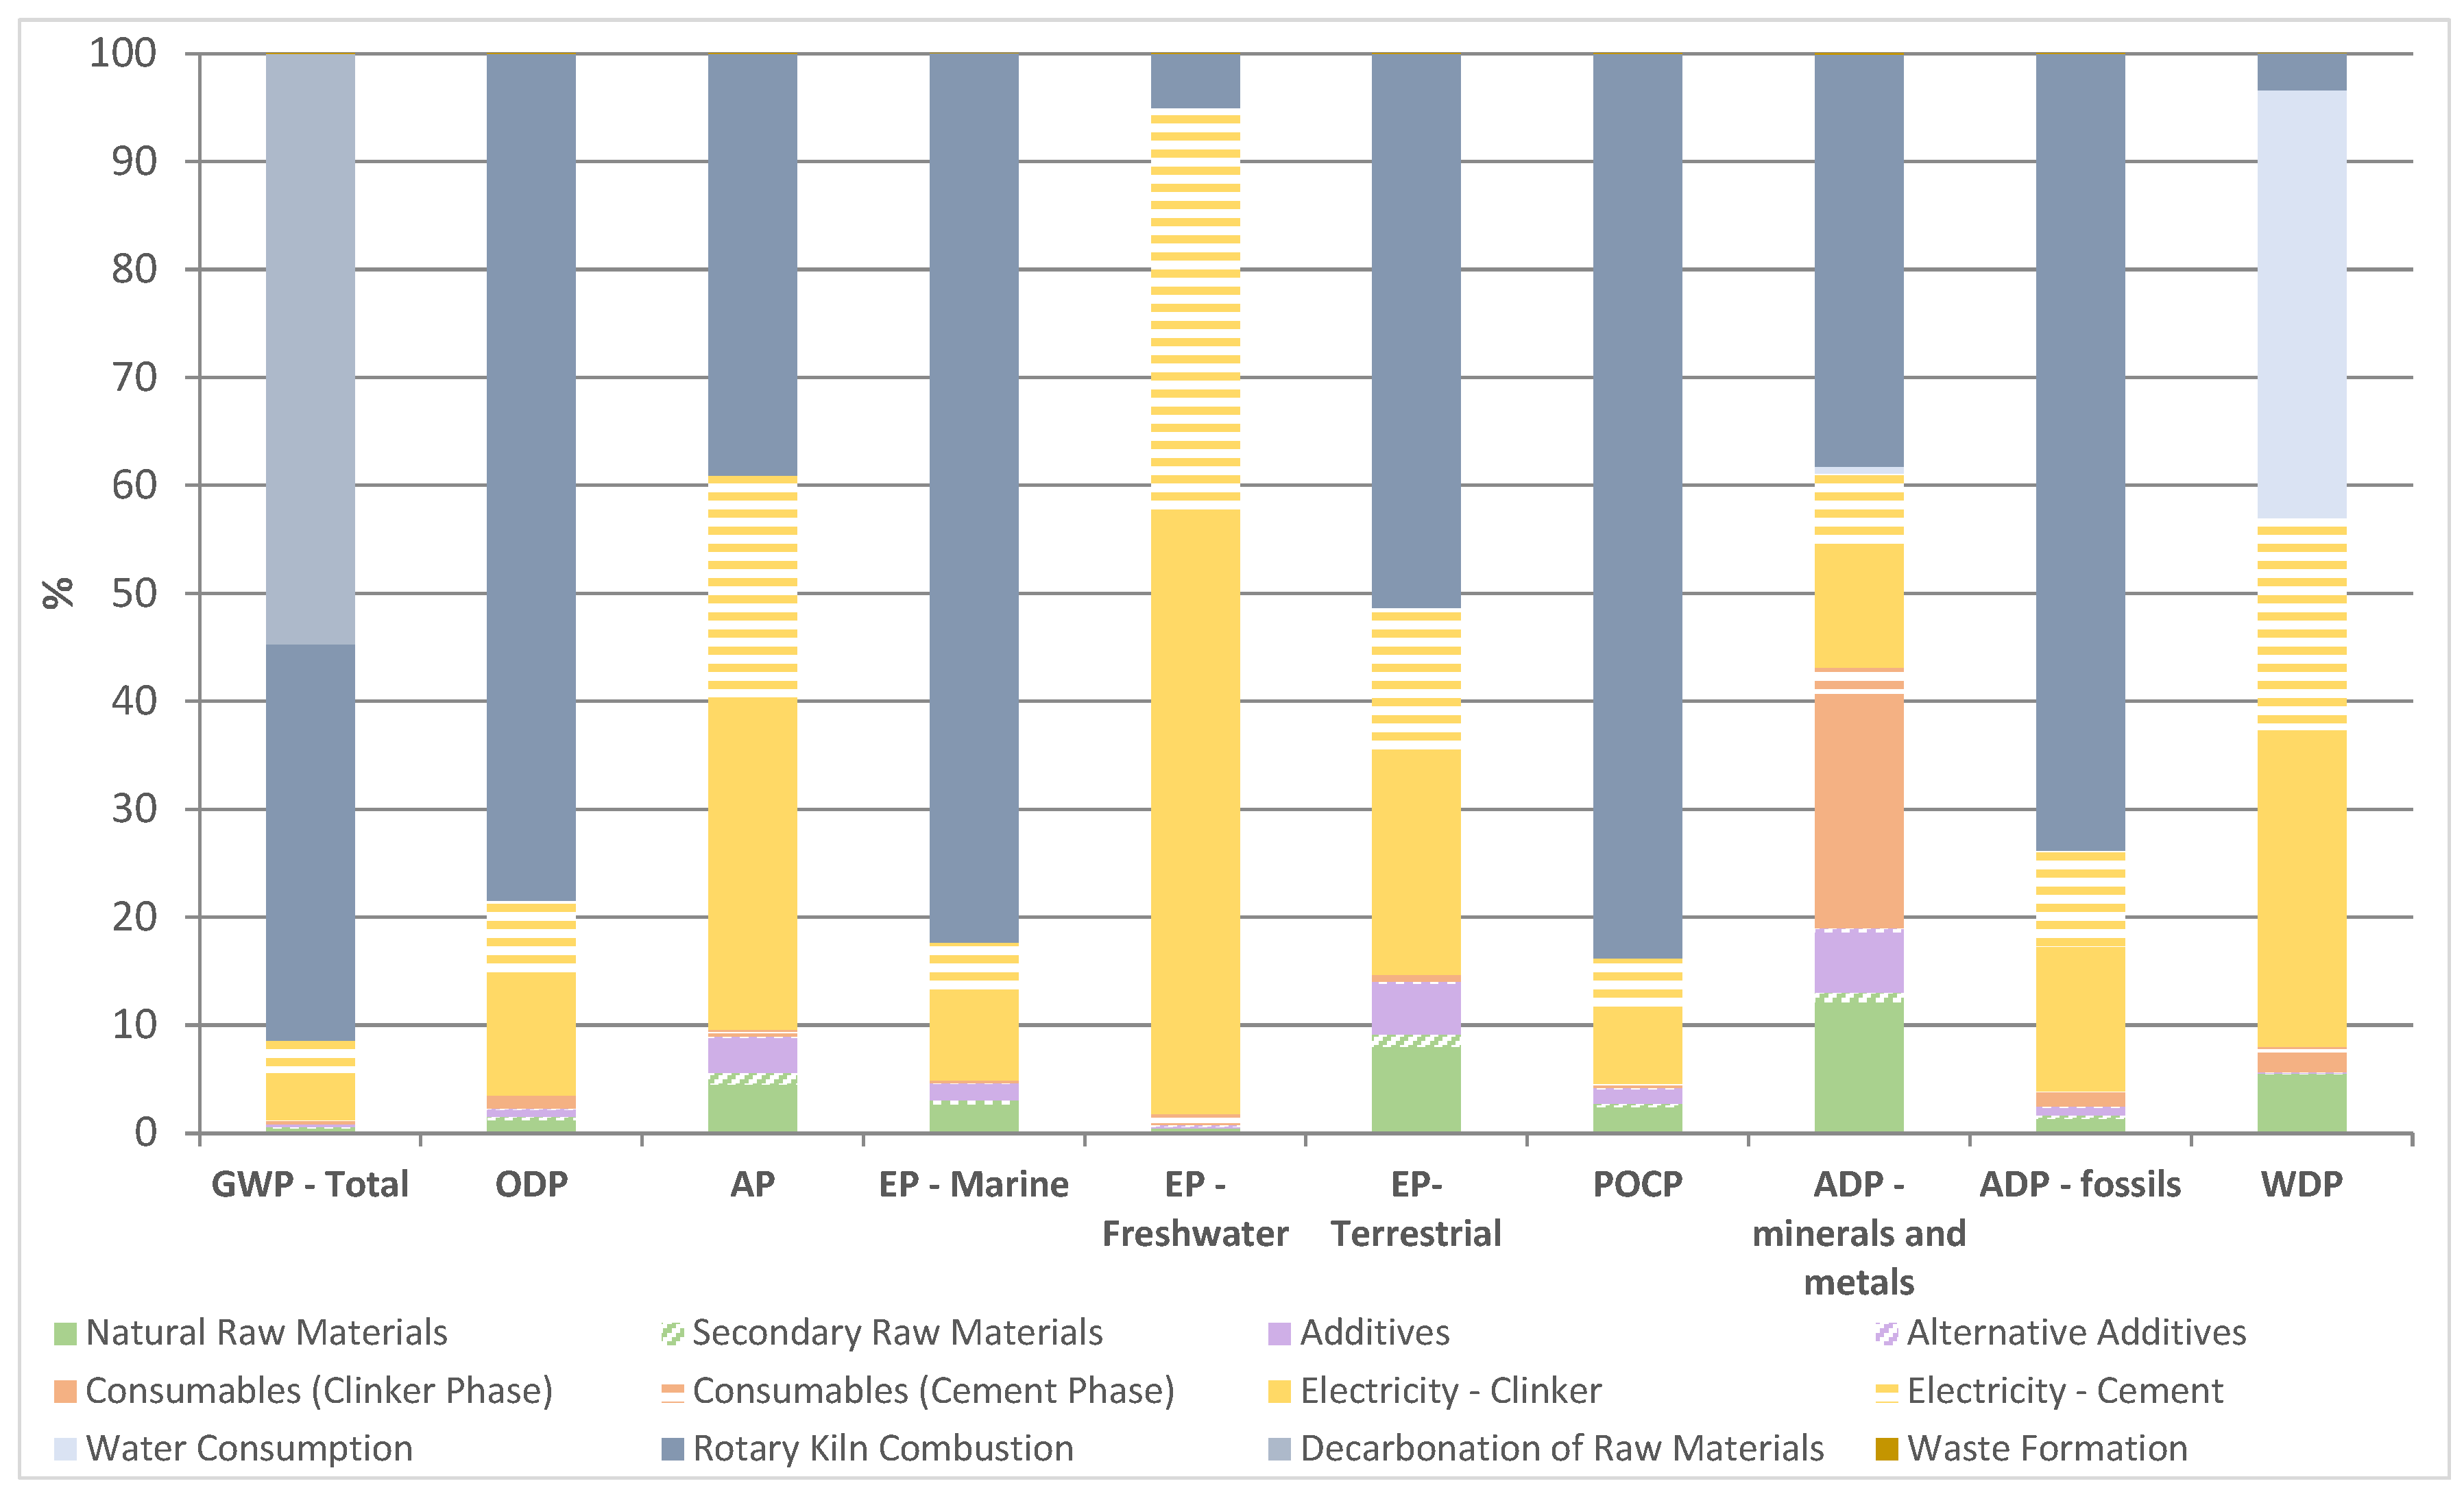
Figure 7 offers a closer inspection on core impact on different categories, organised across the main manufacturing processes. One can observe that the rotary kiln system, part of the clinker manufacturing, is primarily responsible, specifically due to fuel combustion and decarbonation of raw materials.
Figure 7.
Characterisation of the core impact indicators results for cement manufacturing (Modules A1–A3).
While the former can be tackled through the increased usage of waste and biomass as alternative fuels, the latter is mostly unavoidable as the calcining is an essential step to produce clinker and provide its desired properties [].
Figure 7 also reveals the second most relevant factor to be generation of the electricity that is consumed during manufacture, an indirect impactor as the environmental load happens outside geographic boundaries and is independent of producers.
This effect is particularly visible in five impact categories: Acidification potential; Eutrophication—freshwater; Eutrophication—terrestrial, Abiotic Depletion—fossil; and Water Depletion, whose results appear to be influenced by electricity generation (above 20%).
Although expected by the literature, the LCIA results obtained from this inventory expand the knowledge on the subject by providing a precise division of impact between each process and sub-process, being able to accurately pinpoint hotspots. For instance, besides the CO2 emissions originated from calcining, which affect Climate change substantially, all impact categories seem to be almost entirely affected by heat and electricity generation, especially during clinker phase, which is particularly energy intensive. Moreover, the rotary kiln system (including combustion and calcining reactions) together with electricity generation are the major contributors for all core environmental impact categories (Table 8).
Table 8.
Distribution of the core impact indicators between materials supply, energy and waste formation.
With the exception of Abiotic Depletion—minerals and metals and Water Depletion, the two processes are responsible for over 85% of the impact from all the remaining categories. Beside the aforementioned exceptions, the contribution from freight transport (see Figure 5), extraction and processing of materials (raw, ancillary or consumables) and formation of waste is deemed not substantial in the majority of the impact categories.
In conclusion, the LCIA results confirm that calcining, energy use and clinker content are clearly the key assets that direct the environmental impact of cement manufacturing, and are the evident targets for enhancement. These needs are indeed reflected in ATIC carbon neutrality roadmap, whose main goals are centred on improving energy efficiency, increasing the use of alternative fuels, reducing the clinker content, using decarbonated raw materials and betting on emerging technologies such as carbon capture.
4.1. Carbon Footprint Analysis
Normalisation is a controversial tool among LCA practitioners; however, it provides some insight concerning the relative importance of each impact category for specific cases []. The ‘EN 15804 + A2 (adapted) V1.00/EF 3.1’ LCIA method from SimaPro provides normalisation based on the European Commission method ‘Environmental Footprint 3.1’ which was used to obtain the results depicted in Figure 8 [].
Figure 8.
Normalised results for the core environmental impact indicators [].
The general perception gathered from the cement sector recent endeavours, is that focus is undoubtedly on decarbonisation [,,,,,,]. The normalised LCIA results from Figure 8 corroborate such a stance, as Climate change is distinctly the most relevant category amongst all core impacts indicators.
To expand on the topic, Table 9 and Figure 9 provide a carbon footprint analysis to assess CO2 flows from every process or subprocess. Not to be confused with the impact category ‘Climate change’ which is expressed in kg CO2-equivalent and includes the contribution of other greenhouse gases (such as methane) to the overall impact, this carbon footprint analysis focuses solely on carbon dioxide emissions.
Table 9.
CO2 footprint (in Kg of CO2 emitted) from manufacturing one tonne of Ordinary Portland cement in Portugal.
Figure 9.
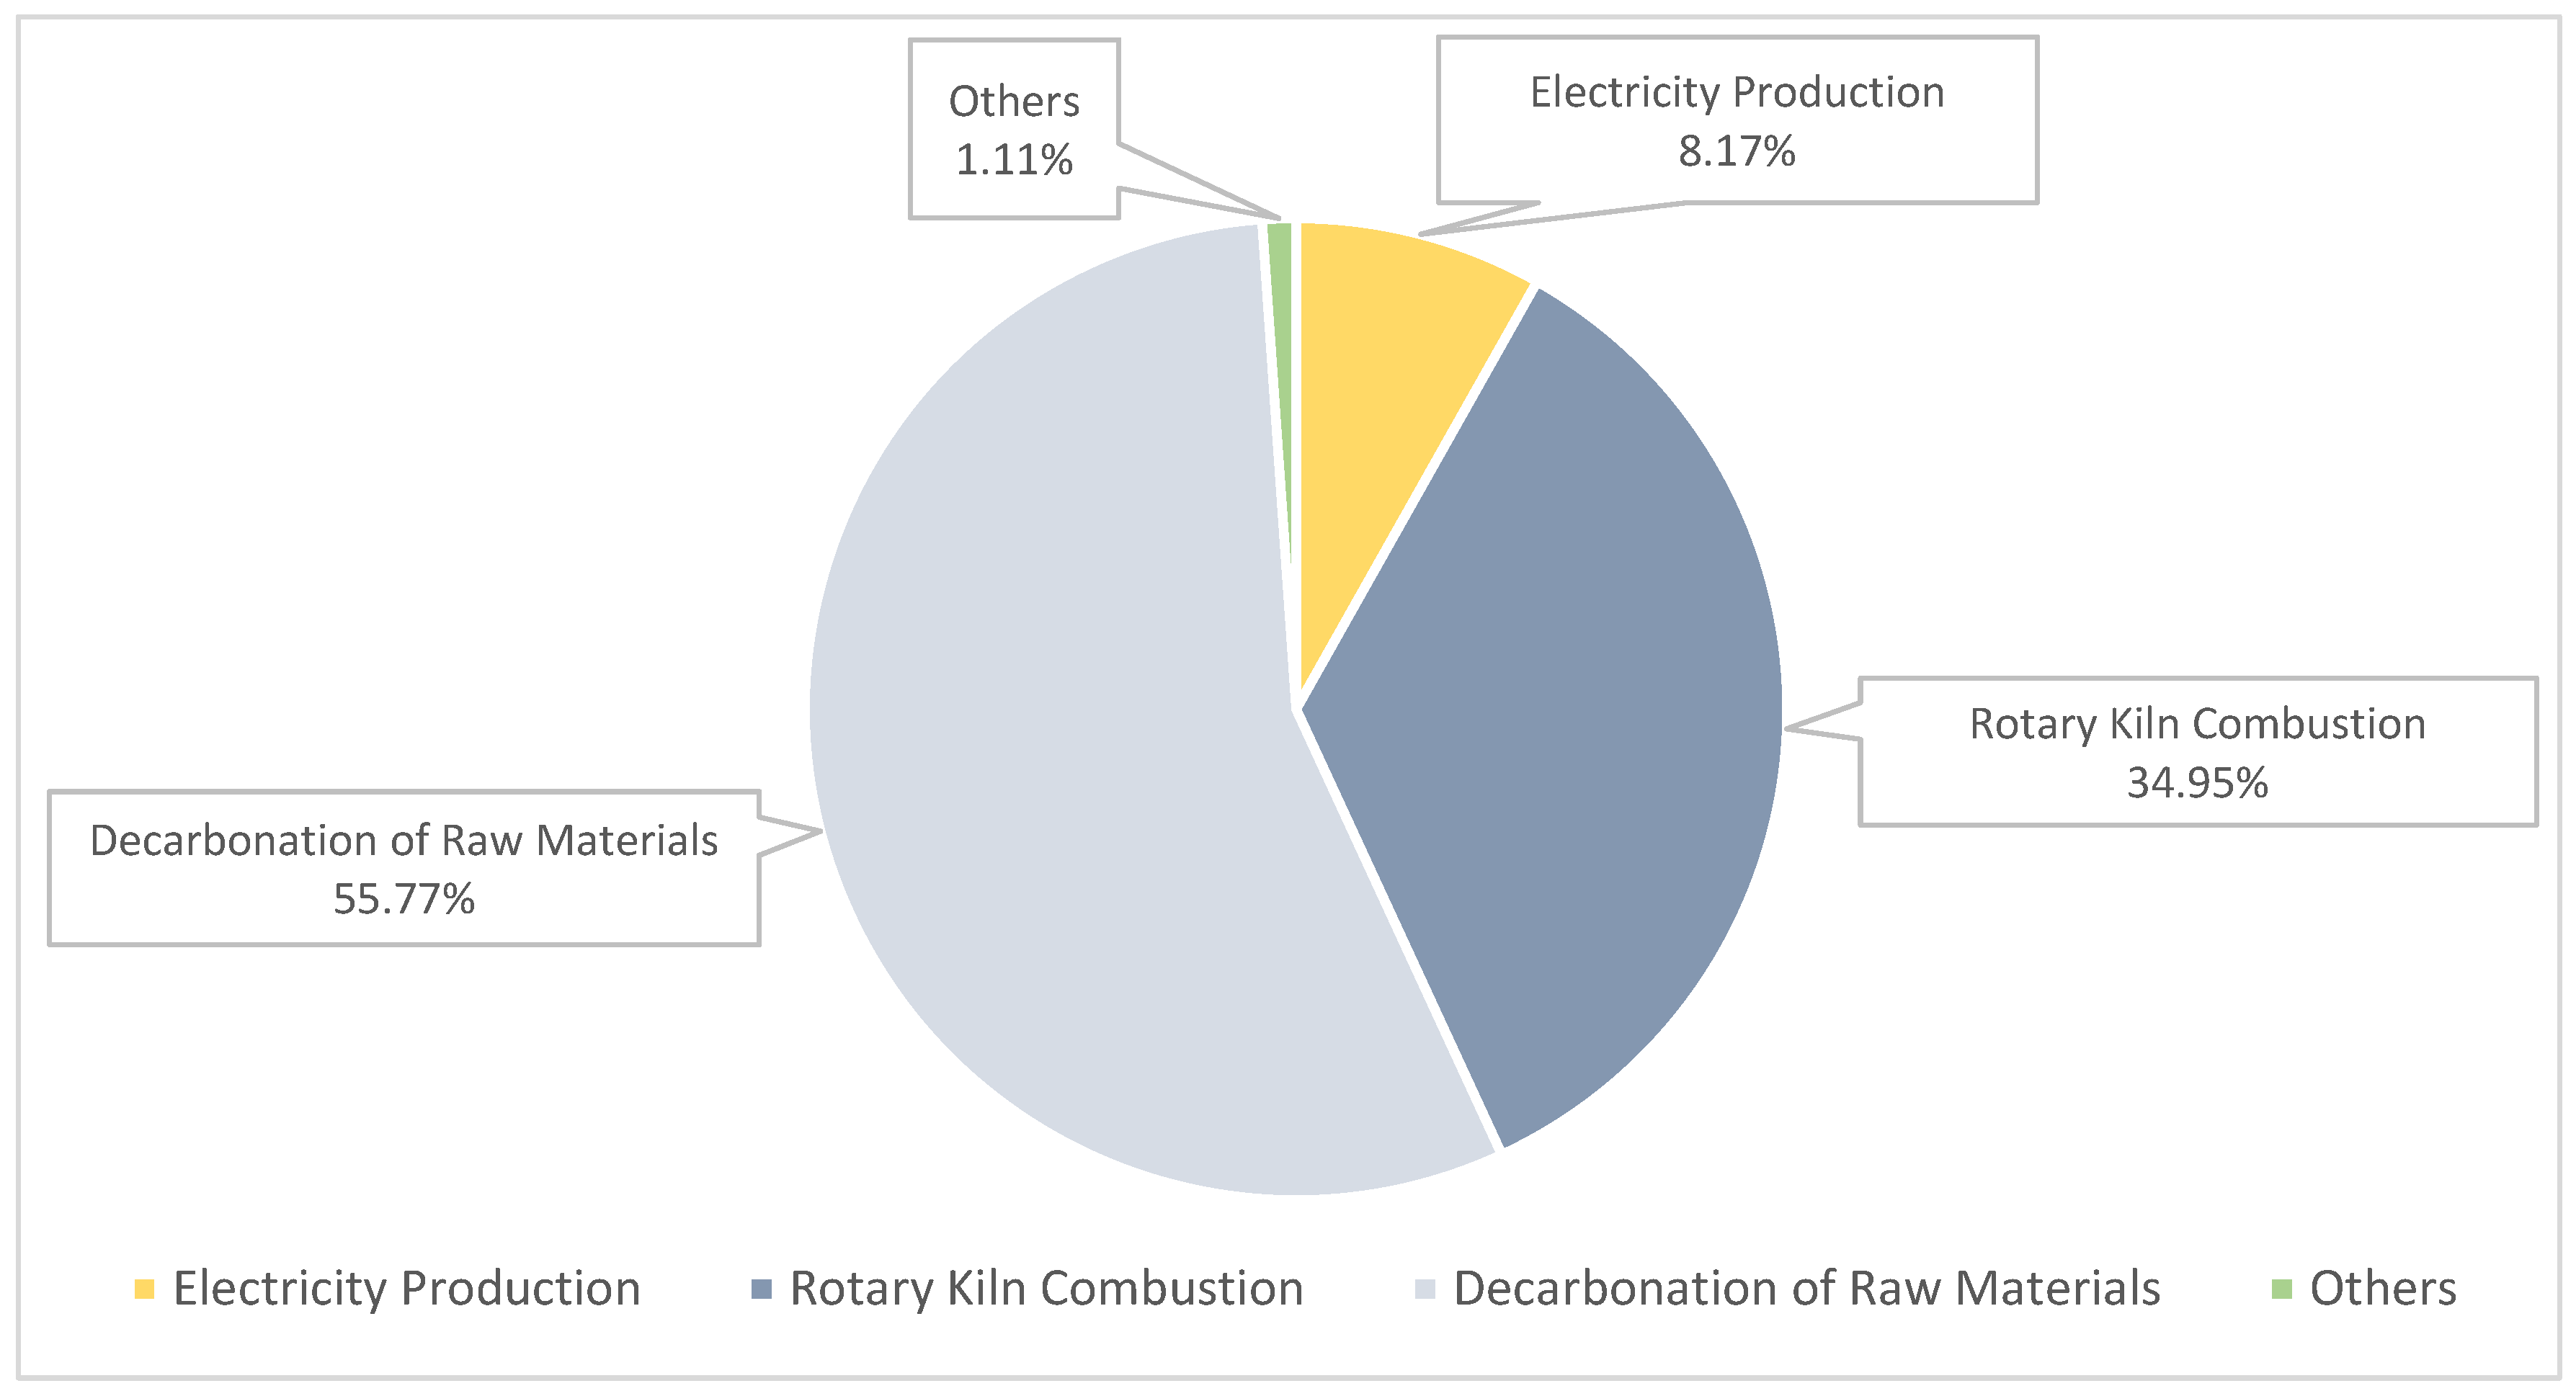
Sources of CO2 emissions.
The overall CO2 emissions are around 733 kg per tonne of cement manufactured, and unsurprisingly the decarbonation reaction, rotary kiln combustion and electricity generation are the largest sources, being responsible (direct and indirectly) for 409 kg (56%), 256 kg (35%) and 60 kg (8%) per tonne of cement, respectively. Together these critical processes correspond to over 98% of the total carbon released to the air from this industrial sector. Moreover, 96% (~701 kg) of the emissions are related to the clinker phase, and over 90% (633 kg) originate directly from within premises of the production units (see Table 1, 2 and 7), mainly from the kiln exhaust chimneys (632 kg) and a small portion from vehicles and machines such as the quarry trucks (~1 kg)—data obtained from SimaPro 9.5 software.
Regarding the nature of CO2, around 40.9% has a fossil origin, 55.8% is from other sources (mainly dicarbon ation) and only 3.2% has a biogenic nature from biomass combustion in the rotary kiln and co-generation power plants. In the reference year of 2018, the Portuguese cement industry was responsible for releasing over 3.9 million tonnes of CO2 to the atmosphere, which corresponds to roughly 7% of the total Portuguese emissions (53.9 Mton) on that year [].
4.2. Electricity Generation Mix Sensitivity Analysis
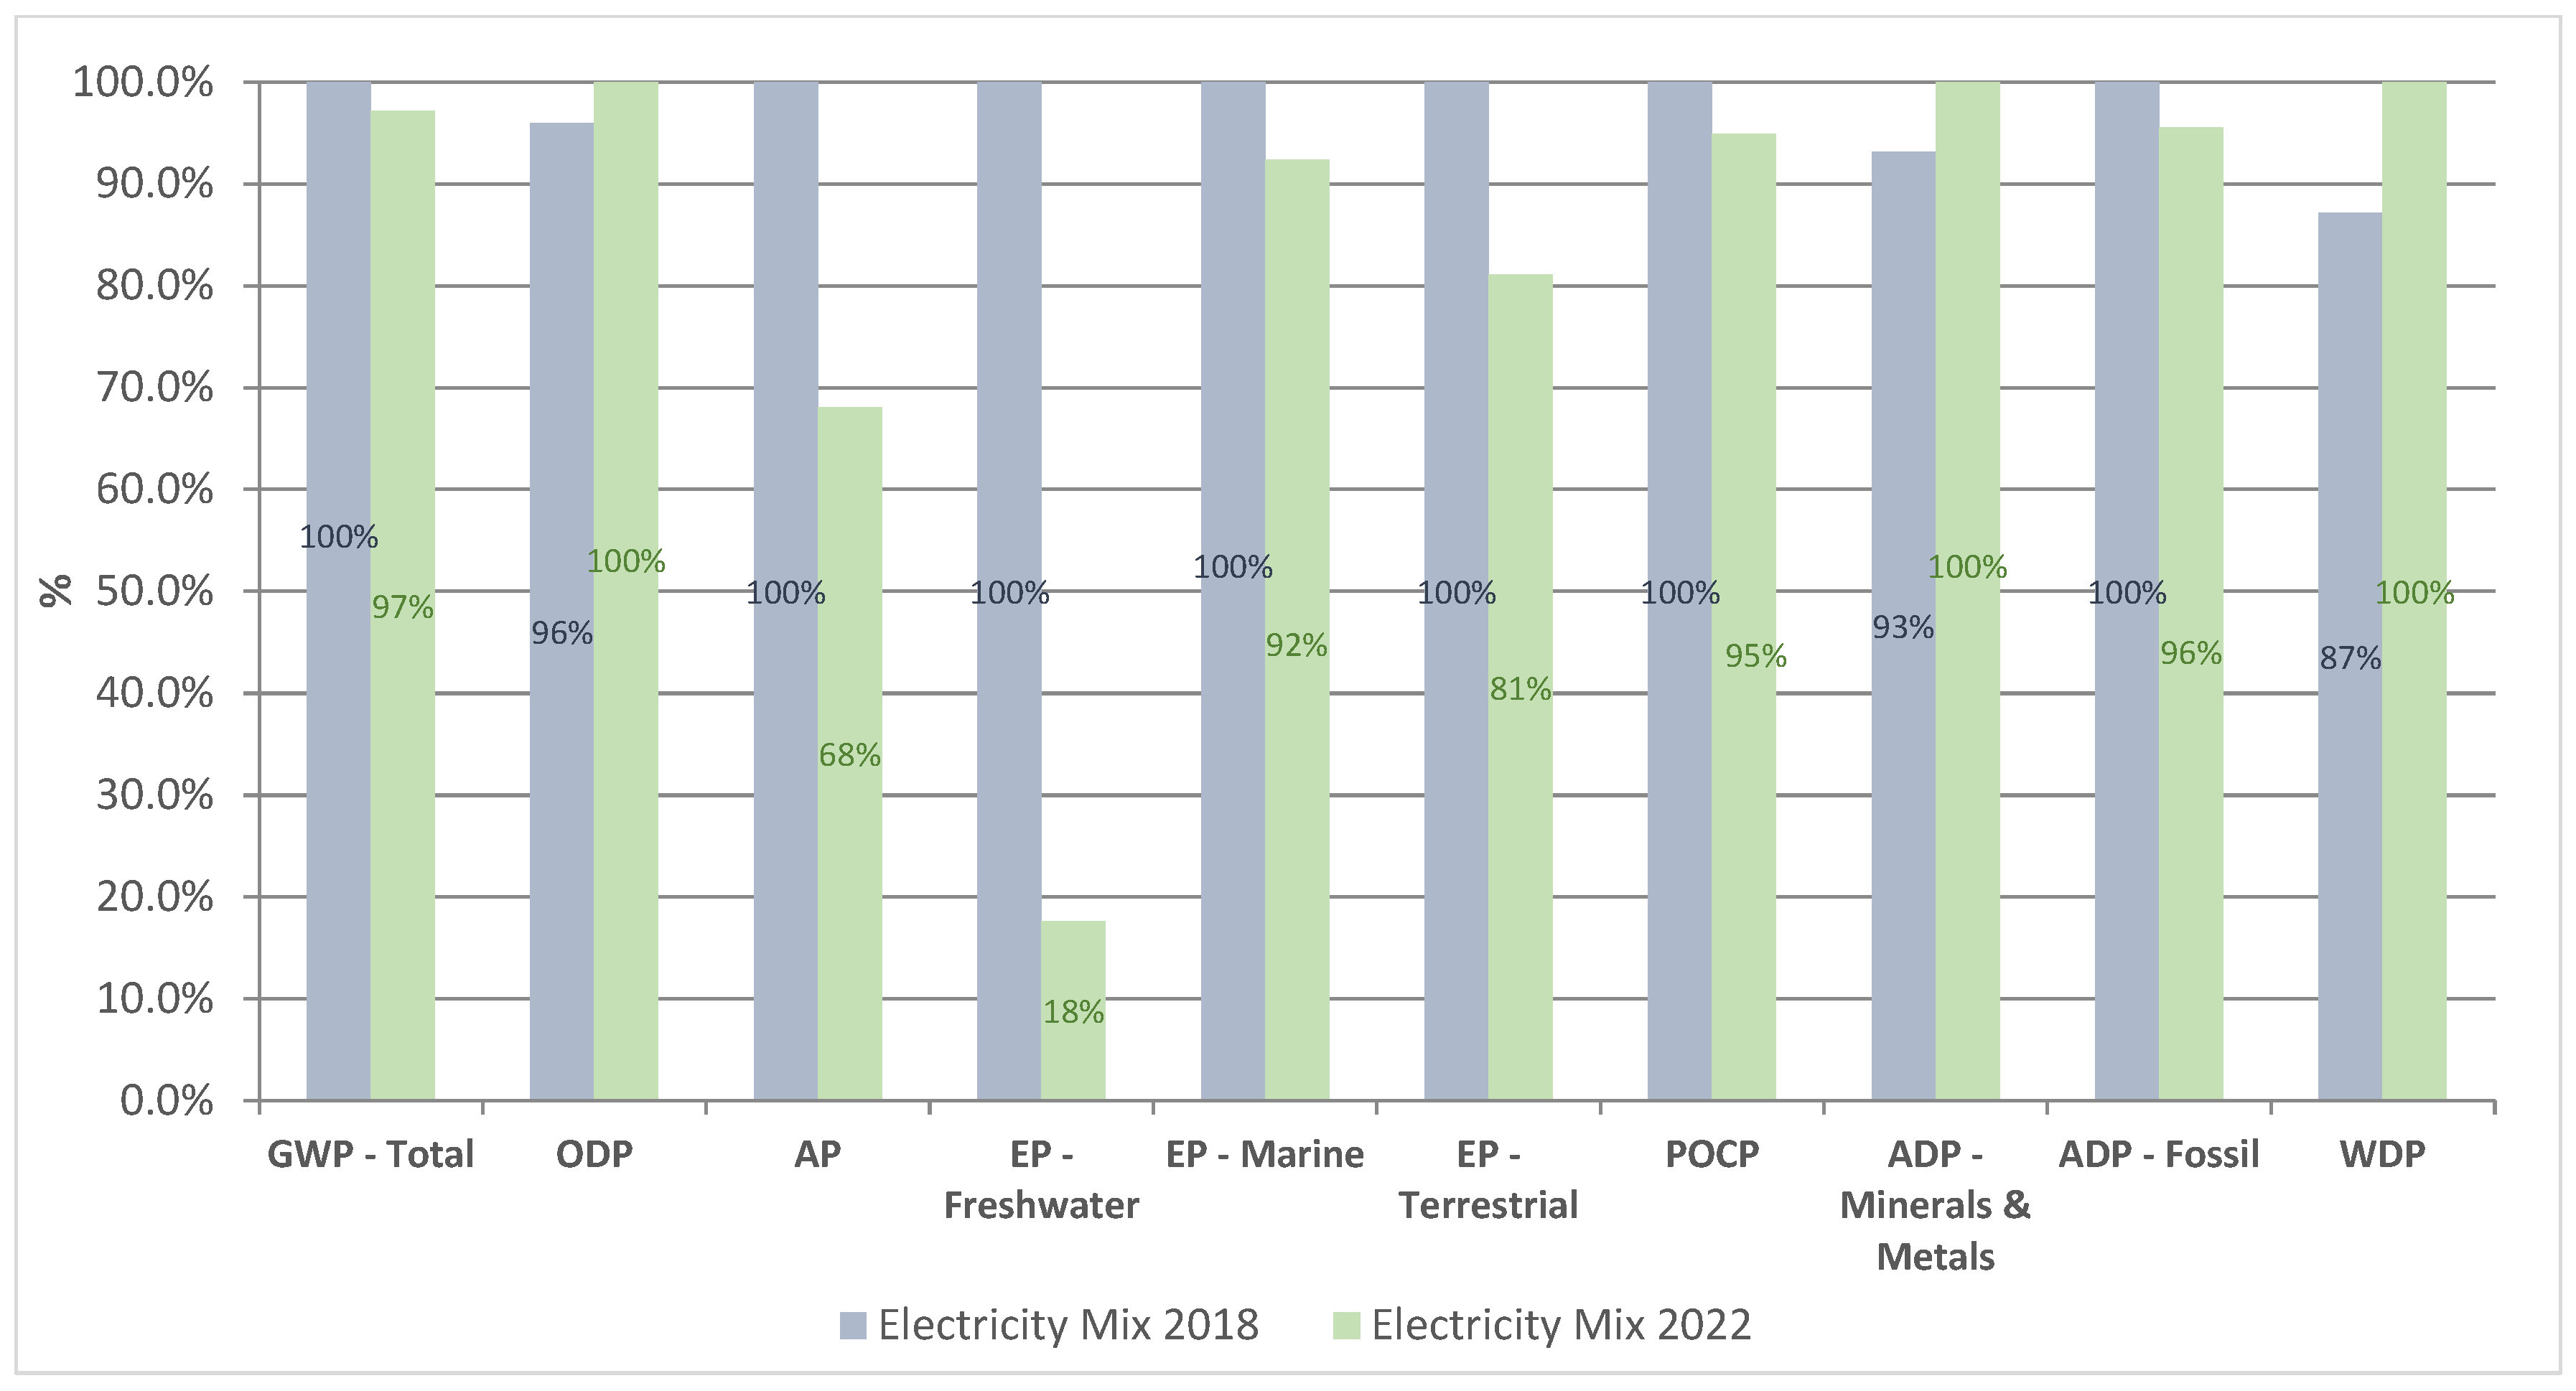
Although the industrial partners refer that no perceptible change occurred internally within the sector, the electricity generation mix directly influences LCIA results, and here the inventory contemplated a 19% contribution from coal power plants. Figure 10 demonstrates the effect of the more recent energy generation mix by comparing the LCIA results using the original 2018 mix against a newer mix from 2022 in which coal production is negligible (2022 production mix available in the Supplementary Materials) [,].
Figure 10.
Comparison between LCIA results using 2018 (baseline) and 2022 electricity generation mix in Portugal.
As anticipated, the impact categories that are more impacted by electricity generation are also the most affected, particularly Eutrophication—freshwater whose impact under the 2022 mix is almost a sixth of the original result and Acidification potential, with a reduction exceeding 30%. Other categories, such as Climate change, are not so affected as the magnitude of the impact originated from within the factory premises is so large that, by comparison, any other factor is relatively small. Furthermore, there are also categories, such as Ozone depletion, that worsen with the change, albeit at a very small scale that can be considered negligible. In essence, apart from some exceptions, overall changes are not very substantial but are still meaningful and prove to be insightful.
For instance, this analysis also demonstrates how parts of the environmental profile for cement manufacturing can be highly sensible to external factors outside of the producer’s influence and potentially taint result interpretations by policymakers. In the case of freshwater eutrophication, most of its impact was seemingly due to electricity generation from coal power plants rather than any activity occurring within the cement production units.
While cement producers are proposing in-house electricity generation through renewables and heat waste co-generation in order to alleviate their external energy dependency, it will always be dependent on the electrical grid to some extent. LCA studies for cement manufacturing shall always consider, acknowledge and guarantee representativeness of the electrical grid mix as it can affect the final environmental profile and potentially skew result interpretations.
4.3. Effect of Using Alternate Impact Assessment Methodologies
The LCIA stage aims to measure the environmental impact of a product or service system by converting each substance flow within the inventory into environmental impact categories (e.g., Climate change in kg CO2-eq). This transposition is achieved through linear weighted aggregation, using characterisation factors (CF) to determine the contribution of each substance flow to a specific impact category unit [,].
‘LCIA methods’ are ready-made sets of CFs for a pre-selected group of impact categories, allowing the LCA practitioner to easily attribute quantifiable environmental impacts to a modelled system [,].
A wide range of methods are available, usually adapted to the challenges of a specific region (e.g., EU EF 3.1) or focused on a single issue (e.g., energy demand). Each method may use different sets of CFs for the same substances flow in equivalent impact categories, leading to different results even if the system being assessed is the same. In addition, some methods use different units for identical categories (e.g., Acidification potential in EF 3.1 has the unit ‘mol H+’, whereas CML-IA uses ‘kg SO2-eq’). These discrepancies introduce uncertainties that may cause confusion for readers trying to compare the environmental impacts of two similar products [,,].
LCA practitioners usually select a LCIA method based on the goal and scope of a study, but in specific cases the list of impact categories and their units are defined by guidelines.
In this paper, being in the context of an EPD, the EN 15804:2012+A2:2019 standard provided the guidance []. However, from October 2022, a revised version of the standard (A2) became mandatory, implementing a different impact assessment method that introduced new impact categories, changed the units of the existing ones and adjusted the CFs.
In order to assess the impact of using different impact assessment methodologies and to examine the changes introduced by the A2 revision, nine methodologies were selected from the SimaPro 9.5 software (see Table 10) to compare the results obtained in four impact categories that share the same unit to ensure direct comparability: Climate change (kg CO2-eq.); Ozone depletion (kg CFC11-eq.); Resource use (or Abiotic depletion)—minerals and metals (kg Sb-eq.); and Resource use (or Abiotic depletion)—fossils (MJ).
Table 10.
List of the selected impact assessment methods for the comparative study [,,,,,,,,].
Table 11 and Figure 11 compare the environmental impacts of manufacturing ordinary Portland cement (based the inventory established in Section 3) using the designated LCIA methods.
Table 11.
Results for equivalent categories, using various LCIA methods. Legend on Table 10.
Figure 11.
Effects of various impact assessment methods on the results of equivalent impact categories. Legend on Table 10.
At first glance, it is clear that Climate change shows the least variability, which is in line with expectations as it is a fairly mature category where most of the methods are, to some extent, based on the IPCC method []. However, some discrepancies are still observed, with a range between 729.4 and 760.7 kg CO2-eq (4.2% of the average result).
A notable case in cement environmental studies, and a plausible justification for the discrepancy observed, is the approach to biogenic carbon.
Some methods, such as CML-IA (used for EN 15804:2012+A1:2013), consider all biogenic carbon flows neutral, regardless of their origin or system boundaries, whereas EN 15804: A2 assumes that biogenic carbon contributes to Climate change and is only neutralised when it is removed from the atmosphere [,,,].
As approximately 13 kg of biogenic carbon is emitted per tonne of cement (see Table 2), most of the differences between the LCIA results can be justified, within reason, with the handling of biogenic carbon by the different impact assessment methods. In fact, looking at the CFs of the nine methods, only EN 15804:2012+A2:2019 (EF 3.1) and EN 15804:2012+A2:2019 (EF 3.0) give a positive contribution of ‘+1’ to biogenic carbon emissions, being precisely the methods that outputted the most severe impacts, while the rest considers a null contribution or do not even cover biogenic carbon flows at all [,,,,,,,,,].
Ozone depletion is the most affected of the analysed categories, ranging from 3.1E-6 to 5.0E-6 kg CFC11-eq, with this range representing almost 44% of average result. Methods based on the Environmental Footprint (EF) have comparable results, among the highest, suggesting the use of CFs that are more penalising. The other European methods are those used in previous revisions of the EPD standards (“CML-IE” and “EPD 2018”).
These are more lenient (~20% less impactful result), meaning that the methods chosen for the revised standards use a different set of CFs, which significantly changed the results for this category. The last group concerns IMPACT World+ and TRACI, which are the most penalising methods for this category. Although these produce similar results, they do so for different causes, either by using a rigorous CF, as in the case of IMPACT World+, or because of a greater coverage of substances, as in the case of TRACI, whose list of CFs contains 96 elements (for comparison, EF 3.1 contains 46 substances in its Ozone depletion CF list). As for BEES+, it is an outlier, using the most lenient set of CFs, which upon further consultation reveals a CF list of only 6 substances with mild weighing [,,].
The two Resource use categories (or abiotic depletion) show the same trend, where the methods based on Environmental Footprint give the same result, indicating that the CFs remain the same as those used by EF 3.0. As for CML-IA and EPD 2018, the results are also identical between them, with slightly lower results in the case of fossil and slightly higher results in the case of minerals and metals, when compared to the EF-based methods. This suggests that the CFs have been slightly revised, but not to the extent that they produce significantly different results, as was the case for Ozone depletion. As for IMPACT World+, it is again characterised by its harsher results, suggesting that this method is generally based on sets of CFs that provide ‘worst case scenarios’. Apart from Climate change (which is still the ‘neutral biogenic carbon method’ with the most austere result), IMPACT World+ has the harsher results across the board, indicating that this method is particularly severe in its environmental impact assessment.
The selection of an impact assessment method is an essential step in an LCA study, and the practitioner is expected to make their choice based on the objective and scope of the project, or on standards such as EN 15804:2012+A2:2019 in the case of EPDs for construction materials.
LCIA methods must not be directly compared as different categories, units and characterisation factors are used, even if the same inventory is used and the impact category units are the same.
Different results can be expected, with differences ranging from less than 2% to more than 44% compared to an average result, depending on the impact category. The LCA practitioner should be aware that different methods produce different results, with some methods, such as IMPACT World+, appearing to be more punitive in their impact assessment and others, such as BEES+, tending to be more forgiving in their results.
These different LCIA results can therefore lead to different interpretations by the reader depending on the method chosen, so the LCA practitioner, if given the opportunity, should provide different results using different methods to provide a solid support for their conclusions.
Figure 12 shows the variance between the results obtained by running EN 15804:2012+A2:2019 and the EN 15804:2012+A1:2013 (CML-IA) methods, providing a platform for comparing the two versions of the standard for the impact categories that retain the same unit. Climate change and Resource use—fossil show the lowest variability (less than 2%), with the newer standard yielding a slightly higher result. For Ozone depletion, on the other hand, the outcome is very disproportionate, with the new standard producing a result almost 20% higher than the previous revision, which is a significant difference, probably due to a heavily revised set of CFs.
Figure 12.
Percentual variance between LCIA results from EN 15804:2012+A2:2019 based on EF 3.1 and EN 15804:2012+A1:2013 based on CML-IA baseline.
Resource use—minerals and metals was the only case where the impact decreased using the method recommended by the revised standard, with a significant decrease of 5.5%. It should be noted that the last two impact categories are allegedly the least relevant for the cement environmental profile (see Figure 8), but this may not be the case for other product systems.
Consequently, with regard to the revised EN 15804:2012+A2:2019 standard, the disparities remained comparatively minor (albeit quantifiable) for the majority of categories that maintained the same unit (less than 6%), with the exception of one impact category, where the outcomes exhibited substantial variation. Therefore, direct comparisons between EPDs based on the previous revision and the current revision must be clearly discouraged to avoid erroneous comparisons between incompatible documents.
5. Conclusions
This work developed an accurate representation of the environmental profile of the average Ordinary Portland cement, with a view to producing an Environmental Product Declaration and providing a detailed study of the current performance of this industrial sector. A detailed Life Cycle Assessment (LCA) model has been successfully applied, and the results of the impact analysis are in line with expectations from the literature.
The clinker production phase, in particular the rotary kiln system, was found to be the major contributor to the overall environmental impact of cement. The high resolution of the model allowed the identification of environmental hotspots related to the generation of thermal and electrical energy, as well as the calcination reaction within the kiln. Exogenous factors, such as electricity generation, were found to have a significant impact on some environmental impact categories, and therefore the modelling should be accurate and representative of the region of interest. Climate change is the most relevant impact category, and the product carbon footprint analysis showed an average emission of 733 kg CO2 per tonne of cement produced, of which 97% is from the environmental hotspots.
It should be noted that between the reference year and the moment of writing, the composition of the fuel mix for the rotary kiln was subject to alteration. This fact may have some impact on the results. However, the differences are not considered significant enough to lead to a change in the main conclusion of this paper.
The choice of an impact assessment method is crucial, as it can strongly influence the results and their interpretation. To minimise such problems, LCA practitioners should consider providing results from more than one method where possible.
As transparency and comparability are a cornerstone of EPDs, it is important to recognise that construction materials EPDs submitted after the A2 revision became mandatory (October 2022) will be incompatible with EPDs based on previous amendments. Furthermore, as these documents have a validity period of 5 years, this problem is bound to persist until October 2027.
Newly submitted EDPs should clarify this issue to avoid incorrect comparisons between documents that may appear comparable to unqualified readers, such as a client selecting the more environmentally friendly material for a project.
Following work should focus on evaluating the cost and effects of implementing ATIC carbon neutrality roadmap, especially the deployment of emerging technologies such as Carbon Capture, Use and Storage (CCUS), Limestone Calcined Clay (LC3) or other alternative binders, as the literature suggests that clinker substitution is a valid and effective measure to mitigate the carbon emissions [,,,,].
Supplementary Materials
The following supporting information can be downloaded at https://www.mdpi.com/article/10.3390/su172210346/s1. A document will be published alongside the main manuscript containing the data quality level assessment (according to UN Environmental Global Guidance on LCA), the inventory of alternative fuels and secondary raw materials consumed. It also includes the biogenic carbon content of all fuels, its heating values and carbon intensity, as well as information concerning the Portuguese electricity generation mix for 2022 [,,,,,,,,,].
Author Contributions
Conceptualization, F.C. and M.B.; Methodology, F.C.; Validation, M.B., P.F. and F.M.; Formal Analysis, F.C.; Investigation, F.C.; Resources, F.C.; Data Curation, F.C.; Writing—Original Draft Preparation, F.C.; Writing—Review and Editing, F.C., M.B., P.F. and F.M.; Supervision, P.F. and F.M.; Project Administration, P.F. All authors have read and agreed to the published version of the manuscript.
Funding
This work was funded by Portuguese National Funding through FCT—Fundação para a Ciência e Tecnologia, I. P., through projects LA/P/0083/2020 and UIDB/50009/2025.
Institutional Review Board Statement
Not applicable.
Informed Consent Statement
Not applicable.
Data Availability Statement
The datasets presented in this article are not readily available because this project contains confidential information. Requests to access the datasets should be directed to c5Lab, Sustainable Construction Materials.
Conflicts of Interest
The authors declare no conflicts of interest.
Acronyms
| AD | (Non-Clinker Main Constituents) Additives |
| ADP–Fossil | Impact Category, Abiotic Depletion—Fossil |
| ADP–Minerals and Metal | Impact Category, Abiotic Depletion Potential—Minerals and Metals |
| ALT. AD | Alternative Additives |
| ANFO | Explosive, Ammonium Nitrate diesel Fuel Oil |
| AP | Impact Indicator, Acidification Potential |
| ATIC | Technical Association for the Portuguese Cement Industry |
| BEES+ | LCIA Method, Building for Environmental and Economic Sustainability |
| CaO | Calcium Oxide; Lime; Quicklime |
| CCUS | Carbon Capture, Use and Storage |
| CEM | Cement |
| CF | Characterisation Factor |
| CO2 | Carbon Dioxide |
| CML-IA | LCIA Method, Center of Environmental Science |
| CON. CEM. | Consumables (Cement Phase) |
| CON. CLK. | Consumables (Clinker Phase) |
| CtCr | Clinker to Cement Ratio; Clinker Content |
| DAP | Declaração Ambiental de Produto in Portuguese (EPD in english) |
| DRW | Decarbonation of Raw Materials |
| EF | LCIA Method, Environmental Footprint 3.0 or 3.1 |
| EL | Electricity Generation |
| EP–Freshwater | Impact Indicator, Eutrophication–Freshwater |
| EP–Marine | Impact Indicator, Eutrophication–Marine |
| EP–Terrestrial | Impact Indicator, Eutrophication–Terrestrial |
| EU | European Union |
| EPD | Environmental Product Declaration |
| GHG | Greenhouse Gases |
| GWP–Biogenic | Impact Category, Climate Change Biogenic |
| GWP–Fossil | Impact Category, Climate Change Fossil |
| GWP–Luluc | Impact Category, Climate Change Land Use and Land Use Change |
| GWP–Total | Impact Category, Climate Change Total |
| IMPACT+ | LCIA Method, IMPACT World+ |
| IPCC | Intergovernmental Panel on Climate Change |
| LC3 | Limestone Calcined Clay |
| LCA | Life Cycle Assessment |
| LCI | Life Cycle Inventory |
| LCIA | Life Cycle Impact Assessment |
| NRW | Natural Raw Materials |
| ODP | Impact Category, Ozone Depletion |
| PCR | Product Category Rules |
| POCP | Impact Category, Photochemical Ozone Creation Potential |
| RDF | Residue Derived Fuel |
| RKC | Rotary Kiln Combustion |
| SiO2 | Silicon Dioxide |
| SRW | Secondary Raw Materials |
| TRACI | LCIA Method, Tool for Reduction and Assessment of Chemicals and Other Environmental Impacts |
| WC | Water Consumption |
| WDP | Impact Category, Water Depletion |
| WF | Waste Formation |
References
- European Commission. The European Green Deal; European Commission: Brussels, Belgium, 2019. [Google Scholar]
- Wei, Y.M.; Chen, K.; Kang, J.N.; Chen, W.; Wang, X.Y.; Zhang, X. Policy and Management of Carbon Peaking and Carbon Neutrality: A Literature Review. Engineering 2022, 14, 52–63. [Google Scholar] [CrossRef]
- Benhelal, E.; Zahedi, G.; Shamsaei, E.; Bahadori, A. Global Strategies and Potentials to Curb CO2 Emissions in Cement Industry. J. Clean. Prod. 2013, 51, 142–161. [Google Scholar] [CrossRef]
- Bosoaga, A.; Masek, O.; Oakey, J.E. CO2 Capture Technologies for Cement Industry. Energy Procedia 2009, 1, 133–140. [Google Scholar] [CrossRef]
- European Commission. Best Available Techniques (BAT) Reference Document for the Production of Cement, Lime and Magnesium Oxide; European Commission: Brussels, Belgium, 2013. [Google Scholar]
- European Comission. Green Deal. In Solar Power; University of California Press: Oakland, CA, USA, 2019; pp. 47–65. [Google Scholar] [CrossRef]
- Cavalett, O.; Watanabe, M.D.B.; Voldsund, M.; Roussanaly, S.; Cherubini, F. Paving the Way for Sustainable Decarbonization of the European Cement Industry. Nat. Sustain. 2024, 7, 568–580. [Google Scholar] [CrossRef]
- Stafford, F.N.; Dias, A.C.; Arroja, L.; Labrincha, J.A.; Hotza, D. Life Cycle Assessment of the Production of Portland Cement: A Southern Europe Case Study. J. Clean. Prod. 2016, 126, 159–165. [Google Scholar] [CrossRef]
- Stafford, F.N.; Raupp-Pereira, F.; Labrincha, J.A.; Hotza, D. Life Cycle Assessment of the Production of Cement: A Brazilian Case Study. J. Clean. Prod. 2016, 137, 1293–1299. [Google Scholar] [CrossRef]
- Ali, A.A.M.M.; Negm, A.M.; Bady, M.F.; Ibrahim, M.G.E.; Suzuki, M. Environmental Impact Assessment of the Egyptian Cement Industry Based on a Life-Cycle Assessment Approach: A Comparative Study Between Egyptian and Swiss Plants. Clean Technol. Environ. Policy 2016, 18, 1053–1068. [Google Scholar] [CrossRef]
- Valderrama, C.; Granados, R.; Cortina, J.L.; Gasol, C.M.; Guillem, M.; Josa, A. Implementation of Best Available Techniques in Cement Manufacturing: A Life-Cycle Assessment Study. J. Clean. Prod. 2012, 25, 60–67. [Google Scholar] [CrossRef]
- Song, D.; Yang, J.; Chen, B.; Hayat, T.; Alsaedi, A. Life-Cycle Environmental Impact Analysis of a Typical Cement Production Chain. Appl. Energy 2016, 164, 916–923. [Google Scholar] [CrossRef]
- García-Gusano, D.; Herrera, I.; Garraín, D.; Lechón, Y.; Cabal, H. Life Cycle Assessment of the Spanish Cement Industry: Implementation of Environmental-Friendly Solutions. Clean Technol. Environ. Policy 2015, 17, 59–73. [Google Scholar] [CrossRef]
- Chen, C.; Habert, G.; Bouzidi, Y.; Jullien, A. Environmental Impact of Cement Production: Detail of the Different Processes and Cement Plant Variability Evaluation. J. Clean. Prod. 2010, 18, 478–485. [Google Scholar] [CrossRef]
- Su, Q.; Latypov, R.; Chen, S.; Zhu, L.; Liu, L.; Guo, X.; Qian, C. Life Cycle Assessment and Environmental Load Management in the Cement Industry. Systems 2025, 13, 611. [Google Scholar] [CrossRef]
- Georgiades, M.; Shah, I.H.; Steubing, B.; Cheeseman, C.; Myers, R.J. Prospective Life Cycle Assessment of European Cement Production. Resour. Conserv. Recycl. 2023, 194, 106998. [Google Scholar] [CrossRef]
- Moretti, L.; Caro, S. Critical Analysis of the Life Cycle Assessment of the Italian Cement Industry. J. Clean. Prod. 2017, 152, 198–210. [Google Scholar] [CrossRef]
- Capucha, F.; Henriques, J.; Ferrão, P.; Iten, M.; Margarido, F. Analysing Industrial Symbiosis Implementation in European Cement Industry: An Applied Life Cycle Assessment Perspective. Int. J. Life Cycle Assess. 2023, 28, 516–535. [Google Scholar] [CrossRef]
- Rhaouti, Y.; Taha, Y.; Benzaazoua, M. A Comparative Life Cycle Assessment of Ordinary Portland Cement, Limestone Calcined Clay Cement and Mining Waste Marl Cement. In Proceedings of the 1st International Conference on Net-Zero Built Environment, Oslo, Norway, 19–21 June 2024; Kioumarsi, M., Shafei, B., Eds.; Springer Nature: Cham, Switzerland, 2025; pp. 551–562. [Google Scholar]
- Generowicz-Caba, N.; Kulczycka, J. LCA of Cement with Alternative Additives: Pathways to Sustainable Production. Materials 2025, 18, 3057. [Google Scholar] [CrossRef]
- Xiong, L.; Palomo, A.; Maltseva, O.; Fernandez-jimenez, A.; Wan, Z. Transforming Landfilled Coal Ash in Ultralow Clinker Binders. J. Am. Ceram. Soc. 2025, 108, e20661. [Google Scholar] [CrossRef]
- de Oliveira, A.R.; Bento, S.; Partidário, M.; Morrison-Saunders, A. Understanding Stakeholder Experiences with Visual Communication in Environmental Impact Assessment. Environ. Impact Assess. Rev. 2023, 102, 107210. [Google Scholar] [CrossRef]
- CEN/TC 350 NP EN 15804:2012+A2:2019; Sustainability of Construction Works-Environmental Product Declarations-Core Rules for the Product Category of Construction Products. Technical Committee: Brussels, Belgium, 2019.
- EN 197-1:2012; Cement—Part 1: Composition, Specifications, and Conformity Criteria for Common Cements. 2012th–04 ed. European Commitee for Standardization: Brussels, Belgium, 2011.
- EN 197-5:2021; Cement—Part 5: Portland-Composite Cement CEM II/C-M and Composite Cement CEM VI. European Commitee for Standardization: Brussels, Belgium, 2021.
- European Cement Association. Cembureau Cementing the European Green Deal, Reaching Climate Neutrality Along the Cement and Concrete Value Chain by 2050; European Cement Association: Brussels, Belgium, 2020; pp. 1–38. [Google Scholar]
- ATIC-Associação Técnica da Indústria do Cimento. Roteiro Para A Neutralidade Carbónica 2050; ATIC: Oeiras, Portugal, 2025; Volume 2050. [Google Scholar]
- Cement Sustainability Initiative (CSI). List of Constants and Default CO2 Emission Factors; Intergovernmental Panel on Climate Change (IPCC): Geneva, Switzerland, 2025. [Google Scholar]
- Cement Sustainability Initiative (CSI). Cement Sustainability Initiative (CSI) CO2 and Energy Accounting and Reporting Standard for the Cement Industry May 2011 the Cement CO2 and Energy Protocol; World Business Council for Sustainable Development (WBCSD): Genève, Switzerland, 2011. [Google Scholar]
- CEMBUREAU The European Cement Association. From Ambition to Deployment—The Road Travelled, Pathways and Levers to Scale up or Net Zero Ambition; CEMBUREAU: Brussels, Belgium, 2024. [Google Scholar]
- EPD®. General Programme Instructions for the International EPD® System; Version 4.0; EPD International: Stockholm, Sweden, 2021; p. 80. [Google Scholar]
- ISO 14040:2006; The International organization for standardization Environmental Management—Life Cycle Assessment—Principles and Framework. Environmental Management System: Geneva, Switzerland, 2004; p. 44.
- Blengini, G.A. Life Cycle Assessment Tools for Sustainable Development: Case Studies for the Mining and Construction Industries in Italy and Portugal; Instituto Superior Técnico: Lisbon, Portugal, 2006. [Google Scholar]
- ISO 14044; Environmental Management—Life Cycle Assessment-Requirements and Guidelines. The International organization for standardization: Geneva, Switzerland, 2006; p. 7.
- DAPHabitat Regras Para a Categoria de Produto (RCP)—Modelo Base—Produtos e Serviços de Construção. CentroHabitat—Plataforma Para A Construção Sustentável. Available online: https://www.daphabitat.pt/assets/Uploads/RCP/pdfs/62c6115e92/RCP-DAPHABITAT_V3-v4.1-Junho-2025-PT.pdf (accessed on 5 November 2025).
- DAPHabitat System General Instructions for the DAPHabitat System. 2015. Available online: https://www.daphabitat.pt/assets/Uploads/Instrucoes-Gerais-do-Programa/efdf6ca37a/IGP-DAPHABITAT_V3.1-Junho-2025-PT.pdf (accessed on 5 November 2025).
- Ecoinvent Database, v3.9.1. 2023. Available online: https://ecoinvent.org/ (accessed on 5 November 2025).
- BauMineral GmbH. Environmental Product Declaration as per ISO 14025 and EN 15804: EFA-Füller® MR3; BauMineral GmbH: Herten, Germany, 2017. [Google Scholar]
- SECIL Declaração Ambiental 2018—Outão. Available online: https://www.secil-group.com/content/dam/secilInstitucional/documentos/pt/documentos/declaracao-ambiental/Declaracao-Ambiental-Outao-2018.pdf (accessed on 3 November 2025).
- SECIL Declaração Ambiental 2018—Maceira. Available online: https://www.secil-group.com/content/dam/secilInstitucional/documentos/pt/documentos/declaracao-ambiental/Declaracao-Ambiental-Maceira-2018.pdf (accessed on 3 November 2025).
- SECIL Declaração Ambiental 2018—Pataias. Available online: https://www.secil-group.com/content/dam/secilInstitucional/documentos/pt/documentos/declaracao-ambiental/Declaracao-Ambiental-Cibra-2018.pdf (accessed on 3 November 2025).
- Cimpor Declaração Ambiental 2018—Alhandra. Available online: https://www.cimpor.com/documents/20124/158764/Novo_DeclaracaoAmbientalEMAS_CPAlhandra_2018.pdf/703e228a-7679-ccc3-509b-fe5f7c372cb0?t=1602155669328 (accessed on 3 November 2025).
- Cimpor Declaração Ambiental 2018—Souselas. Available online: https://www.cimpor.com/documents/20124/158764/Novo_DeclaracaoAmbientalEMAS_CPSouselas_2018.pdf/0023f51c-834d-d91b-dd0f-3d698f494cb3?t=1602155698284 (accessed on 3 November 2025).
- Cimpor Declaração Ambiental 2018—Loulé. Available online: https://www.cimpor.com/documents/20124/158764/Novo_DeclaracaoAmbientalEMAS_CPLoule_2018.pdf/6f9d5245-2efc-25b0-e923-dcf1e94da116?t=1602155647539 (accessed on 3 November 2025).
- SECIL Declaração Ambiental 2023—Outão. Available online: https://www.secil.pt/content/dam/secilComercial/documents/pt/outros-documentos/Declaração Ambiental EMAS Outao 2023.pdf (accessed on 3 November 2025).
- SECIL Declaração Ambiental 2023—Maceira. Available online: https://www.secil.pt/content/dam/secilComercial/documents/pt/outros-documentos/Declaração Ambiental EMAS Maceira 2023.pdf (accessed on 3 November 2025).
- SECIL Declaração Ambiental 2023—Pataias. Available online: https://www.secil.pt/content/dam/secilComercial/documents/pt/outros-documentos/Declaração Ambiental EMAS Pataias 2023.pdf (accessed on 3 November 2025).
- Cimpor Declaração Ambiental 2023—Loulé. Available online: https://www.cimpor.com/documents/20124/1130341/Declaração_Atualizada_Loulé_2023.pdf (accessed on 3 November 2025).
- Cimpor Declaração Ambiental 2023—Alhandra. Available online: https://www.cimpor.com/documents/20124/1130338/Declaração_Atualizada_Alhandra_2023.pdf/63b40724-9c4d-a6bb-988a-29020f57dad9?t=1726475575898 (accessed on 3 November 2025).
- Cook, M.A. The Science of Industrial Explosives; IRECO: Elmhurst, IL, USA, 1974; ISBN ASIN B0000EGDJT. [Google Scholar]
- REN Diagrama de Carga. 2018. Available online: https://datahub.ren.pt/pt/eletricidade/balanco-mensal/?date=2018-12-31 (accessed on 1 June 2025).
- European Comission Environmental Footprint v3.1. Available online: https://eplca.jrc.ec.europa.eu/LCDN/developerEF.html (accessed on 1 June 2025).
- EN 15804:2012+A1:2013; Sustainability of Construction Works—Environmental Product Declarations—Core Rules for the Product Category of Construction ProductsM. European Commitee for Standardization: Brussels, Belgium, 2013.
- UN Environment Programme. Eco-Efficient Cements: Potential, Economically Viable Solutions for a Low-CO2 Cement Based Industry; United Nations Environment Programme: Nairobi, Kenya, 2016; p. 64. [Google Scholar]
- Ramão, A.; Modolo, R.C.E.; Figueiredo, A.; Vicente, R. Exploring the Potential of Belitic Cement Produced from Industrial Waste: Systematic Mapping of the Literature. Sustainability 2025, 17, 2377. [Google Scholar] [CrossRef]
- CIMPOR CIMPOR—Portugal. Available online: https://www.cimpor.com/en/portugal (accessed on 28 February 2025).
- Ekinci, E.; Kantarcı, F.; Mara, M.M. Historiography, Current Practice and Future Perspectives: A Critical Review of Geopolymer Binders. Sustainability 2025, 17, 9204. [Google Scholar] [CrossRef]
- Myllyviita, T.; Leskinen, P.; Seppälä, J. Impact of Normalisation, Elicitation Technique and Background Information on Panel Weighting Results in Life Cycle Assessment. Int. J. Life Cycle Assess. 2014, 19, 377–386. [Google Scholar] [CrossRef]
- van Deventer, J.S.J.; White, C.E.; Myers, R.J. A Roadmap for Production of Cement and Concrete with Low-CO2 Emissions; Springer: Dordrecht, The Netherlands, 2021; Volume 12, ISBN 0123456789. [Google Scholar]
- Trusiewicz, E.; Capital, C.V. Investing in Low Carbon Technologies in the Cement Sector Perspectives from Cleantech Venture Capital. 2020. Available online: https://www.cemnet.com/Conference/Item/185884/cemtech-2020-decarbonising-the-cement-industry.html (accessed on 5 November 2025).
- Li, C.; Gong, X.Z.; Cui, S.P.; Wang, Z.H.; Zheng, Y.; Chi, B.C. CO2 Emissions Due to Cement Manufacture. Mater. Sci. Forum 2011, 685, 181–187. [Google Scholar] [CrossRef]
- Feiz, R.; Ammenberg, J.; Baas, L.; Eklund, M.; Helgstrand, A.; Marshall, R. Improving the CO2 Performance of Cement, Part I: Utilizing Life-Cycle Assessment and Key Performance Indicators to Assess Development within the Cement Industry. J. Clean. Prod. 2015, 98, 272–281. [Google Scholar] [CrossRef]
- International Energy Agency. Ine Global Warming Potential Kept Decreasing in 2019, Despite the Economic Growth in 2019; International Energy Agency: Paris, France, 2021; pp. 2–5. [Google Scholar]
- REN Dados Técnicos. 2022. Available online: https://www.ren.pt/media/onzbcegp/dados-tecnicos-2022.pdf (accessed on 1 June 2025).
- Chen, X.; Matthews, H.S.; Griffin, W.M. Uncertainty Caused by Life Cycle Impact Assessment Methods: Case Studies in Process-Based LCI Databases. Resour. Conserv. Recycl. 2021, 172, 105678. [Google Scholar] [CrossRef]
- Esnouf, A.; Latrille, É.; Steyer, J.P.; Helias, A. Representativeness of Environmental Impact Assessment Methods Regarding Life Cycle Inventories. Sci. Total Environ. 2018, 621, 1264–1271. [Google Scholar] [CrossRef]
- European Commission Enviromental Footprint 3.1. 2022. Available online: https://simapro.com/wp-content/uploads/2020/06/DatabaseManualMethods.pdf (accessed on 1 June 2025).
- Center of Environmental Science (CML) CML-IA Baseline 2016. Available online: https://simapro.com/wp-content/uploads/2020/06/DatabaseManualMethods.pdf (accessed on 1 June 2025).
- EN 15804 + A2; PRé Sustainability. (Adapted EF3.1). European Commission: Brussels, Belgium, 2022.
- EN 15804 + A2; PRé Sustainability. (EF3.0). European Commission: Brussels, Belgium, 2019.
- SEMC EPD. 2018. Available online: https://simapro.com/wp-content/uploads/2020/06/DatabaseManualMethods.pdf (accessed on 1 June 2025).
- IMPACT World+ IMPACT World+ Midpoint. Available online: https://simapro.com/wp-content/uploads/2020/06/DatabaseManualMethods.pdf (accessed on 1 June 2025).
- US-EPA TRACI 2.1. Available online: https://simapro.com/wp-content/uploads/2020/06/DatabaseManualMethods.pdf (accessed on 1 June 2025).
- NIST BEES+. Available online: https://simapro.com/wp-content/uploads/2020/06/DatabaseManualMethods.pdf (accessed on 1 June 2025).
- IPCC IPCC 2021 GWP100. Available online: https://simapro.com/wp-content/uploads/2020/06/DatabaseManualMethods.pdf (accessed on 1 June 2025).
- Johnson, E. Goodbye to Carbon Neutral: Getting Biomass Footprints Right. Environ. Impact Assess. Rev. 2009, 29, 165–168. [Google Scholar] [CrossRef]
- European Comission Guidance on Classification of Waste According to EWC-Stat Categories. Eurostat 2010, 2150/2002, 82. Available online: https://unece.org/fileadmin/DAM/stats/documents/ece/ces/ge.33/2012/mtg2/Supplement_Manual_on_Waste_Statistics.pdf (accessed on 5 November 2025).
- Bouabid, G.; Nahya, D.; Azzi, M. Determination of Heating Value of Industrial Waste for the Formulation of Alternative Fuels. MATEC Web Conf. 2013, 5, 04031. [Google Scholar] [CrossRef]
- Caracol, P.M.d.O. Avaliação Da Viabilidade Dos Combustíveis Derivados de Resíduos Caso de Estudo Da Indústria Cimenteira. Master’s Thesis, Instituto Superior técnico, Lisboa, Portugal, 2016. [Google Scholar]
- Psomopoulos, C.S. Residue Derived Fuels as an Alternative Fuel for the Hellenic Power Generation Sector and Their Potential for Emissions ReductionConstantinos S. Psomopoulos. AIMS Energy 2014, 2, 321–341. [Google Scholar] [CrossRef]
Disclaimer/Publisher’s Note: The statements, opinions and data contained in all publications are solely those of the individual author(s) and contributor(s) and not of MDPI and/or the editor(s). MDPI and/or the editor(s) disclaim responsibility for any injury to people or property resulting from any ideas, methods, instructions or products referred to in the content. |
© 2025 by the authors. Licensee MDPI, Basel, Switzerland. This article is an open access article distributed under the terms and conditions of the Creative Commons Attribution (CC BY) license (https://creativecommons.org/licenses/by/4.0/).