Abstract
The study examines the use of environmentally friendly materials, such as metakaolin and cement, in various proportions to stabilize expansive plastic soils and assess their effects on the soil–water characteristic curve (SWCC). Metakaolin, a supplementary cementitious material with a lower carbon footprint than ordinary cement, enhances soil behavior through pozzolanic reactions. The incorporation of metakaolin and cement reduced the fitting parameter “a,” linked to the air-entry value (AEV), indicating that treated soils desaturate at lower suction values due to improved aggregate formation and pore structure. With increasing stabilizer content, the SWCC shifted toward lower suction values, reflecting improved hydraulic performance and reduced moisture sensitivity. The fitting parameter “n,” representing desaturation capacity and pore size distribution, increased with stabilizer content, suggesting a more uniform and durable soil structure. Overall, using metakaolin and cement enhances expansive soils’ structural and hydraulic behavior while conserving cement and reducing CO2 emissions. Machine learning models, Random Forest (RF), Decision Tree (DT), and Artificial Neural Network (ANN), were developed to predict SWCC. The RF model achieved the best accuracy (R2 = 0.9063, adjusted R2 = 0.8631), demonstrating the reliability of ML in evaluating green soil stabilization methods.
1. Introduction
Expansive soils undergo considerable changes in volume when their moisture content varies. This change in volume results from the soil swelling when it becomes wet and shrinking when it dries. Buildings constructed on expansive soil are often subjected to severe movement caused by non-uniform changes in soil moisture, resulting in cracking and distortion-related damage. Moisture variations can be triggered by factors such as rainfall, evaporation, garden irrigation, leaking pipes, or the activity of tree roots. Different researchers have investigated the effect of metakaolin on problematic soils, such as expansive soils [1,2,3].
Large portions of our country are covered with expansive soils, including dark and light gray clay types. These clay soils, which are widespread in Ethiopia, have consistently posed challenges for road construction. The issue of expansive soils can be addressed by excavating and replacing them with non-expansive materials, applying chemical stabilization methods, or constructing foundations designed to withstand the upward pressure of expansive soils [4,5,6,7]. To address expansive soil problems, various alternative approaches can be implemented. One possible method is stabilization. Stabilization techniques can also be applied to enhance the engineering characteristics in less expensive and non-expansive soils. The efficiency of chemical stabilizers is affected by the soil’s physical and chemical characteristics. Soil plasticity, grain size distribution, and mineralogy are affected by the chemical stabilization of additives on expansive soils.
Researchers have investigated the swell–shrink behavior of expansive soils through index properties and laboratory experiments [8,9]. Researchers investigated soil properties, noting that even soils with similar Atterberg limits can differ in volume change and water retention. The majority of the infrastructure in Ethiopia is built on unsaturated ground due to compaction during construction and the presence of a deep-water table. Matrix suction can better explain the technical behaviors of densified and swelling soils, which are generally unsaturated [10,11]. To determine the connection between the concept or principle of unsaturated soils and the engineering problem related to problematic soils, which are found in an unsaturated condition, the use of the soil–water characteristic curve (SWCC) as a tool was proposed in this research to assess the impact of metakaolin as well as cement improvement, regarding expansive soils [5,12,13,14,15]. It is generally described as the relationship between the soil’s water content and its suction (Fredlund and Xing, 1994), and is fairly simple to measure and has become a crucial source of information for unsaturated soil analysis to obtain characteristics of unsaturated soil functions (USPF) [7]. The SWCC serves as the fundamental soil data needed to analyze seepage, shear strength, volume changes, airflow, and heat transfer in unsaturated soils [16,17,18,19,20]. The fluctuation of the groundwater affects the life span of the structure, and the identification of the graph is also utilized to identify the moisture-holding potential within the soil particles [21,22].
This study investigates the effect of metakaolin cement upon the SWCC performance of swelling soils and explores the behavior of water retention toward the drier portion of the curve. The Atterberg limit test and the mechanical characteristics of the soil were also investigated.
In recent years, data-driven modeling techniques such as artificial intelligence (AI) have developed into strong tools in soil and foundation engineering for predicting soil behavior, reducing experimental costs, and improving reliability [23]. Studies have shown that models like Random Forest (RF), Artificial Neural Networks (ANN), and Decision Tree (DT) can effectively capture nonlinear relationships in soil–water retention and unsaturated soil mechanics. Therefore, in this study, these machine learning (ML) algorithms were employed alongside laboratory testing to predict the soil retention curve parameters grounded in experimental data. The importance of this study is to check the metakaolin, which is also available locally in abundance, for expansive soil stabilization. In addition, we used a machine learning approach to predict the SWCC of the densified soil.
2. Materials and Methods
2.1. Description of the Study Area
Debre Tabor is a town and district situated in north-central Ethiopia. It lies within the South Gondar Zone of the Amhara Region, approximately 100 km southeast of Gondar and 50 km east of Lake Tana. This historic town is located at 11°51′ N latitude and 38°1′ E longitude, with an elevation of about 2706 m above sea level. The soil in Debre Tabor is primarily composed of fine residual soils, such as clays and silt-clays formed on basaltic bedrock. These soils are classified into two types. The first type is red clay soil, which is colored as a result of magnetic mineral reduction. The dark and dark brown soil, which dominates the area south and southwest of town, is the second type. Soil samples in the study area were taken at a depth of 1.5 m. The samples were excavated at different locations in Debre Tabor town, where it proved easier to plot the test pits’ locations in accordance with the city map. As shown in Figure 1, Test pit 1 was taken at Begimder (391,047.3 E, 1,312,091.6 N, 2597.7 Z), test pit Kebero Meda (39,113.0 E. 1,312,675.46 N, 2599.5 Z), and Ajbar (39,297.2 E, 1,310,510.49 N, 2654.7 Z).
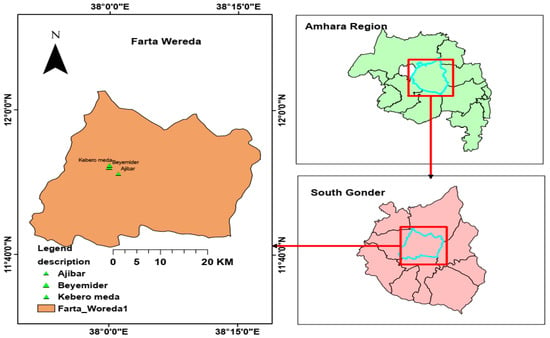
Figure 1.
Location map of the study area.
2.2. Materials
Expansive soil, metakaolin, and cement were the materials employed in the laboratory tests. Undisturbed and disturbed soil specimens were obtained from three distinct test pits in Debre Tabor, which were found in the southeastern part of Bahir Dar city, in the Amhara region, Ethiopia. The kaolin used in this research was taken from Debre Tabor and heated at a 6000 °C firing temperature, while the cement was purchased from the local market. To begin, three soil samples were characterized to select one with a high free swell index and a high plasticity index (PI) value. The three locations were specifically chosen based on a previous study that identified them as expansive soils with high expansiveness, ensuring the relevance of the samples for evaluating SWCC behavior.
2.2.1. Expansive Soils
The soil specimens were prepared in compliance with ASTM D 421–85 standards [24] before being treated and tested. This method involved exposing soil samples to air to dry them at room temperature and then breaking up the air-dried soil aggregates with a rubber-covered pestle in a mortar. The dried soils are then sieved to separate them into several laboratory tests, such as PH, Atterberg limits, free swell (FS), specific gravity, and modified compaction test. Grain size analysis was performed according to ASTM D 422–63 [25]: particles larger than 0.075 mm were analyzed using sieve analysis, while smaller particles were analyzed using hydrometer (sedimentation) analysis with the Stokes equation, ensuring accurate characterization of soils containing both coarse and fine-grained particles.
2.2.2. Metakaolin
Chemical Properties
The chemical composition of metakaolin was carried out by the Ethiopian Geological Survey. The results are presented in Table 1. The combined chemical properties satisfy the standard.

Table 1.
Oxide composition of metakaolin.
The combined content of silicon dioxide (SiO2), aluminum oxide (Al2O3), and iron oxide (Fe2O3) was 93.9%, which exceeded the 70% minimum requirement specified by ASTM C618-08 [26] for pozzolanic materials. Based on this criterion, the metakaolin used in this study was categorized as a Class N pozzolan. The H2O content of 0.78% and Loss on Ignition (LoI) value of 2.16% also met the ASTM standard limits, which specify a maximum of 3% and 10%, respectively. SiO2 was identified as the dominant oxide in the metakaolin, followed by Al2O3, K2O, Fe2O3, H2O, TiO2, P2O3, Na2O, and CaO.
Physical Materials
Metakaolin is a soft, lightweight, and often chalk-like sedimentary rock. It has an earthy odor and feel to the touch with a plate-like crystal morphology. The Atterberg limits, moisture–density relationship, and specific gravity of the metakaolin were evaluated through laboratory testing. The physical characteristics of the metakaolin clay are presented in Table 2. As the metakaolin content increases, both the liquid limit and plasticity index tend to decrease, whereas the plastic limit shows an increasing trend. Conversely, when cement is incorporated into the expansive soil, the liquid limit, plastic limit, and plasticity index all decrease with the rise in cement content.

Table 2.
Physical characteristics of metakaolin.
2.3. Methodology
2.3.1. Determination of the Soil–Water Characteristic Curve
Test Procedure
A pressure plate device was used to determine soil water retention and suction greater than 0.33 bar. The apparatus consisted of sturdy metal chambers that contained one or more ceramic plates on which even soil samples were placed. The cells were then exposed to a controlled positive air pressure, and the water was gradually removed. By carefully controlling the pressure, the various conditions of equilibrium pressure and tension or suction of water from the ground were achieved. The pressure plate device is shown in Figure 2.
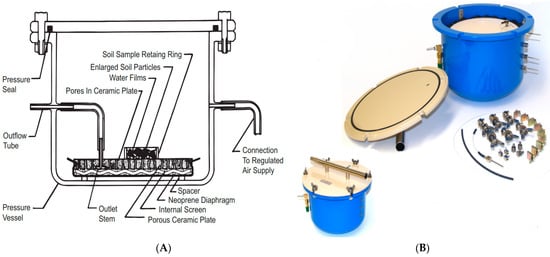
Figure 2.
(A) Cross-sectional view of ceramic pressure plate cell and soil sample in extractor, (B) bar pressure plate extractor.
The air pressure comes from a compressor, a compressed air cylinder, or a nitrogen cylinder; however, it should always go through a distributor with pressure regulators and manometers. This versatile device can be used for a wide variety of purposes: available water capacity, water retention capacity, hydraulic conductivity, and field capacity determinations. The results had a variety of practical applications: soil classification and survey, optimization of irrigation and drainage to improve crop yields, and calibration of soil water measuring devices for use in the field. For this study, a direct laboratory testing technique—the pressure plate method—was employed. The pressure plate apparatus consisted primarily of two components: a porous ceramic plate with an air-entry pressure greater than the maximum matric suction applied during testing, and a sealed pressure chamber used to maintain controlled suction conditions [27,28,29]. Each ceramic pressure plate unit consisted of a porous ceramic disk that was partially covered by a thin neoprene membrane. The space between the plate and the membrane acted as a channel that facilitated water movement during testing. An outlet stem passing through the ceramic plate linked this channel to an outflow tube fitting, which was connected to the external atmosphere outside the extractor [30,31]. To operate the ceramic pressure plate apparatus, one or more soil specimens were positioned on the porous ceramic surface and secured using retaining rings of suitable height.
Soil Samples on the Porous Ceramic Plate
The soil samples were saturated with water together with the porous ceramic plate. This process is typically achieved by allowing excess water to remain on the cell surface for several hours. Once both the porous ceramic plate and the soil specimens within the pressure plate cell were fully saturated, the cell assembly was placed inside the pressure chamber. Subsequently, air pressure was applied to extract moisture from the soil samples under controlled laboratory conditions. A regulated air pressure source, which was required for all the suction measurements, was achieved by using compressed air from a compressor. When the air pressure inside the chamber exceeded atmospheric pressure, the increased pressure forced the excess water to move through the microscopic pores of the ceramic plate and along the drainage path formed by the sieve and outlet stem [32]. However, the high-pressure air did not pass through the pores of the ceramic plate, as these pores were saturated with water. The surface tension at the air–water interface within each pore resisted the applied pressure, aided by a flexible rubber membrane that maintained the seal membrane [33,34]. The air pressure in the pressure plate extractor drove water out of each soil particle through the ceramic plate until the water films within the soil reached equilibrium with those in the plate pores. Moisture flow was reached and stopped. The samples were subsequently removed from the printing plate apparatus to measure their water content.
Requirements
To start, 15-bar limit pressure plate extractors were used and required the following accessories and equipment: an electronic scale with 1 kg load capacity with an accuracy of 0.001 g; a furnace that can hold a temperature of 105 °C; a pressure source, regulator, and manometer; retaining rings, using a height of 10 mm and a diameter of 50 mm; a moisturizing bottle with a lid; portable water, and a litter box. A small sample size (10 mm × 50 mm) was selected to ensure controlled and reproducible laboratory conditions. While soil heterogeneity can vary within short distances, multiple samples were tested to capture representative behavior. The results, therefore, reflected the local soil response under standardized conditions, and field variability was acknowledged as a limitation that should be addressed through complementary in situ investigations. The test procedure was determined as follows: an undisturbed soil sample (approximately 25 g) of 2 mm sieve size was obtained according to the test standard set out above. The samples were placed in the appropriate rings and sufficiently leveled with a spatula while evenly dispersing the existing soil (avoiding segregation according to the size of the particles). The soil samples with ceramic plates were left with an excess of water in the ceramic plate for at least 24 h. Once the samples were prepared for the extractor, a pipette or syringe was used to remove excess water from the cells. The ceramic plate with the sample rings was mounted on the extractor, and the outlet tube with O-rings. The lid was correctly assembled, and the clamps were screwed in to ensure that the extractor was tight and closed. The outlet tube was connected to the top of the beaker and used as an outlet attached to the extraction cell. The gas passing through the ceramic plate rose as fine bubbles through the outlet tube, carrying the extracted liquid to the receiving cup. We made sure that all required valves and accessories were correct. Minutes later, the water from the pressure plate cell started to flow into the beaker. We held the pressure until no more water came out. The pressure was set at a constant value of 0.33 bar.
The level in the cup stopped rising. The same pressure was then maintained for 24 h, and the water level in the burette was checked to ensure that it did not rise any further. This showed that equilibrium was reached. After the outlet tube was removed from the water, the pressure in the pressure plate cell was completely relieved. The extractor was opened safely, and soil samples were immediately taken and weighed. The soil samples were repeatedly placed in the cell to continue the experiment at the different suction values, using 2, 4, 8, 10, 12, and 14 bar pressures for each subsequent test. After each run, the samples were removed for oven drying. The samples and the moisture content were calculated at the various pressure levels. The pressure levels maintained in the equilibrium states were the suction values at the corresponding levels of water content. The relationship between suction and water content was determined for all samples taken from the study area. Then, the soil–water characteristic curve, in terms of the water content and its respective relationship to suction, can be developed.
Pressure Generation and Regulation
A regulated gas pressure source was necessary for all suction measurements. Compressed air from a compressor or nitrogen can be used with high-pressure disks. For the intensive use of the suction apparatus, compressed air supplied by a compressor was preferred. In our laboratory, the compressor was well-suited for the exhaust fan utilized in the system. The accurate regulation of the air supply was critical for precise balance readings, particularly when working in the low suction range, where excellent pressure control was essential. The regulated air was also used to connect the pressure plate extractor to the manifold.
Running for Moisture-Retention Studies
To be able to conduct moisture equilibrium investigations, the heights of the soil samples had to be so low that the time required to achieve equilibrium was considered acceptable. The time required to reach equilibrium varied proportionally to the square of the height of the sample. For example, a 20 mm high soil sample needed four times as long as a 10 mm high sample to reach equilibrium. The height of the soil samples should be limited to 10 mm if possible; here, they were 10 mm high and 50 mm in diameter, which was ideal for moisture retention studies using reconstituted soil specimens or intact soil samples according to ASTM standards. In this research study, an undisturbed soil sample was used.
2.4. Machine Learning Modeling
Machine learning models were employed to enhance the predictive accuracy of the SWCC by estimating volumetric water content based on laboratory test data. The experimental dataset consisted of 100 samples that incorporated soil textures and suction values. The input variables used were metakaolin (%), AEV (kPa), air entry fitting (kPa), pore size distribution, slope, and residual suction (kPa), while the SWCC in % represented the target output. Before training, all input features were standardized using the Standard Scaler method to ensure uniform scaling and model stability. To train the model, the dataset was randomly divided into 20% for testing and 80% for training. Table 3 presents the statistical summary of the dataset.

Table 3.
Statistical description of the dataset to predict SWCC.
Figure 3 illustrates the box plots of the key parameters influencing the SWCC, including metakaolin content, AEV, air entry fitting (af), pore size distribution (nf), slope of SWCC (mf), residual suction (Ψr), and SWCC (Volumetric Water Content). Each box plot depicts the median as a central line, the interquartile range (IQR) as the box, with the whiskers representing the non-outlier range and the red markers identifying outliers. The metakaolin (%) distribution is moderately spread, indicating variation among samples with a fairly symmetric range around the median. Both AEV and air entry fitting (af) show compact distributions with minimal variation, suggesting stable air entry pressures across mixes. The pore size distribution (nf) and slope (mf) exhibit relatively narrow IQRs and symmetrical distributions, implying uniformity in the pore structure and slope behavior of the SWCC. In contrast, residual suction (Ψr) displays a broader range with mild right-skewness, indicating variability in the suction behavior at the residual stage among the samples. Finally, SWCC (Volumetric Water Content) exhibits a slightly right-skewed distribution, where most data points cluster below the median, reflecting a predominance of lower water contents in the tested mixtures. Overall, the box plots reveal that while most parameters maintain consistent and symmetric distributions, residual suction and SWCC show higher variability, highlighting their sensitivity to changes in soil structure and metakaolin content.
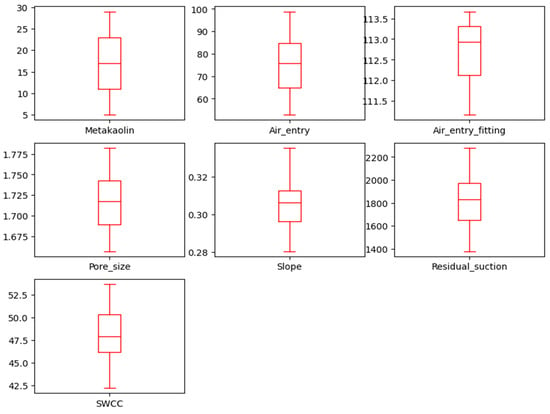
Figure 3.
Box plot of attributes used in the study.
Three ML models, RF, ANN, and DT, were trained and evaluated using identical data splits. Random forest is the most widely used supervised learning method for regression and classification [35]. It is a fast, noise-tolerant method that generates an efficient ensemble of taking relationships between the data [36,37,38]. A decision tree is an easy-to-understand machine learning model that repeatedly divides the data using feature thresholds, aiming to reduce prediction errors at each split [39]. The algorithm learns straightforward decision rules extracted from the data attributes to perform these predictions. It is a nonparametric and efficient model that simplifies complex relationships between input and output variables by recursively partitioning the dataset into meaningful subgroups [40]. The ANN method demonstrates tolerance to errors in the training data and leverages prior knowledge. It is well-suited for prediction tasks, as its hidden layers enable the model to contain nonlinear interactions [41]. For the ANN model, a feed-forward network contains three hidden layers containing 256, 128, and 64 neurons, respectively, each using the ReLU activation function. To prevent overfitting, a dropout rate of 0.2 was utilized for the first two layers, and the model was trained using the Adam optimizer with a learning rate of 0.001 and an MSE loss function. The ANN was trained for 500 epochs with a batch size of 16. Table 4 presents a summary of the model hyperparameter tuning configurations used.

Table 4.
Hyperparameter tuning used in ML algorithms.
To conduct this experiment, we used Python 3.11 with the TensorFlow and Keras frameworks in Jupyter Notebook 7.2.2. Model evaluation metrics included the coefficient of determination (R2), adjusted R2, mean squared error (MSE), mean absolute error (MAE), and root mean square error (RMSE). The training and validation loss were monitored for the ANN model to ensure convergence and avoid overfitting. The execution of each ML model was compared to determine the best predictive capability. Figure 4 shows the flow used to develop the model.
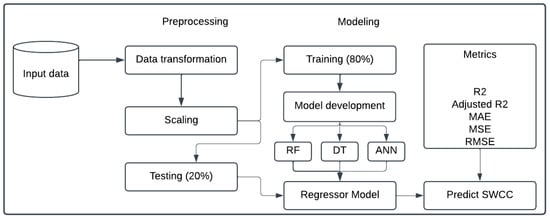
Figure 4.
Flow of the ML model used in the study.
The methodology for developing and evaluating a regressor model to predict the SWCC using machine learning techniques involved three main stages: preprocessing, modeling, and evaluation/prediction. In the preprocessing stage, input data stored in a tabular format as the .xls file underwent transformation to a CSV file and scaling to normalize or standardize features, ensuring equal contribution to model training. The preprocessed data was then split into training (80%), used for model fitting, and testing (20%), which was reserved for unbiased evaluation. In the modeling stage, the training data was used to develop and optimize three regression algorithms: RF, ANN, and DT. The best-performing model among these algorithms was selected as the final regressor model. The model demonstrating the highest predictive performance was then applied to predict SWCC, providing a robust tool for estimating soil water content based on measured soil properties.
3. Results and Discussion
3.1. Test Result (SWCC Determination)
The capacity of soil to hold moisture beneath various negative pore pressures was measured by the SWCC. Applying matric suction to each natural expansive soil sample in this study obtained the following indications: 33, 200, 400, 800, 1000, 1200 and 1400 kPa; expansive soil with metakaolin (5%, 8%, 11%, 14%, 17%, 20%, 23%, 26%, and 29%); expansive soil with cement (3%, 5%, 8%, and 10%); and expansive soil, metakaolin and cement (5% cement with 5%, 8%, 11%, 14%, and 17% metakaolin). Metakaolin was chosen based on its local availability in the selected areas and other Ethiopian regions and was environmentally sustainable in terms of the production of cement.
The models suggested by Fredlund and Xing were found to best fit the experimental data; this section discusses the curve-fitting constants (af, nf, mf). A distinction between soil suction and soil moisture content was defined by the SWCC. Gravimetric water content can be used to determine the amount of water present in the soil. According to Fredlund et al., the most often used phrase was moisture content by weight [42,43,44,45]. The ASTM D6836 standard served as the basis for the test’s execution [46]. The SWCC is represented in log scale format with the gravimetric water content plotted along the Y-axis and matric suction along the X-axis.
3.2. Modeling of Soil Water Characteristics Curve/SWCC Fitting Models
Researchers previously conducted models to fit an SWCC to data on soils [47]. In this study, the full investigation of the measured data utilized to develop SWCC was taken from Fredlund and Xing. This model fit provided a realistic description of hydric retention in both the wet and dry ends of the cure. The parameters af, nf, and mf values, required to best fit the soil–water retention data and determined using the Fredlund and Xing equation, were identified, along with the initial suction and residual suction values. An optimization procedure was applied to calibrate the parametric models to the observed data through an iterative method until the sum of the difference in root mean square error (RMSE) between the predicted and measured data became minimal. The total squared deviations provided a measure of how well the equations matched the experimental data. The RMSE minimization process was performed using MATLAB 2016a software. The most accurate fit of each model to the experimental data was defined as that with the smallest RMSE value.
3.3. Test Result for Untreated Soil
In this study, the SWCC for expansive soil was determined for an undisturbed soil sample, which was directly taken from the site. The measured data were best fitted by the Fredlund and Xing equation. Table 5 shows the laboratory test results for the gravimetric water content of expansive soil.

Table 5.
Soil moisture ratio (by mass) with corresponding suction of untreated soil.
As illustrated in Table 5, the released moisture content decreased as the suction value applied increased. The SWCC of untreated soil can be developed employing the gravimetric soil moisture and tension discussed. Figure 5 highlights the SWCC, and the model parameters are provided. The threshold suction, the remaining water content, and the SWCC slope are its three main constituents. The suction at which air first enters the largest soil pores and desaturation commences is called the air-entry value (AEV). The residual water content (RWC) is the soil water level at which further increases in pore pressure have a minimal impact on water content. The gradient of the line linking AEV and RWC corresponds to the slope of the soil–water characteristic curve. According to Chao and Nelson [48], the portion of the characteristic that appears prior to the AEV denotes the point at which water has filled all of the soil’s pores. This indicates the saturated volumetric water content: AEV = 110 kPa, Ψr = 2282.78 kPa, af = 128.55 kPa, nf = 1.76, mf = 0.31. The value of suction and metakaolin is shown in Table 6.
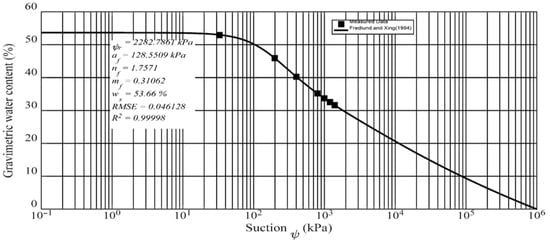
Figure 5.
Soil moisture (by weight) versus suction for untreated expansive soil.

Table 6.
Gravimetric water content with corresponding suction metakaolin.
Table 6 indicates that the expanded soil has higher flexibility than metakaolin, resulting in a lower gravimetric water content. Higher plasticity soil absorbs water more readily and requires more work to release it from the soil. The SWCC for the metakaolin material with the best-fitting parameters is shown in Figure 6.
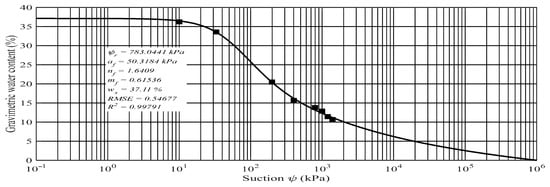
Figure 6.
Gravimetric water versus suction for metakaolin.
The AEV and residual state for each sample were determined by fitting the SWCC test results using the model developed by Fredlund and Xing based on gravimetric water. This can be seen in Figure 6. By continuing the uniform slope sections of the SWCC to meet the line on the curve segment related to the suction at complete water saturation, the AEV of the soil sample was determined [49]. According to Fredlund and Xing, the values of the fitting parameters were Ψr = 783.04 kPa, af = 50.32 kPa, nf = 1.64, mf = 0.62, and AEV 65 kPa. From this point on, the values diverged from the expanded soil’s established value, which were Ψr = 2282.78 kPa, af = 128.55 kPa, nf = 1.76, mf = 0.31, and AEV 110 kPa. The value of the residual water content for the expansive soil exceeded that of pure metakaolin. This indicated that the expansive soil did not release the internal water. And the value af indicated the amount of air entry value; this value indicated that the soil had less pore space, and to remove water, instead of water, air entered the soil. To achieve this phenomenon, maximum pneumatic pressure was needed to infiltrate the air, so the onset suction of the natural soil was greater than that of pure kaolin.
3.4. Test Result for Untreated Expansive Soil
For developed soil treated with metakaolin at concentrations of 5%, 8%, 11%, 14%, 17%, 20%, 23%, 26%, and 29%, the SWCC was calculated. For the metakaolin-treated soil specimen, the Fredlund–Xing (1994) model was designed for SWCC. The analysis was carried out using the MATLAB 2016a program. Based on the empirical equation formulated by Fredlund and Xing (1994), the relationship followed a sigmoidal pattern, allowing for the best fit of all the data from a suction of 0.1 kPa to 1,000,000 kPa. Parameters af, nf, and mf were derived from the best-fitting data, with the residual suction estimated as illustrated in Figure 7.
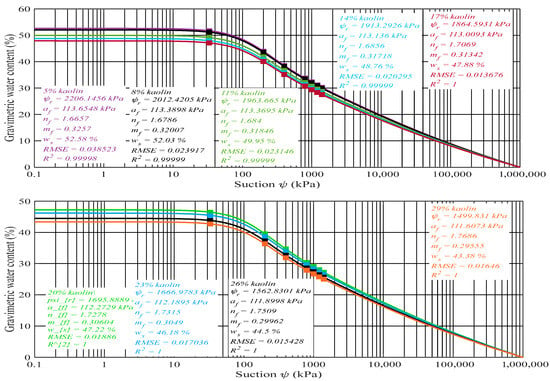
Figure 7.
Gravimetric water versus suction for metakaolin-treated expansive soil (5–29%).
The soil specimen in Figure 7 had a different percentage of metakaolin but similar characteristics. To assess the impact of metakaolin on the soil water properties of the expansive soil, metakaolin was selected. The expansive soil that was gathered from Debre Tabor Town was dried in an oven at 105 degrees Celsius. The samples for the SWCC test were then made using the different ratios of metakaolin mentioned in the section above, at the peak dry density and optimum water content. The gravimetric water content of the soil treated with varying percentages of metakaolin is displayed in Table 7.

Table 7.
Gravimetric water content with corresponding expansive soil treated with metakaolin suction.
The parameters af, nf, and mf for various metakaolin ratio-treated soil are summarized in Table 8. The SWCC’s constant slope portion was projected to meet the line on the portion of the curve representing suction at saturated water content to determine the air-entry value of the specimens [50].

Table 8.
SWCC parameters of metakaolin-treated expansive soil.
The low starting water content of the metakaolin-treated expansive soil is shown in Figure 8, with downward shifts in the SWCC as the metakaolin content rises, relative to the natural expansive soil. When 29% metakaolin was added to the expansive soil, the saturated water content dropped to 43.38%. The natural expansive soil absorbed more water during the saturation stage (52.95%). In this case, the results indicated that the natural soil had a smaller void ratio than the metakaolin-treated soil. The slope proceeded downward as the percentage of metakaolin increased. This study’s findings agreed with those of [51], who proposed utilizing lime to stabilize expanding soil. The curve moved downward, and the saturated water content decreased as the proportion of lime increased, as seen from the picture. The soil’s dry density and void ratio rose as the proportion of lime increased, which lowered the saturated water content and caused the curve to shift downward.
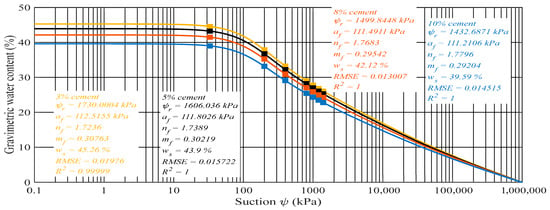
Figure 8.
Gravimetric water versus suction for cement-treated expansive soil (3–10%).
The AEV and residual state for each specimen were calculated by fitting the SWCC test results, which are presented in Table 8, to the Fredlund–Xing model based on volumetric water content. When compared to naturally expanding soil (128.55 kPa–11.1 kPa), the magnitude of the fitting parameter “a” decreased as the stabilizer percentage metakaolin increased. According to Fredlund and Xing, the fitting parameter “a” was directly related to the air entry value of the soil. In a similar way, as the value of “a” decreased, the AEV of the soil decreased as the metakaolin percentage increased (120 kPa–55 kPa). This was because the bonding in the chemical reaction between the metakaolin and the soil formed an aggregate, and the particle size increased in the soil structure.
Al2Si3O7 + Ca(OH)2 + H2O → C–S–H+C–A–H
As the size of the soil particle increased, the value of “a” and the air entry value of the soil decreased [52]. From their work, they took four different-sized soil particles and examined different fitting parameters of the SWCC. From their result, the soil that had a higher particle size gave the minimum value of the “a” fitting parameter value and AEV. In this study, the test result was similar to [53]. The researcher worked on the stabilization of expansive soil by using lime and cement. As the percentage of the stabilizer increased, the air entry value and the fitting parameter decreased when compared to the untreated soil. In this study, the AEV of the soil decreased as the percentage of metakaolin increased from 5% to 29%. This indicated that the flocculation and chemical bonding occurred on the open soil structure [54].
When compared to the untreated expansive soil, the fitting parameters of the “n” value increased as the proportion of metakaolin increased. The parameter “n” in the description provided by Fredlund and Xing denoted the soil’s desaturation rate and pore size distribution. According to the test results, the value of “n” increased (1.76–1.78) when the percentage of metakaolin increased. The rate of desaturation rose as the value of “n” increased. Compared to untreated soil, the pore size of the soil increased with metakaolin, which made it easier for the soil to evacuate water through suction.
The SWCC fitting parameter “m” also took into account the slope and residual water content of the SWCC. According to the value, the slope grew steeper the higher the “m” value, and it gradually increased the slower the value became. As the metakaolin percentage rose from 5% to 29%, the value of the residual suction value decreased (2282.78 kPa–1416.2 kPa). The desaturation of water required the least amount of suction energy possible because of the increase in soil particle size. The residual suction reduced as the proportion of chemical stabilizer increased.
3.5. Test Result for Cement-Treated Expansive Soil
This section discusses the expanding soil specimen that has been treated with cement. Cement was used to produce the specimen at 3%, 5%, 8%, and 10%. Using MATLAB 2016a version software, the soil suction–moisture content curve of the previously acquired soil sample was created, and the Fredlund–Xing fitting parameters were also shown and discussed.
The moisture loss portion of the SWCC of cement-treated soil samples is presented as the relation between the gravimetric water content and the suction. The gravimetric water content with respect to the suction value is presented in Table 9.

Table 9.
SWCC of cement-treated expansive soil.
As shown in Table 9, when the cement percentage increased, the water absorption of the soil specimen decreased; as the percentage of cement increased, the plasticity of the soil decreased, and a minimum water content was absorbed. From the curve, the fitting parameter from Fredlund and Xing was discussed.
As shown in Figure 8, the relationship between the suction value and the gravimetric water content was studied when cement was added at percentages of 3%, 5%, 8%, and 10%. As matric suction was applied, the SWCC plot gradually trended lower. Because the cement-treated soil samples had less water at the beginning than the untreated soil samples, the SWCC of the cement-treated soil samples shifted lower as the cement concentration increased. However, the natural soil sample absorbed more moisture during the saturation stage due to the cement’s loosening effect, an increase in particle size, and rapid water evaporation. Depending on the metakaolin concentration and soil conditions, the gravimetric water content versus suction tended toward a linear relationship when the applied suction is more than 100 kPa to 120 kPa. Based on the correlation demonstrated in the second bend, at suction values beyond 1000 kPa to 1100 kPa (which represents the approximate residual suction value when suction approached ), the sigmoidal shape of the relationship allowed for a best-fit of all the data from a suction of 0.1 kPa to by employing the empirical formula introduced by Fredlund and Xing.
The optimal fit of the dataset produces the following parameters. The fitting parameters and their values are listed in Table 10 below.

Table 10.
SWCC parameters of cement-treated expansive soil.
The plasticity qualities of the specimen’s SWCCs made with expanding soil at 3%, 5%, 8%, and 10% cement varied. Under a given suction value, the soil’s water retention capacity increased with the amount of clay present. According to [55], the silty soil particles’ high adsorptive and capillary forces were caused by their limited pore space and elevated average surface area. From here, as the percentage of cement increased, the water holding capacity of the water decreased from 53 to 39.
Table 10 illustrates how, as soil flexibility declines, the specimen’s ability to hold water falls and particle size increases due to aggregate formation and an increase in pore size in the soil structure caused by bonding from chemical reactions between clay particles. The expanded soil treated with cement resulted in a decrease in the “a” value. This outcome agrees with Kumara et al. (2010). According to their research, when the particle size rises, the specimen’s water content decreases, and its value of “a” decreases. According to Fredlund and Xing’s 2012 description, the parameter “a” and the AEV of the soil’s SWCC are tightly correlated. By extending the SWCC’s constant slope part to connect the line on the suction curve portion at the saturated moisture content, the AEV of the specimen was calculated [56]. According to the findings, the soil specimen’s AEV decreased as the cement proportion increased. The AEVs for the soils with varying cement ratios were found, and they ranged from 110 to 55 kPa, as shown in Table 10.
The parameter “n” can be used to relate the slope of the SWCC for the section between the AEV and the suction at the residual water content. The slope is steeper and the slope is low-to-moderate in value the higher the “n” value. The specimen’s pore size distribution is also shown by the value of “n”. According to the researcher’s report, the soil’s size increased, the stabilizer’s value increased, and the value of “n” increased [7].
The natural soil specimen had an “n” magnitude of 1.76, while the cement-treated soil samples had “n” values ranging from 1.72 to 1.77. The “n” value of the cement-stabilized soil specimen initially decreased at 3% cement content, and then started to rise as the percentage of cement increased. The SWCC of the cement-stabilized soil specimens exhibited a faster desaturation rate as the cement proportion rose, compared to the untreated natural soil specimen, indicating that water from the voids was more readily expelled in cement-stabilized soil with increasing suction, relative to the untreated soil specimen.
The remaining water content is correlated with the fitting parameter “m”. According to the test results shown in Table 10, the fitting parameter “m” was reducing the cement growth %. The “m” values for cement-treated soil samples varied from 0.31 to 0.29, whereas the “m” values for untreated natural soil samples were 0.31. As the cement content rose, the cement “m” values in a cement-treated soil sample dropped. The cement-treated soil samples had “ψr” values ranging from 1729.99 kPa to 1499.84 kPa, whereas the untreated natural soil sample had “ψr” values of 2282.78 kPa. As the percentage of cement increased (from 3% to 10% cement), the values decreased correspondingly.
3.6. Test Result for Metakaolin and Cement-Treated Expansive Soil
In this section, the soil treated using cement and metakaolin is discussed. The soil sample for this was compacted after the batching was taken. The soil was studied, but unlike the solely cement-treated and metakaolin-treated samples, here, the combination of the two materials was studied on the expansive soil. The batching of the stabilizers was optimized as 5% cement with 5% metakaolin, 8% metakaolin, 11% metakaolin, 14% metakaolin, and 17% metakaolin. The solid curve represents the best fit, and the dotted curve depicts the measured data in the laboratory in Figure 9b. Table 11 shows the corresponding suction and gravimetric water content from the two stabilizers and the expansive soil.
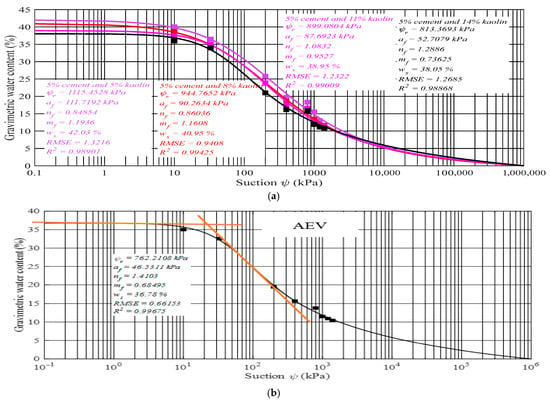
Figure 9.
(a) SWCC of expansive soil using 5% cement-5% metakaolin, 5% cement-8% metakaolin, 5% cement-11% metakaolin, 5% cement-14% metakaolin, and 5% cement-17% metakaolin, (b) SWCC parameters.

Table 11.
SWCC parameters of 5% cement with different % metakaolin-treated expansive soil.
Table 11 illustrates how adding cement and metakaolin to expansive soil lowered the gravimetric moisture content since the soil’s flexibility was decreased, as covered in the Atterberg limit section. A tiny amount of moisture content was absorbed by the soil samples when the soil’s pliability diminished, and the absorbed water escaped with very little suction. The outcome demonstrated that while the stabilizer increased the soil’s ability to absorb water, the stabilized soil’s capacity decreased. And the water absorbed by the soil was released with minimum suction. Similar to previous researchers’ results, this study gives a similar pattern of water absorption. The SWCC of the soil with the stabilizers is shown below with the best-fitted parameters. Figure 9 below shows the effect of adding cement and kaolin to the expansive soils, when the amount of cement is 5% and the percentage of kaolin is from 5% to 17% with 3% difference.
The measured data from Figure 9 were optimally matched using the Fredlund-Xing model. Adding cement and metakaolin to the expanding soil lowered the gravimetric water content. The SWCC plot gradually trended downward when matric suction was applied, as Figure 9 illustrates. The lower starting water content of the cement–metakaolin-treated soil was responsible for the downward shift in the soil sample’s SWCC as the metakaolin and cement content rose relative to the untreated natural soil samples. Due to their relatively loose nature, the untreated natural soil samples absorbed more water during the saturation stage. As the percentage of cement and metakaolin increased, the SWCC shifted downward with respect to the untreated natural soil sample. The gravimetric water content versus suction trended toward a straight-line relationship when suction was in excess of 120 kPa to 80 kPa applied, depending on the soil and metakaolin content.
From the relationship shown in the second bend at the suction value in excess of 700 kPa to 1500 kPa, which is an approximate value of residual suction as suction goes towards . The S-shaped form of the relationship allowed for an optimal fit of all the datasets from a suction of 0.1 kPa to through the empirical formula introduced by Fredlund and Xing. The optimal fit of the dataset provided the following parameters. The fitting parameters and their values are listed in Table 12.

Table 12.
Fitting parameters of 5% cement with different % metakaolin-treated expansive soil.
The value of “a,” or the air entrance value parameter, decreases with the addition of cement and metakaolin to expansive soil, as shown in Table 12. Additionally, the soil’s air infiltration threshold and this parameter have a linear relationship. The overall shape of the soil water characteristics curve remains unchanged regardless of the increment and decrement values of “a”. Nevertheless, the curve moves to the right, or to the greater suction range, when the value of “a” increases, and to the left, or to the lower suction value, as the value decreases.
According to the data above, the situation is as follows. The AEV has similar conditions because of its linear relationship with soil specimen. This indicates that when the stabilizer’s proportion increased, the AEV’s value decreased. Since the soil agglomerates and produces flocculation when the number of stabilizers increases, the size of the soil particles also increases. Because the soil particle has a high empty space, it can absorb a minimum amount of water and eject it with minimal suction.
The soil suction at which air begins to infiltrate the biggest voids in the soil is known as the air infiltration threshold. Therefore, if the soil has larger particle sizes, water can easily pass between them, and the AEV will be lower. According to the research, the soil specimen with a larger particle size had a lower AEV. Lower void ratio values were produced by larger void ratios, and lower AEV were produced by greater void ratios [57]. Particles with smaller sizes desaturated more quickly than those with larger sizes. The present investigation produced a result that is comparable.
As the amount of stabilizer increased, the “n” value of the expanded soil sample treated with metakaolin cement increased. This condition suggests that as the amount of stabilizers increased, the soil treated with metakaolin and cement became less saturated more quickly. As the percentage of stabilizers in the treated soils increased, the “m” value decreased. The residual water content and this metric are connected. Relative suction is the suction value that was utilized to remove the remaining water content. As the percentage of stabilizers increased, the residual suction value decreased. According to previous researchers’ findings, the residual suction decreases as the stabilizer (lime) percentage increases [18].
The value of “ψr” for the untreated soil was 2286 kPa, while the cement–kaolin-treated soil sample had a value that ranged from 1115 kPa to 762 kPa, with the ratio of 5% cement and 5% metakaolin to 17% metakaolin with 3% difference. The value dropped as the percentage of the cement and kaolin increased.
3.7. Machine Learning Results
The performance of the developed machine learning models, RF, ANN, and DT, for predicting the soil water characteristic curve (SWCC) parameters is summarized in Table 13.

Table 13.
Results of the study.
As shown in Table 13, the RF model attained the highest predictive performance among the three models, with an R2 of 0.9063 and an adjusted R2 of 0.8631, indicating a strong correlation between predicted and actual values. The Decision Tree (DT) model showed slightly lower accuracy, showing an R2 of 0.8919 and an adjusted R2 of 0.8421. The Artificial Neural Network (ANN) had the lowest R2 and adjusted R2 values among the models, at 0.8590 and 0.7940, respectively. Regarding error metrics, the RF model also performed best, achieving the lowest MAE of 0.8015 and RMSE of 0.9549. The DT model exhibited slightly higher errors, with an MAE of 0.8063 and RMSE of 1.0255, while the ANN showed the largest error values, having an MAE of 0.9588 and RMSE of 1.1712. Overall, the results indicate that while all three models can reasonably predict SWCC parameters, the Random Forest model provides the most accurate and reliable predictions for this dataset, followed by the Decision Tree, with the ANN showing comparatively lower precision.
Figure 10 presents scatter plots comparing SWCC measured versus predicted soil water content curves (SWCC), showing that both the (a) Random Forest and (b) Decision Tree models provide accurate predictions. Scatter plots were generated for each model, with measured SWCC values on the x-axis representing the input and the y-axis representing the predicted output. The dashed red line in each plot represents the ideal 1:1 relationship, where predicted values perfectly match measured values. The RF model demonstrates superior predictive accuracy, as indicated by the tight clustering of data points along the 1:1 line. This close alignment suggests minimal prediction error and a strong correlation between measured and predicted SWCC values, reflecting the model’s robustness across the entire range of observed values. In contrast, the DT model shows greater dispersion around the ideal line. Although the predictions still exhibit a positive linear trend, individual points deviate more significantly from the 1:1 line, particularly in the mid-to-upper range of SWCC values. This indicates a slightly lower precision and higher average error for the DT model relative to the RF model. Overall, the visual assessment of these scatter plots suggests that the RF model provides the most reliable predictions of SWCC, outperforming the DT model in both accuracy and robustness.
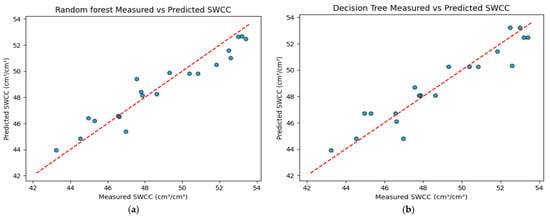
Figure 10.
Measured vs. predicted SWCC: (a) Random Forest and (b) Decision Tree.
Figure 11 presents two plots comparing the learning process of an Artificial Neural Network (ANN) model using Mean Squared Error (MSE) as the error metric, emphasizing the impact of early stopping.
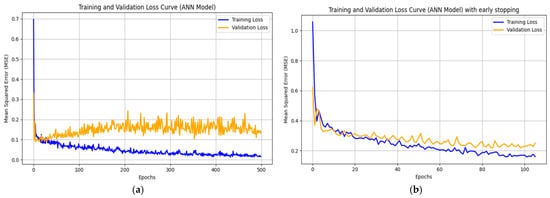
Figure 11.
Training vs. validation loss curve using ANN: (a) without early stopping and (b) with early stopping.
Figure 11a shows the training without early stopping. The training loss (blue line) decreases rapidly during the first 50 epochs and continues to drop steadily, reaching a very low value around 0.03, while the validation loss (orange line) initially decreases but then stabilizes around 0.15, fluctuating thereafter. The increasing difference between the training and validation losses indicates severe overfitting, as the model memorizes training data patterns but fails to generalize to unseen data. Figure 11b is the training with early stopping. When early stopping is applied, training automatically terminates around 100 epochs, once the validation loss stops improving. Both training and validation losses track each other more closely, with the final validation MSE around 0.2. Although the training loss is higher around 0.15 than in the unregularized model, early stopping prevents excessive overfitting and produces a model that generalizes better to new data. In summary, this comparison demonstrates that early stopping effectively controls overfitting by balancing training accuracy and generalization, yielding a more robust ANN model.
4. Conclusions
The addition of metakaolin, cement, and metakaolin–cement with the various ratios on the high plastic expansive soils resulted in a notable impact on the SWCC pertaining to metakaolin-treated, cement-treated, and metakaolin–cement-treated expansive soil. The result showed that SWCC can be used for the evaluation of a treatment method. The soil stabilization, by using metakaolin, cement, and metakaolin–cement, decreases the magnitude of the fitting parameter “a”, which can show the inflation point. This results from the formation of aggregates and an increase in pore size in the soil structure. The AEV of the treated soil decreases with the percentage of stabilizers. And the SWCC shifts to the left or low suction value. The fitting parameter “nf” is an indicator of the soil’s desaturation capacity and the increment or decrement of soil pore size distribution. From the results of the study, the “n” value was increased as the percentage of the stabilizers increased, and the soil desaturation increased in the same fashion with “nf”. The value of “mf” indicates the residual water content condition (ψr). As the percentage of stabilizers in the treated soils increased, the “mf” value decreased.
In this study, the unsaturated soil properties using SWCC were studied by using pressure plate analysis with a range of suction of 1400 kPa. The developed curve was the drying portion of the curve. From this curve, different soil fitting parameters are observed, and how they are changed by the addition of metakaolin, cement, and both metakaolin and cement to the expansive soil was observed. This study focused on the drying curve only to study the improvement of the highly plastic expansive soil and to study the unsaturated characteristics of the soil, so it is recommended to make a similar study using the wetting curve of SWCC. Soil properties depend on different factors available in the site, like compaction effort, density, initial moisture content, chemical composition of the stabilizers, and the soil. In this study, those factors were not considered; therefore, it is recommended to study those factors’ effect on the SWCC.
The addition of soil stabilizations, like cement–metakaolin, undergoes physical chemical reactions, so future work will consider this effect on the SWCC.
Author Contributions
Conceptualization, G.K., M.B.D. and S.M.K.; methodology, G.K., M.B.D., S.M.K. and B.Z.W.; software, M.B.D., S.M.K. and B.Z.W.; validation, G.K., M.B.D., S.M.K. and B.Z.W.; data curation, G.K., M.B.D. and S.M.K.; writing—original draft preparation, G.K., M.B.D., S.M.K. and B.Z.W.; writing—review and editing, G.K., M.B.D., S.M.K. and B.Z.W.; visualization, G.K., M.B.D., S.M.K. and B.Z.W.; supervision, G.K. All authors have read and agreed to the published version of the manuscript.
Funding
This research received no external funding.
Institutional Review Board Statement
Not applicable.
Informed Consent Statement
Not applicable.
Data Availability Statement
The data will be available upon request.
Conflicts of Interest
The authors declare no conflicts of interest.
References
- Zamanian, M.; Payan, M.; Salimi, M.; Qahremani, F.; Arabani, M.; Shalchian, M.M. Comparative Efficacy of Grouting and Mixing Methods for Stabilizing Collapsible Soils with Nano-Clay and Cement. Case Stud. Constr. Mater. 2025, 23, e05159. [Google Scholar] [CrossRef]
- Ahmadi Chenarboni, H.; Hamid Lajevardi, S.; MolaAbasi, H.; Zeighami, E. The Effect of Zeolite and Cement Stabilization on the Mechanical Behavior of Expansive Soils. Constr. Build. Mater. 2021, 272, 121630. [Google Scholar] [CrossRef]
- Zhai, Q.; Rahardjo, H.; Satyanaga, A.; Dai, G. Estimation of Unsaturated Shear Strength from Soil–Water Characteristic Curve. Acta Geotech. 2019, 14, 1977–1990. [Google Scholar] [CrossRef]
- Admassie, F.Z.; Mekonen, W.W. A Simplified Model to Estimate Soil Water Characteristic Curve from Basic Soil Properties for Expansive Soils. Discov. Appl. Sci. 2025, 7, 1050. [Google Scholar] [CrossRef]
- Zamin, B.; Nasir, H.; Sikandar, M.A.; Ahmad, W.; Khan, B.J.; Ahmad, M.; Bashir, M.T. Comparative Study on the Field-and Lab-Based Soil-Water Characteristic Curves for Expansive Soils. Adv. Civ. Eng. 2022, 2022, 6390442. [Google Scholar] [CrossRef]
- Abbaszadeh, M.M.; Houston, S.L.; Zapata, C.E. Influence of Soil Cracking on the Soil-Water Characteristic Curve of Clay Soil. Soils Rocks 2015, 38, 49–58. [Google Scholar] [CrossRef]
- Puppala, A.J.; Punthutaecha, K.; Vanapalli, S.K. Soil-Water Characteristic Curves of Stabilized Expansive Soils. J. Geotech. Geoenvironmental Eng. 2006, 132, 736–751. [Google Scholar] [CrossRef]
- Mahedi, M.; Cetin, B.; White, D.J. Performance Evaluation of Cement and Slag Stabilized Expansive Soils. Transp. Res. Rec. 2018, 2672, 164–173. [Google Scholar] [CrossRef]
- Phanikumar, B.R.; Ramanjaneya Raju, E. Compaction and Strength Characteristics of an Expansive Clay Stabilised with Lime Sludge and Cement. Soils Found. 2020, 60, 129–138. [Google Scholar] [CrossRef]
- Salami, Y.; Jaafri, R. Correlation between Shape Parameters of Particle Size Distribution and Soil Water Retention Curves. Int. J. Geo-Eng. 2025, 16, 21. [Google Scholar] [CrossRef]
- Gómez, A.V. A Theoretical Pore Network Model for the Soil—Water Characteristic Curve and Hysteresis in Unsaturated Soils. Civ. Eng. J. 2025, 11, 763–778. [Google Scholar] [CrossRef]
- Al-Khalili, A.M.; Ali, A.S.; Al-Taie, A.J. Effect of Metakaolin and Silica Fume on the Engineering Properties of Expansive Soil. J. Phys. Conf. Ser. 2021, 1895, 012017. [Google Scholar] [CrossRef]
- Zumrawi, M.M.E.; Mohammed, M.H. Effect of Fly Ash on the Characteristics of Expansive Soils in Sudan. Univ. Khartoum Eng. J. 2016, 6, 5–10. [Google Scholar]
- Janani, V.; Ravichandran, P.T. Effect of Calcined Clay on the Improvement of Compaction, Swell and Microstructural Characteristics of Expansive Soil. Heliyon 2023, 9, e19337. [Google Scholar] [CrossRef] [PubMed]
- Abd, N.T.; Abbas, J.M. Effect of Metakaolin on the Swelling and Shrinkage Behaviour of a Highly Expansive Soil. Diyala J. Eng. Sci. 2023, 8716, 60–67. [Google Scholar] [CrossRef]
- Bosco Niyomukiza, J.; Yasir, Y. Effects of Using Sawdust Ash as a Stabilizer for Expansive Soils. In Proceedings of the 8th International Conference on Energy, Environment, Epidemiology and Information System (ICENIS 2023), Semarang City, Indonesia, 8–9 August 2023; Volume 448. [Google Scholar] [CrossRef]
- Ehwailat, K.I.A.; Mohamad Ismail, M.A.; Ezreig, A.M.A. Novel Approach to the Treatment of Gypseous Soil-Induced Ettringite Using Blends of Non-Calcium-Based Stabilizer, Ground Granulated Blast-Furnace Slag, and Metakaolin. Materials 2021, 14, 10–12. [Google Scholar] [CrossRef]
- Al-Gharbawi, A.S.A.; Najemalden, A.M.; Fattah, M.Y. Expansive Soil Stabilization with Lime, Cement, and Silica Fume. Appl. Sci. 2023, 13, 436. [Google Scholar] [CrossRef]
- Tao, G.; Li, Z.; Liu, L.; Chen, Y.; Gu, K. Effects of Contact Angle on the Hysteresis Effect of Soil-Water Characteristic Curves during Dry-Wet Cycles. Adv. Civ. Eng. 2021, 2021, 6683859. [Google Scholar] [CrossRef]
- Alnmr, A.; Alzawi, M.O.; Ray, R.; Abdullah, S.; Ibraheem, J. Experimental Investigation of the Soil-Water Characteristic Curves (SWCC) of Expansive Soil: Effects of Sand Content, Initial Saturation, and Initial Dry Unit Weight. Water 2024, 16, 627. [Google Scholar] [CrossRef]
- Chen, J.; Mu, J.; Chen, A.; Long, Y.; Zhang, Y.; Zou, J. Experimental Study on the Properties of Basalt Fiber–Cement-Stabilized Expansive Soil. Sustainability 2024, 16, 7579. [Google Scholar] [CrossRef]
- Zhang, R.; Zheng, J.L.; Ng, C.W. Experimental Study on Stress-Dependent Soil Water Characteristic Curve of a Recompacted Expansive Soil. Appl. Mech. Mater. 2013, 256–259, 283–286. [Google Scholar] [CrossRef]
- Sharma, S.; Pratap, A.; Rathor, S.; Kumar, J. Prediction of Soil Water Characteristic Curve of Unsaturated Soil Using Machine Learning Prediction of Soil Water Characteristic Curve of Unsaturated Soil Using. Multiscale Multidiscip. Model. Exp. Des. 2024, 8, 72. [Google Scholar] [CrossRef]
- ASTM:D421-85; Standard Practice for Dry Preparation of Soil Samples for Particle-Size Analysis and Determination of Soil Constants. ASTM: West Conshohocken, PA, USA, 2007.
- ASTM D 422-63; Standard Test Method for Particle-Size Analysis of Soils 1. ASTM: West Conshohocken, PA, USA, 2002.
- ASTM C618-08; Standard Specification for Coal Fly Ash and Raw or Calcined Natural Pozzolan for Use in Concrete. ASTM: West Conshohocken, PA, USA, 2008.
- Macías-Párraga, M.; Echarri, F.J.T.; Alonso-Pandavenes, O.; Garzón-Roca, J. Improvement of Expansive Soils: A Review Focused on Applying Innovative and Sustainable Techniques in the Ecuadorian Coastal Soils. Appl. Sci. 2025, 15, 8184. [Google Scholar] [CrossRef]
- Zamin, B.; Nasir, H.; Mehmood, K.; Iqbal, Q. Field-Obtained Soil-Water Characteristic Curves of KPK Expansive Soil and Their Prediction Correlations. Adv. Civ. Eng. 2020, 2020, 4039134. [Google Scholar] [CrossRef]
- Shaker, A.A.; Dafalla, M. Introducing Cement-Enhanced Clay-Sand Columns under Footings Placed on Expansive Soils. Appl. Sci. 2024, 14, 8152. [Google Scholar] [CrossRef]
- Kennedy, C.; Wokoma, T.T.T.; Kabari, G.S. Effect of Composite Materials on Geotechnical Characteristics of Expansive Soil Stabilization Using Costus Afer and Cement. Artic. J. Sci. Eng. Res. 2018, 5, 603–613. [Google Scholar]
- Manzanal, D.; Orlandi, S.; Fernandez, M.; Laskowski, C.; Barría, J.C.; Codevila, M.; Piqué, T. Soil-Water Retention of Highly Expansive Clay Stabilized with a Bio-Polymer. In Proceedings of the PanAm-Unsat 2021: 3rd Pan-American Conference on Unsaturated Soils, Online, 25–28 July 2021; Volume 337, p. 01006. [Google Scholar] [CrossRef]
- Ma, L.; Guo, J.; Liang, D.; Ding, X.; Xue, Y. Model Modification of the Soil–Water Characteristic Curve of Unsaturated Weak Expansive Soil. Appl. Sci. 2024, 14, 7498. [Google Scholar] [CrossRef]
- Temilade, T.; Wokoma, T.; Kennedy, C.; Belema, A.W. Performance Characteristics of Cement, Lime—Pozzolanic Bagasse Fibre Ash Stabilized Expansive Lateritic Soils for Highway Pavement Materials. Int. J. Sci. Eng. Res. 2018, 9, 1092–1109. [Google Scholar]
- Li, S.; Zhang, B.; Chen, S.; Liu, Z.; Zheng, J.; Zhao, M.; Gao, L. Shallow Sliding Failure of Slope Induced by Rainfall in Highly Expansive Soils Based on Model Test. Water 2025, 17, 2144. [Google Scholar] [CrossRef]
- Wubineh, B.Z.; Metekiya, B.Y. A Knowledge-Based System to Predict Crime from Criminal Records in the Case of Hossana Police Commission. In Proceedings of the International Conference on Information and Communication Technology for Development for Africa (ICT4DA), Bahir Dar, Ethiopia, 26–28 October 2023; IEEE: New York, NY, USA, 2023; pp. 90–95. [Google Scholar]
- Kassa, S.M.; Wubineh, B.Z. Use of Machine Learning to Predict California Bearing Ratio of Soils. Adv. Civ. Eng. 2023, 2023, 8198648. [Google Scholar] [CrossRef]
- Kassa, S.M.; Wubineh, B.Z.; Geremew, A.M.; Azmatch, T.F.; Kumar, N.D. Prediction of Compaction Parameters Based on Atterberg Limit by Using a Machine Learning Approach. In Proceedings of the International Conference on Advances of Science and Technology, Bahir Dar, Ethiopia, 25–27 August 2023; pp. 133–146. [Google Scholar]
- Wubineh, B.Z.; Sewunet, S.D. Classifying Dairy Farmers’ Knowledge, Attitudes, and Practices towards Aflatoxin Using Bootstrap Oversampling and Machine Learning. In Proceedings of the 2024 International Conference on Information and Communication Technology for Development for Africa (ICT4DA), Bahir Dar, Ethiopia, 18–20 November 2024; pp. 43–48. [Google Scholar] [CrossRef]
- Kassa, S.M.; Wubineh, B.Z.; Geremew, A.M. Domain-Driven Teacher-Student Machine Learning Framework for Predicting Slope Stability Under Dry Conditions. Appl. Sci. 2025, 15, 10613. [Google Scholar] [CrossRef]
- Wubineh, B.Z. Crime Analysis and Prediction Using Machine-Learning Approach in the Case of Hossana Police Commission. Secur. J. 2024, 37, 1269–1284. [Google Scholar] [CrossRef]
- Wubineh, B.Z.; Asamenew, Y.A.; Kassa, S.M. Prediction of Road Traffic Accident Severity Using Machine Learning Techniques in the Case of Addis Ababa. In Proceedings of the International Conference on Robotics and Networks, Istanbul, Turkey, 15–116 December 2023; Springer Nature: Cham, Switzerland, 2023; pp. 129–144. [Google Scholar]
- Umar, I.H.; Abubakar, S.; Bello, A.B.; Lin, H.; Hassan, J.I.; Cao, R. Stabilization of Expansive Soils Using Cement–Zeolite Mixtures: Experimental Study and Lasso Modeling. Materials 2025, 18, 2286. [Google Scholar] [CrossRef]
- Khattab, S.A.A.; Al-Taie, L.K.I. Soil-Water Characteristic Curves (SWCC) for Lime Treated Expansive Soil from Mosul City. In Proceedings of the Fourth International Conference on Unsaturated Soils, Carefree, AZ, USA, 2–6 April 2006; Volume 40802, pp. 1671–1682. [Google Scholar] [CrossRef]
- Almuaythir, S.; Zaini, M.S.I.; Hasan, M. Shear Strength, Compressibility, and Consolidation Behaviour of Expansive Clay Soil Stabilized with Lime and Silica Fume. Sci. Rep. 2025, 15, 26185. [Google Scholar] [CrossRef]
- Jalal, F.E.; Mulk, S.; Memon, S.A.; Jamhiri, B.; Naseem, A. Strength, Hydraulic, and Microstructural Characteristics of Expansive Soils Incorporating Marble Dust and Rice Husk Ash. Adv. Civ. Eng. 2021, 2021, 9918757. [Google Scholar] [CrossRef]
- ASTM D6836; Standard Test Methods for Determination of the Soil Water Characteristic Curve for Desorption Using Hanging Column, Pressure Extractor, Chilled Mirror Hygrometer, or Centrifuge. ASTM: West Conshohocken, PA, USA, 2016.
- Wang, S.; Zhang, X.; Zhang, P.; Chen, Z. Strength Performance and Stabilization Mechanism of Fine Sandy Soils Stabilized with Cement and Metakaolin. Sustainability 2023, 15, 3431. [Google Scholar] [CrossRef]
- Chao, K.C.; Nelson, J.D.; Overton, D.D.; Cumbers, J.M. Soil Water Retention Curves for Remolded Expansive Soils. In Proceedings of the 1st European Conference on Unsaturated Soils 2008, Durham, UK, 2–4 July 2008; pp. 243–248. [Google Scholar] [CrossRef]
- Khodabandeh, M.A.; Kopecskó, K.; Nagy, G. The Effect of Expanded Perlite and Metakaolin on the Physicochemical Properties of Collapsible Soils. Hidrológiai Közlöny 2024, 104, 45–52. [Google Scholar] [CrossRef]
- Zhao, Y.; Zhang, H.; Wang, G.; Yang, Y. The Infiltration Characteristics of Expansive Soil Considering Fracture under Wet-Dry Cycle Conditions. Heliyon 2024, 10, e36840. [Google Scholar] [CrossRef]
- Fityus, S.; Buzzi, O. The Place of Expansive Clays in the Framework of Unsaturated Soil Mechanics. Appl. Clay Sci. 2009, 43, 150–155. [Google Scholar] [CrossRef]
- Awadalseed, W.; Zhao, H.; Sun, H.; Huang, M.; Liu, C. Expansive Soil Stabilization by Bagasse Ash in Partial Replacement of Cement. J. Renew. Mater. 2023, 11, 1911–1935. [Google Scholar] [CrossRef]
- Zhu, M.; Leo, C.; Zeng, Q.; Fanna, D.J.; Hsi, J.; Karimi, R.; Fabbri, A.; Liyanapathirana, S.; Hu, P.; Alzghool, H. Efficacy of Expansive Soil Stabilisation Using Un-Calcinated Kaolinite-Based Alkali-Activated Binders. Clean. Mater. 2025, 16, 100315. [Google Scholar] [CrossRef]
- Zhang, X.; Mavroulidou, M.; Gunn, M.J. A Study of the Water Retention Curve of Lime-Treated London Clay. Acta Geotech. 2017, 12, 23–45. [Google Scholar] [CrossRef]
- Premalatha, K.; Suriya, P. Soil Water Characteristic Curves of Expansive Clays of Chennai. In Proceedings of the 4th Asia Pacific Conference on Unsaturated Soils, Newcastle, Australia, 23 November 2009; pp. 257–262. [Google Scholar]
- Vanapalli, S.K.; Fredlund, D.G.G. Comparison of Different Procedures to Predict Unsaturated Soil Shear Strength. In Advances in Unsaturated Geotechnics; ASCE: Reston, VA, USA, 2000; pp. 195–209. [Google Scholar]
- Zhou, J.; Yu, J.L. Influences Affecting the Soil-Water Characteristic Curve. J. Zhejiang Univ. Sci. 2005, 6, 797–804. [Google Scholar] [CrossRef]
Disclaimer/Publisher’s Note: The statements, opinions and data contained in all publications are solely those of the individual author(s) and contributor(s) and not of MDPI and/or the editor(s). MDPI and/or the editor(s) disclaim responsibility for any injury to people or property resulting from any ideas, methods, instructions or products referred to in the content. |
© 2025 by the authors. Licensee MDPI, Basel, Switzerland. This article is an open access article distributed under the terms and conditions of the Creative Commons Attribution (CC BY) license (https://creativecommons.org/licenses/by/4.0/).