Abstract
Historic cities facing overtourism require evidence-based visitor dispersal to balance tourism growth with sustainable destination development. Focusing on Kyoto City, Japan, this study proposes an integrated analytical framework that combines objective tourism supply (POIs) and tourism demand (GPS trajectories) with visitor subjective perceptions from online tourist reviews to identify Alternative Attractions for Visitor Dispersal and evaluate their Composite Attractiveness. We (i) map supply–demand patterns to distinguish Hotspot Attractions versus Alternative Attractions (high-supply/low-demand); (ii) quantify Subjective Perceptions via an Aspect-Based Sentiment Analysis pipeline (ABSA) across landscape, experience, service, and transportation; and (iii) embed these sentiments into an improved Two-Step Floating Catchment Area (2SFCA) method that reframes accessibility from “reaching places” to “attaining high-quality experiences.” Kyoto exhibits a marked supply–demand mismatch, with Alternative Attractions concentrated around Fushimi, Sakyo (Nanzen-ji area), and outer Arashiyama. Negative perceptions (e.g., crowding) diminish the attractiveness of central Hotspot Attractions, whereas positive perceptions (e.g., pleasant atmosphere) enhance the attractiveness of peripheral Alternative Attractions, offsetting locational disadvantages. This framework offers not only data-driven support for Kyoto but also a replicable, experience-oriented model for sustainable tourism spatial management in other similarly challenged destinations.
1. Introduction
The discussion of sustainable tourism is increasingly dominated by overtourism, a critical issue for many historic and cultural cities globally [1]. Overtourism, the excessive growth in visitor numbers that harms residents’ quality of life [2], highlights a conflict between unchecked tourism growth and sustainable development. In Kyoto City, Japan, these pressures are concentrated in primary or hotspot attractions, where congestion reduces visitor satisfaction and strains the city’s social and environmental resilience [3]. If unmanaged, this can increase community tension, cause irreversible damage to fragile cultural heritage, and undermine long-term sustainability [4].
Visitor Dispersal is a widely recognized strategy to ease congestion and redistribute tourism’s benefits [5,6]. The core idea is to guide tourists away from overcrowded hotspot attractions to quieter, outlying areas, creating a more balanced distribution of tourism pressure. However, this policy’s success depends on identifying suitable dispersal zones or alternative attractions. This requires a scientific evaluation of attractions based on their appeal, infrastructure capacity, and ability to accommodate additional visitors without creating new challenges.
Traditionally, identifying such alternative attractions has relied on evaluating “tourism potential”, which is a concept defined by a region’s capacity to develop new tourism products from its existing resources [7]. Whether through traditional resource inventories [8] or modern Point of Interest (POI) data analysis [9], these existing supply-side evaluations measure what can be termed “tourism development potential.” While valuable for initial destination development, this approach is insufficient for managing overtourism. The focus must shift from developing new resources to better managing existing ones. A successful dispersal strategy aims not to open new areas, but to find existing, underutilized attractions with a strong tourism supply. These locations can absorb visitors’ overflow from hotspot attractions, thus alleviating pressure. Therefore, this study argues for a shift in evaluation from “tourism development potential” to “spatial dispersal potential.” This new concept necessitates integrating demand-side data on visitor behavior with supply-side metrics to meet current management needs.
Identifying alternative attractions with this ‘spatial dispersal potential’ requires a data-driven integration of tourism supply and tourism demand. On the demand side, technological contributions like GPS tracking and social media check-ins offer detailed insights into tourist mobility, enabling researchers to identify tourism hotspots [10]. By overlaying supply-side inventories with these demand patterns, it becomes possible to classify tourism spaces systematically. This reveals not only the hotspot attractions (high supply, high demand) where overtourism is acute but also the alternative attractions for visitor dispersal.
Furthermore, in an era of smart tourism development, a destination’s attractiveness is no longer determined solely by its objective, physical resources. Online tourist reviews offer new insights into the subjective side of tourism attractiveness [11]. Research confirms that this content—including sentiments, narratives, and visuals—is a critical factor in travel decision-making [12]. This gives Destination Management Organizations (DMOs) a major opportunity for sustainable marketing. By using insights from visitor perceptions, DMOs can create targeted strategies that highlight the unique, high-quality experiences available at alternative attractions, thereby encouraging a more balanced and responsible form of tourism [13].
Therefore, this study argues that a comprehensive evaluation framework for alternative attractions must integrate an objective analysis of tourism supply with a subjective analysis of visitor perceptions. Using Kyoto City as a case study, this research constructs an integrated analytical framework to address two core questions:
- RQ1: How can the spatial patterns of tourism supply and demand be matched to differentiate Hotspot Attractions from Alternative Attractions for Visitor Dispersal?
- RQ2: How can the subjective perceptions from online tourist reviews be incorporated to more accurately assess a destination’s composite attractiveness?
This research offers a twofold contribution to the discourse on sustainable tourism. Conceptually, it introduces and validates “spatial dispersal potential,” shifting the focus from growth-oriented “tourism development potential” to a management framework for overtourism. Methodologically, it improved the 2SFCA method by integrating subjective experiences—quantified via Aspect-Based Sentiment Analysis (ABSA). This reframes the evaluation of attractiveness, moving from the “accessibility of physical space” to the “attainability of high-quality experiences.” The result is a replicable, data-driven model that empowers DMOs and policymakers with a more nuanced tool for sustainable tourism spatial management, promoting resilience and long-term destination well-being.
The structure of this paper is as follows: Section 2 reviews the literature and presents the integrated analytical framework. Section 3 introduces the study area, data sources, and research methodology. Section 4 presents the results. Section 5 discusses the findings, and Section 6 concludes with a summary of the conclusions and policy recommendations.
2. Literature Review and Research Framework
2.1. Identification of Alternative Attractions for Visitor Dispersal Based on Tourism Supply and Demand
Traditional tourism planning and destination evaluation have long centered on the supply side, with an emphasis on measuring a region’s “Tourism Potential.” Early studies relied on field surveys and expert experience to conduct qualitative or quantitative valuations of a region’s natural and cultural tourism resources [14,15]. For instance, Filip Vujović et al. identified forests, water bodies, terrain, and land cover as core natural resources for potential assessment [8], while Dragan Pamucar et al. used questionnaires and interviews to evaluate the tourism potential of different rural settlements [16]. More recently, the emergence of geospatial big data, such as Points of Interest (POIs), has offered new ways to quantify tourism supply [17]. For example, Luo et al. used the density and proportion of different POI types, combined with clustering algorithms like K-Means, to classify urban areas into commercial, residential, and tourist zones [18]. Based on leisure and tourism POI data from Xi’an, Qu et al. revealed that the city’s tourism facilities are highly concentrated in the urban core and sparsely distributed in peripheral areas, with the core’s spillover effect being limited [19].
Regardless of the method, the common focus is on the quantity of developable tourism resources, measuring a destination’s “tourism development potential.” While this perspective is effective in the early stages of tourism development, its limits become clear when dealing with overtourism, a major obstacle to sustainable development. It fails to measure the potential for visitor dispersal; an area with abundant resources that is also crowded with tourists is a source for dispersal, not a receiving destination. Therefore, a supply-side-only analysis cannot provide a direct basis for effective policies aimed at visitor dispersal and responsible management.
Conversely, demand-side research utilizes trajectory information from User-Generated Content (UGC) to capture the actual spatio-temporal behaviors of tourists, aiming to identify “tourist hotspots” [20]. By analyzing geotagged data from social media platforms (such as Qyer and Weibo), researchers can not only identify areas where tourists congregate but also uncover the diverse preferences of different tourist groups and reveal significant differences in activity space choices between tourists and local residents [21,22]. Yao et al. analyzed GPS trajectory data to understand tourists’ movement, gathering patterns, and areas of interest within attractions, thereby revealing their specific visitation behaviors [23]. However, such methods tend to focus on currently popular attractions, making it difficult to discover high-quality but less-visited alternative attractions for visitor dispersal, which are key to successful destination management strategies that mitigate crowding.
In summary, neither a supply-side nor a demand-side analysis alone can fully support visitor dispersal decisions. This study, therefore, proposes a new concept for overtourism management: “Spatial Dispersal Potential.” This potential is determined by the match between a region’s tourism supply and its current tourism demand. Attractions with strong dispersal potential are characterized by “high supply-low demand,” meaning they possess the resource base to handle visitors but are not yet under significant tourist pressure. Consequently, by systematically quantifying and comparing the spatial distributions of supply and demand, it is possible to identify areas suitable for tourism demarketing in congested hotspots and sustainable destination branding in underutilized alternatives.
2.2. Evaluation of Destination Composite Attractiveness Integrating Subjective Perceptions
A tourist destination’s spatial structure is a complex network of supply points (attractions, facilities) and demand points (tourist locations) [24,25]. The relationships between these points heavily influence tourists’ decisions and movements. Early accessibility assessments often employed gravity models, which quantify accessibility based on the number of opportunities (supply) and travel impedance (such as distance or time). However, these models have limited capacity to explain supply-demand interactions, particularly service competition [26,27]. The evaluation of accessibility requires a comprehensive model that can simultaneously account for supply capacity, demand scale, and the spatial impedance between them.
The Two-Step Floating Catchment Area (2SFCA) method, known for its ability to balance supply and demand relationships [28], has been widely used in assessing the accessibility of public service facilities, such as healthcare and parks [29,30]. Its advantage is that it considers both the capacity of supply points and the competition from demand points by calculating a supply-to-demand ratio. This makes it better at explaining real-world situations than traditional gravity models. This method has also been introduced into tourism and cultural heritage tourism research. For example, Zhao et al. used it to evaluate the accessibility of different types of cultural facilities, including historical sites [31]. However, in its application to tourism research, discrepancies remain in defining supply and demand indicators. Some studies use official “attraction ratings” to measure supply and “resident population” to measure demand [32]. This approach overlooks the unique context of overtourism, where highly rated attractions are often associated with negative experiences like crowding and queuing. Therefore, a high rating does not always mean a high-quality experience. Furthermore, the main source of tourism demand is mobile tourists, whose spatiotemporal distribution patterns are distinctly different from those of local residents. Consequently, the current model often measures the convenience of local residents to access attractions rather than the ease with which tourists can obtain a high-quality experience. This can create a gap between the model’s results and what tourists actually feel.
To address this problem, it is necessary to integrate methods for quantifying subjective perceptions. As a typical form of UGC, online tourist reviews are a key source for understanding real experiences and sentimental preferences, which are central to creating meaningful tourist experiences [33]. However, traditional sentiment analysis is often too coarse-grained to capture the multidimensional emotions within complex tourist experiences [34]. To solve this, Aspect-Based Sentiment Analysis (ABSA) technology was developed [35]. It can identify specific aspects in reviews (e.g., “landscape,” “service”) and determine their sentiment polarity, enabling a more granular analysis. Advancements in deep learning have led to models like the Aspect-Term Extraction and Polarity Classification (ATEPC) model, which can now identify aspects and classify sentiment at the same time, improving accuracy [36]. In measuring supply, some studies have begun to integrate objective scale with subjective perception data. For instance, Mao et al. combined the physical area of parks with user ratings from multiple online platforms, incorporating the public’s perception into the quantification of supply capacity [37].
Therefore, this study argues that the key to enhancing the model’s effectiveness lies in constructing supply and demand indicators that better fit the tourism context. Specifically, the research should explore redefining supply using the density and richness of tourism-related POIs, and demand should be defined using authentic tourist spatiotemporal distribution data. More importantly, tourists’ subjective perceptions should be integrated as a core variable in the quantification of supply capacity, thereby ensuring that the accessibility evaluation truly aligns with tourists’ actual perceptions.
In conclusion, while existing research has laid a foundation for understanding tourism spatial structures, it has three main shortcomings: (1) The quantification of tourism supply needs to be improved; (2) Subjective perceptions are not well integrated into spatial analysis; and (3) Supply and demand indicators in tourism accessibility models are not well-suited to the tourism context. Addressing these gaps is crucial for formulating effective overtourism management strategies.
3. Materials and Methods
3.1. Research Framework and Technical Route
To address the research gaps identified in the literature review, this study constructs an integrated analytical framework that combines multi-source data and sentiment analysis. Figure 1 illustrates the technical roadmap: First, “ Hotspot Attractions” and “Alternative Attractions” are identified by matching supply-side POI data with demand-side GPS data. Second, online tourist reviews are introduced, and an improved 2SFCA method is used to evaluate the composite attractiveness of both types of attractions. Finally, the results are used to provide practical policy recommendations for sustainable destination management. The next chapter will detail the data sources, processing methods, and the specific steps for constructing the multi-stage analytical model. Subsequent sections will elaborate on the data sources (Section 3.2) and methodological steps (Section 3.3 and Section 3.4).
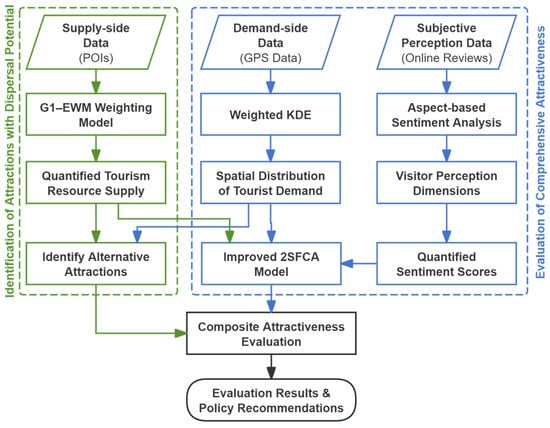
Figure 1.
Research framework and technical route.
3.2. Study Area and Data Collection
This study selects Kyoto City, Japan, as the case study area (Figure 2). Kyoto is one of the world’s most renowned tourist cities, and its overtourism issue was already prominent before the COVID-19 pandemic. It welcomed over 50 million visitors annually for seven consecutive years from 2013 to 2019 [38], and has continued to escalate during the post-pandemic recovery period [39]. However, the distribution of tourist flows is uneven, exhibiting significant spatial clustering. In 2019, the top nine prefectures hosted 79% of international tourist overnight stays [40]. Within Kyoto City, a few core attractions such as Gion and Kiyomizu-dera Temple are oversaturated with tourists, while the tourism potential of the vast hinterland remains largely untapped. This typical imbalance in tourist distribution provides an ideal empirical setting for the framework developed in this study to identify and evaluate alternative attractions for visitor dispersal.
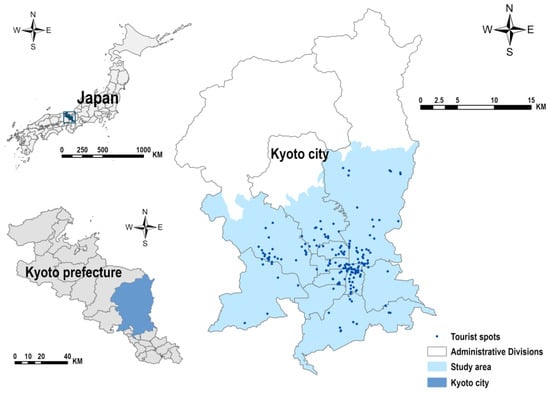
Figure 2.
Map of the study area and distribution of tourist attractions.
To support this analysis, our methodology leverages multi-source geospatial and user-generated data, aligning with the principles of smart tourism development for evidence-based destination management:
- Point of Interest (POI) Data: This dataset, representing the supply of tourism infrastructure, was sourced from OpenStreetMap (OSM) (downloaded via Geofabrik [41]). We chose OSM as it provides a comprehensive spatial inventory essential for quantifying objective supply. However, the original OSM tagging system is often broad and non-standardized, which can cause ambiguity in identifying tourism-related categories. To ensure consistency and relevance, we conducted systematic data cleaning, integration, and reclassification. Specifically, duplicate and irrelevant records (e.g., industrial, medical, or administrative facilities) were removed; synonymous categories were merged to ensure consistency (e.g., guesthouse and hostel under accommodation); and tourism-related POIs were extracted using keyword matching and semantic filtering of tags. This process allowed us to systematically map the raw data into 10,636 POIs closely related to tourism activities. These were then categorized into the six major types used in our analysis (Table 1): tourism, catering, accommodation, transportation, shopping, and leisure.
 Table 1. Classification and quantity of tourism-related POIs in Kyoto City.
 - Visitor GPS Data: This dataset represents the Tourism Demand, reflecting the actual spatial behavior patterns of visitors. The data were sourced from the “Arukumachi” application, an app primarily targeted at visitors traveling in Kyoto City [42]. Consequently, the scope of this dataset is geographically limited to Kyoto City. Data collection was activated only when users opened and actively used the app during their travels. The dataset covers the period from October 2018 to February 2019. This timeframe captures typical tourist spatial behaviors, as it predates any travel restrictions associated with the COVID-19 pandemic and is therefore unaffected by its influence. To ensure data quality and relevance, we applied rigorous pre-processing steps: (i) Data Deduplication: Redundant points for each user were removed using a 1 min time window, retaining only one record per minute. (ii) Length of Stay Filtering: Considering that over 80% of users had a stay not exceeding four days, we filtered for valid data within this timeframe to ensure homogeneity. (iii) Activity Filtering: Users with fewer than 5 total positioning points were excluded to ensure minimum activity levels. A final dataset of 258,178 valid GPS trajectory records from 8122 visitors was obtained, each including a user ID, a timestamp, and latitude-longitude coordinates.
- Online Review Data: To quantify the subjective visitor experience, this study collected 85,780 online visitor reviews for the top 200 attractions in Kyoto from TripAdvisor [43]. The data collection spans from 2012 to early 2025. This extended timeframe was intentionally chosen to ensure a sufficient review sample size for all attractions, which is essential for the statistical reliability of the sentiment analysis. The goal is to capture the stable, aggregate subjective perception of an attraction rather than short-term temporal fluctuations. The dataset includes usernames, review texts, and timestamps, providing rich insights into visitor perceptions and sentiments.
3.3. Identification of Alternative Attractions Based on Supply-Demand Matching
The primary objective of this stage is to identify hotspots and alternative attractions by quantifying the spatial patterns of tourism supply and visitor demand, thereby constructing a classification system for attractions based on their supply-demand characteristics.
3.3.1. Method for Quantifying Tourism Resource Supply
To accurately assess the relative importance of different resource types, this study developed a hybrid G1-EWM weighting model for the six POI categories. This model integrates expert knowledge from the G1 method (Order Relation Analysis) with objective data characteristics from the Entropy Weight Method (EWM) to achieve a more holistic and robust evaluation of tourism supply.
The G1 method determines subjective weights through expert ranking [44]. We assembled a review panel of 10 researchers specializing in tourism and transportation to conduct this ranking. This panel included 5 university faculty (with over 6 years of experience in destination supply evaluation and travel behavior) and 5 doctoral/master’s students (with over 3 years of experience in smart tourism and transportation planning).
The specific implementation process (Figure 3) was as follows: (i) First, each expert was provided with the definitions of the six POI categories (Table 1) and the evaluation objectives. (ii) Second, based on their professional experience, they were asked to subjectively rank the importance of these six categories. (iii) Third, experts were required to conduct an importance comparison judgment between adjacent categories in their ranked list (e.g., ‘slightly more important,’ ‘significantly more important,’ or ‘extremely more important’). (iv) Finally, these qualitative judgments were converted into quantitative ratios by the G1 method to calculate the final subjective weights. This process avoids the complex pairwise comparison matrices of traditional methods like AHP, making the expert judgments more intuitive and reliable.
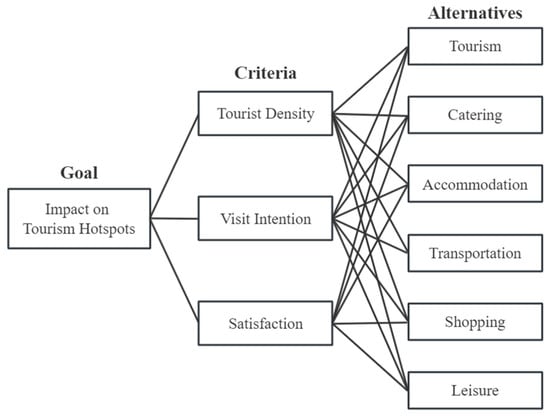
Figure 3.
Hierarchical structure for weight assessment using the G1 method.
EWM, as an objective weighting method, assigns weights based on the degree of variation within the indicator data itself [45]. This study used three criteria for the EWM matrix:
- Visit Intention: This measures visitor preference for a POI category, reflecting the natural appeal of different facility types. Data for this comes from visitor preference surveys in the Kyoto Tourism Comprehensive Survey [46].
- Visitor Density: This reflects the actual concentration of tourists within the areas of each POI category. It was calculated by spatially joining the GPS data with POI buffer zones (an area extending 10 m outward from the actual boundary of each POI). This standard GIS operation [47] ensures that tourist GPS points immediately adjacent to the POI are captured, mitigating potential data omissions caused by GPS jitter near boundaries.
- Satisfaction: This represents the overall visitor evaluation of services, indicating service quality, also sourced from the Comprehensive Survey.
Finally, to integrate the subjective weights from the G1 method and the objective weights from the EWM, we linearly combined the G1 and EWM weight sets. Let the G1 weight for POI category j be and the EWM weight be . The comprehensive weight is defined as follows:
In this study, to balance subjective and objective information, we set α = 0.5 [48]. The final comprehensive weights provide the basis for the subsequent overlay analysis.
3.3.2. Spatial Distribution of Supply and Demand and Classification of Attraction Types
To identify different types of tourist attractions, this study first revealed the matching relationship between the supply of tourism resources and visitor demand. Based on this, a classification system for attractions was developed with the following logic:
- Attractions with both high supply and high demand are defined as “hotspot attractions.”
- Attractions with abundant supply but low demand are defined as “alternative attractions.”
- Attractions with both low supply and low demand are defined as “underdeveloped attractions.”
Given that the main objective of this study is to analyze visitor dispersal to viable alternative attractions, our subsequent analyses (including perception analysis and composite attractiveness modeling) focus on hotspot attractions and alternative attractions. The underdeveloped attractions category is excluded from further discussion as it fundamentally lacks the high supply-side capacity necessary to absorb visitor overflow.
Technically, the study first employed the Kernel Density Estimation (KDE) method to transform discrete POI and GPS trajectory points into continuous spatial distributions. This process smoothed the data and generated spatial density maps to depict the patterns of tourism supply and demand. The specific procedures included the following:
- Tourism Supply Density Map: Generated using a weighted KDE, incorporating the G1-EWM weights to reflect the differential contributions of POI categories to the overall Tourism Supply.
- Tourism Demand Density Map: Generated using a standard KDE on GPS data to map the actual spatial distribution of visitors.
Subsequently, based on these supply and demand density results, the K-Means clustering algorithm was used to classify the top 200 attractions in Kyoto City (with the attraction ranking derived from TripAdvisor [49]). The input variables for the algorithm included three dimensions: supply density, demand density, and the supply-demand difference. This multi-dimensional classification method allows for a more precise characterization of the supply-demand features of the attractions. To eliminate dimensional inconsistencies, all variables were unified in terms of dimensions before clustering.
3.4. Evaluation of Tourist Destination Composite Attractiveness Considering Visitors’ Subjective Perceptions
The previous stage identified attractions where supply and demand are mismatched. To explore the reasons behind these mismatches, this stage introduces a subjective dimension by constructing a comprehensive evaluation framework that incorporates visitor perceptions. The core of this framework is an improved Two-Step Floating Catchment Area (2SFCA) method, adapted to be more effective for tourism. Unlike traditional 2SFCA models, which typically measure supply using facility size and demand using resident population, this study introduces two major improvements:
- Replacing traditional indicators with the tourism resource supply density and visitor demand density generated in the previous stage.
- Integrating sentiment analysis results—representing visitors’ perceptions—into the supply-side measure.
The specific calculation steps are as follows:
(1) Quantifying Visitors’ Subjective Perceptions. To precisely extract visitor sentiments toward specific aspects from the vast amount of review text data, this study employed the ATEPC model, a method within ABSA. Drawing on the classification of visitor sentiments from previous research [50] and integrating it with this study’s POI classification system, four core analytical dimensions were established:
- Landscape: including core attractors such as natural scenery and historic buildings.
- Experience: covering overall feelings such as atmosphere, crowdedness, and value for money.
- Service: encompassing support services like staff assistance and facility quality.
- Transportation: related to accessibility and convenience of mobility.
For example, the model can analyze a review like: “The scenery at Kiyomizu-dera is amazing, truly a World Heritage site! But the bus to the temple was too crowded, and the queues were incredibly long, which made the experience less enjoyable.” From this, it extracts structured information such as “scenery” (Landscape/Positive), “crowded bus” (Transportation/Negative), and “long queues” (Experience/Negative). Based on this, the Bullishness Index was used to calculate the sentiment score for each attraction across the four dimensions [51].
where and represent the number of positive and negative reviews, respectively, received by attraction i regarding a specific aspect during period t.
(2) Constructing the Integrated Attractiveness Indicator . To integrate objective and subjective measures, this study developed a composite attractiveness indicator, , to redefine supply capacity. This indicator incorporates the subjective sentiment score, , into the objective supply density, . The formula is as follows:
where is the objective attractiveness of attraction j, represented by the logarithmically transformed value from the tourism resource supply density map ();
is the subjective attractiveness of attraction j, calculated as the weighted average of the sentiment scores across the four dimensions; and by setting different values for α (e.g., α = 1 for a purely objective scenario, while this study uses α = 0.5 for a hybrid objective-subjective scenario), the framework can flexibly compare the actual impact of subjective experiences on a destination’s attractiveness.
(3) Calculating the Supply-Demand Ratio Rj. For each supply point j (attraction), the supply-demand ratio Rj is calculated by summing the demand from all demand points i (grid cells) within a search threshold d0, weighted by a Gaussian distance decay function:
where is the distance between demand point i and supply point j; is the demand at point i, which is the logarithmically transformed grid value from the visitor demand density map; and is the Gaussian distance decay function.
(4) Calculating the Composite Attractiveness . For each demand point i (grid cell), its final accessibility score, , is calculated by summing the weighted supply-demand ratios () of all supply points j that fall within the search threshold :
4. Results
This section reports empirical results in three steps. First, we align objective supply and demand to locate attractions with high supply but low visitation, i.e., candidates for visitor dispersal. Second, we quantify perception gaps between hotspot and alternative attractions using aspect-level sentiment. Finally, we integrate both subjective and objective dimensions in an improved 2SFCA to show how visitor experience reshapes destination attractiveness.
4.1. Identification of Alternative Attractions for Spatial Dispersal Based on Supply-Demand Matching
Demand side. The Tourist Demand Density Map (Figure 4), generated from visitor GPS trajectories, reveals five distinct high-demand spatial areas (labeled H1 to H5). (The legend ‘Level’ in this map represents the density grade, classified into 7 levels using the Natural Breaks method based on the KDE results; a higher level indicates higher tourist concentration).
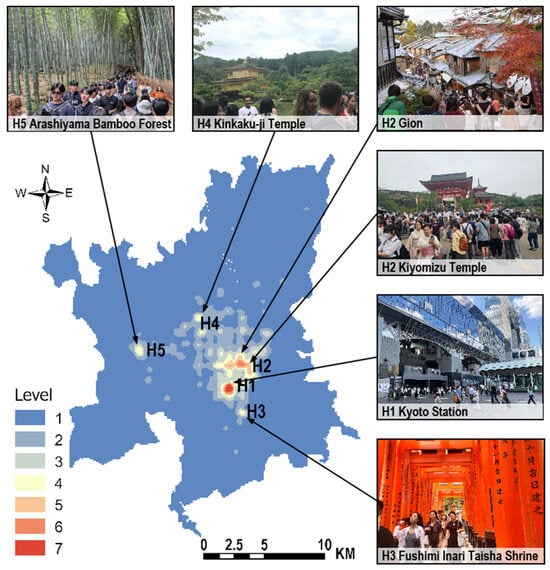
Figure 4.
Tourist demand density map. The photos show examples of selected “hotspots attractions,” with images sourced from Google Maps user reviews.
To better characterize these high-demand areas, we identified the most prominent or popular attractions within each area based on TripAdvisor, which serve as ‘anchor attractions’ for these areas. These identified areas are: (H1) an extremely high-density core in the southern Shimogyo Ward, anchored by Kyoto Station; (H2) a second high-density core spanning the Nakagyo–Shimogyo–Higashiyama wards, anchored by the Gion–Kiyomizu-dera locality; and (H3–H5) three secondary hubs centered around Fushimi Inari Taisha (H3), Kinkaku-ji Temple (H4), and Arashiyama (H5).
Supply side. Table 2 reports comprehensive POI weights from the G1–EWM model. Tourism and Transportation categories receive the highest weights, implying that an attraction’s appeal and access convenience are the main components of supply capacity. Using these weights, we calculated the tourism supply density (S) for various locations via a weighted overlay based on the kernel density (KDE) of six POI categories. This value serves as the quantitative basis for the subsequent clustering analysis.

Table 2.
Comprehensive weights of POI categories calculated by the G1-EWM combined weighting method.
Clustering logic and outputs. The core logic for identifying “alternative attractions for visitor dispersal” is to filter areas with abundant tourism resource supply yet low current visitor demand, i.e., those exhibiting “high supply-low demand” characteristics. To operationalize this identification, we classify Kyoto’s major attractions using three input variables: supply density (S), demand density (D), and their difference (S–D). Employing the K-Means clustering algorithm (with K determined via the elbow method), we identified four interpretable clusters (Figure 5):
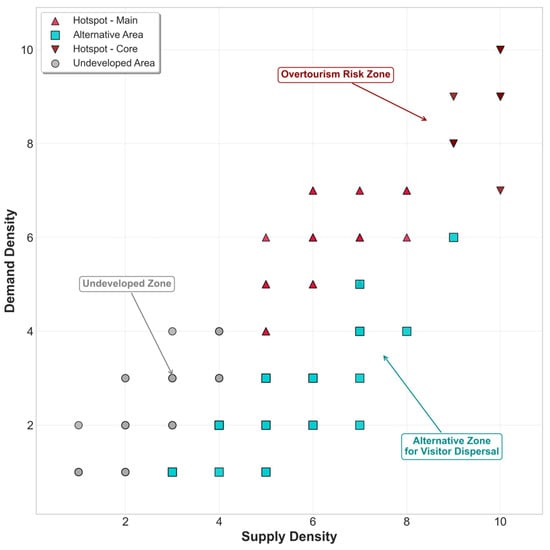
Figure 5.
Attraction clustering results based on supply-demand analysis.
- Core Hotspot Attractions: These areas exhibit the highest levels of both tourism resource supply (mean = 9.66) and visitor demand (mean = 8.88), making them the most prominent zones of overtourism.
- Main Hotspot Attractions: Their supply (mean = 6.42) and demand (mean = 5.56) levels are both high but lower than those of the core hotspots. They remain areas under considerable tourism pressure (as shown in the upper-right quadrant of Figure 5).
- Alternative Attractions for Visitor Dispersal: Their key characteristic is a high level of resource supply (mean = 5.2) but relatively low actual visitor demand (mean = 2.46), exhibiting a significant “supply-exceeds-demand” pattern (mean S–D = 2.73) (located in the lower-right quadrant of Figure 5). They have the potential to absorb overflow visitor traffic.
- Underdeveloped Attractions: These areas have low levels of both supply (mean = 2.7) and demand (mean = 2.2), indicating a limited overall level of development. Most are located in more remote suburban zones with sparse tourism facilities and low accessibility. Their mean distance to the anchor hotspots in Figure 4 is 3.96 km—almost twice that of the alternative attractions (2.09 km)—highlighting a clear spatial distinction between remote underdeveloped sites and relatively closer, well-supplied alternatives. As noted in Section 3.3.2, these sites lack sufficient supply capacity for large-scale visitor dispersal and are excluded from further comparative analysis.
Based on the “high supply-low demand” criterion, our analysis identified several areas of alternative attraction. To visualize the spatial distribution of the supply resources used in this clustering, we generated the Tourism Supply Density Map (Figure 6). This map confirms a high concentration of resources in the inner city. (The legend “Level” represents the kernel density grade derived from the weighted KDE of six POI categories, divided into seven levels by the Natural Breaks method; higher levels indicate greater tourism resource concentration.) The areas housing these attractions each feature unique resource types, but they have not translated their supply-side advantages into corresponding visitor traffic. Their specific attributes are detailed as follows:
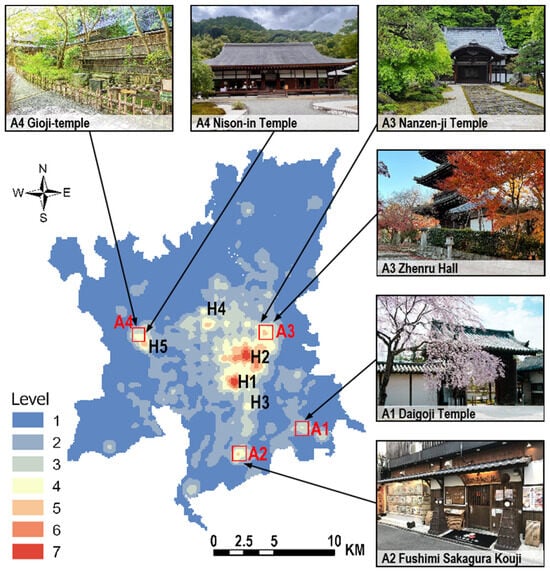
Figure 6.
Distribution of tourism supply density in Kyoto City. The photos show examples of selected “alternative attractions,” with images sourced from Google Maps user reviews.
- Fushimi Ward: Daigo-ji Temple (A1) in this ward is renowned for its cherry blossom landscapes, while the Momoyama area (A2) is notable for a well-developed sake brewing culture and convenient transportation access.
- Sakyo Ward: Represented by the vicinity of Nanzen-ji Temple (A3)—which includes attractions such as Shinnyo-do Temple—its tourism supply is primarily reflected in Zen cultural experiences centered on maple-viewing landscapes.
- Outer Arashiyama Area (A4): Attractions here, including Nison-in Temple and Gio-ji Temple, are adjacent to high-density visitor zones. because they are off the main tourist paths, their beautiful scenery has not drawn a matching number of visitors.
In summary, the identification of these alternative attractions highlights the existing supply-demand imbalance in Kyoto’s tourism spatial structure. Notably, external sources such as travel guides and tourism reports also describe these sites as “off-the-beaten-path” or “in-depth travel” destinations, supporting their recognition as high-quality yet under-visited areas [52,53,54]. By enhancing the appeal and visibility of these sites, it would be feasible to accommodate visitor overflow from hotspot attractions.
4.2. Quantification of Subjective Perception and Evaluation of Destination Composite Attractiveness
4.2.1. Quantification and Comparison of Subjective Perceptions in Hotspot and Alternative Attractions
To delve into the subjective dimension of tourism attractiveness, we use the ATEPC model. This approach allowed us to quantify visitors’ focus points and emotional tendencies from a large volume of online reviews, providing a detailed understanding of the subjective factors that affect a destination’s sustainability.
The analysis first showed that tourists focused on different things at the two types of attractions (Figure 7). At alternative attractions, reviews were heavily concentrated on “Landscape,” with an 85.18% mention rate. In contrast, while “Landscape” (74.95%) was still the main topic for hotspots, “Transportation” (9.11%) was mentioned far more often than at alternative attractions (2.98%). This difference suggests that the stressful environment at hotspots, with issues like crowding and queues, distracts visitors from the main sights and adds a “cognitive cost” to their experience.
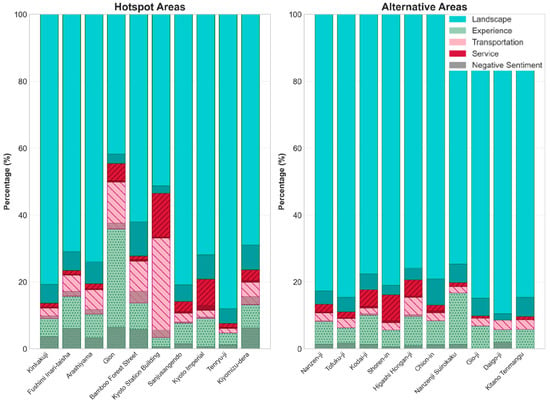
Figure 7.
Comparison of aspect category distribution in reviews for hotspot vs. alternative attractions.
To further quantify the quality of this experience, we calculated sentiment scores for each aspect using the Bullishness Index. The results confirmed that alternative attractions hold a clear advantage in subjective experience quality, a key asset for sustainable destination development.
As shown in Figure 8, sentiment scores for alternative attractions were notably superior in terms of landscape and experience, yet marginally inferior in terms of service and transportation. The biggest difference was in the “Experience” dimension, where alternative attractions scored 1.06, while hotspots scored only 0.70. This difference suggests that while hotspots draw many visitors, the quality of the experience suffers.
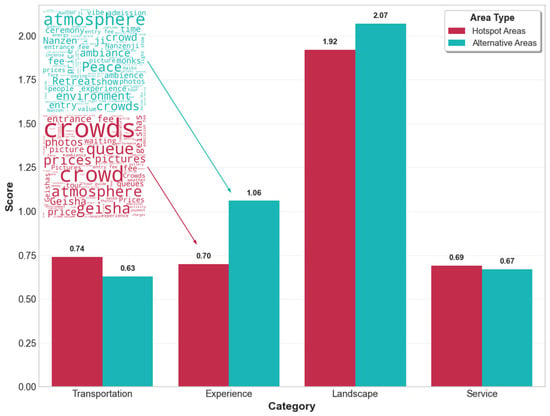
Figure 8.
Comparative Analysis of visitor perceptions: sentiment scores across four dimensions for hotspot versus alternative attractions (main). Word clouds illustrate the dominant terms within the ‘Experience’ dimension for alternative attractions (blue) and hotspot attractions (red).
A word cloud analysis of the “Experience” dimension supports this finding. For alternative attractions, keywords focus on cultural depth and peacefulness, such as “atmosphere,” “peace,” and “environment.” These words show that these attractions offer the immersive, high-quality cultural experiences essential for sustainable tourism. This aligns with their “high supply-low demand” profile, making them suitable for visitor dispersal. In contrast, discussions about hotspots are dominated by the negative side effects of overtourism. Keywords like “crowds,” “queue,” “waiting,” and “prices” point to an experience defined by congestion and commercial pressure, confirming their status as stressful areas where the visitor experience is suffering.
Furthermore, hotspots had nearly twice the percentage of negative reviews (10.07%) as alternative attractions (5.74%). The biggest difference was in negative reviews for the “Experience” aspect (3.14% for hotspots vs. 1.01% for alternative attractions), which further shows how crowding harms the visitor experience.
Notably, the sentiment score for “Landscape” was also slightly higher at alternative attractions (2.07) than at hotspots (1.92). This finding offers a key insight: a tourist’s rating of a landscape depends not only on its physical features but also on the quality of their overall experience. At hotspots, negative factors like crowds and lines can detract from the scenery, potentially lowering visitors’ opinion of the landscape itself. In contrast, the calmer environment at alternative attractions allows tourists to appreciate the scenery more fully, leading to better reviews. This shows that a positive environment can greatly increase the perceived value of a destination’s main resources.
4.2.2. Composite Attractiveness Evaluation of Tourist Destinations Integrating Visitor Subjective Perceptions
To examine the actual impact of the aforementioned differences in subjective perception on destination composite attractiveness, this section compares the evaluation results from the 2SFCA model under two scenarios: purely objective accessibility (α = 1) and hybrid subjective-objective accessibility (α = 0.5).
The inclusion of visitor perceptions prompted a significant reconfiguration of the spatial distribution of attractiveness. Notably, the high-attractiveness zones corresponding to hotspot attractions contracted. For instance, central hotspots like Gion and Hanamikoji (H1–H2), which exhibited extensive high-value zones in the purely objective model (α = 1, Figure 9a), saw these areas markedly diminish in the hybrid model (α = 0.5, Figure 9b). This reduction indicates that while these locations boast superior objective resources, the prevalence of negative visitor experiences—such as perceptions of being “crowded” and “noisy”—erodes their composite attractiveness, challenging their long-term sustainable value.
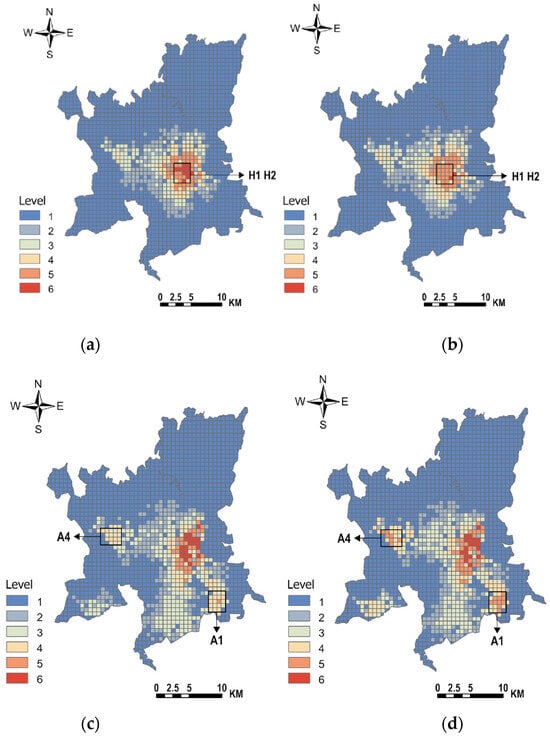
Figure 9.
Comparison of the spatial distribution of composite attractiveness for different attraction types: (a) objective results for hotspot attractions, (b) hybrid subjective-objective results for hotspot attractions, (c) objective results for alternative attractions, and (d) hybrid subjective-objective results for alternative attractions.
In stark contrast, the composite attractiveness of alternative attractions was augmented. Attractions such as Daigo-ji Temple (A1) and Gio-ji Temple (A4), initially rated lower in the objective assessment (α = 1, Figure 9c), demonstrated expanded high-attractiveness zones in the hybrid evaluation (α = 0.5, Figure 9d). This enhancement is directly attributable to positive visitor sentiments, including “quiet” and “good atmosphere,” which effectively boosted their perceived attractiveness and expanded their service range.
The scatter plot (Figure 10), which illustrates changes in composite attractiveness for both types of attractions, visually reveals the impact pattern of subjective perceptions. Notably, for both hotspot and alternative attractions, over one-third of the attractions (37.0% and 37.5%, respectively) saw a change in their attractiveness rating. Among these attractions, the two types exhibited diametrically opposed trends:
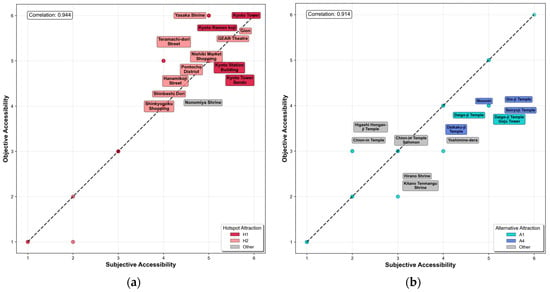
Figure 10.
Comparative analysis of hybrid subjective-objective attractiveness scores for hotspot attractions (a) and alternative attractions (b).
- The attractiveness of hotspot attractions was negatively affected by subjective perceptions: Of the hotspot attractions that experienced a change in their attractiveness rating, 95% saw a decrease in composite attractiveness after subjective perceptions were incorporated. Nearly all of these downgraded attractions were core hotspots located in the city center (near H1 and H2), such as Gion and Hanamikoji.
- The attractiveness of alternative attractions, by contrast, was positively impacted by subjective perceptions: Of the alternative attractions with a change in their attractiveness rating, 75% saw an increase in composite attractiveness following the incorporation of subjective perceptions. Most of these upgraded attractions were located on the urban periphery, specifically in the Daigo-ji (A1) and Outer Arashiyama (A4) areas (e.g., Gio-ji Temple).
5. Discussion
5.1. The Reshaping of Destination Attractiveness by Subjective Experience
This study’s core finding reveals a differentiated impact mechanism: subjective visitor experience reshapes destination attractiveness, but its effect is not uniform. It depends on three factors: the relative nature of the attraction attractiveness rating system, the degree of spatial clustering, and an attraction’s baseline attractiveness.
First, the rating system in this study measures relative attractiveness. An attraction’s rating changes not just because its score changes, but only when the score crosses a threshold into a new tier. Most ratings remained stable because their score fluctuations were not large enough to change their overall rank. The few attractions whose ratings did change are significant because they highlight structural problems and opportunities created by overtourism.
Second, the downgrade of core hotspot attractions in the city center is due to the spatial compounding of negative experiences. In central areas like Gion and Kiyomizu-dera (H1 and H2), where attractions are highly clustered, negative visitor perceptions such as crowding and traffic inconvenience become regional phenomena. Within the 2SFCA model, these perceptions are calculated cumulatively, causing a significant reduction in the composite attractiveness score for the entire area—a reduction substantial enough to systematically downgrade these attractions to a lower tier.
Third, for more isolated attractions, rating changes depend on their initial attractiveness. Iconic hotspots like Kinkaku-ji Temple (H4) have a very high baseline attractiveness from their objective resources. Without the compounding effect of negative sentiment from a crowded area, the penalty from feedback on crowding is small compared to their strong reputation. In contrast, for alternative attractions like Daigo-ji Temple (A1), whose initial attractiveness is lower, a peaceful visitor experience provides a significant boost. This boost from a high-quality experience is large relative to their initial score, allowing them to move up to a more attractive tier. Although both alternative and underdeveloped attractions are peripheral, their spatial and functional characteristics differ markedly. Underdeveloped attractions are significantly more remote (mean distance to hotspots: 3.96 km) and lack the infrastructure for high-quality experiences. In contrast, alternative attractions are relatively closer (mean distance: 2.09 km) and possess a strong tourism supply. This stronger supply ensures their “pleasant/quiet” atmosphere is a genuine quality advantage, not merely a byproduct of distance from core congestion.
In summary, visitor experience does not affect attractiveness in a simple, direct way. Instead, it interacts with the location and market position of attractions to reshape the destination’s competitive landscape. The appeal of city-center hotspots is worn down by widespread negative experiences, while alternative attractions on the city’s periphery are re-evaluated, gaining a competitive edge from their superior visitor experience.
5.2. Methodological Contributions and Extensions
This study makes several contributions to the methodology of tourism spatial analysis. First, by integrating the G1 method with the Entropy Weight Method, the hybrid weighting model developed in this study provides a more robust way to measure urban tourism supply, balancing expert a priori knowledge with the distributional characteristics of objective data.
Second, the study utilized an ATEPC model to transform unstructured reviews into structured sentiment data across four core dimensions: landscape, experience, service, and transportation. This allowed for a detailed comparison of visitor perceptions between different types of attractions, providing specific evidence to explain the differences in their attractiveness.
Finally, the study’s enhancements to the classic 2SFCA model are significant. Traditional applications of this model in tourism are often limited by supply and demand indicators poorly suited to the tourism context. This research innovates by using tourism POI density for supply (instead of facility scale), visitor GPS trajectory density for demand (instead of resident population), and, crucially, incorporating quantified visitor perceptions as a core variable in defining supply-side attractiveness. This innovation shifts the model’s focus from simply measuring accessibility to a physical space to evaluating the attainability of a high-quality experience, thereby aligning the framework more closely with the essence of tourist decision-making.
6. Conclusions and Policy Recommendations
6.1. Research Conclusions
To contribute to sustainable destination development under the pressures of overtourism, this study builds and validates an evidence-based framework that aligns objective supply–demand structures with visitor-perceived experience quality to support long-term, experience-oriented destination management. The main conclusions are:
First, by matching tourism supply with visitor demand, we identify a portfolio of “alternative attractions for spatial dispersal”—sites with high supply and low demand that can absorb overflow in a sustainable manner without amplifying pressure at the core. In Kyoto, these are mostly located on the outskirts of the city, e.g., Daigo-ji Temple and the Momoyama area (Fushimi Ward), the Nanzen-ji area (Sakyo Ward), and Nison-in in outer Arashiyama, where resource quality is high yet visitor pressure is comparatively low. This supply–demand mismatch points to actionable nodes for resilience-oriented dispersal in the city’s tourism spatial structure.
Second, visitor experience is a key factor in rebalancing a destination’s attractiveness to meet sustainability goals, but its effect is context-dependent. In highly clustered central hotspots, negative experiences (e.g., crowding) accumulate spatially and undermine area-wide composite attractiveness, challenging long-term sustainability. For relatively isolated sites, changes are differentiated: iconic hotspots maintain high ratings due to strong objective baselines, while alternative attractions gain disproportionate upgrades when they offer quiet, high-quality experiences. This helps overcome their less central locations and expands the list of sustainable options for dispersing tourists.
6.2. Policy Recommendations
Building on these findings, destination management should shift from infrastructure-led expansion to typology- and perception-informed, adaptive management that optimizes spatial balance and experience quality—core requirements for sustainable tourism and long-term care of the destination:
Central core hotspots. Because diminished attractiveness here stems from cumulative, regionalized negative experiences, management should emphasize coordinated, area-wide solutions and high-efficiency dispersal rather than piecemeal fixes. Practically, deploy smart-tourism tools (e.g., dynamic wayfinding, integrated mobility data, and load-aware guidance) to re-route flows in real time toward peripheral options and reduce network-level crowding externalities—thereby safeguarding experience quality and heritage carrying capacity.
Iconic hotspot attractions. When reducing total visitor numbers is not feasible, the priority should be improving the experience for each person. Refine how visitors move through the site, use smart reservation and timed-entry systems, and pace entries to reduce daily peaks. These actions protect the experience quality and meet conservation goals, aligning the site’s use with long-term sustainability.
Alternative attractions for dispersal. These attractions should be treated as strategic buffers in the destination’s long-term capacity plan. Use targeted marketing to highlight their “tranquil/unique” qualities and connect them with sustainable transportation (e.g., direct, low-impact transit and last-mile solutions). This combination improves their perception and accessibility, establishing dispersal as a sustainable practice rather than a short-term fix for crowding.
Monitoring & adaptive governance. Visitor perception data should be integrated into regular monitoring alongside supply and demand indicators. This allows for adaptive responses, like discouraging visits to overcrowded areas while promoting outlying attractions during peak times. Building this data into the workflows of destination management organizations (DMOs) helps them stay aligned with sustainability goals and the long-term well-being of the destination.
6.3. Research Limitations and Future Outlook
This study created a framework that combines tourism supply and demand with visitor perceptions to find and evaluate potential sites for dispersing tourists. While it offers practical insights for managing overtourism in Kyoto, the study has three main limitations.
First, the spatial generalizability of the findings is limited by the single-city case study. The high-precision visitor GPS data used in this research were obtained from the Arukumachi application, whose geographic coverage is confined to Kyoto City. Applying this framework to other heritage destinations with similar congestion issues would help test and validate its broader applicability.
Second, tourist group heterogeneity was not fully addressed. Treating tourists as a homogeneous group, the study did not distinguish between international/domestic visitors or first-time/repeat travelers, who exhibit distinct spatial behaviors and perceptions. Future work could integrate multi-source data (e.g., user profiles, questionnaires) to analyze how different tourist segments could be dispersed, allowing for more targeted management and marketing.
Third, data temporal coverage is limited. The GPS data, confined to a specific timeframe, lacked a complete annual tourism cycle, leading to insufficient insights into seasonal patterns. Longer-term data (e.g., across cherry blossom, autumn foliage, and off-seasons) should be included to compare dynamic differences in visitor behavior/perception, informing more proactive, flexible management strategies.
Finally, the rating approach has constraints. Capturing relative (not absolute) attractiveness changes, it may not reflect overall fluctuations if all attractions’ scores shift but rankings remain unchanged. More sensitive quantitative indicators could be explored to measure absolute attractiveness changes.
Author Contributions
Conceptualization, M.H. and K.R.; methodology, M.H., K.R. and H.Y.; software, K.R.; formal analysis, K.R.; resources, T.N.; data curation, K.R.; writing—original draft, K.R.; visualization, K.R.; supervision, M.H. and H.Y.; writing—review and editing, M.H., H.Y., K.R., M.G. and T.N.; project administration, M.G.; funding acquisition, M.G. All authors have read and agreed to the published version of the manuscript.
Funding
This research was supported by the National Natural Science Foundation of China (U24A20198).
Institutional Review Board Statement
Not applicable.
Informed Consent Statement
Not applicable.
Data Availability Statement
Inquiries about the data supporting the findings of this study should be directed to the corresponding author.
Acknowledgments
A preliminary version of this work was presented at ICITE 2024 (Xi’an, 18–20 October 2024) as “Research on the Identification of Tourism Hotspots and Potential Areas Based on Multi-source Data” [55]. This article is a substantially revised and expanded journal version of the conference paper. The authors retain the copyright of the conference paper, and its reuse for this extended journal version complies with the copyright policy. The authors are very grateful to all the participants. We would also like to thank the anonymous reviewers for their helpful comments and suggestions, which greatly improved the quality of this paper.
Conflicts of Interest
The authors declare no conflicts of interest.
References
- Vourdoubas, J. Evaluation of Overtourism in the Island of Crete, Greece. Eur. J. Appl. Sci. Eng. Technol. 2024, 2, 21–32. [Google Scholar] [CrossRef]
- Dodds, R.; Butler, R. The Phenomena of Overtourism: A Review. Int. J. Tour. Cities 2019, 5, 519–528. [Google Scholar] [CrossRef]
- BBC News. Kyoto Bans Tourists from Some Alleys in Geisha District over Bad Behaviour. BBC News. 12 March 2024. Available online: https://www.bbc.com/news/world-asia-68530891 (accessed on 21 September 2025).
- De Luca, G.; Shirvani Dastgerdi, A.; Francini, C.; Liberatore, G. Sustainable Cultural Heritage Planning and Management of Overtourism in Art Cities: Lessons from ATLAS World Heritage. Sustainability 2020, 12, 3929. [Google Scholar] [CrossRef]
- Jamader, A.R.; Chowdhary, S.; Dasgupta, S.; Kumar, N. From Promotion to Preservation and Rethinking Marketing Strategies to Combat Overtourism. In Solutions for Managing Overtourism in Popular Destinations; IGI Global Scientific Publishing: Hershey, PA, USA, 2025; pp. 379–398. [Google Scholar]
- Duignan, M. ‘Overtourism’? Understanding and Managing Urban Tourism Growth beyond Perceptions: Cambridge Case Study: Strategies and Tactics to Tackle Overtourism. In ‘Overtourism’? Understanding and Managing Urban Tourism Growth Beyond Perceptions: Case Studies; United Nations World Tourism Organisation (UNWTO): Madrid, Spain, 2019; pp. 34–39. [Google Scholar]
- Esu, B.B. Transforming the Nigeria Tourism Industry through Tourism Entrepreneurial Development. Afr. J. Bus. Manag. 2015, 9, 569–580. [Google Scholar] [CrossRef]
- Vujović, F.; Nikolić, G.; Đurđevac, T.; Brđanin, E. Geoecological Evaluation of Natural Potentials of Šavnik (Montenegro) for the Purposes of Recreational Tourism Using V-Wert Method in GIS Environment. Zb. Rad.—Geogr. Fak. Univ. Beogr. 2023, 71, 5–17. [Google Scholar] [CrossRef]
- Wu, J.; Zhang, Q.; Li, Z. Spatial Coupling Characteristics Between Tourism Point of Interest (POI) and Nighttime Light Data of the Changsha–Zhuzhou–Xiangtan Metropolitan Area, China. Sustainability 2025, 17, 2391. [Google Scholar] [CrossRef]
- Shoval, N.; Ahas, R. The Use of Tracking Technologies in Tourism Research: The First Decade. Tour. Geogr. 2016, 18, 587–606. [Google Scholar] [CrossRef]
- Singgalen, Y.; Wahyuningtyas, S.; Widodo, E.; Dasra, M.; Setiawan, R. Sentiment Analysis for Tourism Destination Reviews Using Cross-Industry Standard Process for Data-Mining. J. Theor. Appl. Inf. Technol. 2024, 102, 6364–6379. [Google Scholar]
- Joseph, A.; Vasundhara, T.P.; Thomas, T. How Social Media Influences Travel Decisions: The Effect of User-Generated Content, Visual Appeal, and Storytelling on Destination Intentions. South India J. Soc. Sci. 2024, 22, 349–359. [Google Scholar] [CrossRef]
- Dioko, L.; Harrill, R.; Munar, A.M. Tourist-Created Content: Rethinking Destination Branding. Int. J. Cult. Tour. Hosp. Res. 2011, 5, 291–305. [Google Scholar] [CrossRef]
- Yan, L.; Gao, B.W.; Zhang, M. A Mathematical Model for Tourism Potential Assessment. Tour. Manag. 2018, 63, 355–365. [Google Scholar] [CrossRef]
- Akbari, R.; Pourmanafi, S.; Soffianian, A.R.; Galalizadeh, S.; Khodakarami, L. Enhancing Ecotourism Site Suitability Assessment Using Multi-Criteria Evaluation and NSGA-II. Environ. Dev. Sustain. 2024, 26, 28663–28698. [Google Scholar] [CrossRef]
- Puška, A.; Pamucar, D.; Stojanović, I.; Cavallaro, F.; Kaklauskas, A.; Mardani, A. Examination of the Sustainable Rural Tourism Potential of the Brčko District of Bosnia and Herzegovina Using a Fuzzy Approach Based on Group Decision Making. Sustainability 2021, 13, 583. [Google Scholar] [CrossRef]
- Liang, W.; Ahmad, Y.; Mohidin, H.H.B. Spatial Pattern and Influencing Factors of Tourism Based on POI Data in Chengdu, China. Environ. Dev. Sustain. 2024, 26, 10127–10143. [Google Scholar] [CrossRef]
- Luo, G.; Ye, J.; Wang, J.; Wei, Y. Urban Functional Zone Classification Based on POI Data and Machine Learning. Sustainability 2023, 15, 4631. [Google Scholar] [CrossRef]
- Qu, X.; Xu, G.; Qi, J.; Bao, H. Identifying the Spatial Patterns and Influencing Factors of Leisure and Tourism in Xi’an Based on Point of Interest (POI) Data. Land 2023, 12, 1805. [Google Scholar] [CrossRef]
- Vidya Sagar, G.; Harshitha, K.L.; Sadhana, C.H.; Venkata Sai, C.H.Y.; Bhadrinath, K.V.; Sukesh, T. Tourism Hotspot Detection Using Social Media and Geo-Data. Int. J. Innov. Res. Sci. Eng. Technol. 2025, 14, 318. Available online: https://www.ijirset.com/upload/2025/april/318_Tourism.pdf (accessed on 23 September 2025).
- Kaufmann, M.; Siegfried, P.; Huck, L.; Stettler, J. Analysis of Tourism Hotspot Behaviour Based on Geolocated Travel Blog Data: The Case of Qyer. ISPRS Int. J. Geo-Inf. 2019, 8, 493. [Google Scholar] [CrossRef]
- Zhang, F.; Zu, J.; Hu, M.; Zhu, D.; Kang, Y.; Gao, S.; Zhang, Y.; Huang, Z. Uncovering Inconspicuous Places Using Social Media Check-Ins and Street View Images. Comput. Environ. Urban Syst. 2020, 81, 101478. [Google Scholar] [CrossRef]
- García-Palomares, J.C.; Gutiérrez, J.; Mínguez, C. Identification of Tourist Hot Spots Based on Social Networks: A Comparative Analysis of European Metropolises Using Photo-Sharing Services and GIS. Appl. Geogr. 2015, 63, 408–417. [Google Scholar] [CrossRef]
- Zheng, S.T.; Lu, L.; Chen, H. A Review of Research on the Evolution of Tourism Destinations. J. Anhui Agric. Univ. (Soc. Sci. Ed.) 2013, 4, 67–73. [Google Scholar]
- Ding, D.; Zheng, Y.; Zhang, Y.; Liu, Y. Understanding Attractions’ Connection Patterns Based on Intra-Destination Tourist Mobility: A Network Motif Approach. Humanit. Soc. Sci. Commun. 2024, 11, 636. [Google Scholar] [CrossRef]
- Polo, G.; Acosta, C.M.; Ferreira, F.; Dias, R.A. Location-Allocation and Accessibility Models for Improving the Spatial Planning of Public Health Services. PLoS ONE 2015, 10, e0119190. [Google Scholar] [CrossRef]
- Guagliardo, M.F. Spatial Accessibility of Primary Care: Concepts, Methods and Challenges. Int. J. Health Geogr. 2004, 3, 3. [Google Scholar] [CrossRef]
- Chen, X.; Jia, P. A Comparative Analysis of Accessibility Measures by the Two-Step Floating Catchment Area (2SFCA) Method. Int. J. Geogr. Inf. Sci. 2019, 33, 1739–1758. [Google Scholar] [CrossRef]
- Luo, W.; Wang, F. Measures of Spatial Accessibility to Health Care in a GIS Environment: Synthesis and a Case Study in the Chicago Region. Environ. Plan. B Plan. Des. 2003, 30, 865–884. [Google Scholar] [CrossRef] [PubMed]
- Ni, J.; Liang, M.; Lin, Y.; Wu, Y.; Wang, C. Multi-Mode Two-Step Floating Catchment Area (2SFCA) Method to Measure the Potential Spatial Accessibility of Healthcare Services. ISPRS Int. J. Geo-Inf. 2019, 8, 236. [Google Scholar] [CrossRef]
- Zhao, Z.L.; Li, X.L.; Xu, Y.Q.; Yang, S.R.; Jiang, Y.; Wang, S.S. Evaluating Spatial Accessibility of Cultural Urban Land Use by Using Improved 2SFCA Method in Xi’an, China. Heliyon 2022, 8, e11993. [Google Scholar] [CrossRef] [PubMed]
- Zhang, Y.; Fu, X.; Yu, Z.; Luo, S. How Does Multi-Modal Travel Enhance Tourist Attraction Accessibility? A Refined Two-Step Floating Catchment Area Method Using Multi-Source Data. Trans. GIS 2024, 28, 278–302. [Google Scholar] [CrossRef]
- Hoang, N.P.; Vinh, L.T.; Triet, P.M. Exploring Tourist Behavior Using Natural Language Processing: Evidence from Tripadvisor Reviews. Tạp Chí Khoa Học Lạc Hồng 2025, 1, 31–35. [Google Scholar] [CrossRef]
- Ozen, I.A. Tourism Products and Sentiment Analysis. In Advances in Hospitality and Tourism Information Technology; Cobanoglu, C., Dogan, S., Berezina, K., Collins, G., Eds.; USF M3 Publishing: Tampa, FL, USA, 2021; pp. 1–44. [Google Scholar] [CrossRef]
- Nawawi, I.; Ilmawan, K.F.; Maarif, M.R.; Syafrudin, M. Exploring Tourist Experience through Online Reviews Using Aspect-Based Sentiment Analysis with Zero-Shot Learning for Hospitality Service Enhancement. Information 2024, 15, 499. [Google Scholar] [CrossRef]
- Yang, H.; Zeng, B.; Yang, J.; Song, Y.; Xu, R. A Multi-Task Learning Model for Chinese-Oriented Aspect Polarity Classification and Aspect Term Extraction. Neurocomputing 2021, 419, 344–356. [Google Scholar] [CrossRef]
- Mao, K.; Li, J.; Yan, H. Measuring the Spatial Accessibility of Parks in Wuhan, China, Using a Comprehensive Multimodal 2SFCA Method. ISPRS Int. J. Geo-Inf. 2023, 12, 357. [Google Scholar] [CrossRef]
- Kyoto City Tourism Association. A Data-Based Look at Kyoto Tourism Before and After COVID. Kyoto Travel. 1 December 2023. Available online: https://kyoto.travel/en/travel-inspiration/a-databased-look-at-kyoto-tourism-before-and-after-covid/ (accessed on 8 November 2025).
- Honichi Lab Editorial Department. Kyoto City, Number of Foreign Tourists in 2024 Hits Record High of 10.88 Million. Honichi Lab. 18 June 2025. Available online: https://honichi.com/news/2025/06/18/kyoto2024/ (accessed on 8 November 2025).
- Asahi, S.; Habu, E. Recommendations for Policy on Measures against Overtourism in Japan. Chukyo Univ. Inst. Econ. Discuss. Pap. Ser. 2025, 2410, 1–18. [Google Scholar]
- Geofabrik. Download OpenStreetMap for Kansai Region (a.k.a. Kinki region). Geofabrik Download Server. 5 November 2025. Available online: https://download.geofabrik.de/asia/japan/kansai.html (accessed on 8 November 2025).
- Nishigaki, T.; Schmöcker, J.D.; Yamada, T.; Nakao, S. Estimating the Number of Tourists in Kyoto Based on GPS Traces and Aggregate Mobile Statistics. In Proceedings of the 12th International Scientific Conference on Mobility and Transport, Singapore, 5–7 April 2022; Antoniou, C., Busch, F., Rau, A., Hariharan, M., Eds.; Lecture Notes in Mobility. Springer: Singapore, 2023. [Google Scholar] [CrossRef]
- Tripadvisor. THE 15 BEST Things to Do in Kyoto (2025)—Must-See Attractions. Tripadvisor. Available online: https://www.tripadvisor.com/Attractions-g298564-Activities-oa0-Kyoto_Kyoto_Prefecture_Kinki.html (accessed on 8 November 2025).
- Gong, C.; Li, W.; Guo, Y. Rank Correlation Analysis Method in Group Evaluation. Oper. Res. Manag. Sci. 2020, 29, 152–156. (In Chinese) [Google Scholar]
- Kumar, R.; Singh, S.; Bilga, P.S.; Singh, J.; Singh, S.; Bhanot, N. Revealing the Benefits of Entropy Weights Method for Multi-Objective Decision Making: A Review. J. Mater. Res. Technol. 2021, 10, 1738–1760. [Google Scholar] [CrossRef]
- Kyoto City Tourism Association (DMO KYOTO). Kyoto Tourism Comprehensive Survey 2023; Kyoto City Tourism Association: Kyoto, Japan, 2023; Available online: https://www.kyokanko.or.jp/survey_list/ (accessed on 19 September 2025).
- Esri. Buffer (Analysis)—ArcGIS Pro|Documentation. ArcGIS Pro Documentation. Available online: https://pro.arcgis.com/en/pro-app/latest/tool-reference/analysis/buffer.htm (accessed on 8 November 2025).
- Zhang, X.; Zhan, Q.; Zhou, W.; Liu, Z. A Comprehensive Evaluation of Vehicle Intelligent Barrier Avoidance Function under Special Roads Based on G1-CRITIC. Sustainability 2023, 15, 12093. [Google Scholar] [CrossRef]
- TripAdvisor. Things to Do in Kyoto. Available online: https://www.tripadvisor.com.sg/Attractions-g298564-Activities-oa0-Kyoto_Kyoto_Prefecture_Kinki.html (accessed on 20 September 2025).
- Li, H.; Gao, H.; Song, H. Tourism Forecasting with Granular Sentiment Analysis. Ann. Tour. Res. 2023, 103, 103667. [Google Scholar] [CrossRef]
- Li, X.; Wang, Y.; Yan, X.; Xie, G.; Wang, S. Tourism Demand Forecasting Based on Multi-Source Fine-Grained Sentiment Mining. Syst. Eng.—Theory Pract. 2024, 44, 2293–2308. [Google Scholar] [CrossRef]
- Rowthorn, C. How to Escape the Crowds in Kyoto. Inside Kyoto. Available online: https://www.insidekyoto.com/how-to-escape-the-crowds-in-kyoto (accessed on 9 November 2025).
- Kyoto Travel. 6 Hidden Temples to Visit in the Saga Arashiyama Area. Kyoto Travel. Available online: https://kyoto.travel/en/itineraries/6-hidden-spots-to-visit-in-the-saga-arashiyama-area (accessed on 9 November 2025).
- Alyse. 16 Stunning Kyoto Hidden Gems You Won’t Want to Miss. The Invisible Tourist. 2 April 2025. Available online: https://www.theinvisibletourist.com/kyoto-hidden-gems/ (accessed on 9 November 2025).
- Hao, M.; Ren, K.; Wang, C.; Yan, H.; Gao, T.; Lai, J. Research on the Identification of Tourism Hotspots and Potential Areas Based on Multi-Source Data. In Advances in Transdisciplinary Engineering, Proceedings of the 9th International Conference on Intelligent Transportation Engineering (ICITE 2024), Xi’an, China, 18–20 October 2024; Intelligent Transportation Engineering; IOS Press: Amsterdam, The Netherlands, 2024; Volume 72, pp. 71–81. [Google Scholar]
Disclaimer/Publisher’s Note: The statements, opinions and data contained in all publications are solely those of the individual author(s) and contributor(s) and not of MDPI and/or the editor(s). MDPI and/or the editor(s) disclaim responsibility for any injury to people or property resulting from any ideas, methods, instructions or products referred to in the content. |
© 2025 by the authors. Licensee MDPI, Basel, Switzerland. This article is an open access article distributed under the terms and conditions of the Creative Commons Attribution (CC BY) license (https://creativecommons.org/licenses/by/4.0/).