Abstract
Urban infrastructure is a key determinant of population health and physical activity. Well-planned environments support active lifestyles and reduce health risks. This study examined the relationship between urban infrastructure, physical activity, and health among 95 residents aged 40–75 in Kaunas, Lithuania, between 2019 and 2022, selected from a baseline cohort of 1086 participants. Data were collected through questionnaires assessing environmental perceptions and self-rated health, alongside objective indicators—daily step count, resting systolic (sBP) and diastolic (dBP) blood pressure, body mass index (BMI), waist circumference, and heart rate—measured using wearable devices. Participants living in areas with more favorable infrastructure showed lower sBP (130.84 vs. 153.68 mmHg), lower heart rate (62.64 vs. 74.01 bpm), reduced BMI, and higher weekly step counts (54,564 vs. 27,885). Regression analysis indicated that higher physical activity and better-perceived infrastructure (REIF) were significantly associated with improved cardiovascular health (β = −11.32 for sBP, p = 0.011). Interaction effects revealed that the positive impact of physical activity on self-rated health was more pronounced in supportive environments (β = −0.04, p = 0.006). These findings suggest that well-designed urban spaces with walkability, green areas, and low perceived pollution promote healthier lifestyles and reduce health risks, supporting health equity and long-term well-being.
1. Introduction
Urban environments significantly influence population health through access to infrastructure, green spaces, and opportunities for physical activity [,]. As urbanization accelerates, the sustainable design and quality of built environments become central to promoting well-being and mitigating the burden of non-communicable diseases. Empirical research has consistently demonstrated associations between poor urban infrastructure—such as limited access to green spaces, unsafe pedestrian areas, and high pollution levels—and lower levels of physical activity, as well as increased risks of hypertension, obesity, and mental health issues [,,].
While associations between the built environment and health have been widely investigated, few studies have combined citizen-perceived infrastructure indices with objectively measured activity and health outcomes, particularly in Central and Eastern Europe [,].
Physical inactivity remains one of the leading modifiable risk factors for cardiovascular and metabolic diseases [,] with urban form and environmental accessibility acting as major facilitators or barriers. In cities such as Kaunas, studies have shown that fewer than 20% of residents meet recommended physical activity levels [], and access to green infrastructure is associated with lower blood pressure and improved health perception [,]. Moreover, frequent exposure to nature has been shown to reduce stress and improve psychological well-being [,].
Urban planning has the potential to improve public health through the promotion of walkability, accessibility, and green infrastructure. While many studies have examined associations between individual environmental factors and health, fewer have assessed how the quality of residential infrastructure may modify the health impact of physical activity. Moreover, limited attention has been given to integrating perceived infrastructure quality with objective physical activity data, particularly in mid-sized European cities.
In this context, the city of Kaunas represents a relevant case study for examining how urban infrastructure characteristics relate to health outcomes within a Central and Eastern European setting. This is the first study of its kind in the city of Kaunas that combines and enhances primary subjective data with objective results obtained from prolonged measurements using widely accessible smart wearable devices to demonstrate that well-designed urban spaces—characterized by walkability, accessible green areas, and low perceived pollution—contribute to healthier lifestyles and reduced health risks. Kaunas, a mid-sized city in Lithuania, provides an important case for studying these interactions, as less than one-fifth of its residents meet recommended activity levels [] despite the relatively high availability of green space. Therefore, the present study aims to investigate how a novel composite index of residential infrastructure quality (REIF) interacts with objectively measured physical activity (step counts) to influence cardiovascular and self-rated health outcomes in a mid-sized European city. Using data from the Horizon 2020 CitieS-Health project, this study examines both the independent and combined effects of REIF and physical activity on multiple health outcomes.
The inclusion of citizen-generated data and environmental perception metrics strengthens the participatory dimension of this research, aligning with emerging trends in co-designed urban planning and community-based transport research. This work contributes new evidence on the contextual influence of neighborhood infrastructure on physical activity benefits, providing relevant insights for sustainable urban and transport policy.
2. Materials and Methods
2.1. Study Design
This study was conducted between 2019 and 2022. The primary study sample consisted of 1086 participants aged 18–75, residing in 11 districts of Kaunas city, Lithuania (Figure 1). A detailed description of the methods of the participants’ involvement, as well as the description of the pilot study, has been provided previously []. Briefly, participants were recruited through a combination of public announcements, local community events, and direct invitations distributed across 11 administrative districts of Kaunas. This multistage recruitment approach aimed to ensure representation of residents with diverse demographic and environmental backgrounds, thereby capturing variability in exposure to different urban infrastructure conditions. All participants completed standardized questionnaires and underwent basic health assessments. Informed consent was obtained from each participant. The study was approved by the Kaunas Regional Committee for Biomedical Research Ethics (BE-2-51, 10 June 2019) and conducted in accordance with the Declaration of Helsinki.
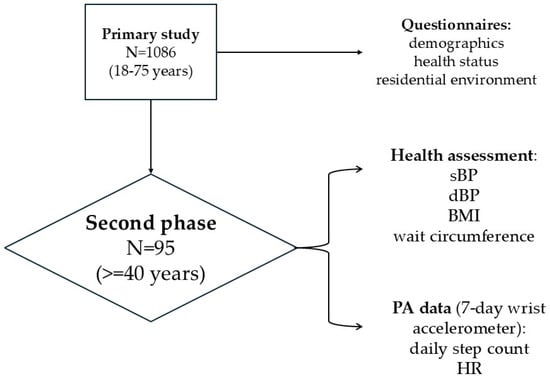
Figure 1.
Schematic overview of study design and measurements.
In the second phase, participants aged 40 years and older were invited to join an in-depth follow-up study. According to the study protocol, up to 10% of the baseline sample was designated for the second phase involving detailed follow-up assessments. The measurements were conducted between January and December 2022 to ensure coverage of different seasons and to assess potential seasonal variations in physical activity and health indicators. In total, 95 participants were included, representing those who met the eligibility criteria and completed all study procedures, including questionnaire surveys, wearable activity monitoring, and medical evaluations. The aim of this phase was to evaluate the interaction between objectively measured physical activity, perceived residential environment, and health indicators. Participants were instructed to wear a Xiaomi Mi Band 5 activity tracker continuously for 7 days. The device has been validated in adults as a suitable instrument for monitoring step count and heart rate, showing only minor deviations from research-grade devices [,]. Participation was voluntary, and all procedures, including device use, medical measurements (e.g., blood pressure) and data confidentiality, were explained in detail before consent. This phase was conducted under the same ethical approval granted by the Kaunas Regional Committee for Biomedical Research Ethics (BE−2−51, 10 June 2019).
2.2. Study Area
The study was conducted in Kaunas (54°56′ N, 24°51′ E; altitude 24–90 m), the second-largest city in Lithuania, with a population of 302,875 (1 January 2023). The city covers 157 km2, of which 73.8 km2 is built-up area, with a population density of 2146 residents per km2. The total area of residential territories in Kaunas covers approximately 5020 hectares, accounting for about 33% of the city’s total area []. The total area of industrial territories is estimated at around 1600 hectares, accounting for about 10% of the city’s territory []. Kaunas has a well-developed transport infrastructure and lies at the crossroads of major national and international routes, with two international transport corridors, major highways and railways crossing the city, and an international airport located 14 km from the city center [].
Kaunas is characterized by a rapidly developing network that integrates pedestrian and cycling connections between residential districts and industrial zones []. The city’s strategic urban plan prioritizes active mobility and the development of green transport corridors to improve accessibility and reduce car dependency. By connecting peripheral residential areas with major industrial parks through newly developed pedestrian and cycling routes, Kaunas advances its strategic objectives of sustainable mobility and healthier, low-emission urban development []. Moreover, research indicates that the creation of connected pedestrian and cycling routes, together with the revitalization of public and green spaces, supports sustainable mobility and contributes to improved well-being among Kaunas residents []. The city is located at the confluence of Lithuania’s two largest rivers, the Nemunas and the Neris, and is bordered by their green slopes and surrounding forested areas. The total area covered by greenery in Kaunas reaches approximately 4736 hectares (30% of the city’s territory) []. The most significant are forest parks located in the peripheral parts of the city, while important green areas are also found in the central districts, particularly along the slopes of the Nemunas and Neris Rivers.
2.3. Measurements
During the first phase, all participants (N = 1086; aged 18–75 years) completed standardized questionnaires assessing demographic characteristics, health status, and perceptions of their residential environment. In the second phase, a subsample of participants aged 40 years and older (N = 95) took part in additional objective assessments, including physical activity monitoring using a wrist-worn accelerometer for seven consecutive days and direct health measurements (systolic and diastolic blood pressure, BMI, and waist circumference). All measurements were conducted by the researcher in accordance with standardized procedures. Participants attended individually scheduled sessions during which the measurements were performed, after which they received personal feedback and general health recommendations from a licensed physician based on their results.
Perceived infrastructure quality was evaluated using six items related to access to green spaces, pedestrian infrastructure, traffic safety, lighting, and air pollution, rated on a 7-point Likert scale (1 = strongly disagree, 7 = strongly agree). These items were aggregated into the Residential Environment Infrastructure Factor (REIF). The Cronbach’s alpha of the scale of infrastructural factors of the living environment was 0.799, indicating good reliability for the six-item scale. Objective health data included self-rated health, assessed by a standard single-item question (“In general, how would you rate your health?”) on Likert scale from 1 = excellent to 5 = very poor, consistent with previously validated and widely applied approaches to assessing self-rated health [,,]. Systolic and diastolic blood pressure were measured by a medical professional with participants seated, following a 5 min rest period. Three consecutive measurements were obtained at one-minute intervals, and the mean value was calculated for analysis. Waist circumference was assessed using a flexible, non-elastic tape placed midway between the lowest rib and the iliac crest, and height and weight were also recorded. Heart rate was measured using Xiaomi Mi Band 5 throughout the day and comprised active and resting measurements, taking measurements every minute, and the mean, minimum and maximum values were included for analysis. Body mass index (BMI) was calculated as weight in kilograms divided by height in meters squared (kg/m2), with obesity defined as BMI ≥ 30. Hypertension was classified based on ESC/ESH criteria []: reported diagnosis, medication use, or systolic ≥140 mmHg and/or diastolic ≥90 mmHg.
Physical activity was measured objectively using Xiaomi Mi Band 5 smart wristbands, which recorded step count, distance, calories burned, and heart rate. Participants wore the device continuously for seven full days, after which the findings were not only included in the study database but also discussed with the participants, and the recommendations were given by a medical professional.
Excluded from the study were participants who did not wear the Xiaomi Mi Band 5 smart wristbands for seven straight days or severely and impactfully limited their usual physical activity levels because of medical reasons (operation, trauma) or COVID-19 pandemic restrictions.
2.4. Statistical Analysis
Data analysis included descriptive statistics (means, standard deviations, frequencies) for all variables. Baseline characteristics between comparison groups were assessed using the chi-squared test. To examine the effects of physical activity and environmental perception on health outcomes, multiple linear regression models were constructed. Interaction terms were used to assess whether the impact of physical activity (weekly step count) on health outcomes varied across REIF levels. For this purpose, REIF scores were divided into tertiles (low, medium, high), which allowed the identification of potential non-linear interactions while maintaining statistical power. Tertiles were chosen over quartiles due to sample size constraints and interpretability. Each regression model was adjusted for age, sex, education, income, marital status, and smoking. Interaction effects were tested separately for each health outcome variable (self-rated health, BMI, sBP, dBP, HR).
Statistical significance was set at p < 0.05. All analyses were performed using SPSS version 29.0 (IBM Corp., Armonk, NY, USA).
3. Results
The study sample consisted of 95 participants, of whom 67.4% were female, and the mean age was 58.48 years (SD 10.48; range 40–75 years). Regarding education, 33.7% had completed secondary general education, 33.7% post-secondary non-tertiary education, and 32.6% held higher education degrees (Table 1).

Table 1.
Baseline characteristics of participants.
The spatial distribution of participants’ physical activity levels in relation to REIF categories across Kaunas city is presented in Figure 2. Higher physical activity levels tended to cluster in areas with higher self-perceived REIF scores, indicating that more favorable residential infrastructure may support greater engagement in daily walking.
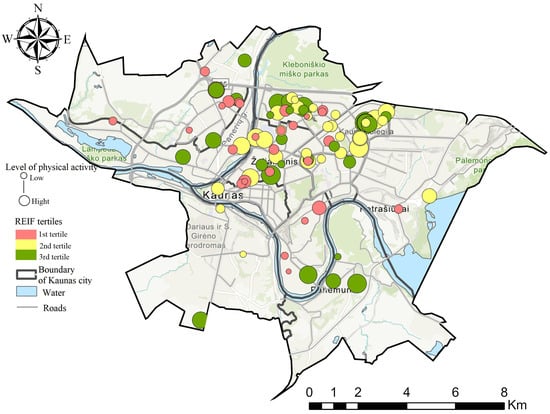
Figure 2.
Spatial distribution of physical activity levels and REIF scores among study participants in Kaunas city.
The mean systolic blood pressure (sBP) was 139.88 mmHg (SD 21.50; range 103–200), and the mean diastolic blood pressure (dBP) was 81.80 mmHg (SD 13.44; range 60–111). Mean waist circumference was 95.84 cm (SD 16.64; range 66–139), and the mean body mass index (BMI) was 28.55 kg/m2 (SD 5.86; range 19.27–46.44). Participants walked a mean of 43,184.64 steps per week (WS) (SD 22.519.75; range 6.794–98.068). The mean daily HR was 66.96 beats per minute (SD 8.35; range 53.71–85.71) (Table 2).
Table 2.
Descriptive statistics of participants’ health and physical activity indicators.
In order to identify the relationship between the environmental urban infrastructure factors (REIF) and health outcome indicators, an analysis was performed. The provided calculations were conducted (Table 3) to assess the association between the living environment infrastructure score and health outcomes. The results showed that more favorable health indicators were statistically significantly associated with better living environment conditions, reflected by higher scores in the REIF. It was found that in better living conditions, participants reported higher self-rated health levels and better blood pressure levels. The mean systolic blood pressure in the first tertile was 153.68 mmHg (SE 21.39), in the second—135.42 mmHg (SE 18.28), and in the third—130.84 mmHg (SE 18.19) (p < 0.001). The mean diastolic blood pressure values were 88.61 mmHg (SE 12.02), 79.24 mmHg (SE 14.52), and 77.71 mmHg (SE 11.16) (p = 0.002), respectively, indicating a lower risk of hypertension in more favorable living conditions. It was also found that the mean BMI significantly decreased as the REIF increased (p < 0.001). In the first tertile, the mean BMI was 31.72 kg/m2 (SE 5.98); in the second, it was 28.17 kg/m2 (SE 5.21); and in the third, it was 25.81 kg/m2 (SE 4.97), suggesting a lower risk of overweight or obesity in more favorable living environment conditions. The analysis of daily HR showed a significant correlation with the quality of the living environment (p < 0.001). In the first tertile, the mean HR was 74.01 beats/min (SE 7.46); in the second, it was 64.39 beats/min (SE 7.42); and in the third, it was 62.64 beats/min (SE 5.13), indicating better cardiovascular health in more favorable environmental conditions. Moreover, the WS significantly differed between the tertiles (p < 0.001), showing greater physical activity in better living conditions. In the first tertile, participants walked a mean of 27,885.45 steps per week (SE 13,515.99); in the second, they walked 46,866.24 steps (SE 20,656.79); and in the third, they walked 54,564.71 steps (SE 23,678.02). These data suggest that better living conditions may be associated with higher physical activity, which is important for improving and maintaining health and disease prevention.
Table 3.
The results of the univariate analysis of variance of the residential environment infrastructure factor and health outcome indicators.
These findings highlight the significance of living environment infrastructure in promoting residents’ health and well-being. Individuals living in more favorable environmental conditions demonstrated lower systolic and diastolic blood pressure, reduced BMI, and lower HR. Additionally, they engaged in higher physical activity, as evidenced by increased steps per week. These results indicate that well-designed urban environments can enhance health outcomes and promote physical activity, leading to better quality of life and well-being across different social and community settings. This, in turn, could have a favorable effect on sustainability by reducing reliance on motorized transport and decreasing energy use.
We used multiple linear regression analysis to examine the association between health outcomes, perceptions of the residential environment infrastructure, and physical activity (Table 4). The weekly number of steps (WS) walked was statistically significantly associated with all the evaluated health indicators. Higher physical activity was linked to better self-rated health (β = −0.02, p < 0.001), lower body mass index (BMI) (β = −0.11, p < 0.001), lower systolic (β = −0.52, p < 0.001) and diastolic (β = −0.30, p < 0.001) blood pressure, and a lower daily HR (β = −0.22, p < 0.001). These results suggest that higher physical activity is an important factor in maintaining better health. However, when analyzing the impact of the residential environment infrastructure factor on health outcomes, it was found that living in the more favorable infrastructure conditions (3rd tertile) was statistically significantly associated with better health (β = −0.52, p = 0.029), as well as lower systolic (β = −11.32, p = 0.011) and diastolic (β = −6.08, p = 0.045) blood pressure, and lower daily heart rate (β = −7.83, p < 0.001). A trend was also observed that a higher level of residential environment infrastructure is associated with a lower BMI, although this relationship was not statistically significant (β = −2.01, p = 0.120).
Table 4.
The relationship between health outcomes, residential environment infrastructure and physical activity.
These results suggest that both physical activity and more favorable REIF can have a positive effect on health indicators by reducing blood pressure, heart rate, and improving self-rated health. Statistically significant relationships between residential environment infrastructure and objectively assessed health outcomes indicate that infrastructure may have a real physiological impact on health, while subjective health assessments may be more influenced by individual psychological and social factors.
Table 5 presents the combined effect of REIF and WS on various health outcomes, including general health, BMI, sBP, dBP, and daily mean HR. A significant association was observed between higher REIF ratings combined with increased walking steps and better general health. Participants in the second and third terciles of REIF combined with WS demonstrated significantly better general health compared to those in the first tercile (β = −0.014, p = 0.003; β = −0.023, p < 0.001, respectively). BMI was also significantly lower among participants in higher REIF terciles combined with WS. The second and third terciles showed a negative association with BMI (β = −0.102, p < 0.001; β = −0.129, p < 0.001, respectively). Systolic blood pressure (sBP), diastolic blood pressure (dBP), and daily mean heart rate (HR) were all inversely associated with higher REIF ratings combined with WS. The most pronounced effects were observed in the second and third terciles, where reductions in sBP (β = −0.517, p < 0.001; β = −0.602, p < 0.001), dBP (β = −0.246, p < 0.001; β = −0.305, p < 0.001), and HR (β = −0.248, p < 0.001; β = −0.268, p < 0.001) were statistically significant. Although a weaker but significant association was noted for sBP (β = −0.307, p = 0.035) and HR (β = −0.113, p = 0.015) in the first tercile, the reduction in dBP was not statistically significant (β = −0.160, p = 0.106). These findings indicate that favorable residential environment infrastructure, combined with higher levels of physical activity, is associated with improved health outcomes, including general health, lower BMI, reduced blood pressure, and lower daily mean heart rate. These results underscore the need to consider environmental factors alongside physical activity to improve health outcomes and well-being across different social settings.
Table 5.
The combined effect of residential environment infrastructure and physical activity on health.
The interaction analysis between the Residential Environment Infrastructure Factor (REIF) and physical activity (weekly steps, WS) was performed to explore whether the impact of physical activity on health differs depending on residential infrastructure quality (Table 6). A statistically significant interaction was observed only for self-rated health. In the 2nd (β = −0.03, p = 0.032) and 3rd REIF tertiles (β = −0.04, p = 0.006), higher WS was associated with better self-rated health, suggesting that favorable residential infrastructure may enhance the perceived benefits of physical activity. No significant interactions were found for other objective health indicators, such as BMI, systolic and diastolic blood pressure, or daily heart rate (p > 0.05), although a borderline trend was observed for daily heart rate in the 3rd tertile (β = 0.142, p = 0.057).
Table 6.
The interaction relationship between health outcomes, residential environment infrastructure, and physical activity.
These findings suggest a potential modifying effect of residential infrastructure on the relationship between physical activity and subjective health, but the results do not provide strong evidence of broader synergistic effects across other health indicators. Thus, while better infrastructure may contribute to improved perception of health benefits from physical activity, further studies are needed to confirm these effects and clarify underlying mechanisms.
4. Discussion
This study aimed to address a key research gap: how the quality of residential urban infrastructure, as perceived by residents, interacts with objectively measured physical activity levels to influence both self-rated and physiological health indicators. While previous studies have examined links between environmental features and health outcomes, recent reviews highlight the need for more research combining perceived infrastructure indicators with objective physical activity data, particularly in mid-sized European cities [,].
Our findings indicate that individuals living in more favorable residential environments—characterized by improved pedestrian and cycling paths, green space access, and lower pollution perception—tended to report better self-rated health and engaged in higher levels of physical activity. This is in line with previous studies emphasizing the role of urban design in promoting healthy behavior [,]. As shown in Figure 2, higher physical activity levels clustered in areas with more favorable residential infrastructure, visually demonstrating the spatial link between the urban environment and health outcomes. Importantly, international evidence confirms that physical inactivity is strongly associated with increased blood pressure and adverse metabolic outcomes [], suggesting that our results reflect broader epidemiological patterns. Recent evidence highlights multiple pathways through which urban environments influence cardiometabolic health, emphasizing the need for supportive infrastructure [,,].
The observed associations can be explained by several physiological mechanisms. Regular walking and moderate activity improve vascular and autonomic regulation, contributing to lower blood pressure and better cardiovascular health. A notable finding is that self-rated health benefits of physical activity were evident only in supportive environments, suggesting that supportive infrastructure amplifies perceived health gains. A systematic review of studies in rural and urban areas highlights that built and natural environmental features remain strong correlates of adult physical activity worldwide []. This is consistent with the socio-ecological model, which emphasizes that health outcomes emerge from the interplay of individual behaviors and environmental context []. Structural equation modeling studies also demonstrate that urban infrastructure indirectly affects hypertension risk through behavioral mediators such as physical activity [].
Our study also supports the idea that physical activity may act as an intermediary mechanism linking urban infrastructure to health outcomes []. However, we also show that the effectiveness of physical activity may be context-dependent: participants in the lowest REIF tertile did not experience the same self-rated health benefits from similar activity levels. This may reflect how perceived comfort, accessibility, and safety influence both physical activity and health perception, as shown in recent studies [,,].
Our study also contributes to the emerging perspective of pedestrian-weighted exposure science, which highlights that walkability, vegetation coverage, and pollution mitigation may shape how activity translates into health outcomes []. By integrating subjective infrastructure perceptions into the REIF index, our approach provides a multidimensional tool for assessing urban health risks and planning needs at the neighborhood level. Daily mean heart rate was lower in supportive environments, suggesting tangible physiological benefits.
These findings are also in line with evidence from other Central and Eastern European cities, where rapid urbanization has frequently been accompanied by uneven infrastructural development [,]. This context underscores the need for region-specific policy measures to ensure that urban growth is aligned with health-promoting infrastructure.
Overall, our findings underscore that physical activity alone is insufficient; health benefits are amplified when the built environment supports accessibility, comfort, safety, and walkability through integrated urban planning and green infrastructure. Longitudinal studies suggest that investment in new transport infrastructure can promote active travel modes, which in turn may yield public health benefits []. This multidimensional approach is crucial for addressing cardiovascular risk factors, promoting well-being, and ensuring long-term sustainability of public health improvements.
5. Strengths and Limitations of the Study
A major strength of this study lies in the use of a mixed-methods approach, combining objective health and activity data with subjective environmental assessment in a real-world urban setting. The use of wearable devices provided robust daily step count and heart rate data, while the REIF allowed for localized, resident-informed infrastructure evaluation. Nevertheless, several limitations should be acknowledged. First, the study was limited to one city (Kaunas), which may restrict generalizability to other urban or rural settings. Second, objective physical activity data were only available for participants aged 40 years and older. This may limit how broadly we can apply the findings and introduce age-related bias. Third, while heart rate and step count were continuously monitored, blood pressure was measured only once, potentially limiting temporal sensitivity. Fourth, seasonality effects on physical activity were not accounted for, which could have influenced the observed step count patterns. Finally, physical activity was measured with a consumer-grade device, the Xiaomi Mi Band 5. While not a medical-grade tool, it has shown acceptable validity and reliability in everyday settings. This device provides an easily accessible, practical and cost-effective option for large-scale population studies.
In addition, the set of health indicators assessed in this study (blood pressure, BMI, heart rate, and self-rated health) provides only a partial picture of cardiometabolic health. Future research should incorporate more robust clinical measures, such as hypertension and diabetes prevalence, lipid profiles, and dietary behaviors, to allow a more comprehensive assessment of cardiovascular health. Although the study period overlapped with the COVID-19 pandemic, data collection was conducted before and after the strictest restrictions; nevertheless, the broader pandemic context may have influenced participants’ health perceptions and well-being.
We also did not analyze meteorological data, which may influence leisure time outdoor physical activity and could have confounded our results. Future studies should account for seasonal and weather-related variation when assessing associations between physical activity and health outcomes. Moreover, continuous monitoring of cardiovascular indicators, consideration of broader geographic sampling, and the involvement of long-term, engaged participants could further strengthen citizen-science approaches and improve data quality.
6. Conclusions
This study aimed to investigate how perceived residential infrastructure quality (REIF) interacts with objectively measured physical activity to influence cardiovascular and self-rated health outcomes. The findings revealed that individuals living in more favorable residential environments engaged in higher levels of physical activity and exhibited lower blood pressure, heart rate, BMI, and waist circumference, as well as better self-rated health. These results provide novel evidence that perceived residential infrastructure conditions may influence the health impact of physical activity and underscore the need for evidence-based urban and public health policies that integrate environmental design with disease prevention strategies to promote health equity and sustainable city development.
Moreover, healthcare professionals could gain important insights by understanding how patients’ locations and their surrounding urban environments influence the likelihood of achieving the recommended daily step count, thereby reducing the risk and impact of cardiometabolic diseases (e.g., lower BP, BMI, HR, and waist circumference). Finally, in the era of artificial intelligence and its rapidly expanding applications across multiple fields, this data could be utilized for advanced calculations and predictive modeling, further enhancing this study’s relevance, scientific utility, and impact. These findings may serve as a valuable starting point for further, more expansive research that would not only benefit policymakers but also support citizens in striving for greener and more health-promoting urban planning.
However, the study has several limitations, including its focus on one city, the restricted age group, and the lack of meteorological and air pollution data. These factors should be considered when interpreting the findings, and future studies are needed to address them.
Author Contributions
Conceptualization and writing, A.R. and S.A.; methodology and formal analysis, J.V.; visualization, A.D. All authors have read and agreed to the published version of the manuscript.
Funding
This project has received funding from the European Union’s Horizon 2020 research and innovation program under grant agreement No. 824484.
Institutional Review Board Statement
The study was conducted according to the guidelines of the Declaration of Helsinki and approved by the Kaunas Regional Committee for Biomedical Research Ethics (BE−2−51. 10 June 2019).
Informed Consent Statement
Informed consent was obtained from all subjects involved in the study.
Data Availability Statement
The data supporting the findings of this study are not publicly available due to privacy and confidentiality concerns related to the participants. Data may be made available from the corresponding author upon reasonable request and with permission from the Kaunas Regional Committee for Biomedical Research Ethics.
Acknowledgments
We thank our CitieS-Health project group. We would like to thank all the study participants for their time and collaboration.
Conflicts of Interest
The authors declare no conflicts of interest.
Abbreviations
The following abbreviations are used in this manuscript:
| BMI | Body Mass Index |
| dBP | Diastolic Blood Pressure |
| HR | Heart Rate |
| REIF | Residential Environment Infrastructure Factor |
| sBP | Systolic Blood Pressure |
| SD | Standard Deviation |
| SE | Standard Error |
| WC | Waist Circumference |
| WS | Weekly Steps |
References
- Giles-Corti, B.; Vernez-Moudon, A.; Reis, R.; Turrell, G.; Dannenberg, A.L.; Badland, H.; Foster, S.; Lowe, M.; Sallis, J.F.; Stevenson, M.; et al. City planning and population health: A global challenge. Lancet 2016, 388, 2912–2924. [Google Scholar] [CrossRef]
- Sallis, J.F.; Cerin, E.; Conway, T.L.; Adams, M.A.; Frank, L.D.; Pratt, M.; Salvo, D.; Schipperijn, J.; Smith, G.; Cain, K.L.; et al. Physical activity in relation to urban environments in 14 cities worldwide: A cross-sectional study. Lancet 2016, 387, 2207–2217. [Google Scholar] [CrossRef]
- Mortamais, M.; Gutierrez, L.A.; de Hoogh, K.; Chen, J.; Vienneau, D.; Carrière, I.; Letellier, N.; Helmer, C.; Gabelle, A.; Mura, T.; et al. Long-term exposure to ambient air pollution and risk of dementia: Results of the prospective Three-City Study. Environ. Int. 2021, 148, 106376. [Google Scholar] [CrossRef]
- Nieuwenhuijsen, M.J.; Khreis, H.; Verlinghieri, E.; Mueller, N.; Rojas-Rueda, D. Participatory quantitative health impact assessment of urban and transport planning in cities: A review and research needs. Environ. Int. 2017, 103, 61–72. [Google Scholar] [CrossRef]
- van den Berg, M.; Wendel-Vos, W.; van Poppel, M.; Kemper, H.; van Mechelen, W.; Maas, J. Health benefits of green spaces in the living environment: A systematic review of epidemiological studies. Urban For. Urban Green. 2015, 14, 806–816. [Google Scholar] [CrossRef]
- Pontin, F.L.; Jenneson, V.L.; Morris, M.A.; Clarke, G.P.; Lomax, N.M. Objectively measuring the association between the built environment and physical activity: A systematic review and reporting framework. Int. J. Behav. Nutr. Phys. Act. 2022, 19, 119. [Google Scholar] [CrossRef]
- McCormack, G.R.; Patterson, M.; Frehlich, L.; Lorenzetti, D.L. The association between the built environment and intervention-facilitated physical activity: A narrative systematic review. Int. J. Behav. Nutr. Phys. Act. 2022, 19, 86. [Google Scholar] [CrossRef] [PubMed]
- Cimmino, G.; Natale, F.; Alfieri, R.; Cante, L.; Covino, S.; Franzese, R.; Limatola, M.; Marotta, L.; Molinari, R.; Mollo, N.; et al. Non-Conventional Risk Factors: “Fact” or “Fake” in Cardiovascular Disease Prevention? Biomedicines 2023, 11, 2353. [Google Scholar] [CrossRef]
- Rissardi, G.d.G.L.; Cipullo, J.P.; Moreira, G.C.; Ciorlia, L.A.S.; Cesarino, C.B.; Junior, L.T.G.; Zanesco, A.; Vilela-Martin, J.F. Prevalence of Physical Inactivity and its Effects on Blood Pressure and Metabolic Parameters in a Brazilian Urban Population. Int. J. Cardiovasc. Sci. 2020, 33, 594–602. [Google Scholar] [CrossRef]
- Dedele, A.; Miškinyte, A.; Andrušaityte, S.; Nemaniūte-Gužiene, J. Seasonality of physical activity and its association with socioeconomic and health factors among urban-dwelling adults of Kaunas, Lithuania. BMC Public Health 2019, 19, 1067. [Google Scholar] [CrossRef]
- Grazuleviciene, R.; Andrusaityte, S.; Grazulevicius, T.; Dedele, A. Neighborhood Social and Built Environment and Disparities in the Risk of Hypertension: A Cross-Sectional Study. Int. J. Environ. Res. Public Health 2020, 17, 7696. [Google Scholar] [CrossRef]
- Zhang, Y.; Koene, M.; Reijneveld, S.A.; Tuinstra, J.; Broekhuis, M.; van der Spek, S.; Wagenaar, C. The impact of interventions in the built environment on physical activity levels: A systematic umbrella review. Int. J. Behav. Nutr. Phys. Act. 2022, 19, 156. [Google Scholar] [CrossRef]
- Jabbar, M.; Yusoff, M.M.; Shafie, A. Assessing the role of urban green spaces for human well-being: A systematic review. GeoJournal 2022, 87, 4405–4423. [Google Scholar] [CrossRef]
- Guo, Q. Impact of the Natural Environment on Individuals’ Psychological Well-being. J. Educ. Humanit. Soc. Sci. 2024, 26, 747–754. [Google Scholar] [CrossRef]
- Panter, J.; Heinen, E.; Mackett, R.; Ogilvie, D. Impact of New Transport Infrastructure on Walking, Cycling, and Physical Activity. Am. J. Prev. Med. 2016, 50, e45–e53. [Google Scholar] [CrossRef]
- Tamosiunas, A.; Grazuleviciene, R.; Luksiene, D.; Dedele, A.; Reklaitiene, R.; Baceviciene, M.; Vencloviene, J.; Bernotiene, G.; Radisauskas, R.; Malinauskiene, V.; et al. Accessibility and use of urban green spaces, and cardiovascular health: Findings from a Kaunas cohort study. Environ. Health 2014, 13, 20. [Google Scholar] [CrossRef] [PubMed]
- Casado-Robles, C.; Mayorga-Vega, D.; Guijarro-Romero, S.; Viciana, J. Validity of the Xiaomi Mi Band 2, 3, 4 and 5 Wristbands for Assessing Physical Activity in 12-to-18-Year-Old Adolescents under Unstructured Free-Living Conditions. Fit-Person Study. J. Sports Sci. Med. 2023, 22, 196–211. [Google Scholar] [CrossRef]
- Jachymek, M.; Jachymek, M.T.; Kiedrowicz, R.M.; Kaźmierczak, J.; Płońska-Gościniak, E.; Peregud-Pogorzelska, M. Wristbands in Home-Based Rehabilitation—Validation of Heart Rate Measurement. Sensors 2021, 22, 60. [Google Scholar] [CrossRef]
- Land Bank of the Republic of Lithuania. LIETUVOS RESPUBLIKOS ŽEMĖS FONDAS; National Land Agency of Ministry of Environment, National Agency Land Data Center: Vilnius, Lithuania, 2024; pp. 1–57.
- Ramanauskas, E.; Unas Bukantis, A.; Dringelis, L.; Kaveckis, G.; Jonkutė-Vilkė, G.E. Urban Environment and Structure of Lithuanian Cities: Their Assessment in the Context of Climate Change and Other Potential Threats. Land 2025, 14, 1759. [Google Scholar] [CrossRef]
- Zaleckis, K.; Matijošaitiene, I. Spatial structure of Kaunas and its influence on security in public spaces and green recreational areas. J. Archit. Urban. 2012, 36, 272–282. [Google Scholar] [CrossRef]
- Zagorskas, J.; Turskis, Z. Enhancing Sustainable Mobility: Evaluating New Bicycle and Pedestrian Links to Car-Oriented Industrial Parks with ARAS-G MCDM Approach. Sustainability 2024, 16, 2994. [Google Scholar] [CrossRef]
- Mačikūnaitė, A.; Kamičaitytė, J. Multicultural needs and the perception of central public spaces in major Lithuanian cities. Spatium 2022, 47, 52–63. [Google Scholar] [CrossRef]
- Reinwarth, A.C.; Wicke, F.S.; Rückert, K.K.; Schattenberg, J.M.; Tüscher, O.; Wild, P.S.; Münzel, T.; König, J.; Lackner, K.J.; Pfeiffer, N.; et al. Change of self-rated physical health predicts mortality in aging individuals: Results of a population-based cohort study. Arch. Public Health 2024, 82, 130. [Google Scholar] [CrossRef]
- Ganna, A.; Ingelsson, E. 5 year mortality predictors in 498 103 UK Biobank participants: A prospective population-based study. Lancet 2015, 386, 533–540. [Google Scholar] [CrossRef]
- Andresen, E.M.; Catlin, T.K.; Wyrwich, K.W.; Jackson-Thompson, J. Retest reliability of surveillance questions on health related quality of life. J. Epidemiol. Community Health 2003, 57, 339. [Google Scholar] [CrossRef]
- Williams, B.; Mancia, G.; Spiering, W.; Rosei, E.A.; Azizi, M.; Burnier, M.; Clement, D.L.; Coca, A.; De Simone, G.; Dominiczak, A.; et al. 2018 ESC/ESH Guidelines for the management of arterial hypertension. Eur. Heart J. 2018, 39, 3021–3104, Erratum in Eur. Heart J. 2019, 40, 475. [Google Scholar] [CrossRef]
- Christiana, R.W.; Bouldin, E.D.; Battista, R.A. Active living environments mediate rural and non-rural differences in physical activity, active transportation, and screen time among adolescents. Prev. Med. Rep. 2021, 23, 101422. [Google Scholar] [CrossRef]
- Zhang, X.; Warner, M.E. Linking Urban Planning, Community Environment, and Physical Activity: A Socio-Ecological Approach. Int. J. Environ. Res. Public Health 2023, 20, 2944. [Google Scholar] [CrossRef] [PubMed]
- Liang, J.; Deng, S.; Yang, H.; Zhu, S.; Zheng, R. Spatiotemporal effects of urban micro-scale built environment on cardiovascular diseases. Sci. Rep. 2025, 15, 17193. [Google Scholar] [CrossRef] [PubMed]
- Zhao, W.; Li, J.; Li, Y.; Xu, Y.; Liu, P. The Role of Urban Built Environment in Enhancing Cardiovascular Health in Chinese Cities: A Systematic Review. Buildings 2025, 15, 3364. [Google Scholar] [CrossRef]
- Rajagopalan, S.; Vergara-Martel, A.; Zhong, J.; Khraishah, H.; Kosiborod, M.; Neeland, I.J.; Dazard, J.E.; Chen, Z.; Munzel, T.; Brook, R.D.; et al. The Urban Environment and Cardiometabolic Health. Circulation 2024, 149, 1298–1314. [Google Scholar] [CrossRef]
- Gu, K.; Jing, Y.; Tang, J.; Jia, X.; Zhang, X.; Wang, B. Hypertension risk pathways in urban built environment: The case of Yuhui District, Bengbu City, China. Front. Public Health 2024, 12, 1443416. [Google Scholar] [CrossRef]
- Frank, L.D.; Iroz-Elardo, N.; MacLeod, K.E.; Hong, A. Pathways from built environment to health: A conceptual framework linking behavior and exposure-based impacts. J. Transp. Health 2019, 12, 319–335. [Google Scholar] [CrossRef]
- Bojorquez, I.; De Lourdes Romo-Aguilar, M.; Ojeda-Revah, L.; Tena, F.; Lara-Valencia, F.; García, H.; Díaz, R.; Aranda, P. Public spaces and physical activity in adults: Insights from a mixed-methods study. Cad. Saude Publica 2021, 37, e00028720. [Google Scholar] [CrossRef]
- Harani, A.R.; Atmodiwirjo, P.; Yatmo, Y.A.; Riskiyanto, R. The existence of a shortcut as an urban space system to support physic and mental health. IOP Conf. Ser. Earth Environ. Sci. 2021, 623, 012041. [Google Scholar] [CrossRef]
- Jiang, F.; Ma, J. Graph-based machine learning for high-resolution assessment of pedestrian-weighted exposure to air pollution. Resour. Environ. Sustain. 2025, 20, 100219. [Google Scholar] [CrossRef]
Disclaimer/Publisher’s Note: The statements, opinions and data contained in all publications are solely those of the individual author(s) and contributor(s) and not of MDPI and/or the editor(s). MDPI and/or the editor(s) disclaim responsibility for any injury to people or property resulting from any ideas, methods, instructions or products referred to in the content. |
© 2025 by the authors. Licensee MDPI, Basel, Switzerland. This article is an open access article distributed under the terms and conditions of the Creative Commons Attribution (CC BY) license (https://creativecommons.org/licenses/by/4.0/).