Abstract
Sustainable development requires manufacturers to deliver products that are not only of good quality but also environmentally friendly. The materials used play a crucial role in product manufacturing. They not only directly determine quality but also influence the environment throughout the product’s life cycle. Therefore, the aim was to develop an innovative approach based on the modelling of the relationship between materials and product quality within the framework of the sustainable design of alternative product solutions. The model framework includes selected elements of Quality Functional Development (QFD) and the first stage of life cycle assessment (LCA), namely, material acquisition and extraction. Its novelty lies in supporting the modelling process with life cycle data on materials characterised by their environmental burden. This modelling is based on their potential negative environment impact. Using this foundation, it becomes possible to consider alternative design solutions in terms of both quality (i.e., fulfilling customer satisfaction during use) and environmental performance (i.e., reducing the negative impact throughout the life cycle). The proposed modelling process was also tested, demonstrating its effectiveness in the material analysis of products. The solution can be applied to any material, and, with minor modifications, adapted to various product types.
1. Introduction
There are types of materials and raw materials that are essential in products, and their acquisition is difficult [1,2]. They are often used to produce new products, including those that can significantly modify existing products. These modifications usually lead to an improvement in quality. However, in the era of sustainable development, design and production activities are increasingly focused on the use of new, environmentally friendly materials [3,4,5]. Despite this, the search for materials that simultaneously consider quality and environmental aspects remains an open area of research [6,7]. Most techniques have been observed not to support decision making related to modifying product quality while taking into account changes in materials and their environmental impact [8,9,10,11]. Additionally, the lack of specific quality and material indicators makes it difficult to develop efficient product structures and functions in the context of seeking favourable quality and material solutions [12,13,14].
For example, the authors of [6] analysed potential materials within the framework of sustainable product development, taking into account material quality, environmental impact, and costs. They used a three-dimensional analysis technique within a mathematical model. The authors of [15] explored ways to increase the quality of products made with polyethylene terephthalate (PET). As part of their analysis, they also investigated possibilities for achieving minimal environmental pollution while maintaining product quality. In turn, [16] examined secondary semi-finished products from wood fibres, which were processed using a dry-type rotary cutting mill. These materials are used in finished products for various purposes. The quality of the wood fibres was evaluated under different processing conditions, as was the impact of their grinding on the natural environment. Another example is the work of the authors of [17], who developed a process for manufacturing a matrix used in the production of arc additives with cold metal. The aim was to minimise hydrogen porosity and refine the columnar grains, which contribute to environmental burdens, while also improving material quality by enhancing the physical properties of the deposition wall. The quality and environmental issues of materials used in products were also addressed in [18], which focused on the mechanical recycling of polymers. The study analysed the possibility of reducing pollution by ensuring environmentally friendly waste disposal practices, including material saving. The main problem identified was the presence of pollutants in both the collection and mechanical sorting of waste that negatively affected the quality of the recycled product, resulting in low-quality secondary materials. Meanwhile, the authors of [19] studied the processing of hard coal, one of the main stages of mineral resource management. This process supports the adjustment of product quality parameters at various stages. Clean coal technologies were considered, including quality adaptations of coal products with respect to environmental impact factor. The authors of [12] proposed an approach to quality and material analysis of products in which a circularity index for plastic was developed. This approach was based on the quality of recycled polymers taking into account their environmental impact. On the other hand, the authors of [20] analysed the mechanical recycling of concrete made from high-quality aggregate. They also considered the environmental impact, including the potential to reduce the need for transporting building materials in urban areas. Subsequently, the authors of [21] analysed the effect of irradiation time and microwave power level on the drying kinetics in wood processing. Compared with the traditional drying process, microwave drying resulted in better quality of the final product and additional environmental benefits such as energy savings and shorter processing time.
There remains a lack of clear research that considers the relationships between different materials and their direct impact on both the environment and the quality of products and their prototypes. Although previous studies have addressed quality, environmental, and sometimes cost aspects, these have not been considered within a coherent framework based on modelling these factors in relation to developing the most beneficial product solutions. In the case under consideration, “most beneficial” is understood as environmentally friendly throughout the product’s life cycle and satisfactory to customers during use.
Therefore, the aim of this study was to develop a model supporting the creation and analysis of the relationship between materials and quality towards the sustainable design of alternative product solutions. The model was developed in ten main stages, illustrated, and tested.
The novelty of the presented model is demonstrated by means of a compilation of selected works that concern a similar research area, as presented in Table 1.

Table 1.
Analysis of the literature on the subject and novelty of the research.
The novelty lies in supporting the modelling process with materials based on data from the product life cycle (material acquisition and extraction phase) characterised by the level of environmental burden. This modelling is carried out based on the quality criteria of the final product, from which the key ones are selected in terms of their negative impact on the natural environment. On this basis, it is possible to consider alternative design solutions in terms of both quality (ensuring customer satisfaction in use) and environmental performance (limiting the negative environmental impact throughout the life cycle). The originality of this model lies in its integration with the Quality Function Deployment (QFD) method [29], which has not been previously adapted in this manner. Additionally, aspects of life cycle assessment (LCA), according to ISO 14040 [30], are incorporated into the model, consistent with the concept of data modelling in the proposed approach.
Section 1 presents the introduction, literature review, and the novelty of the study. Section 2 outlines the model in a synthetic and general form, allowing its application to any product. Section 3 illustrates and tests the model on a tyre used in light passenger cars. Section 4 offers a discussion covering the model’s novelty in relation to the QFD method and LCA method including its advantages, limitations, and directions for future research.
2. Development of Model: Concept and General Presentation with Description
The framework of the model supporting the creation and analysis of the relationship between materials and product quality includes elements of the QFD method (Quality Functional Development, or House of Quality, HoQ) [31] and the first stage of the product life cycle assessment (LCA), i.e., material acquisition and extraction [22,32].
The QFD method is considered one of the most popular techniques for transforming the voice of customers (VoCs) into the technical language of product design. It involves gathering customer requirements, considering product quality criteria, and defining their equivalents from the designer’s perspective. Correlations and interactions between customer and designer criteria are identified, which then guide product development by prioritising the changes that are most significant to customers, as described in [33,34,35].
In turn, the LCA method is the fundamental approach for assessing the environmental impact of a product or system. It is based on the ISO 14040/44 [30] standards and involves defining the goal and scope, conducting an inventory analysis, assessing the impact, and interpreting the results. LCA typically follows a “cradle to grave” approach, covering material acquisition and extraction, production, use, and end-of-life stages. This method allows for estimating key environmental burdens over the product’s life cycle [36,37].
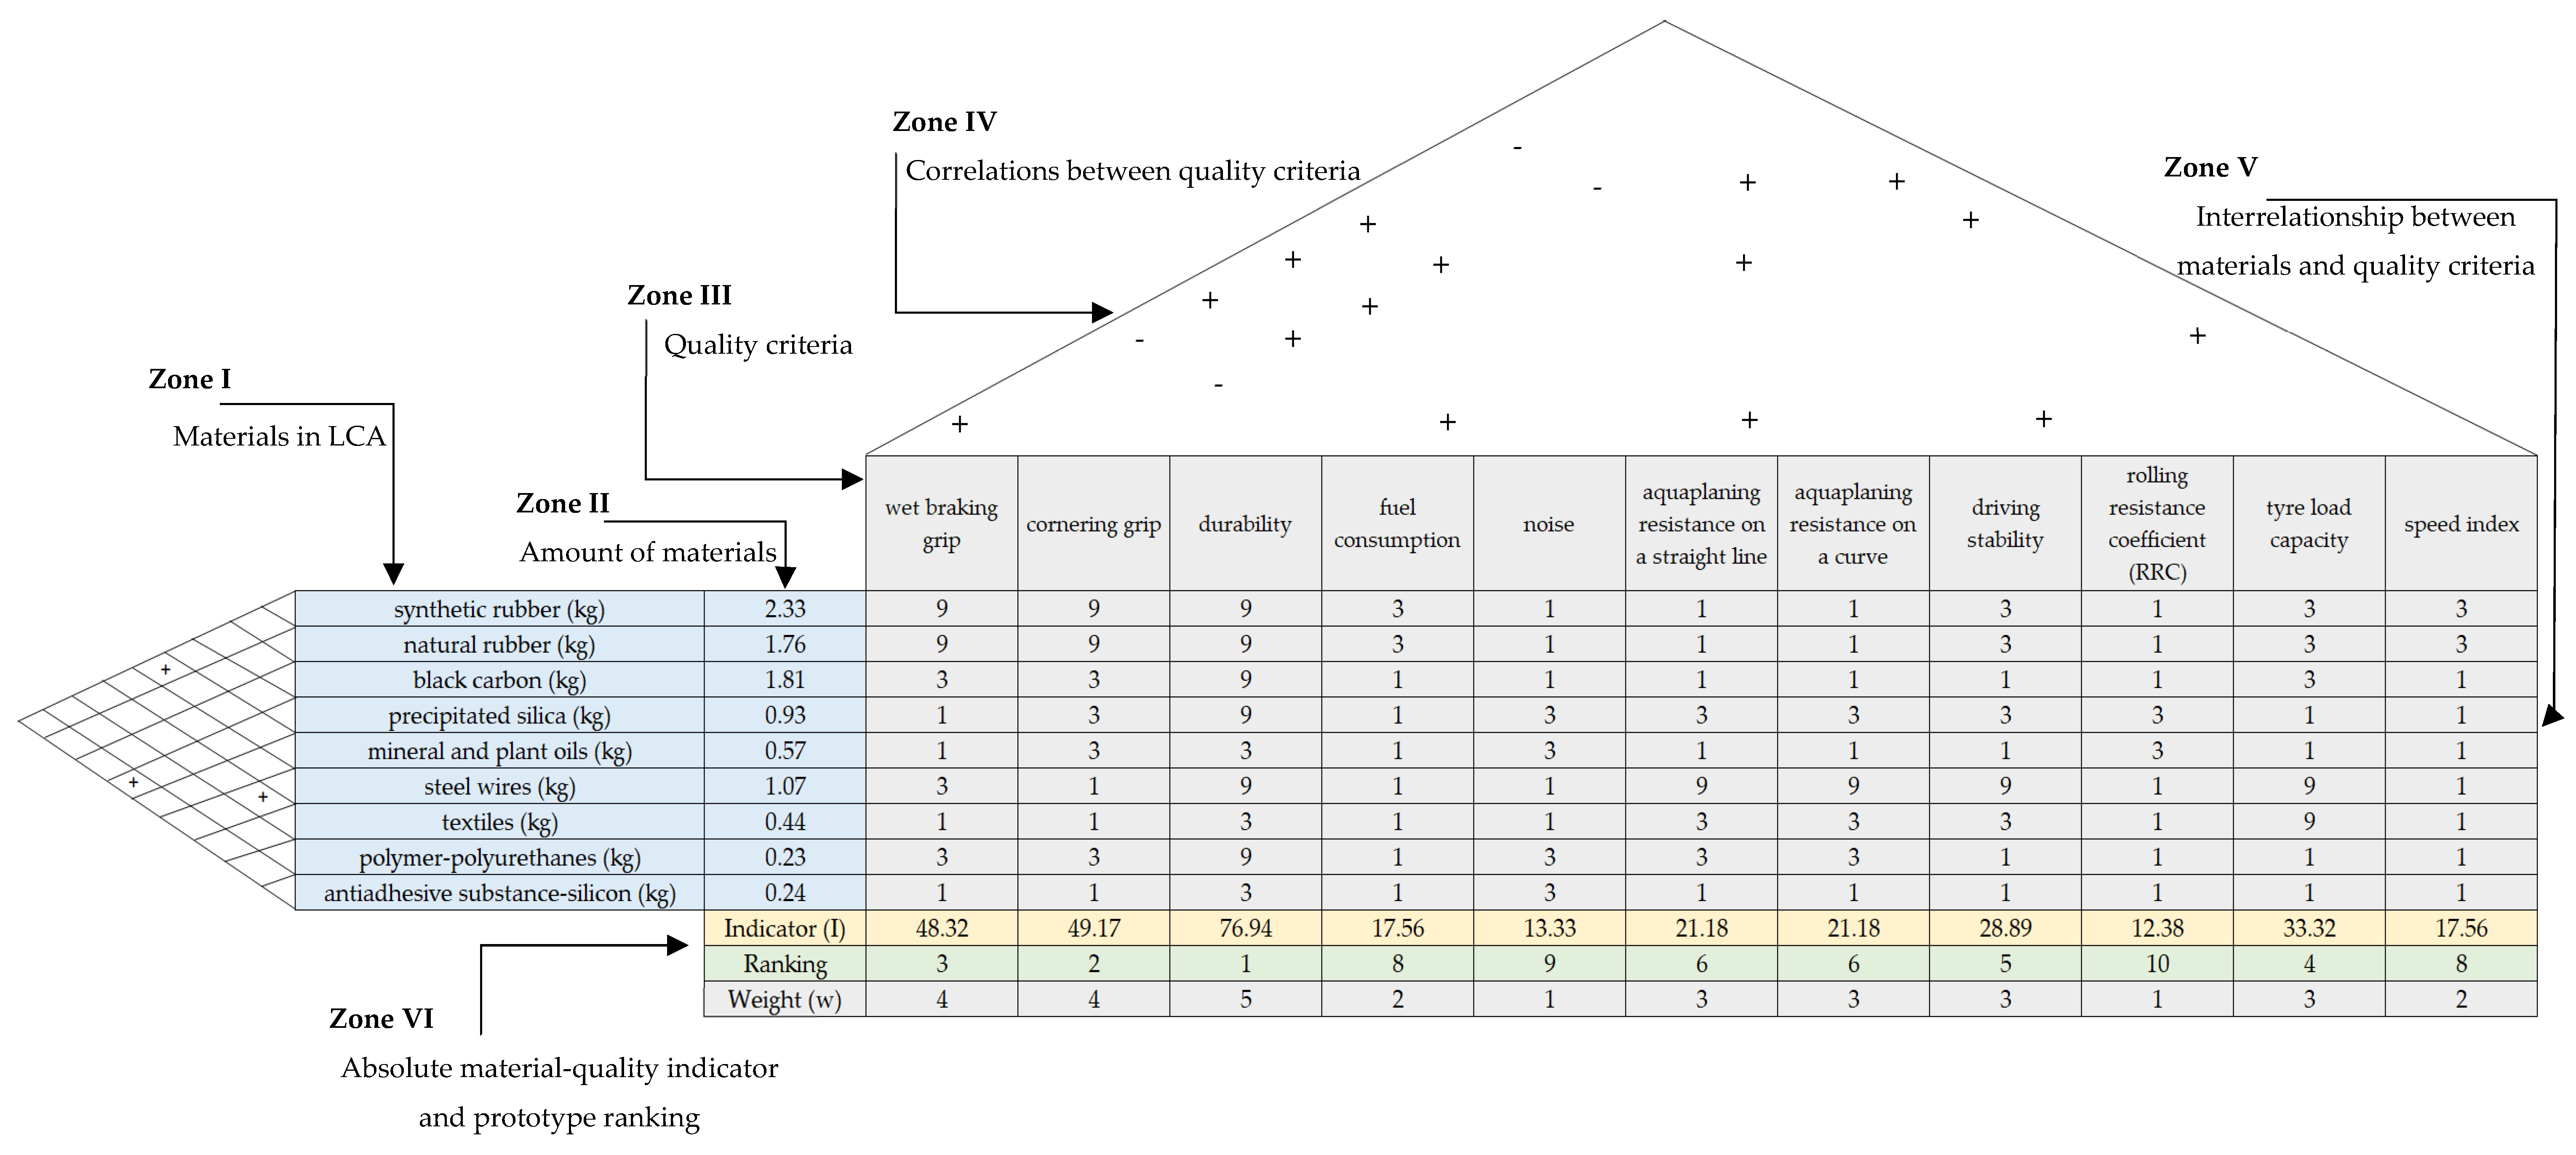
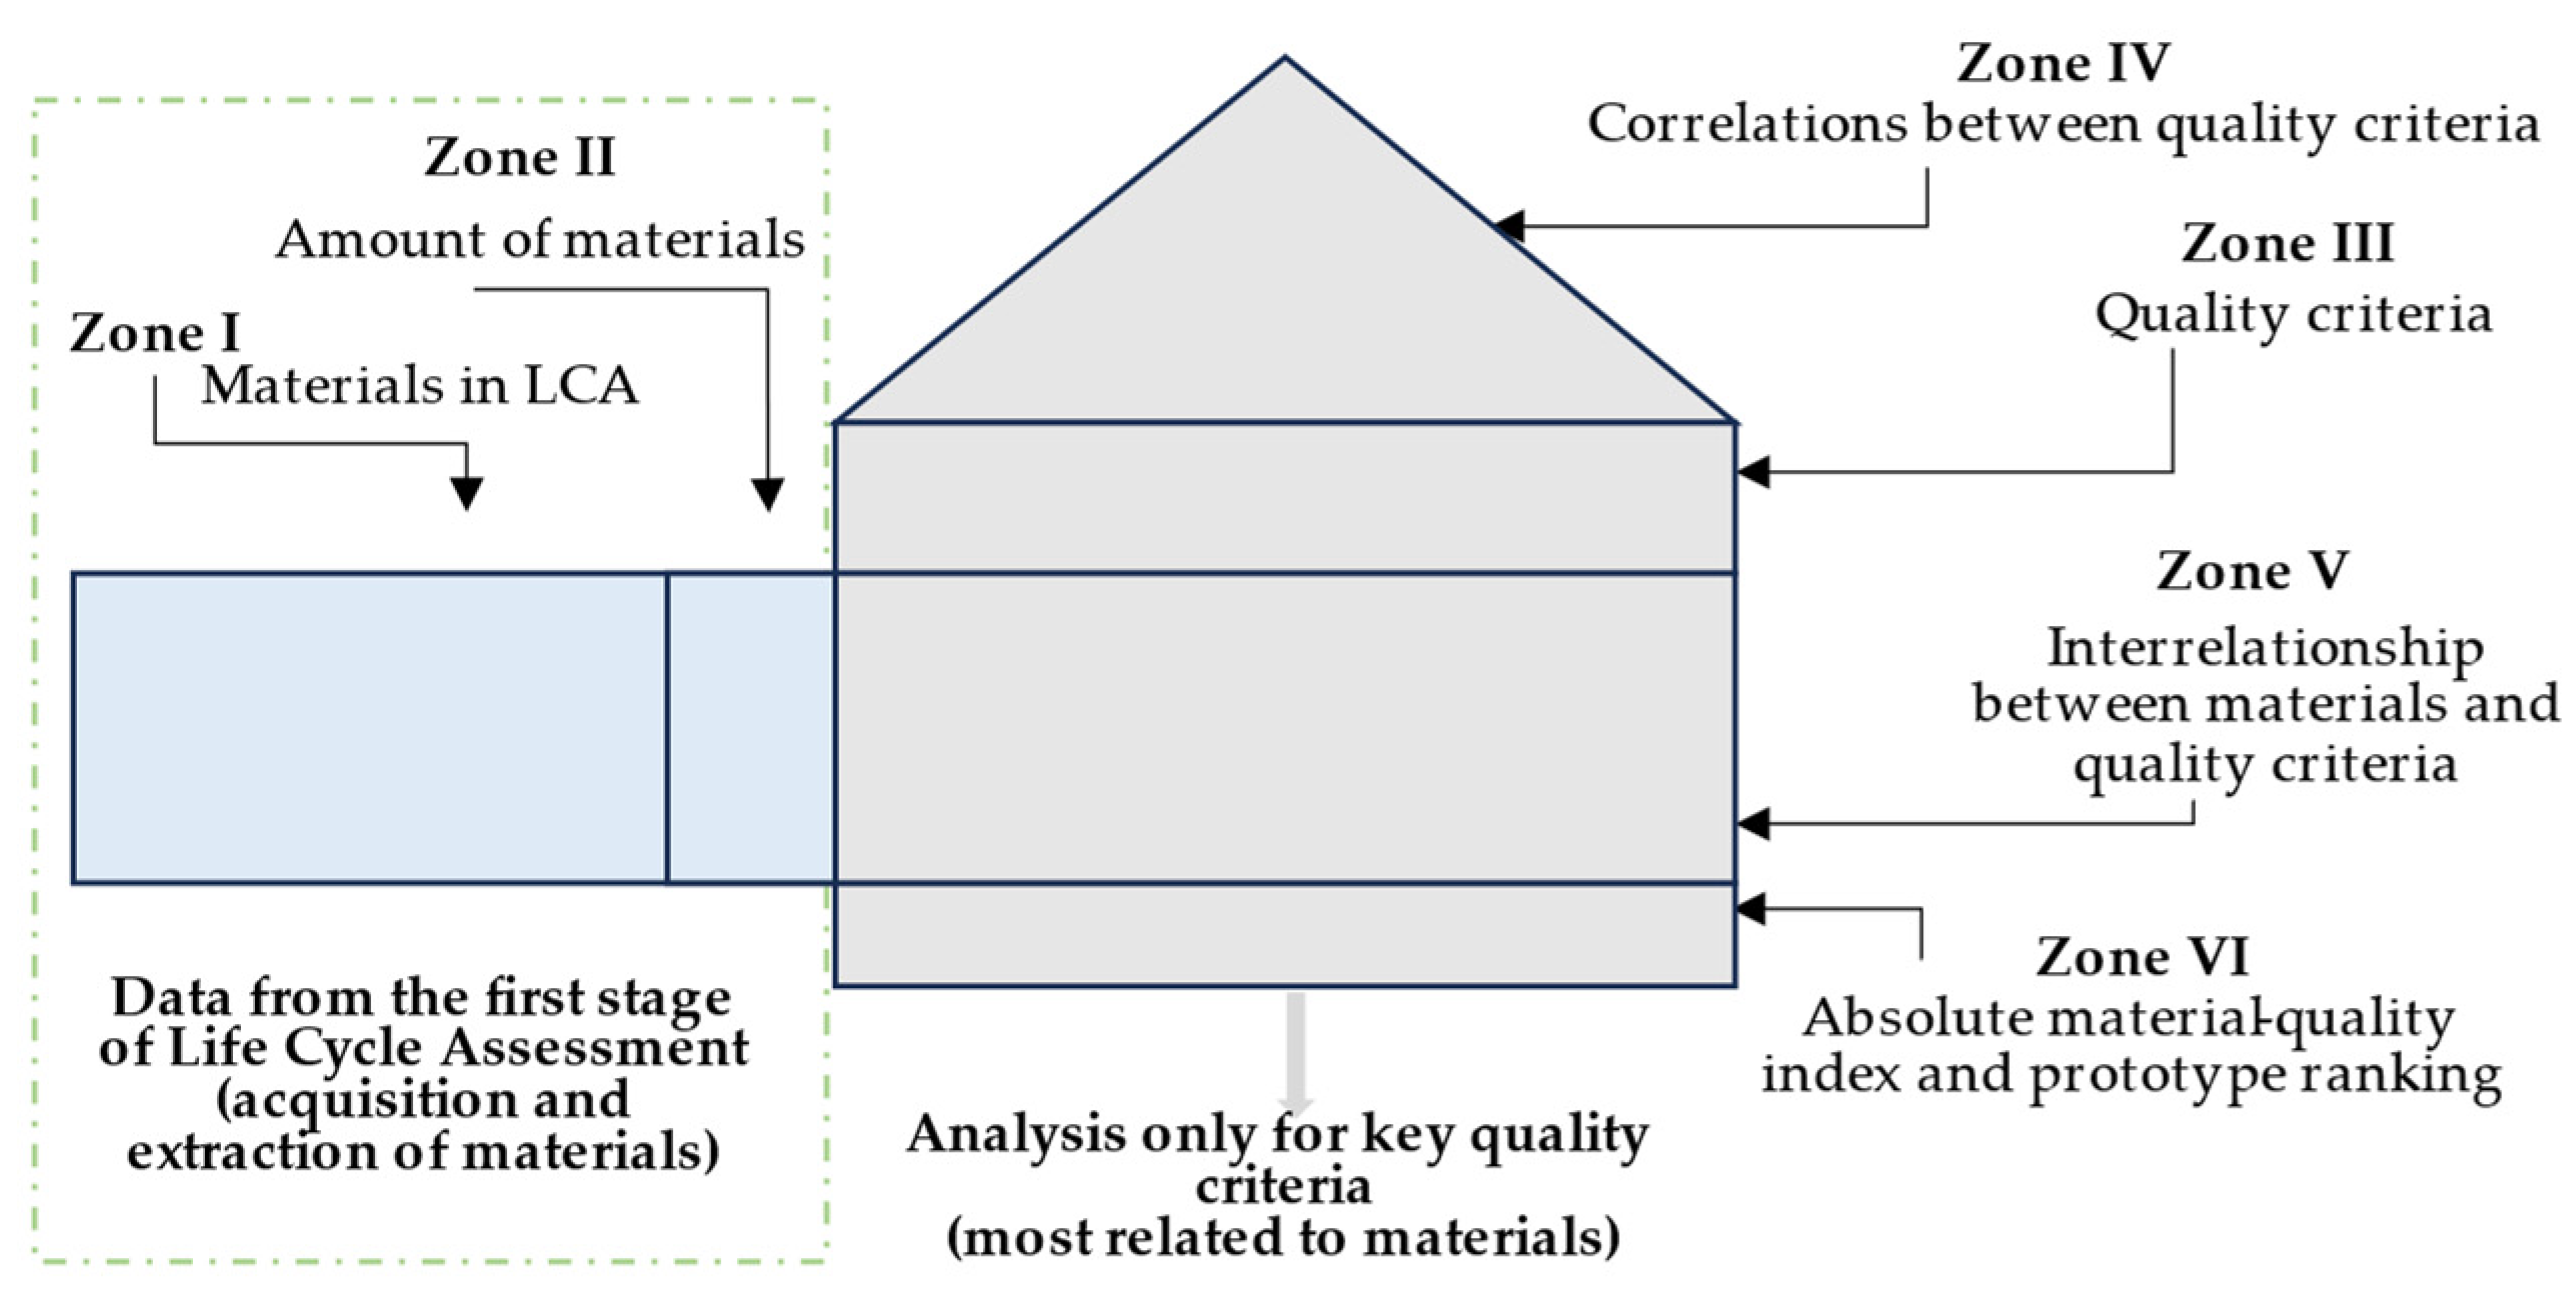
It was assumed that the results from selected stages of the model would be incorporated into the House of Quality template [38]. To achieve this, the HoQ was modified—specifically, customer-specified quality criteria were replaced with material-related criteria from the first phase of the product life cycle. The weights (importance assessments) of the quality criteria were substituted with values representing the amount of material used during the life cycle. The remaining modifications are shown in Figure 1.
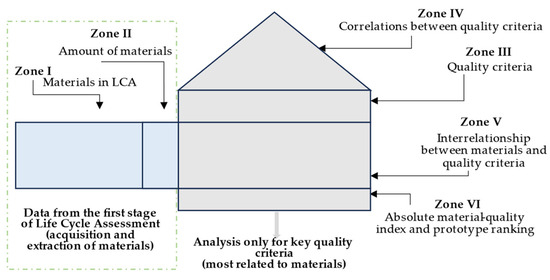
Figure 1.
General concept based on the framework of the QFD method to develop the model that supports the creation and analysis of the relationship between materials and quality.
The concept of the proposed model is to select important materials (included in the LCA) that are acquired and processed during the product life cycle. The quantities of these materials are analysed in terms of their environmental burden in the LCA. Then, the product’s quality criteria are identified. Correlations between quality criteria are determined, supporting decision making in later stages of the model. Interactions between product materials and quality criteria are also established. A ranking is developed for the quality criteria that have the greatest negative environmental impact in the product life cycle. Based on this, alternative product solutions are developed and analysed in terms of quality. Among them, the most advantageous solutions are selected.
The characteristics of the proposed model, including the process of integrating HoQ, are described across its main stages.
- Selection of the product for testing. The product is optional and is selected based on the needs of the entity using the model. It may be in the development or maturity phase, newly designed, or require improvements. Market research, observations, or business development goals may guide the selection. The chosen product is treated as a reference, representing a generalisation of products with similar functions.
- Defining the functional unit and system boundaries. The functional unit quantifies the product’s function, allowing for data normalisation and comparison. It is defined using international metric units [39]. From example, a unit could be one product item or its weight. System boundaries refer to the analysed inputs and outputs, including environmental loads or analysis scope. A “cradle to grave” approach is assumed, covering material acquisition, production, use, and end of life. Temporal and spatial boundaries may be defined depending on data availability [39,40].
- Defining the criteria for the material of the product. According to the defined system boundaries (in the concept “from cradle to grave”), materials used in the product are identified [41,42]. The type and quantity of materials depend on the research subject. Material selection and characterisation are performed by expert teams (for example, designers or sustainability specialists) [22,43], potentially with support from LCA databases, e.g., OpenLCA. Each material should be described by a value (parameter) relative to the functional unit.
- Definition of quality criteria. The criteria that influence customer satisfaction during use are identified [44]. These criteria form the basis for evaluating product quality and are selected by expert teams, e.g., based on product catalogues. Typically, about 10 criteria are selected (or more for complex products) [45]. Quality criteria must be quantified using international metric units.
- Determining the correlation between quality criteria. Positive (+), negative (−), and neutral (no mark) correlations are identified [46]. A positive correlation means improving one criterion does not compromise another; a negative correlation implies trade-offs. No correlation indicates independence [33,34]. This supports the product development process in later model stages.
- Determination of mutual influences between material and product quality criteria. The influence of quality criteria on the environmental burdens associated with product materials is assessed [47]. For instance, achieving a certain quality may require more of a specific material, e.g., a plastic product element will have an influence on the amount of plastic used (being one of the materials). Using HoQ principles, these interactions are evaluated by experts using a rating scale: weak (—rating 1), medium (O—rating 3), strong (∎—rating 9), or no influence (no markings—rating 0) [29,33,35].
- Estimation of the material change significance index (I) and ranking development. The significance index (I) combines the normalised environmental burden (b) of materials with the interaction rating (o) between materials and quality criteria [48]. In this case, it is the values of the sum of the products of the material parameters with the assessments of their dependencies on the quality criteria (1):
A ranking is developed based on the I indicator. The higher the I value, the greater the criterion’s impact on material-related environmental burden. The classification supports identifying solutions that increase customer satisfaction and reduce environmental impact. Additionally, quality criteria weights are assigned using a Likert scale from 1 (low importance) to 5 (high importance). Assigning weights to the criteria ensures differentiation of the significance of the impact not only in terms of customer satisfaction with use but also in terms of reducing the negative environmental impact in the life cycle.
- 8.
- Development of proposals to modify the states of the product quality criteria. Various modifications of current quality criteria states are proposed. A maximum of 7 ± 2 [45] modified states per criterion is recommended, including values above/below the current state or value with verbal descriptions.
- 9.
- Estimation of the quality of product prototypes. Product prototypes are initially assessed based on the current and modified states of quality criteria. Scores are assigned using a Likert scale, where 1 is low customer satisfaction with product use and 5 is high customer satisfaction with product use [49]. Scores across all states for a given criterion should sum to 1. As part of a comprehensive analysis of the quality of prototypes, it is proposed to take into account the importance of quality criteria. The quality indicator (Q) is calculated using a Weighted Sum Model (WSM) (2) [50]:
Quality is estimated taking into account correlations between quality criteria (zone IV). In the case of positive correlation, the summation of weighted assessments of the states of criteria with the analysed criterion is considered. In turn, for negative correlation, the differences of weighted assessments of the states of criteria with the analysed criterion are considered. Lack of correlation means accepting the current state for uncorrelated criteria and their summation in the form of a weighted assessment of these states. The higher the Q indicator, the more beneficial the prototype is for customers from a user point of view.
- 10.
- Interpretation of results. The results are interpreted through a normalised quality indicator, depending on environmental aspects. A prototype classification is established that is created according to the normalised Q indicator (3) [23]:
The values range from 0 (unsatisfactory quality) to 1 (fully satisfactory). A value of 0.75 is considered the threshold for favourable product quality [51,52]. Prototypes within the 0.75–1.00 range are considered a compromise between environmental and quality performance. Hence, the value of 0.75 was adopted as a threshold, constituting a compromise between environmental requirements and the quality level achievable by most manufacturers in current technological conditions. This allows for distinguishing products that not only work well in use but also minimise the negative impact on the environment.
The final choice of prototype is made by the user of the model, considering available resources, feasibility of design changes, and other factors. The selected prototype should maximise both customer satisfaction and environmental performance across the life cycle.
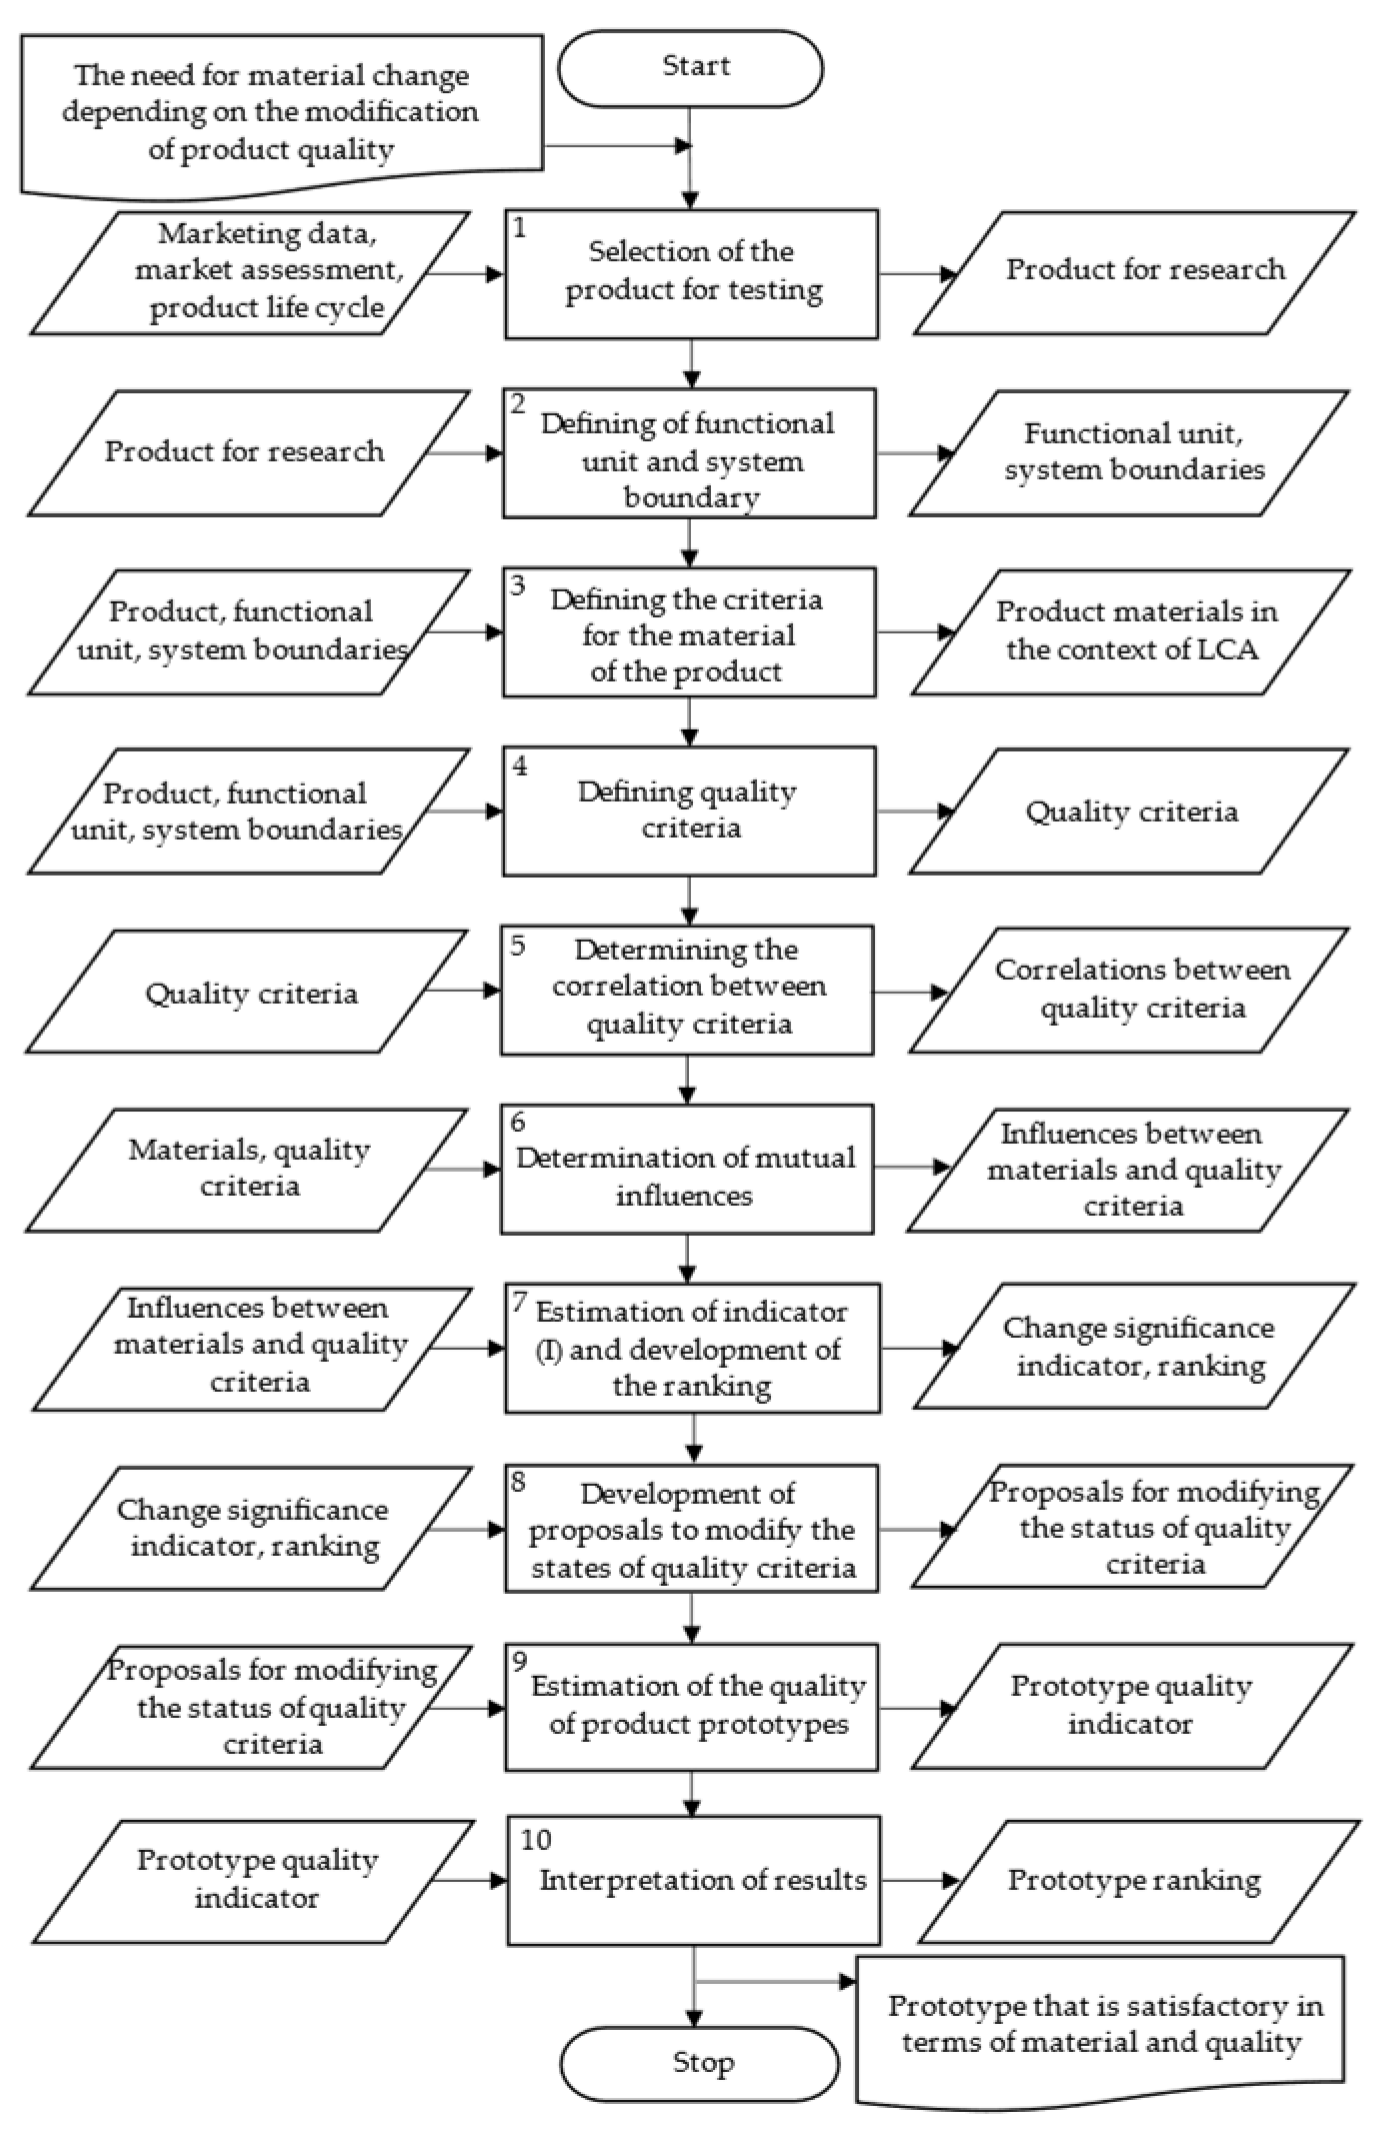
Figure 2 presents the algorithm for modelling the relationship between materials and quality in the sustainable design of alternative product solutions.

Figure 2.
Model supporting the creation and analysis of the relationship between materials and quality in the sustainable designing of alternative product solutions.
3. Results: Test and Illustration of the Model Based on a Case Study
The model was tested and illustrated using a passenger car tyre as an example. Passenger car tyres are one of the basic components of light vehicles and the only element in contact with the road [53]. This product is key in all road vehicles. The popularity of such products depends on the widespread availability of data, which is essential for model testing. As vehicles continue to evolve, there is also a need to improve their components, including the tyre [54]. This product should be modified according to specifications to ensure proper use. Additionally, the search for environmentally friendly solutions is becoming increasingly important. Based on a literature review, for example [55,56,57], it has been concluded that passenger car tyres negatively impact the natural environment. Environmental impact, data availability, and industrial significance were the key factors that led to the selection of car tyres as the subject of this research.
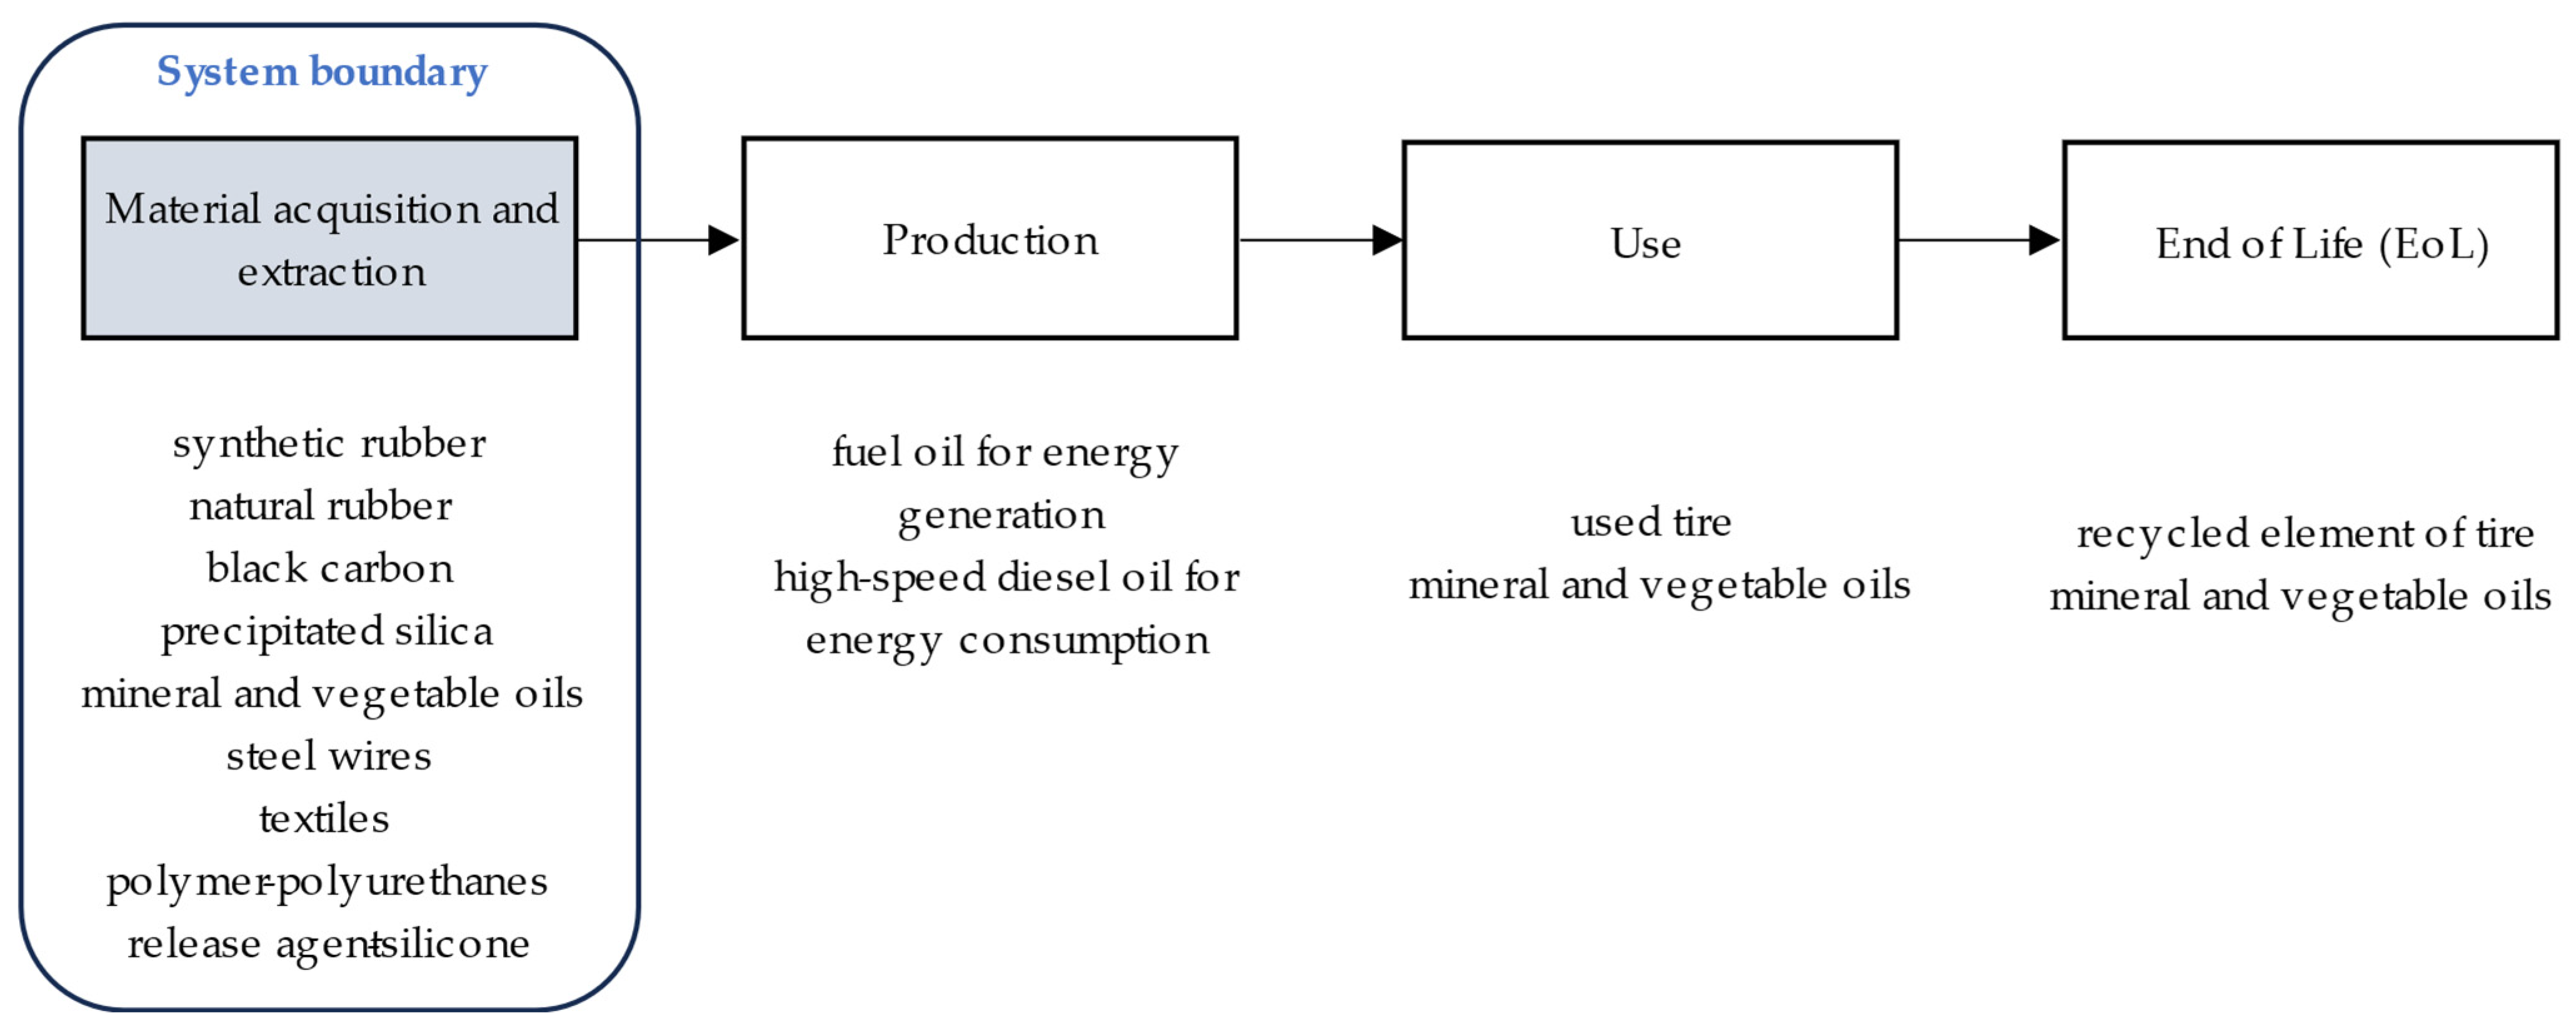
A functional unit was adopted for data normalization to enable further comparison. The research includes modelling a passenger car tyre (the reference product) and its hypothetical prototypes. Following the approach used in other studies [22,57], the functional unit is assumed to be one tyre used over a period of approximately 10 years. The system boundaries were limited to the material acquisition and extraction phase—the first stage of the “cradle-to-grave” approach [58]. Inputs include energy and raw materials, while outputs consist of emissions and waste, as shown in Figure 3.
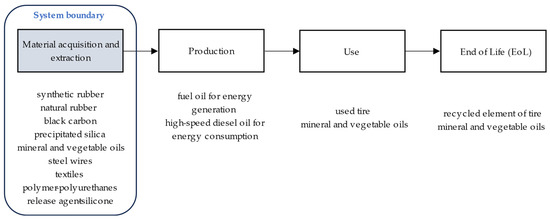
Figure 3.
System boundaries adopted for the analysis of a passenger car tyre.
Then, material criteria for a passenger car tyre were determined. The necessary materials used in the tyre production process were selected. The values represent average material masses obtained based on the GREET v1.3.0.13991 model database and the OpenLCA Ecoinvent database, and a literature review presenting inventory data for the assessment of the tyre life cycle assessment was used in the life cycle assessment of tyres [22,57]. Materials used in negligible quantities were omitted. The main materials (listed in Table 2) were recorded in zone I, while their quantities for a passenger car tyre were listed in zone II.
Table 2.
Material data for a passenger car tyre in the context of the life cycle in the material acquisition and extraction phase.
Then, the quality criteria for the passenger car tyre, which are related to customer satisfaction during use, were determined. They were recorded in zone III. The criteria were determined in accordance with the passenger car tyre catalogues:
- Wet grip;
- Cornering grip;
- Durability;
- Fuel consumption;
- Noise;
- Aquaplaning resistance in a straight line;
- Aquaplaning resistance on a curve;
- Driving stability;
- Rolling resistance coefficient;
- Tyre load capacity;
- Speed index.
Correlations between the quality criteria were then determined and recorded in zone IV. Positive correlations were observed between wet grip and criteria such as cornering grip, noise, aquaplaning resistance on straight and curved roads, and driving stability. Other positive correlations included the following: cornering grip with noise and aquaplaning resistance; durability with load capacity; fuel consumption with noise and rolling resistance coefficient; and driving stability with both rolling resistance coefficient and speed index. Negative correlations were observed between wet braking grip and both fuel consumption and rolling resistance coefficient. Similar negative correlations existed between cornering grip and both fuel consumption and rolling resistance coefficient.
Subsequently, the mutual influences between tyre materials and qualitative criteria were identified. These were categorised as weak, medium, or strong, indicating the impact of qualitative criteria on the environmental burden caused by selected tyre materials. Strong influences were most commonly associated with qualitative criteria such as wet braking grip, cornering grip, and tyre durability. The results were recorded in zone IV.
Finally, the material change significance index (I) was calculated using Formula (1), which sums the products of material parameters and the evaluations of their dependence on the qualitative criteria. For example, for the first quality criterion (wet braking grip), the calculation is shown in Equation (4):
Similar calculations were performed for the remaining quality criteria. Based on these results, a ranking of qualitative criteria was developed and recorded in zone V. The complete structure is shown in Appendix A (Figure A1).
Tyre durability was identified as the most important quality criterion in terms of environmental impact over the tyre’s life cycle (in the context of environmental criteria). It achieved the highest significance index (76.94) and was therefore assigned a weight of 5 on the Likert scale. The next most important criteria (4) were cornering grip (49.17) and wet braking grip (48.32). Criteria of medium importance (3) included load capacity (33.32), driving stability (28.89), and aquaplaning resistance on straight and curve roads (21.18). Fuel consumption and speed index (17.56) were deemed of little importance (2), while noise (13.33) and the rolling resistance coefficient (12.38) were considered practically insignificant (1).
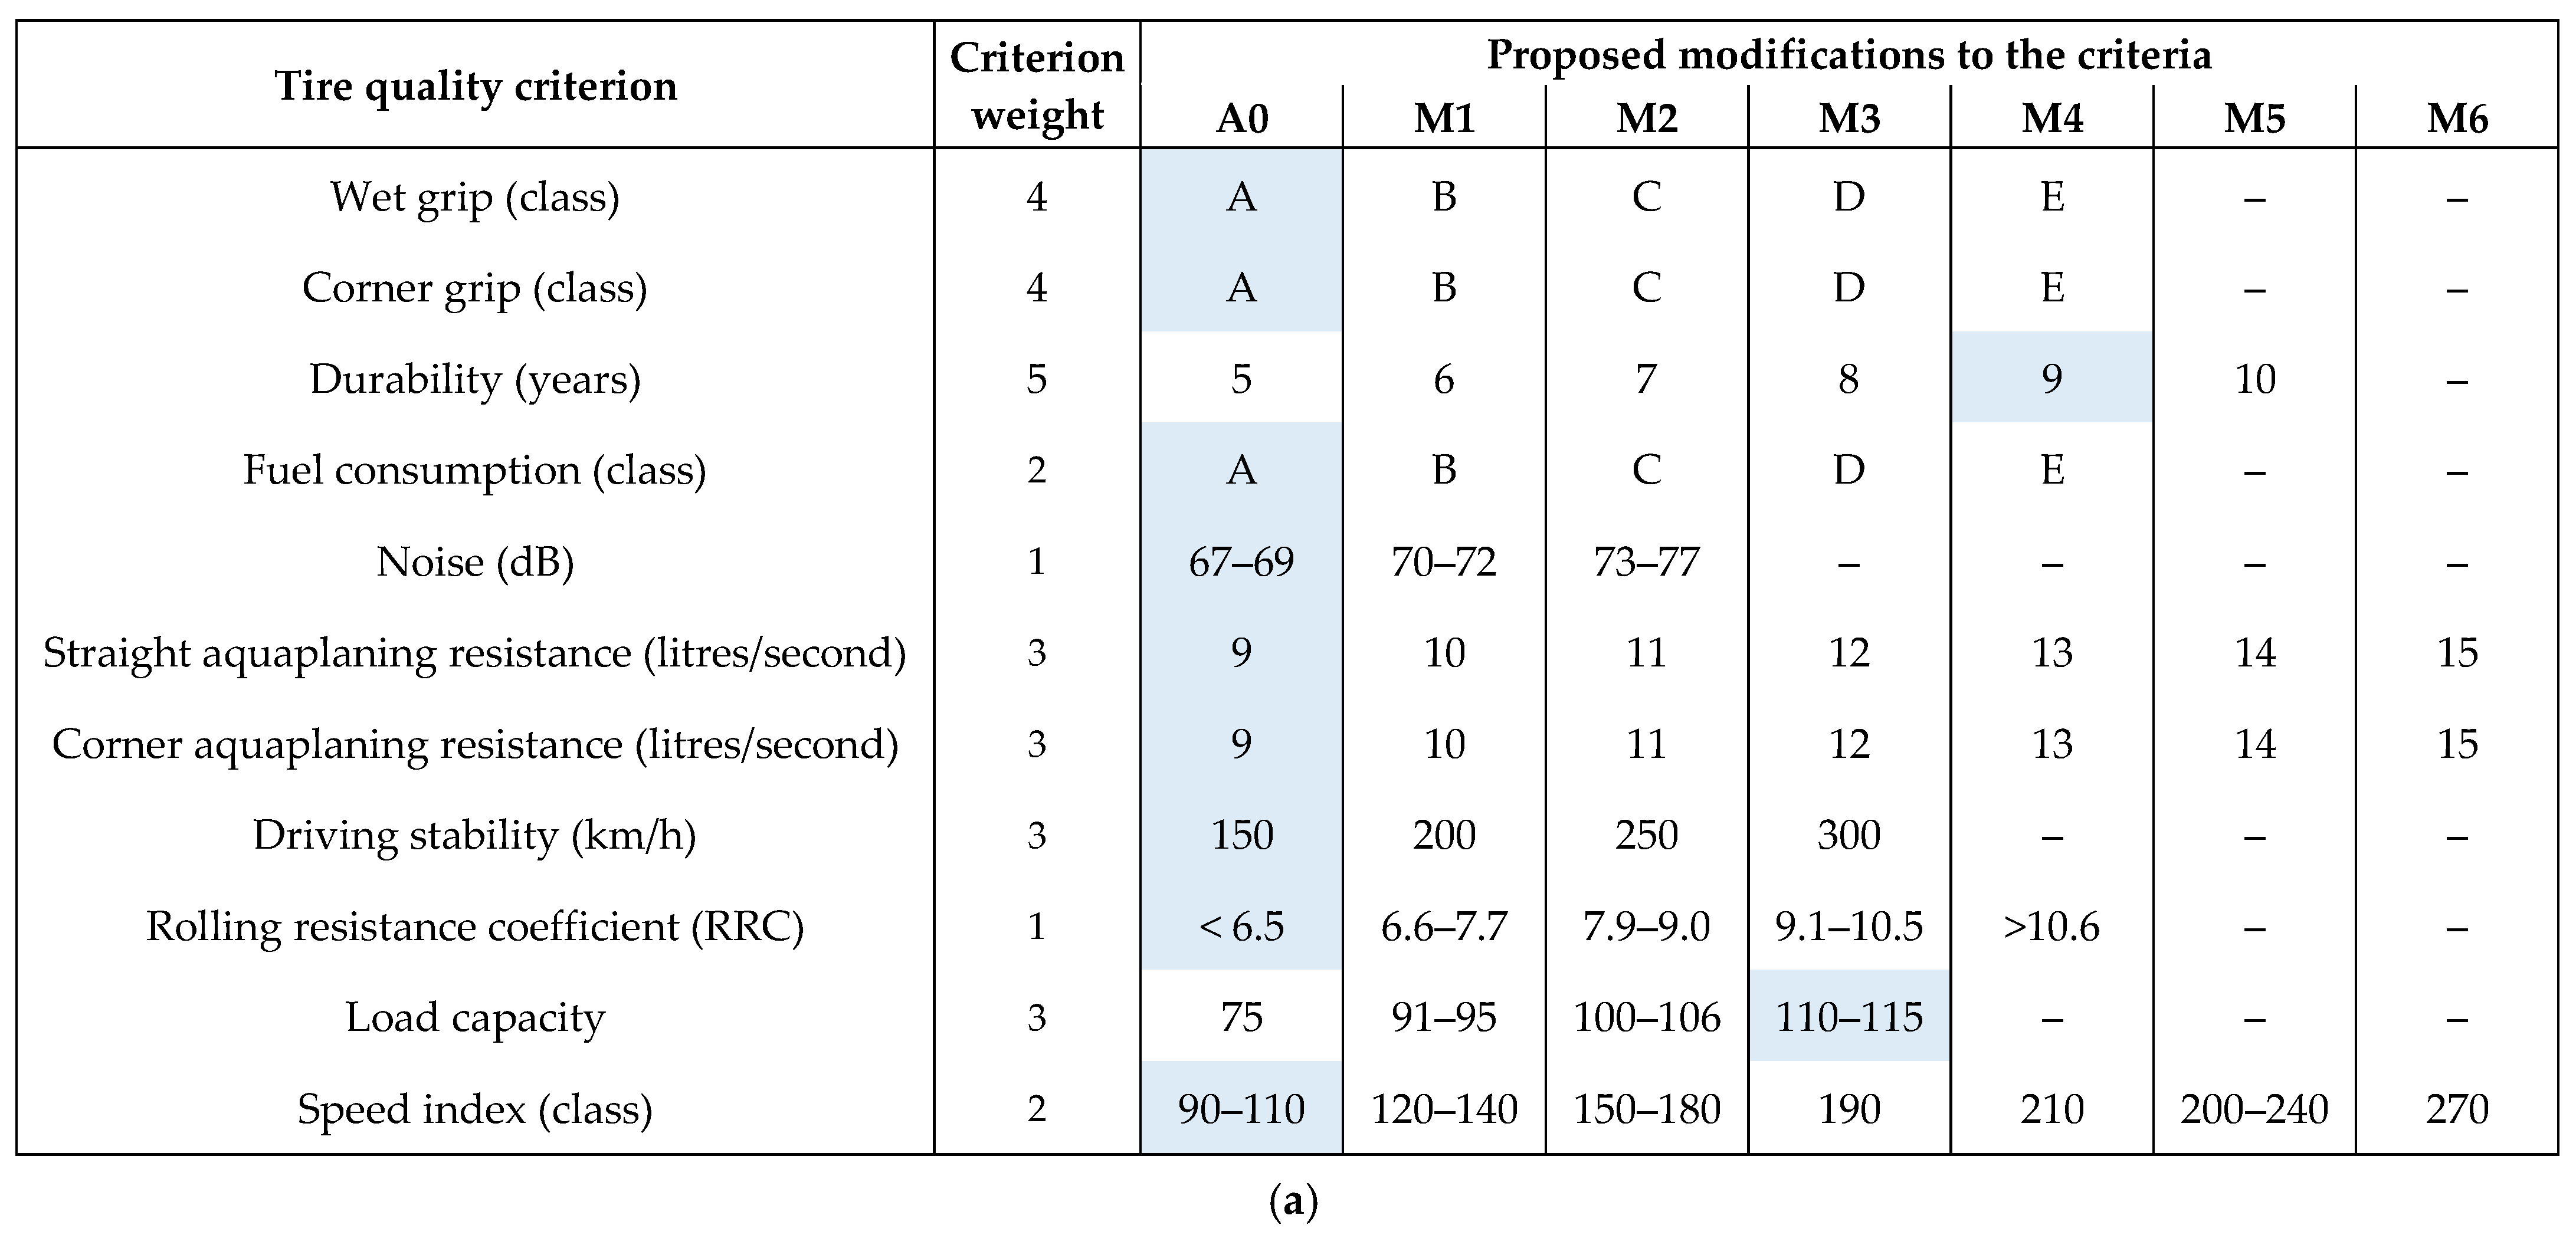
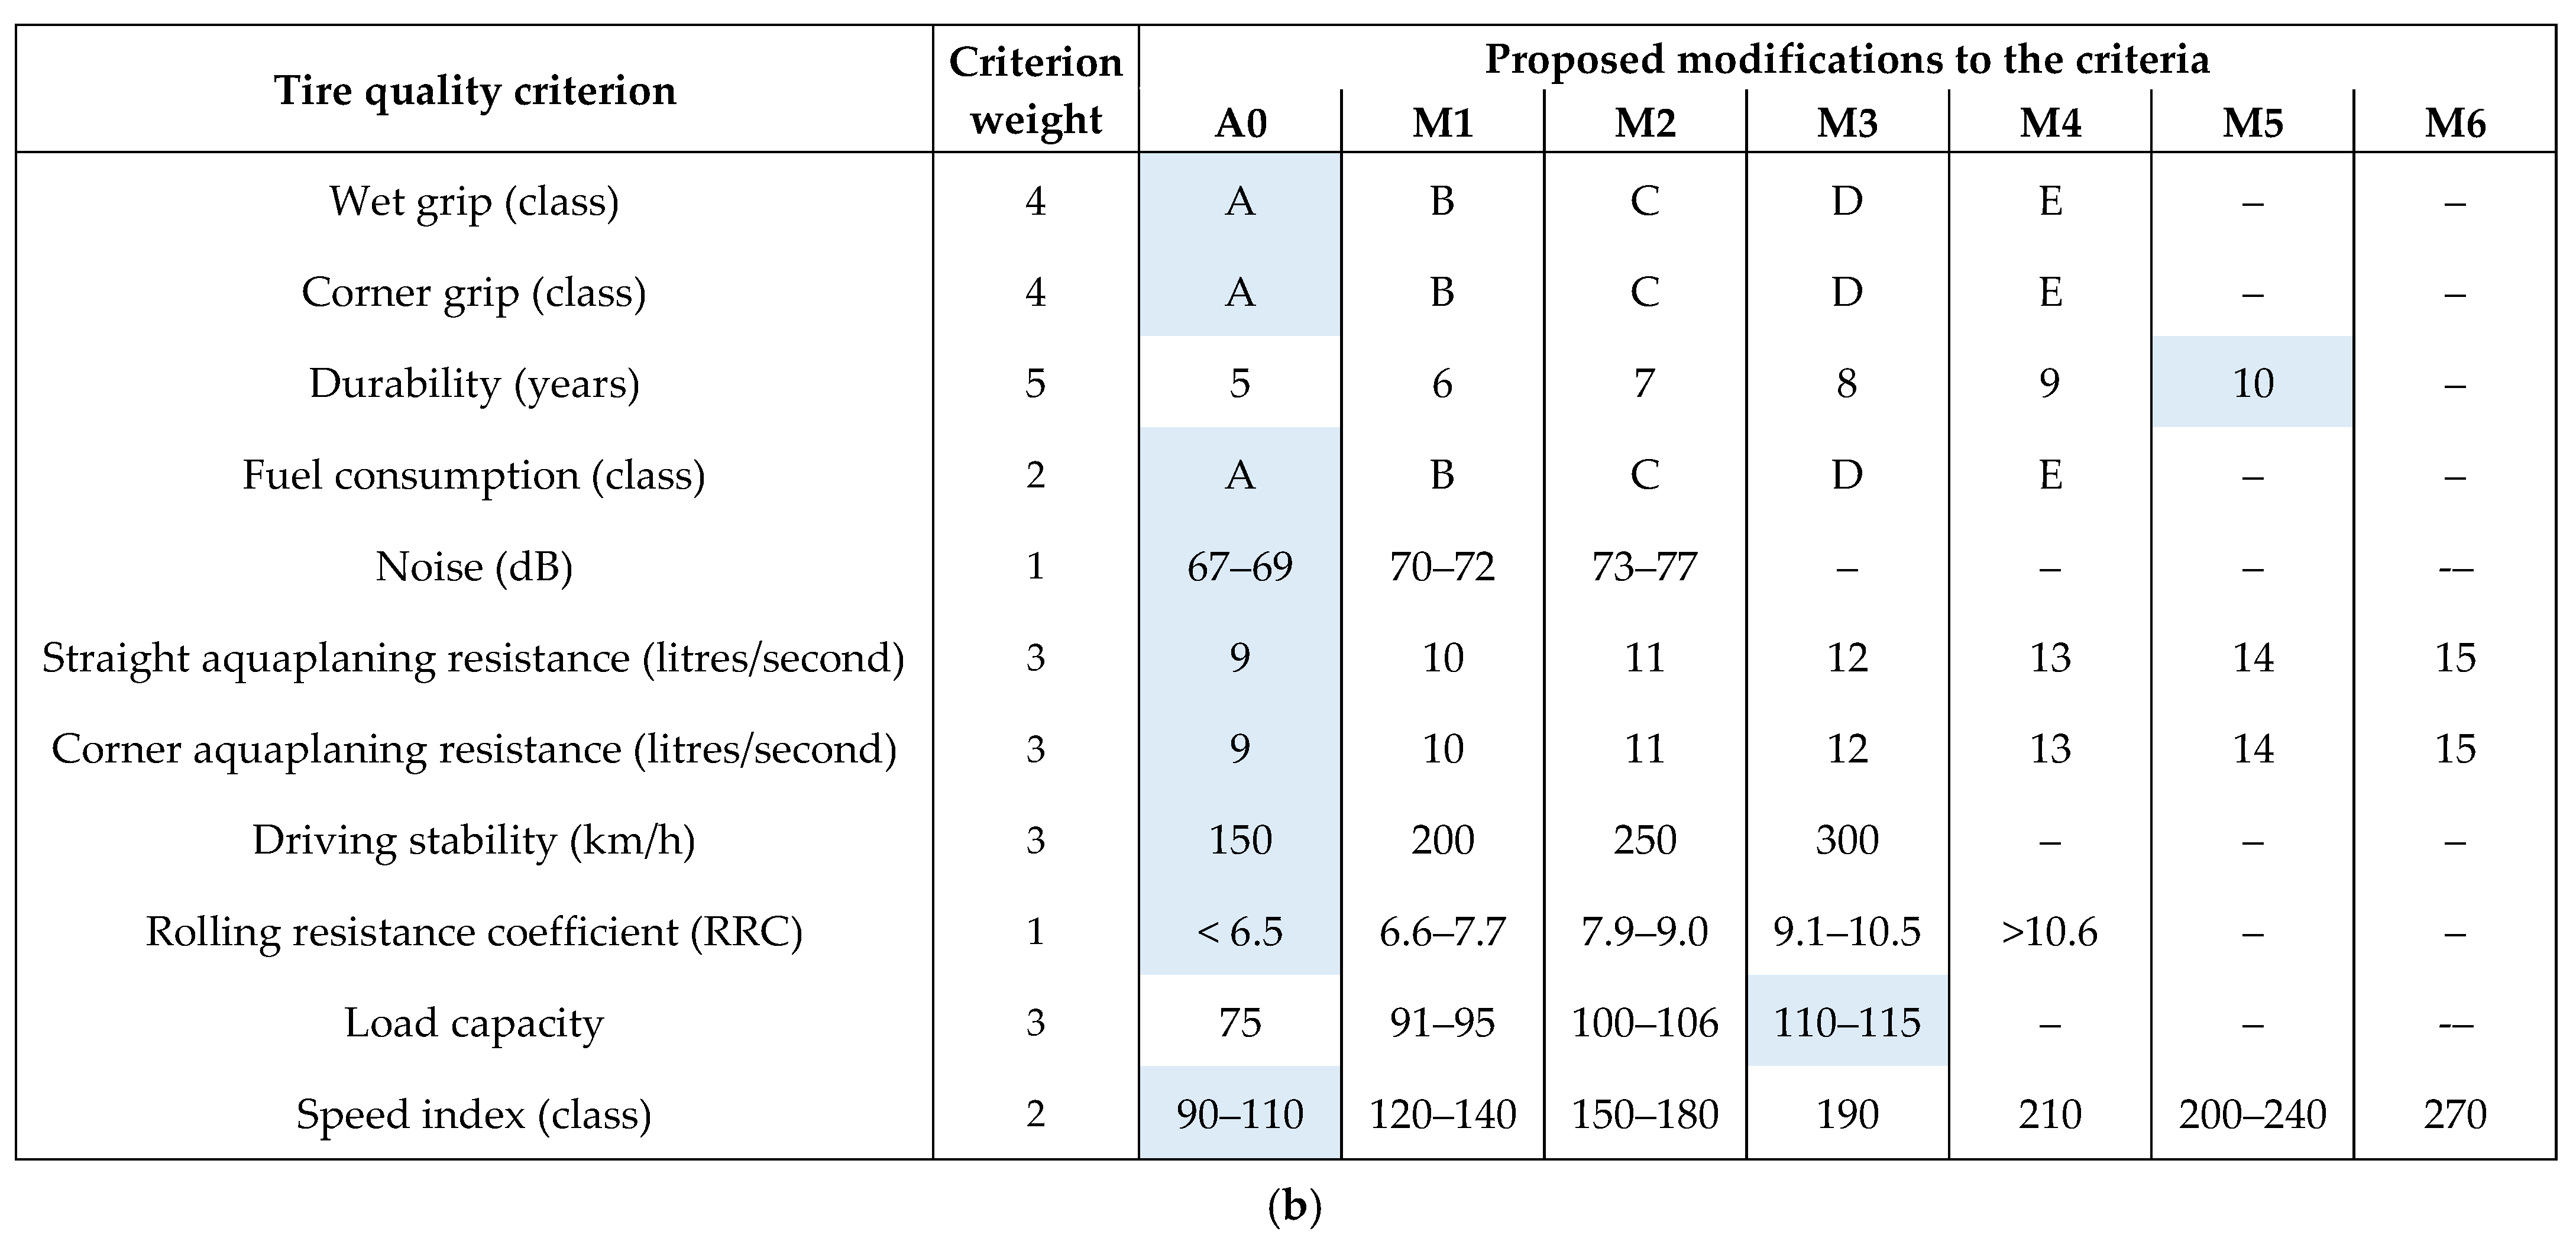
Next, modifications to the reference tyre were proposed based on product catalogues. These proposed modifications are presented in Table 3.
Table 3.
Modifications to the status of the tyre quality criteria.
The modified quality criteria were evaluated using a Likert scale, where 1 = low customer satisfaction with the use of the tyre, and 5 = maximum customer satisfaction with the use of the tyre. The assigned scores are presented in Table 4.
Table 4.
Evaluation of the tire quality criteria and their importance.
Subsequently, based on previous established correlations between tyre quality criteria (zone IV), possible quality levels were estimated. For instance, in the case of “adhesion on a wet surface”, five positive and two negative correlations with other quality criteria were identified. Three criteria were uncorrelated. Combinations were created for each state of the positively and negatively correlated criteria in relation to each state of the analysed criterion. Uncorrelated criteria were presented by their current states only. Using Formula (2) and data from Table 4, the quality of tyre prototypes was estimated. An example of the calculation method for the first three prototypes is shown in Formula (5):
As a result, 35 alternative tyre solutions were obtained for the wet grip criterion. The quality of these alternatives was assessed in relation to the remaining quality criteria using a similar procedure. Due to the numerous correlations and various states of the criteria, a total of 277 quality (Q) indices were ultimately calculated.
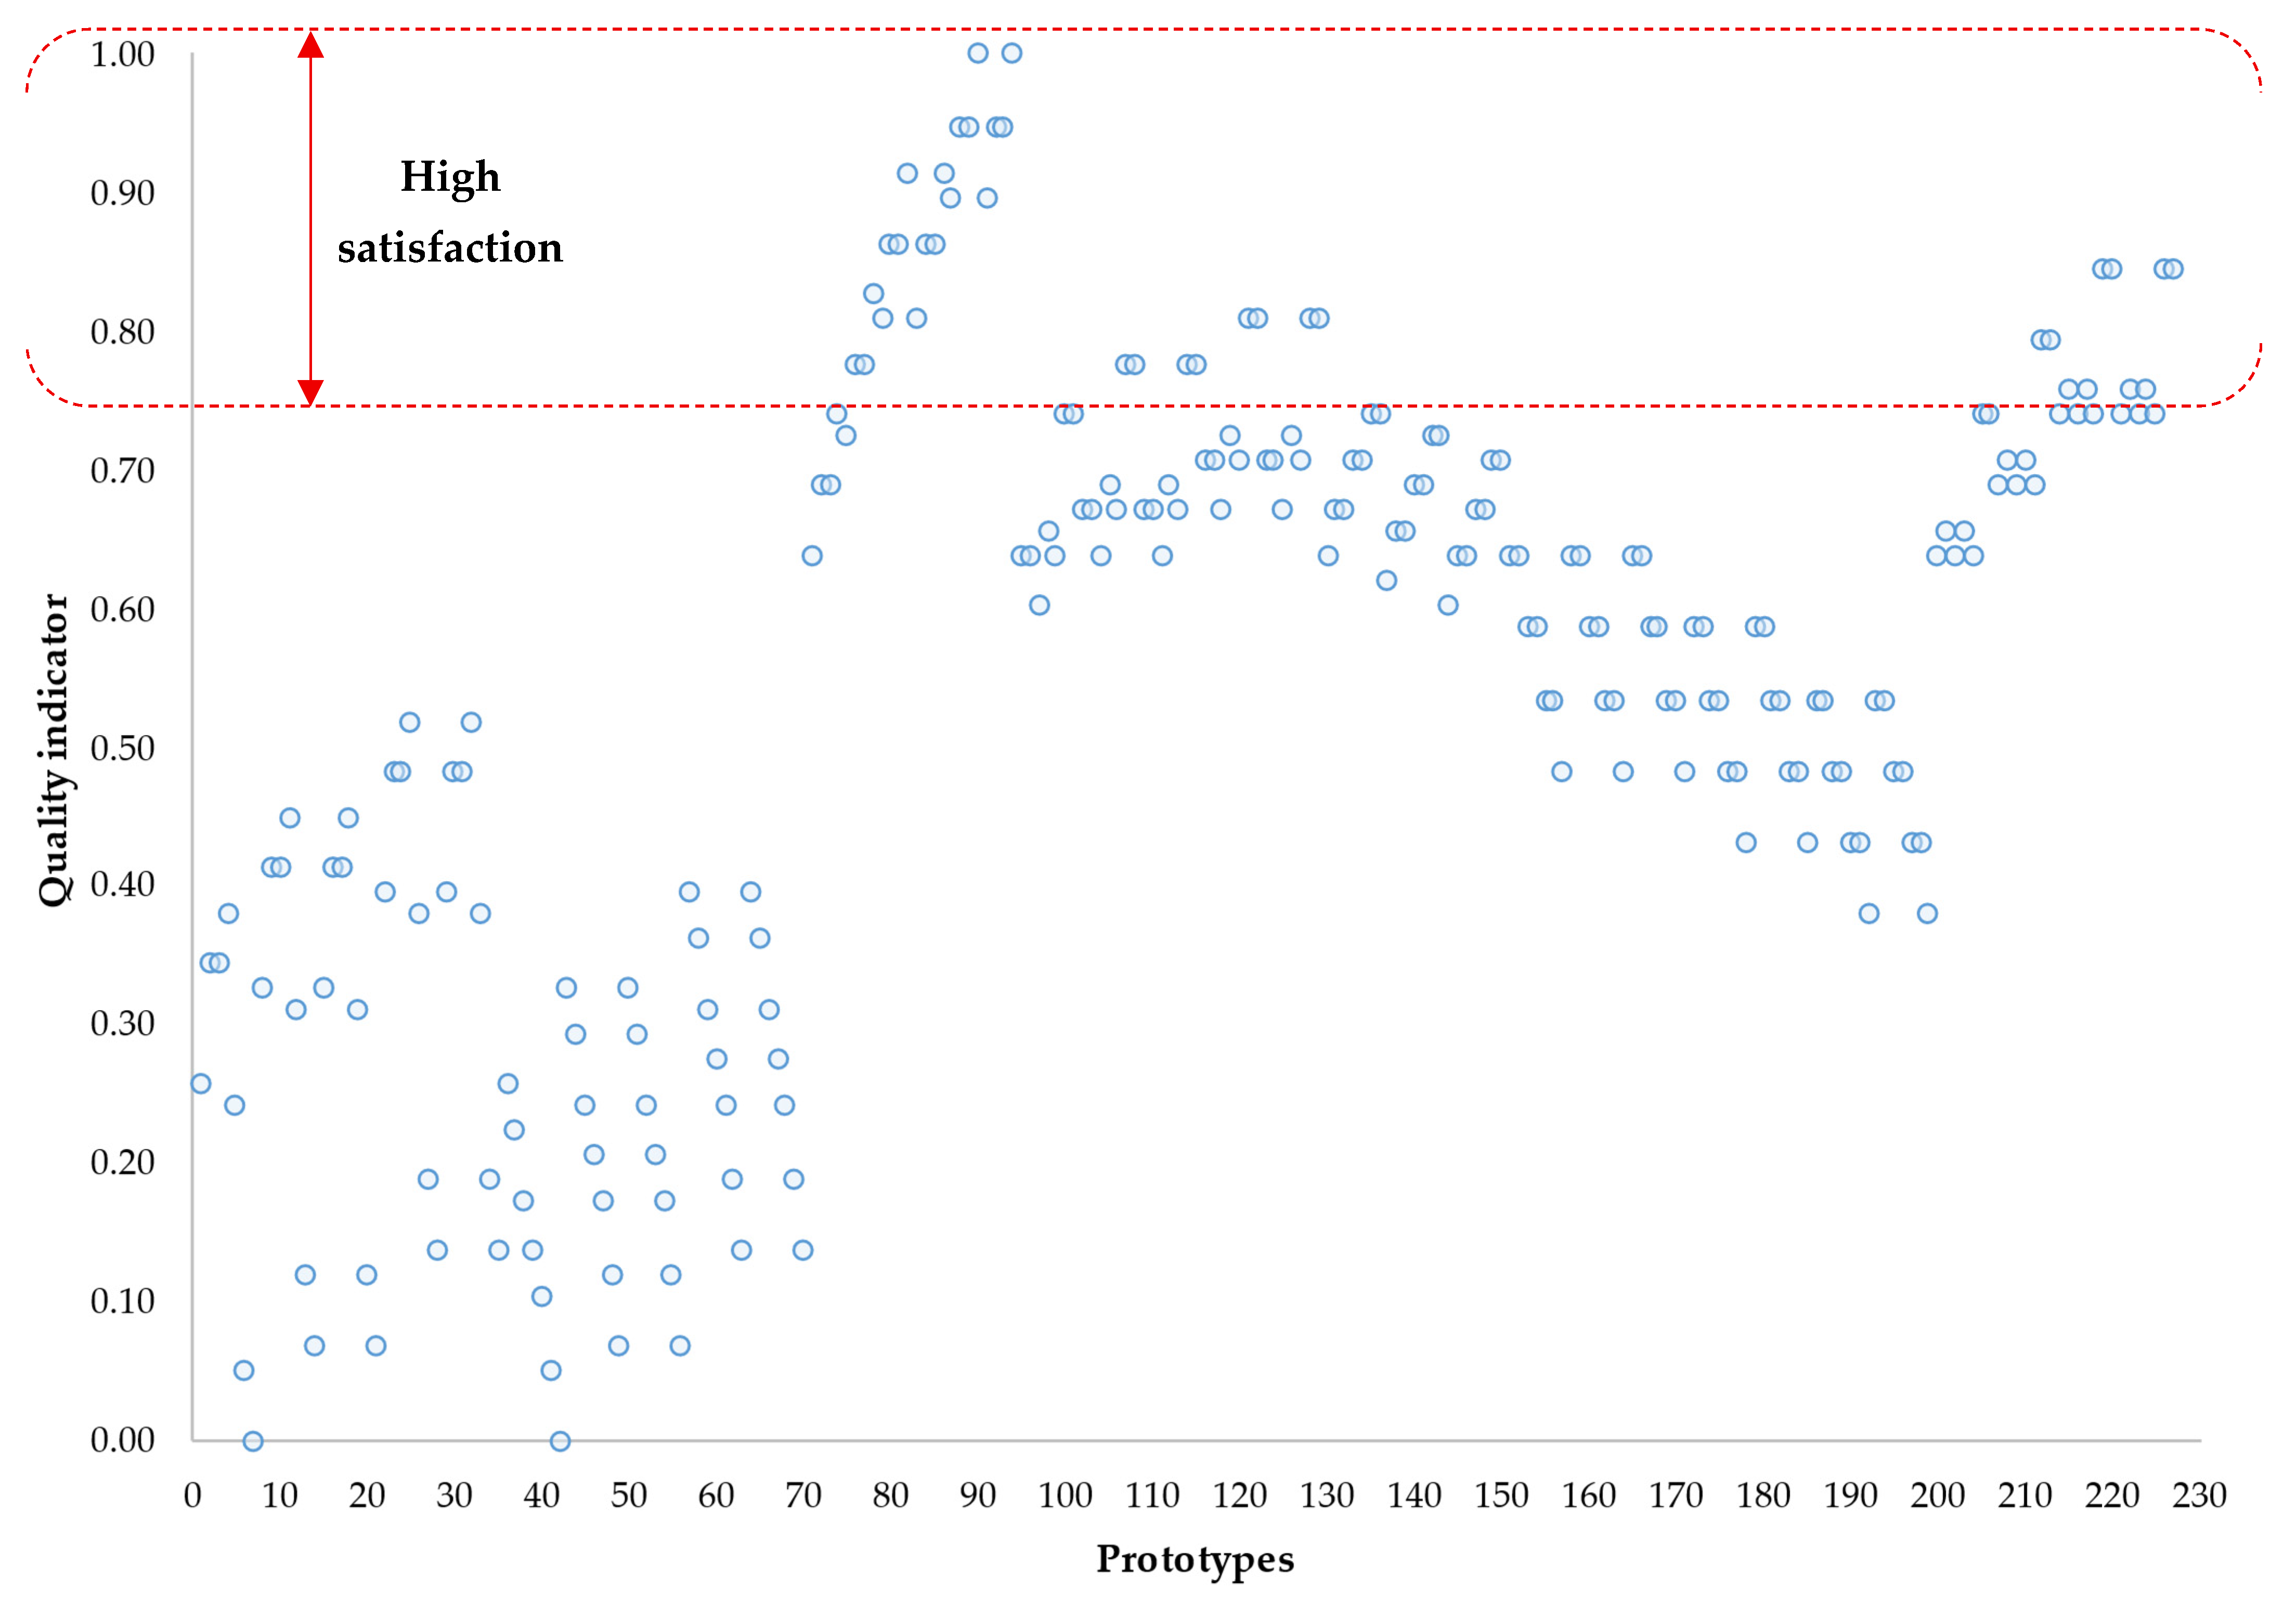
Using Formula (3), the Q indices were normalised to a range from 0 to 1, where 1 is the most favourable quality indicator (highest customer satisfaction). The results for the developed tyre prototypes are visualised in Figure 4.
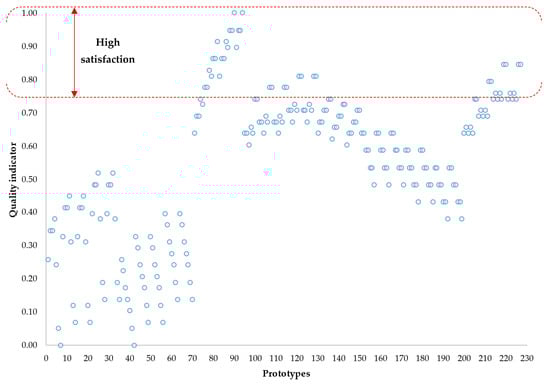
Figure 4.
Analysis of quality indicators of light passenger car tyre prototypes.
Assuming a quality index above 0.75 indicates high customer satisfaction, 37 of the analysed prototypes were deemed satisfactory. The threshold of 0.75 was adopted as the acceptability criterion for comprehensive quality and environmental performance, encompassing both technical (quality) parameters and environmental impact. This means that a tyre must meet at least 75% of the evaluated criteria at a satisfactory level or higher to be considered acceptable in terms of quality and ecological compatibility. A summary is presented in Table 5.
Table 5.
List of satisfactory prototype quality levels.
Among these prototypes, the most advantageous designs were Q90 and Q94, which achieved the highest quality indicator. The quality criteria are presented in the morphological analysis (Figure 5).
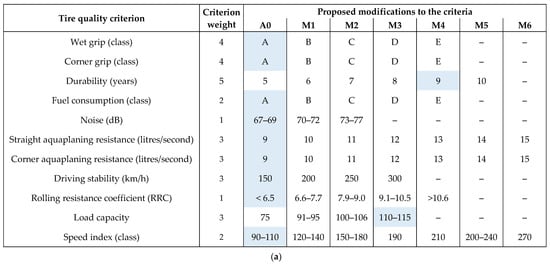
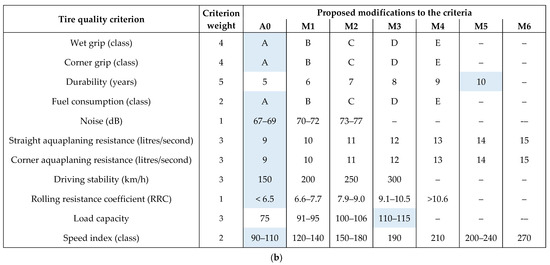
Figure 5.
Morphological analysis for the most favourable tyre design solutions (blue color): (a) set of state combinations of quality criteria for prototype 90; (b) set of state combinations of quality criteria for prototype 94.
The morphological analysis of these two selected designs demonstrated that small changes to the current product could significantly improve customer satisfaction while reducing environmental impact. Despite requiring minimal design changes, they proved the most beneficial. This was due, in part, to the assumption that the environmental burdens of materials used in modifying the quality criteria were quantitatively assessed. The ranking was also influenced by the assigned weights of product criteria used in generating the quality indicator. The combination of environmental load and criterion significance revealed that, for instance, increasing tyre durability and load capacity alone can result in satisfactory quality and environmental performance. The longer the service life and the greater the load capacity, the higher the customer satisfaction and the lower the negative environmental impact over the tyre’s life cycle compared with the reference tyre.
However, the final decision on prototype selection lies with the entity using the model and may depend on factors such as available resources. The highest quality indicator may not always determine the best choice—prototypes with slightly lower indices may be preferred due to simple design assumptions, fewer required modifications, or lower cost.
4. Discussion
Research on product improvement using the QFD method, including efforts to limit the environmental impact throughout the life cycle, is still in the development phase [59,60]. Various methods supporting the design process have been proposed. For example, in [24], LCA, QFD, and TRIZ (Theory of Inventive Problem Solving) were combined. The reduction in global warming was considered, including the possibility of generating prototypes beneficial to customers in terms of quality. Eco-design was the subject of research in [25], where QFD was integrated with LCA. The analysis focused on the eco-efficiency of products. A similar combination of methods was proposed in [26], where a procedure was introduced to incorporate environmental criteria, establish their priorities, and then combine them with customer requirements. The list of environmental requirements was determined using LCA. Likewise, in [27], a tool was offered to optimise product design (prototypes) at the early stages of development. This tool uses the QFD matrix and accounts for environmental impacts during the product life cycle. In turn, [28] identified environmental criteria and their importance and then processed them in the QFD method to achieve product eco-design.
It has been observed that current approaches do not focus on balancing product quality and the materials used, which are important from an environmental perspective. Moreover, these materials were not analysed in the context of the product life cycle, including an initial search for significant relationships with quality criteria and then the generation of alternative product solutions. Therefore, the objective was to develop an innovative approach based on modelling the relationships between materials and product quality within the framework of sustainable design for alternative product solutions. The modelling was based on material relationships from the product life cycle (LCA) and key product quality criteria.
Table 6 presents the main contribution of the proposed model to the design and improvement process of products using the QFD method.
Table 6.
Comparison of the proposed model with the traditional form of the QFD method.
The proposed model, based on the QFD method, was found to be methodologically consistent and to support correlation analyses, including mutual relationships between materials and product quality criteria. Including selected QFD stages in the model contributes to its methodological soundness, which further enhances its practical efficiency. Expanding the model with additional stages beyond the traditional QFD method adds to its originality.
Next, the proposed model, which incorporates life cycle assessment elements, was compared with the traditional approach of the LCA method. The aim was to demonstrate the relationship between LCA and the proposed model, highlighting its novelty. This is presented in Table 7.
Table 7.
Comparison of the LCA method with the proposed model based on selected LCA elements.
The main area of LCA applicability in the proposed model is to ensure the inclusion of materials obtained and processed during production manufacturing. At the same time, the environmental impact of these materials is considered by quantifying their share in the product. The greater the share, the greater the environmental burden. Based on this reasoning, the model seeks to balance product quality with the necessary materials used, including their quantity, to ensure customer satisfaction while reducing environmental impact.
Therefore, the proposed model will support sustainable product development by balancing product quality and environmental impact through materials selection. It provides the following benefits:
- Improving product quality while reducing environmental impact;
- Supporting the identification of relationships between materials with significant environmental impact and the planned product quality criteria;
- Enhancing the prototyping process to simultaneously meet customer expectations and minimise environmental impact.
The model is low-cost and therefore suitable for small- and medium-sized enterprises (SMEs). Its application does not require a large team of experts, but rather, an interdisciplinary selection of specialists.
One limitation of the model is its focus on the materials used in the product. This refers to the first life cycle stage concerning material acquisition and processing. Other stages—such as energy use, usage phase, and end of life—are not included. Another limitation is the difficulty of conducting extensive analyses for a large number of materials and quality criteria, which necessitates creating a comprehensive quality house, making practical use inefficient.
Future research will aim to expand the model to include other life cycle stages. It will be adapted for comprehensive life cycle assessment, including simultaneous quality assessment. Plans also include incorporating stages such as cost analysis or competitive product benchmarking. Future developments may involve integrating cost analysis, multi-objective optimisation, or simulation tools such as OpenLCA.
The proposed model could also be applicable to products such as electronics, composites, or modular systems. However, changes to the underlying assumptions will be necessary, as the current ones apply to final, commonly used products intended for end users. For modular products, the model should include separate analyses for each module. In the case of composites, the model could be used for quality–environment evaluation, but it should be applied by specialists familiar with both the environmental impact and specific material properties, which would be treated as quality attributes of specific material types. A similar approach applies to electronic products. Adapting the model for other types of applications requires separate studies, which will be the subject of future research by the authors.
5. Conclusions
Sustainable product development requires the consideration of various criteria such as quality and environmental impact. New techniques are still being explored to support conceptualisation and prototyping, aiming to increase customer satisfaction while reducing environmental burdens. Therefore, the objective was to develop a model that supports the creation and analysis of the relationship between materials and quality towards the sustainable design of alternative product solutions.
The novelty of the proposed model lies in its use of product life cycle data—starting from the material acquisition and extraction phase—to support the modelling process. This data includes information on the degree of environmental impact. Modelling considers selected quality criteria of the final product that are significant in terms of environmental impact. This enables the analysis of alternative design variants in terms of both utility quality (i.e., meeting customer expectations) and environmental impact throughout the product life cycle. The model’s innovativeness stems from its integration with the QFD method while incorporating life cycle assessment principles. This aligns with the concept of data modelling within qualitative and environmental analyses of prototypes.
The proposed model allows for the dynamic selection of a product variant that ensures the desired quality and environmentally friendly materials. The proposed solution can be applied to any material, and with minor adjustments, it can be used for various types of products. It may serve as an effective and simple alternative to more complex quality and environmental analyses, particularly in small and medium enterprises (SMEs). These enterprises often lack that resources available to large companies, such as access to life cycle assessment software. Therefore, the model can support early decision making in product development, especially in material selection and modifying quality criteria, without the need for prior physical prototyping. The model may also be useful for other products, such as electronics, composites, or modular systems. However, adapting it to such applications will require revising the assumptions, as the current ones concern final, commonly used products. Separate studies will be necessary, and these will be the subject of future research by the authors.
Author Contributions
Conceptualization, D.S. and A.P.; methodology, D.S. and A.P.; software, D.S. and A.P.; validation, D.S. and A.P.; formal analysis, D.S. and A.P.; investigation, D.S. and A.P.; resources, D.S. and A.P.; data curation, D.S. and A.P.; writing—original draft preparation, D.S. and A.P.; writing—review and editing, D.S. and A.P.; visualization, D.S. and A.P.; supervision, D.S. and A.P.; project administration, D.S. and A.P.; funding acquisition, D.S. and A.P. All authors have read and agreed to the published version of the manuscript.
Funding
This research received no external funding.
Institutional Review Board Statement
Not applicable.
Informed Consent Statement
Not applicable.
Data Availability Statement
Dataset available on request from the authors.
Conflicts of Interest
The authors declare no conflicts of interest.
Appendix A
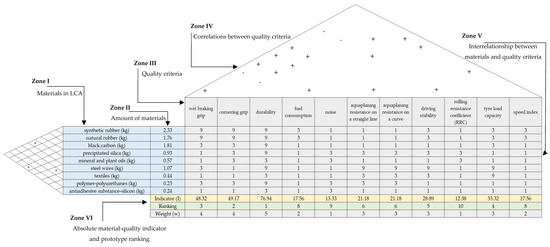
Figure A1.
Analysis of the relationship between materials and tyre quality criteria.
Figure A1.
Analysis of the relationship between materials and tyre quality criteria.
References
- Pacana, A.; Siwiec, D. Analysis of the Possibility of Used of the Quality Management Techniques with Non-Destructive Testing. Teh. Vjesn.-Technol. Gaz. 2021, 28, 45–51. [Google Scholar] [CrossRef]
- Milad, A. Recycled and Upcycled Materials in Contemporary Architecture and Civil Engineering: Their Applications, Benefits, and Challenges. Clean. Waste Syst. 2025, 10, 100203. [Google Scholar] [CrossRef]
- Smith, K.A.; Bin Mostafiz, R.; Friedland, C.; Nahmens, I. Fuzzy Logic Use Case within the Built Environment for Optimizing Sustainability versus Cost in the Material Selection Process. Front. Built Environ. 2025, 11, 1529578. [Google Scholar] [CrossRef]
- Mohanty, A.K.; Vivekanandhan, S.; Pin, J.-M.; Misra, M. Composites from Renewable and Sustainable Resources: Challenges and Innovations. Science 2018, 362, 536–542. [Google Scholar] [CrossRef]
- Singh, A.R.; Vishnuram, P.; Alagarsamy, S.; Bajaj, M.; Blazek, V.; Damaj, I.; Rathore, R.S.; Al-Wesabi, F.N.; Othman, K.M. Electric Vehicle Charging Technologies, Infrastructure Expansion, Grid Integration Strategies, and Their Role in Promoting Sustainable e-Mobility. Alex. Eng. J. 2024, 105, 300–330. [Google Scholar] [CrossRef]
- Kumar, S.; Goel, A.; Kumar Singh, G. Intricate Analysis of Potential Materials for Sustainable Product Development. Eur. J. Sustain. Dev. 2019, 8, 114. [Google Scholar] [CrossRef]
- Sas-Boca, I.-M.; Tintelecan, M.; Pop, M.; Iluțiu-Varvara, D.-A. Severe Reduction in Section of Copper Wire Using the Technology of Wire Cold Cassette Roller Dies. Procedia Manuf. 2018, 22, 73–78. [Google Scholar] [CrossRef]
- Lei, H.; Yang, W.; Zhang, B.; Li, C.-Q. An Advanced Method for Assessing Circular Economy Performance of Built Environment. J. Clean. Prod. 2025, 486, 144561. [Google Scholar] [CrossRef]
- Usman, O.; Iorember, P.T.; Alola, A.A.; Bekun, F.V. Effect of Domestic Material Production on Environmental Sustainability in EU Countries under Changing Financial Development: A Dynamic Panel Threshold Regression Approach. Environ. Dev. Sustain. 2024, 1, 1–20. [Google Scholar] [CrossRef]
- Truong, N.; Trencher, G.; Yarime, M.; Barrett, B.; Matsubae, K. Barriers to the Adoption of Electric Cars and Electric Motorcycles in Vietnam. Transp. Res. D Transp. Environ. 2024, 131, 104204. [Google Scholar] [CrossRef]
- Kaššaj, M.; Peráček, T. Synergies and Potential of Industry 4.0 and Automated Vehicles in Smart City Infrastructure. Appl. Sci. 2024, 14, 3575. [Google Scholar] [CrossRef]
- Vadoudi, K.; Deckers, P.; Demuytere, C.; Askanian, H.; Verney, V. Comparing a Material Circularity Indicator to Life Cycle Assessment: The Case of a Three-Layer Plastic Packaging. Sustain. Prod. Consum. 2022, 33, 820–830. [Google Scholar] [CrossRef]
- Siwiec, D.; Dwornicka, R.; Pacana, A. Improving the Process of Achieving Required Microstructure and Mechanical Properties of 38mnvs6 Steel. In Proceedings of the 29th International Conference on Metallurgy and Materials, Brno, Czech Republic, 20–22 May 2020; pp. 591–596. [Google Scholar]
- Li, R.; Zhai, C. Constructing Sports Facilities Using Environment-Friendly Materials. Front. Mater. 2025, 11, 1524729. [Google Scholar] [CrossRef]
- Kravtsova, M.V.; Volkov, D.A.; Melnikova, D.A.; Kravtsov, M.V.; Bezheskaia, E.V. An Effective System for Recycling Polyethyleneterephthalate. J. Phys. Conf. Ser. 2019, 1399, 022048. [Google Scholar] [CrossRef]
- Matygulina, V.; Chistova, N.; Vititnev, A.; Chistov, R. Dry Grinding of Waste Wood Fiberboard: Theoretical and Practical Aspects Affecting the Resulting Fiber Quality. Bioresources 2021, 16, 8152–8171. [Google Scholar] [CrossRef]
- Zhang, A.; Xing, Y.; Yang, F.; Zhang, X.; Wang, H.; Yu, T. Development of a New Cold Metal Transfer Arc Additive Die Manufacturing Process. Adv. Mater. Sci. Eng. 2021, 2021, 1–15. [Google Scholar] [CrossRef]
- Titone, V.; Botta, L.; Mistretta, M.C.; La Mantia, F.P. Influence of a Biodegradable Contaminant on the Mechanical Recycling of a Low-density Polyethylene Sample. Polym. Eng. Sci. 2024, 64, 845–851. [Google Scholar] [CrossRef]
- Bialy, W.; Grebski, W.; Galecki, G.; Kaniak, W. Environmental Impact of The Mechanical Coal Processing Plant. Acta Montan. Slovaca 2020, 25, 139–149. [Google Scholar] [CrossRef]
- Lotfi, S.; Deja, J.; Rem, P.; Mróz, R.; van Roekel, E.; van der Stelt, H. Mechanical Recycling of EOL Concrete into High-Grade Aggregates. Resour. Conserv. Recycl. 2014, 87, 117–125. [Google Scholar] [CrossRef]
- Vongpradubchai, S.; Rattanadecho, P. The Microwave Processing of Wood Using a Continuous Microwave Belt Drier. Chem. Eng. Process. Process Intensif. 2009, 48, 997–1003. [Google Scholar] [CrossRef]
- Siwiec, D.; Pacana, A. Materials and Products Development Based on a Novelty Approach to Quality and Life Cycle Assessment (QLCA). Materials 2024, 17, 3859. [Google Scholar] [CrossRef] [PubMed]
- Siwiec, D.; Gajdzik, B.; Gawlik, R.; Wolniak, R.; Pacana, A. Open Eco-Innovations in Sustainable Product Development: Model Framework of Design Thinking in Quality Life Cycle Assessment (DT-QLCA). J. Open Innov. Technol. Mark. Complex. 2025, 11, 100480. [Google Scholar] [CrossRef]
- Sakao, T. A QFD-Centred Design Methodology for Environmentally Conscious Product Design. Int. J. Prod. Res. 2007, 45, 4143–4162. [Google Scholar] [CrossRef]
- Kobayashi, Y.; Kobayashi, H.; Hongu, A.; Sanehira, K. A Practical Method for Quantifying Eco-Efficiency Using Eco-Design Support Tools. J. Ind. Ecol. 2005, 9, 131–144. [Google Scholar] [CrossRef]
- Neramballi, A.; Sakao, T.; Willskytt, S.; Tillman, A.-M. A Design Navigator to Guide the Transition towards Environmentally Benign Product/Service Systems Based on LCA Results. J. Clean. Prod. 2020, 277, 124074. [Google Scholar] [CrossRef]
- Popoff, A.; Millet, D. Sustainable Life Cycle Design Using Constraint Satisfaction Problems and Quality Function Deployment. Procedia CIRP 2017, 61, 75–80. [Google Scholar] [CrossRef]
- Puglieri, F.N.; Ometto, A.R.; Salvador, R.; Barros, M.V.; Piekarski, C.M.; Rodrigues, I.M.; Diegoli Netto, O. An Environmental and Operational Analysis of Quality Function Deployment-Based Methods. Sustainability 2020, 12, 3486. [Google Scholar] [CrossRef]
- Wolniak, R. The Use of QFD Method Advantages and Limitation. Prod. Eng. Arch. 2018, 18, 14–17. [Google Scholar] [CrossRef]
- Pryshlakivsky, J.; Searcy, C. Fifteen Years of ISO 14040: A Review. J. Clean. Prod. 2013, 57, 115–123. [Google Scholar] [CrossRef]
- Wolniak, E.R.; Sȩdek, A. Using QFD Method for the Ecological Designing of Products and Services. Qual. Quant. 2009, 43, 695–701. [Google Scholar] [CrossRef]
- Rebitzer, G.; Ekvall, T.; Frischknecht, R.; Hunkeler, D.; Norris, G.; Rydberg, T.; Schmidt, W.-P.; Suh, S.; Weidema, B.P.; Pennington, D.W. Life Cycle Assessment. Env. Int. 2004, 30, 701–720. [Google Scholar] [CrossRef] [PubMed]
- Zheng, L.; He, Z.; He, S. Detecting and Prioritizing Product Defects Using Social Media Data and the Two-Phased QFD Method. Comput. Ind. Eng. 2023, 177, 109031. [Google Scholar] [CrossRef]
- Neira-Rodado, D.; Ortíz-Barrios, M.; De la Hoz-Escorcia, S.; Paggetti, C.; Noffrini, L.; Fratea, N. Smart Product Design Process through the Implementation of a Fuzzy Kano-AHP-DEMATEL-QFD Approach. Appl. Sci. 2020, 10, 1792. [Google Scholar] [CrossRef]
- Shi, Y.; Peng, Q. A Spectral Clustering Method to Improve Importance Rating Accuracy of Customer Requirements in QFD. Int. J. Adv. Manuf. Technol. 2020, 107, 2579–2596. [Google Scholar] [CrossRef]
- Hermann, B.G.; Kroeze, C.; Jawjit, W. Assessing Environmental Performance by Combining Life Cycle Assessment, Multi-Criteria Analysis and Environmental Performance Indicators. J. Clean. Prod. 2007, 15, 1787–1796. [Google Scholar] [CrossRef]
- Toniolo, S.; Tosato, R.C.; Gambaro, F.; Ren, J. Life Cycle Thinking Tools: Life Cycle Assessment, Life Cycle Costing and Social Life Cycle Assessment. In Life Cycle Sustainability Assessment for Decision-Making; Elsevier: Amsterdam, The Netherlands, 2020; pp. 39–56. [Google Scholar]
- Liu, Z.; Chen, X.; Liang, X. Growable Design of Passenger Vehicle Interior Space Based on FAHP and FQFD. PLoS ONE 2024, 19, e0303233. [Google Scholar] [CrossRef]
- Arzoumanidis, I.; D’Eusanio, M.; Raggi, A.; Petti, L. Functional Unit Definition Criteria in Life Cycle Assessment and Social Life Cycle Assessment: A Discussion. In Perspectives on Social LCA; Springer: Berlin/Heidelberg, Germany, 2020; pp. 1–10. [Google Scholar]
- Zheng, X.; Easa, S.M.; Yang, Z.; Ji, T.; Jiang, Z. Life-Cycle Sustainability Assessment of Pavement Maintenance Alternatives: Methodology and Case Study. J. Clean. Prod. 2019, 213, 659–672. [Google Scholar] [CrossRef]
- Papa, I.; Panico, M.; Carandente, M.; Lopresto, V. Innovative Joining Technologies for Lightweight Material Vehicles. Proc. Inst. Mech. Eng. C J. Mech. Eng. Sci. 2024, 238, 5674–5684. [Google Scholar] [CrossRef]
- Lustig, W.P.; Mukherjee, S.; Rudd, N.D.; Desai, A.V.; Li, J.; Ghosh, S.K. Metal–Organic Frameworks: Functional Luminescent and Photonic Materials for Sensing Applications. Chem. Soc. Rev. 2017, 46, 3242–3285. [Google Scholar] [CrossRef]
- Gajdzik, B. Digital Transformation Towards Smart Steel Manufacturing; Springer Nature: Cham, Switzerland, 2025; ISBN 978-3-031-77755-4. [Google Scholar]
- Al, S.; Abdussakir, A.; Djakfar, M.; Al, S. The Effect of Product Knowledge and Service Quality on Customer Satisfaction. J. Asian Financ. Econ. Bus. 2021, 8, 927–938. [Google Scholar]
- Mu, E.; Pereyra-Rojas, M. Practical Decision Making, 1st ed.; Springer International Publishing: Cham, Switzerland, 2017; Volume 1, ISBN 978-3-319-33860-6. [Google Scholar]
- Kamvysi, K.; Tsironis, L.K.; Gotzamani, K. An Integrated QFD Framework for Smart City Strategy Development. TQM J. 2025, 37, 1203–1226. [Google Scholar] [CrossRef]
- Gómez, E.A.M.; Osorio, S.I.; Soriano, L.A.; Paredes, G.J.G.; Rubio, J.d.J. Exploring a Material-Focused Design Methodology: An Innovative Approach to Pressure Vessel Design. Machines 2024, 12, 81. [Google Scholar] [CrossRef]
- Pino-Servian, M.; de la Puente-Gil, Á.; Colmenar-Santos, A.; Rosales-Asensio, E. Applying QFD to the Vehicle Market Deployment Process. World Electr. Veh. J. 2025, 16, 285. [Google Scholar] [CrossRef]
- Joshi, A.; Kale, S.; Chandel, S.; Pal, D. Likert Scale: Explored and Explained. Br. J. Appl. Sci. Technol. 2015, 7, 396–403. [Google Scholar] [CrossRef]
- Yang, X.-S. Multi-Objective Optimization. In Nature-Inspired Optimization Algorithms; Elsevier: Amsterdam, The Netherlands, 2014; pp. 197–211. [Google Scholar]
- Kolman, R. Quality Engineering; PWE: Warsaw, Poland, 1992. (In Polish) [Google Scholar]
- Gajdzik, B.; Siwiec, D.; Wolniak, R.; Pacana, A. Approaching Open Innovation in Customization Frameworks for Product Prototypes with Emphasis on Quality and Life Cycle Assessment (QLCA). J. Open Innov. Technol. Mark. Complex. 2024, 10, 100268. [Google Scholar] [CrossRef]
- Kim, C.; Ludwig, C.; Park, S.; Im, C. Improvement of Tire Development Process Through Study of Tire Test Procedure and Vehicle Correlation. In Proceedings of the SAE Technical Papers; SAE: Warrendale, PA, USA, 2018; Volume 2018-April. [Google Scholar]
- Paramita Pattanaik, P.; Balu, V. Plus Size Tire: Effect on the Performance of the Vehicle. Mater. Today Proc. 2021, 81, 423–426. [Google Scholar] [CrossRef]
- Buadit, T.; Ussawarujikulchai, A.; Suchiva, K.; Papong, S.; Ma, H.-W.; Rattanapan, C. Environmental Impact of Passenger Car Tire Supply Chain in Thailand Using the Life Cycle Assessment Method. Sustain. Prod. Consum. 2023, 37, 156–168. [Google Scholar] [CrossRef]
- Dong, Y.; Zhao, Y.; Hossain, M.U.; He, Y.; Liu, P. Life Cycle Assessment of Vehicle Tires: A Systematic Review. Clean. Environ. Syst. 2021, 2, 100033. [Google Scholar] [CrossRef]
- Piotrowska, K.; Kruszelnicka, W.; Bałdowska-Witos, P.; Kasner, R.; Rudnicki, J.; Tomporowski, A.; Flizikowski, J.; Opielak, M. Assessment of the Environmental Impact of a Car Tire throughout Its Lifecycle Using the LCA Method. Materials 2019, 12, 4177. [Google Scholar] [CrossRef]
- Hennequin, T.; Huijbregts, M.A.J.; van Zelm, R. The Influence of Consumer Behavior on the Environmental Footprint of Passenger Car Tires. J. Ind. Ecol. 2023, 27, 96–109. [Google Scholar] [CrossRef]
- Siwiec, D.; Pacana, A.; Gazda, A. A New QFD-CE Method for Considering the Concept of Sustainable Development and Circular Economy. Energies. 2023, 16, 2474. [Google Scholar] [CrossRef]
- Pacana, A.; Siwiec, D. Method of Fuzzy Analysis of Qualitative-Environmental Threat in Improving Products and Processes (Fuzzy QE-FMEA). Materials 2023, 16, 1651. [Google Scholar] [CrossRef] [PubMed]
Disclaimer/Publisher’s Note: The statements, opinions and data contained in all publications are solely those of the individual author(s) and contributor(s) and not of MDPI and/or the editor(s). MDPI and/or the editor(s) disclaim responsibility for any injury to people or property resulting from any ideas, methods, instructions or products referred to in the content. |
© 2025 by the authors. Licensee MDPI, Basel, Switzerland. This article is an open access article distributed under the terms and conditions of the Creative Commons Attribution (CC BY) license (https://creativecommons.org/licenses/by/4.0/).