Abstract
Italy is a global top wine producer, with emphasis on high-quality wines. This study investigates the Carbon Footprint (CF), Water Footprint (WF), and Ecological Footprint (EF) of twelve red wine producers in Piedmont, Northern Italy. The analysis was based on a 0.75 L wine bottle as functional unit (FU). Twelve producers were interviewed and given questionnaires, which made it possible to gather primary data for the environmental evaluation that described vineyard and agricultural operations and wine production. The average CF was 0.88 ± 0.3 kg with 44% of CF associated with the glass bottle, 20% to the diesel fuel fed to the agricultural machines, 32% to electricity consumption, and 4% to other contributions. The average WF was 881 ± 252.4 L, with 98% Green WF due to evapotranspiration, and 2% Blue and Grey WF. The average EF was 81.3 ± 57.2 global ha, 73% ascribed to the vineyard area and 27% to CO2 assimilation. The obtained CF and WF values align with existing literature, while no comparison is possible for the EF data, which are previously unknown. To reduce the environmental impacts of wine production, actions like using recycled glass bottles, electric agricultural machines and renewable energy can help. However, high-quality wine production in Piedmont is deeply rooted in tradition and mostly managed by small producers. Further research should investigate the social acceptance of such actions, and policies supporting economic incentives could be key enablers.
1. Introduction
European policy initiatives foster biodiversity, sustainable agriculture, and the Circular Economy in the wine sector [1]. The European Commission (EC) enacted the Common Agricultural Policy (CAP) in 1962 [2] to support farmers, improve agricultural productivity and competitiveness [3], and ensure a sustainable management of natural resources [4] to mitigate climate change, emphasizing rural development. In the CAP Strategic Plan 2023–2027 [2], EC funding to support the wine sector amounts to 323.9 M Euro, with 5% of the total budget associated with environmental objectives, such as investments in wine farming. The System of National Integrated Quality Production (SQNPI) [5] established guidelines for obtaining Sustainability Certification for Wine, which is also promoted in the CAP. In Italy, the disciplinary (i.e., official document outlining the rules that ensure the authenticity and quality of wines, particularly those with protected designations like DOC, DOC) of the wine sector certification system was approved in March 2023 to support integrated production policies [6]. According to the OIV (International Organization of Vine and Wine) [7], the global vineyard area in 2022 was 7,254,512 ha, corresponding to 60.1% of wine grapes, 30.3% of table grapes, and 9.6% of grapes for drying. Italy is the first producer and exporter of wine in the world and the third consumer. In 2022, Italy produced 49,843 hL of wine from 718,198 hectares of vineyards, representing 19.3% of global wine production [7]. ISTAT, the Italian Institute for Statistics [8], reports that the northern regions of Italy produce more wine (56% of the total) than the Central, southern, and island regions combined (44%). Since 2009, all wines certified of high quality in Italy have been combined into a single denomination “Protected Designation of Origin” (DOP in Italian) [9]. However, the relevant specifications for wines that have obtained DOC (Controlled Designation of Origin) and DOCG (Controlled and Guaranteed Designation of Origin) quality certifications are still provided as reference [10]. In the European Union’s wine classification system, both DOC (Denominazione di Origine Controllata) and DOCG (Denominazione di Origine Controllata e Garantita) fall into the category of PDO (Protected Designation of Origin), as also defined by the European regulation adopted by the Italian government [11]. While both designations aim to protect the geographical origin and guarantee quality, DOCG represents the highest level of certification in Italian wine production. Wines marked with the DOCG mark must meet more stringent requirements, including a lower yield per hectare, longer mandatory ageing periods, and comprehensive chemical and organoleptic tests before placing on the market. In addition, DOCG wines are submitted to an official sensory evaluation by expert panels and must bear a numbered state seal for traceability. DOC wines, although subject to strict rules, are subject to slightly less restrictive controls and generally come from larger production areas. However, a constant quality over time and a strong territorial identity can allow a DOC wine to qualify for the DOCG status. Both classifications serve to guarantee the authenticity and typicality of Italian wines, supporting the preservation of the oenological heritage and giving consumers security. In the Northern region of Italy, 66% of production is related to high quality wine with DOP certification. According to the National Confederation of Voluntary Consortia for the Protection of Italian Wine Denominations [10], Piedmont, a region in Northwest Italy, has the highest number of DOCG wine labels, i.e., 41 DOC and 19 DOCG certifications in 2023, representing one-quarter of the total national DOCG labels [8]. Therefore, red wine produced in Piedmont can be globally considered a representative and significant example of high-quality wine.
Wine production involves multiple phases, including viticulture, winemaking, bottling, and packaging [12,13,14,15]. Grape cultivation implicates phytosanitary defence and plant nutrition [16]. After grapes are harvested, vinification starts right away, and the residues are composted and usually applied on the vineyard as fertilizer [17]. Bottling is environmentally significant, not for the operation itself but rather for the glass bottle (61% of CF) and label (35% of CF) [18]. In detail, using lighter glass bottles (−10% bottle weight) can save up to 0.43 kg CO2eq/bottle [16], and other materials such as PET [19] can reduce the associated environmental impacts by 21% [20]. The production and transport of the bottles to the winery also contribute to the overall environmental impacts [18]. Also, an increase in the use of recycled glass from 60% to 85% might result in an 11.1% reduction in the CF [16].
Literature extensively investigated the environmental aspects associated with wine production. A literature review performed on Scopus database with the keywords “wine” and “environmental assessment” in the period 2013–2024 provided 378 documents. A screening based on the consistency of the abstracts allowed to select 45 references. These have been categorized (Table 1) according to the type of publication (scientific article or review), geographical location, environmental assessment tool, functional unit, system boundaries applied, and main findings. About the type, there are 37 scientific articles and 8 review papers. These review papers focus on CF calculation applied to case studies in Europe, mostly in Italy, and show that red wine production is more impactful than white wine [21], and that environmental certifications can improve the sustainability of the wine sector [22]. With respect to WF, according to these review papers, the green component is prevalent [23,24].

Table 1.
Categorization of the references selected in the literature review (R: review paper, SA: scientific article, CF: carbon footprint, FU: functional unit, na: not available).
Almost all references in Table 1 considered “cradle to gate” system boundaries [16,33,48,49,55,56,58], 1 hectare of vineyard (3%) [32],, i.e., the environmental impacts were accounted from the vineyard to the wine bottles ready to be shipped to vendors or clients. Examples of the designated functional unit (FU) were a 0.75 L bottle of wine (58% of references) [19,33,34,50,52,57], 1 hectare of vineyard (3%) [32], 1 kg of grape (3%) [48], and a 0.125 L glass of wine (3%) [19], while in 14 references the FU was not disclosed. About localization, Italy hosted 53% of the analyzed case studies [13,24,28,36,45,46,58,59,60,61], few were reported in France [42], Spain [26,37,38], Portugal [55], Greece [43], Romania [35], and other countries [40,51], and 15% did not specify the localization [27,54].
A total of 40% of the references performed a Carbon Footprint (CF) analysis [21,37,42,53,55,58], 27% a Water Footprint (WF) assessment [23,29,40,50], and 15% both [30,32,55]. For instance, the CF and WF of 15 red wine production case studies in Italy have been assessed [33] obtaining an average value of 1.47 kg CO2eq/FU for CF and 666.7 L/FU for WF. In Brazil, white wine production has lower impact (−6%) than red wine [51]; conversely, in southern Europe, the production of white wine had a bigger impact than that of red wine [21]. Other studies compared the organic and traditional viticulture operations [62,63,64], achieving better performances for the organic one in C F (−16%) and WF: a reduction is observed for blue and grey water (respectively, −28% and −96%), while an increase is shown for green water (+6%)—implying a better use of the soil moisture along the growing period—compared to conventional agriculture.
The geographical context of the studies is a key factor [51], as the CF depends on energy consumption and the local energy mix [61]. CF and WF were the most used methodologies (82% of the references), and Life Cycle Assessment (LCA) methodology was applied in 18% of the case studies [20,45,49,57], while only 7% also applied Life Cycle Costing (LCC), showing a medium value of 1.75 €/bottle [33] or 2.48 €/bottle [18].
Based on the performed literature review, some knowledge gaps can be highlighted about the environmental assessment of wine as a product, as follows. Firstly, just few review papers have been published in the last 11 years, and most research articles applied single environmental assessment tools (mainly CF, WF, and LCA), providing specific and non-harmonized points of view to the topic. Secondly, none of the selected references applied the EF methodology, leaving unexplored the impacts of wine production on natural resources.
The main aim of this study is the preliminary investigation on the environmental performance of red wine produced in Piedmont (Northwest), an excellence in the global market. Based on a literature overview, the novelty of this work is (i) the application of EF tool within a cradle to gate system, from the vineyard to a 0.75 L bottle of wine; and (ii) the simultaneous application of carbon, water, and ecological footprint to the same case studies of red wine producers. The objective is to provide the outcomes of this environmental evaluation of CF, WF, and EF on red wine growers, offer different and complementing viewpoints, and, if feasible, compare them with existing literature to highlight bottlenecks and future trends to improve the sustainability of wine production.
2. Materials and Methods
2.1. Description of Case Studies
The analysis was based on 12 case studies of wine producers located in Piedmont, Italy (Figure 1). Specifically, the case studies are in the area defined Langhe and Roero and involved producers of DOC and DOCG red wines: Barolo, Barbera, Barbaresco, and Nebbiolo.
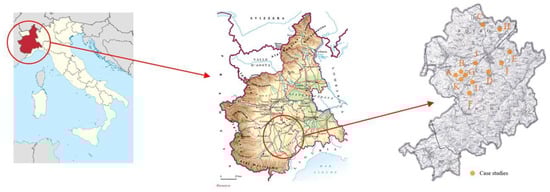
Figure 1.
Geographical location of the case studies.
The information used for the analysis was collected through the submission of a questionnaire (Table 2) (data collected from the different case studies are in Appendix A) to producers to collect primary data about the phases of the life cycle of wine production: (i) viticulture (hectares of vineyard cultivated, type of cultivation—i.e., conventional or organic, use of chemicals as copper oxide, nitrogen fertilizers, and pesticides, use of water for irrigation and of fuel for the agricultural machines), (ii) vinification (use of sulphur and sulphur dioxide, use of water and electricity in the cellar), and (iii) bottling (number of bottles produced per year, type and volume of the bottle, materials employed for the cap, e.g., aluminum and cork, and paper label). To ensure data consistency and comparability across producers, the questionnaire was designed with strict methodological standards. All quantitative responses were structured with mandatory units of measurement, such as litres, kilograms, grams, kilowatt-hours (kWh), hectares, and bottles per year, thereby avoiding ambiguities in data interpretation. Furthermore, a clear temporal reference was established for all questions, requiring respondents to report values corresponding to a specific production period. To minimize errors and facilitate subsequent data processing, open text fields were avoided for numerical inputs, which were instead constrained to predefined formats. In addition, several questions used categorical closed-ended responses, particularly for variables such as cultivation practices (e.g., conventional, organic), ensuring uniformity in classification and facilitating the analysis.
Table 2.
Questionnaire submitted to producers for data collection for analysis CF, WF, EF.
Conventional viticulture involves the use of synthetic agrochemicals such as fertilizers, herbicides, and systemic pesticides to optimize grape yield and manage biotic and abiotic stresses. In contrast, organic viticulture avoids the use of synthetic inputs and instead employs organic soil amendments, mechanical or manual weed control, and natural pest management strategies [63]. This approach aims to preserve soil biodiversity, enhance ecosystem services, and promote long-term sustainability in vineyard management. For instance, it has been detected that organic farming provides higher levels of polyphenols than conventional farming when it comes to wine manufacturing [64,65].
2.2. Methodologies Applied
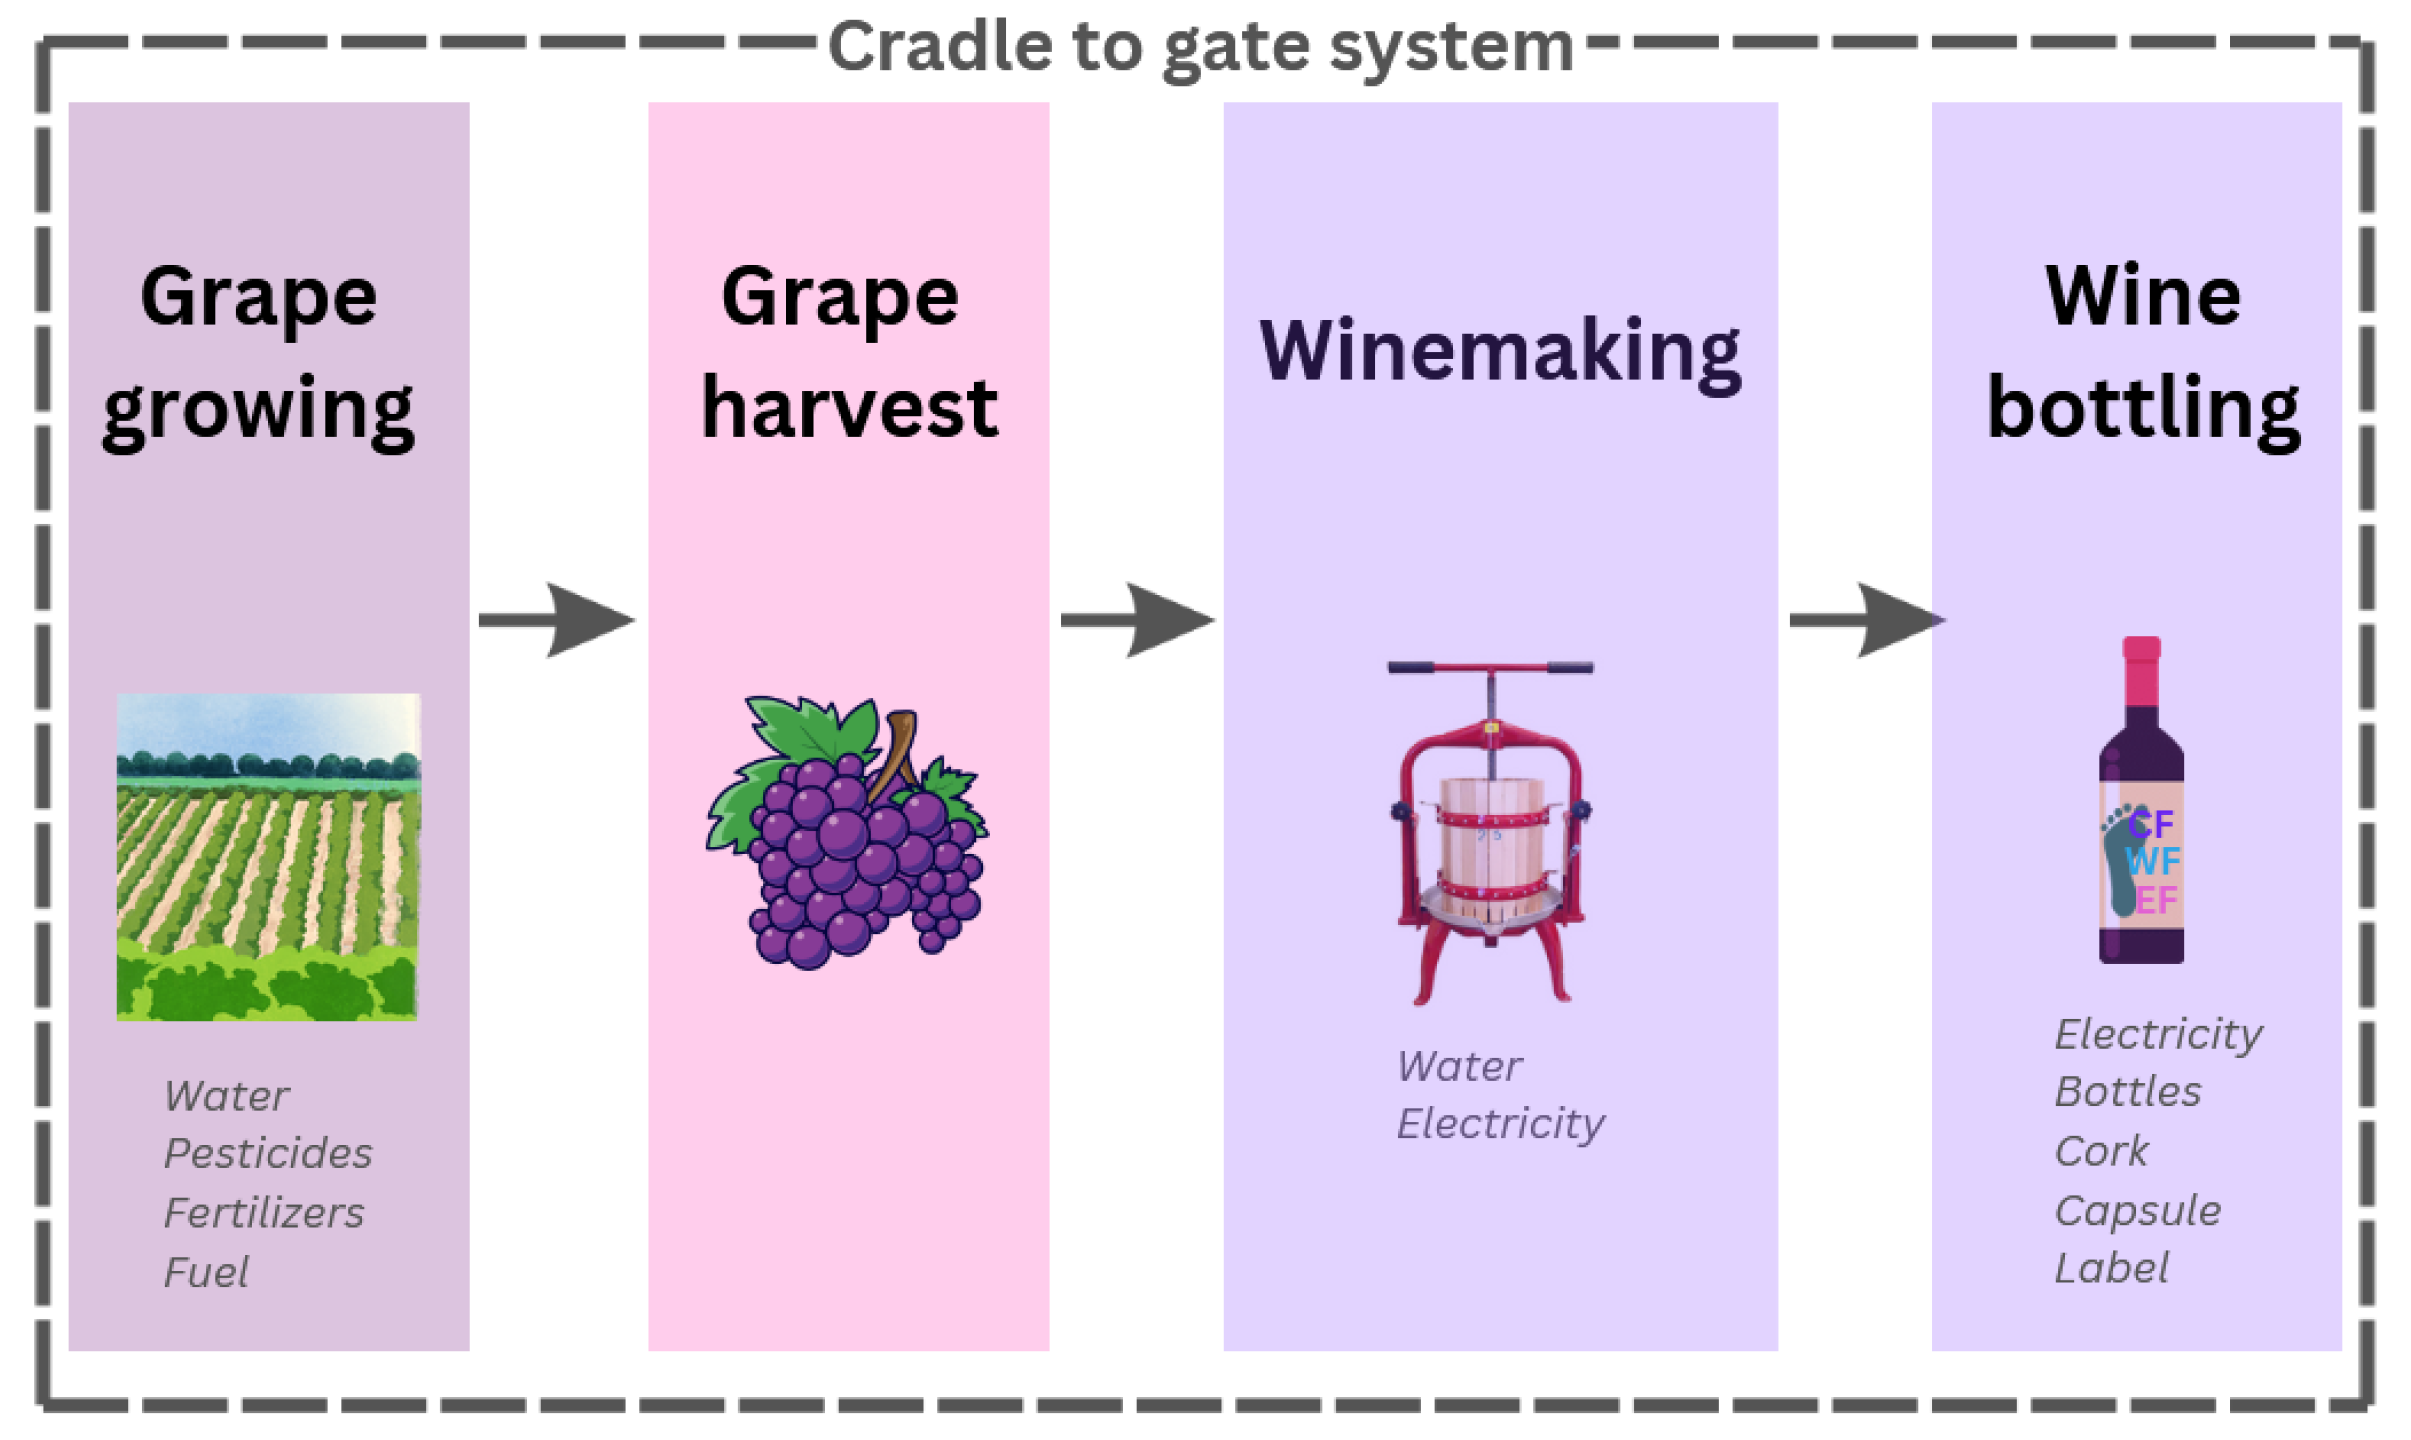
Based on the results of the literature review (Section 1), this study adopted a 0.75 L wine bottle as FU and “cradle to gate” system boundaries (Figure 2).

Figure 2.
System boundaries of the case studies.
The environmental assessment was performed through simultaneously application of CF, WF, and EF methodologies at all twelve case studies, as follows. CF is based on international standard ISO 14067 [66] and quantifies as both the direct and indirect Green House Gases (GHG) emissions associated with a specific product. CF calculation was based on the life cycle phases of wine production and the related materials mentioned in Section 2.1 and on the emission factors (Table 3) reported in the literature for an Italian case study [17] and followed Equation (1).
Ai represents the activity data, such as the quantity of a material used or energy consumed, and EFi is the corresponding emission factor, expressing the amount of CO2eq emitted per unit of that activity. The calculation of the Carbon Footprint includes all three emission contributions: biogenic, fossil, and land use change, in order to provide a complete assessment in line with current international guidelines.
Table 3.
Emission factors applied in the Carbon Footprint analysis [17].
WF is based on the international standard ISO 14046 [67] and measures water consumption throughout the entire production cycle [31,45] as sum of three sub-indicators: green (Green WF), blue (Blue WF) and grey (Grey WF) water footprints. Green WF accounts the rainwater stored in the soil through the roots of the plants and consumed through evapotranspiration () as in Equation (2) [30]:
based on the water stress coefficient (), wine crop coefficient (), and on daily reference evapotranspiration (). The average value of , for the examined area in Piedmont considered in this study is 480 mm/year [68]. Blue WF includes the surface and groundwater involved in the whole production process, from the vineyard to vinification and corresponds to water used for irrigation and to wash the machinery [29]. It should be mentioned that strict irrigation regulations are in force in high-quality certified wine production in Italy [69], e.g., irrigation is allowed only for young vines and in mature vineyard only in emergency conditions or more recently for causes associated with the drought brought on by climate change.
Grey WF is the amount of freshwater needed to retain the contaminants produced by human activities, considering both natural background concentrations and current environmental water quality regulations [24], as in Equation (3) [32]:
accounting for the Runoff coefficient (α), characteristic of the zone based on slope lithology and type of vegetation; the applied chemical rate () referred to the viticulture stage; and the contaminants’ concentration in the receiving water body where is the environmental quality water standard and is the baseline concentration present in the water body. Given the nature of the lithotypes present in the considered specific territory (very compact and poorly permeable soil) and the fact that the slopes of the vines were almost always found to be more than 10%, a Runoff coefficient of 0.82 was attributed to all the case studies examined [70]. A nitrogen fertilizer with of nitrate and was applied.
EF is an area-based indicator expressed in global hectares (gha) that quantifies the demand for resources from a population [71,72]. The ecological footprint of the vineyard is expressed in gha and based on the method of the calculated area [73] as in Equation (4).
T is the annual grape production (tons), is the local grape yield (t/ha), and YF is the global wine yield expressed by , where is the average Italian yield of wine cultivation [7]; EQF is the global equivalence factor, referring to different categories of the soil [73], and reflects the capacity of biological resources that each hectare of land can produce in relation to the relative productivity of the world average hectare [74,75]. A further contribution of the ecological footprint () is given by the area necessary to the assimilation of carbon dioxide produced in the total process and it is equivalent to the emissions converted into the area of forest needed for its sequestration through the use of the world average carbon adsorption factor [71].
2.3. Sensitivity Analysis
The results obtained through the Carbon Footprint (CF), Water Footprint (WF), and Ecological Footprint (EF) analyses were subjected to statistical evaluation to explore potential relationships and interdependencies among the variables. Specifically, Pearson’s bivariate correlation test was applied using Excel (Microsoft Office) to assess associations between these environmental impact indicators. This statistical approach allowed for the identification of significant correlations, providing insights into how changes in one parameter of footprint measure might influence the others. By leveraging Pearson’s test, the study aimed to enhance the robustness of the data interpretation, ensuring a more comprehensive understanding of the environmental implications assessed.
Therefore, it was decided to perform a sensitivity analysis on the Carbon Footprint, given that most of the overall water footprint impact comes from the green WF contribution and that for EF, the impact is primarily determined by land use and the size of the vineyards themselves. The sensitivity analysis was specifically conducted using five scenarios that modify the elements that significantly affect the overall Carbon Footprint.
3. Results
The 12 wine producers involved in this study have different features (Table 4): the vineyard areas ranging from 2 ha (Case K) to 50 ha (Case C) and production levels between 12,000 bottles (Case K) and 300,000 bottles annually (Case C). The average vineyard size was 16.7 ± 12.8 ha, producing 108.4 ± 84.6 t of grapes and 100,000 ± 79.92 bottles/year. Cases A, C, F, H, I, and K used organic practices, while others (Case B, D, E, G, J, L) employed conventional methods.
Table 4.
Features of considered case studies and results of the environmental footprints analysis referred to a 0.75 L red wine bottle (CF: carbon footprint, EF: ecological footprint, WF: water footprint, FU: functional unit, i.e., 0.75 L bottle).
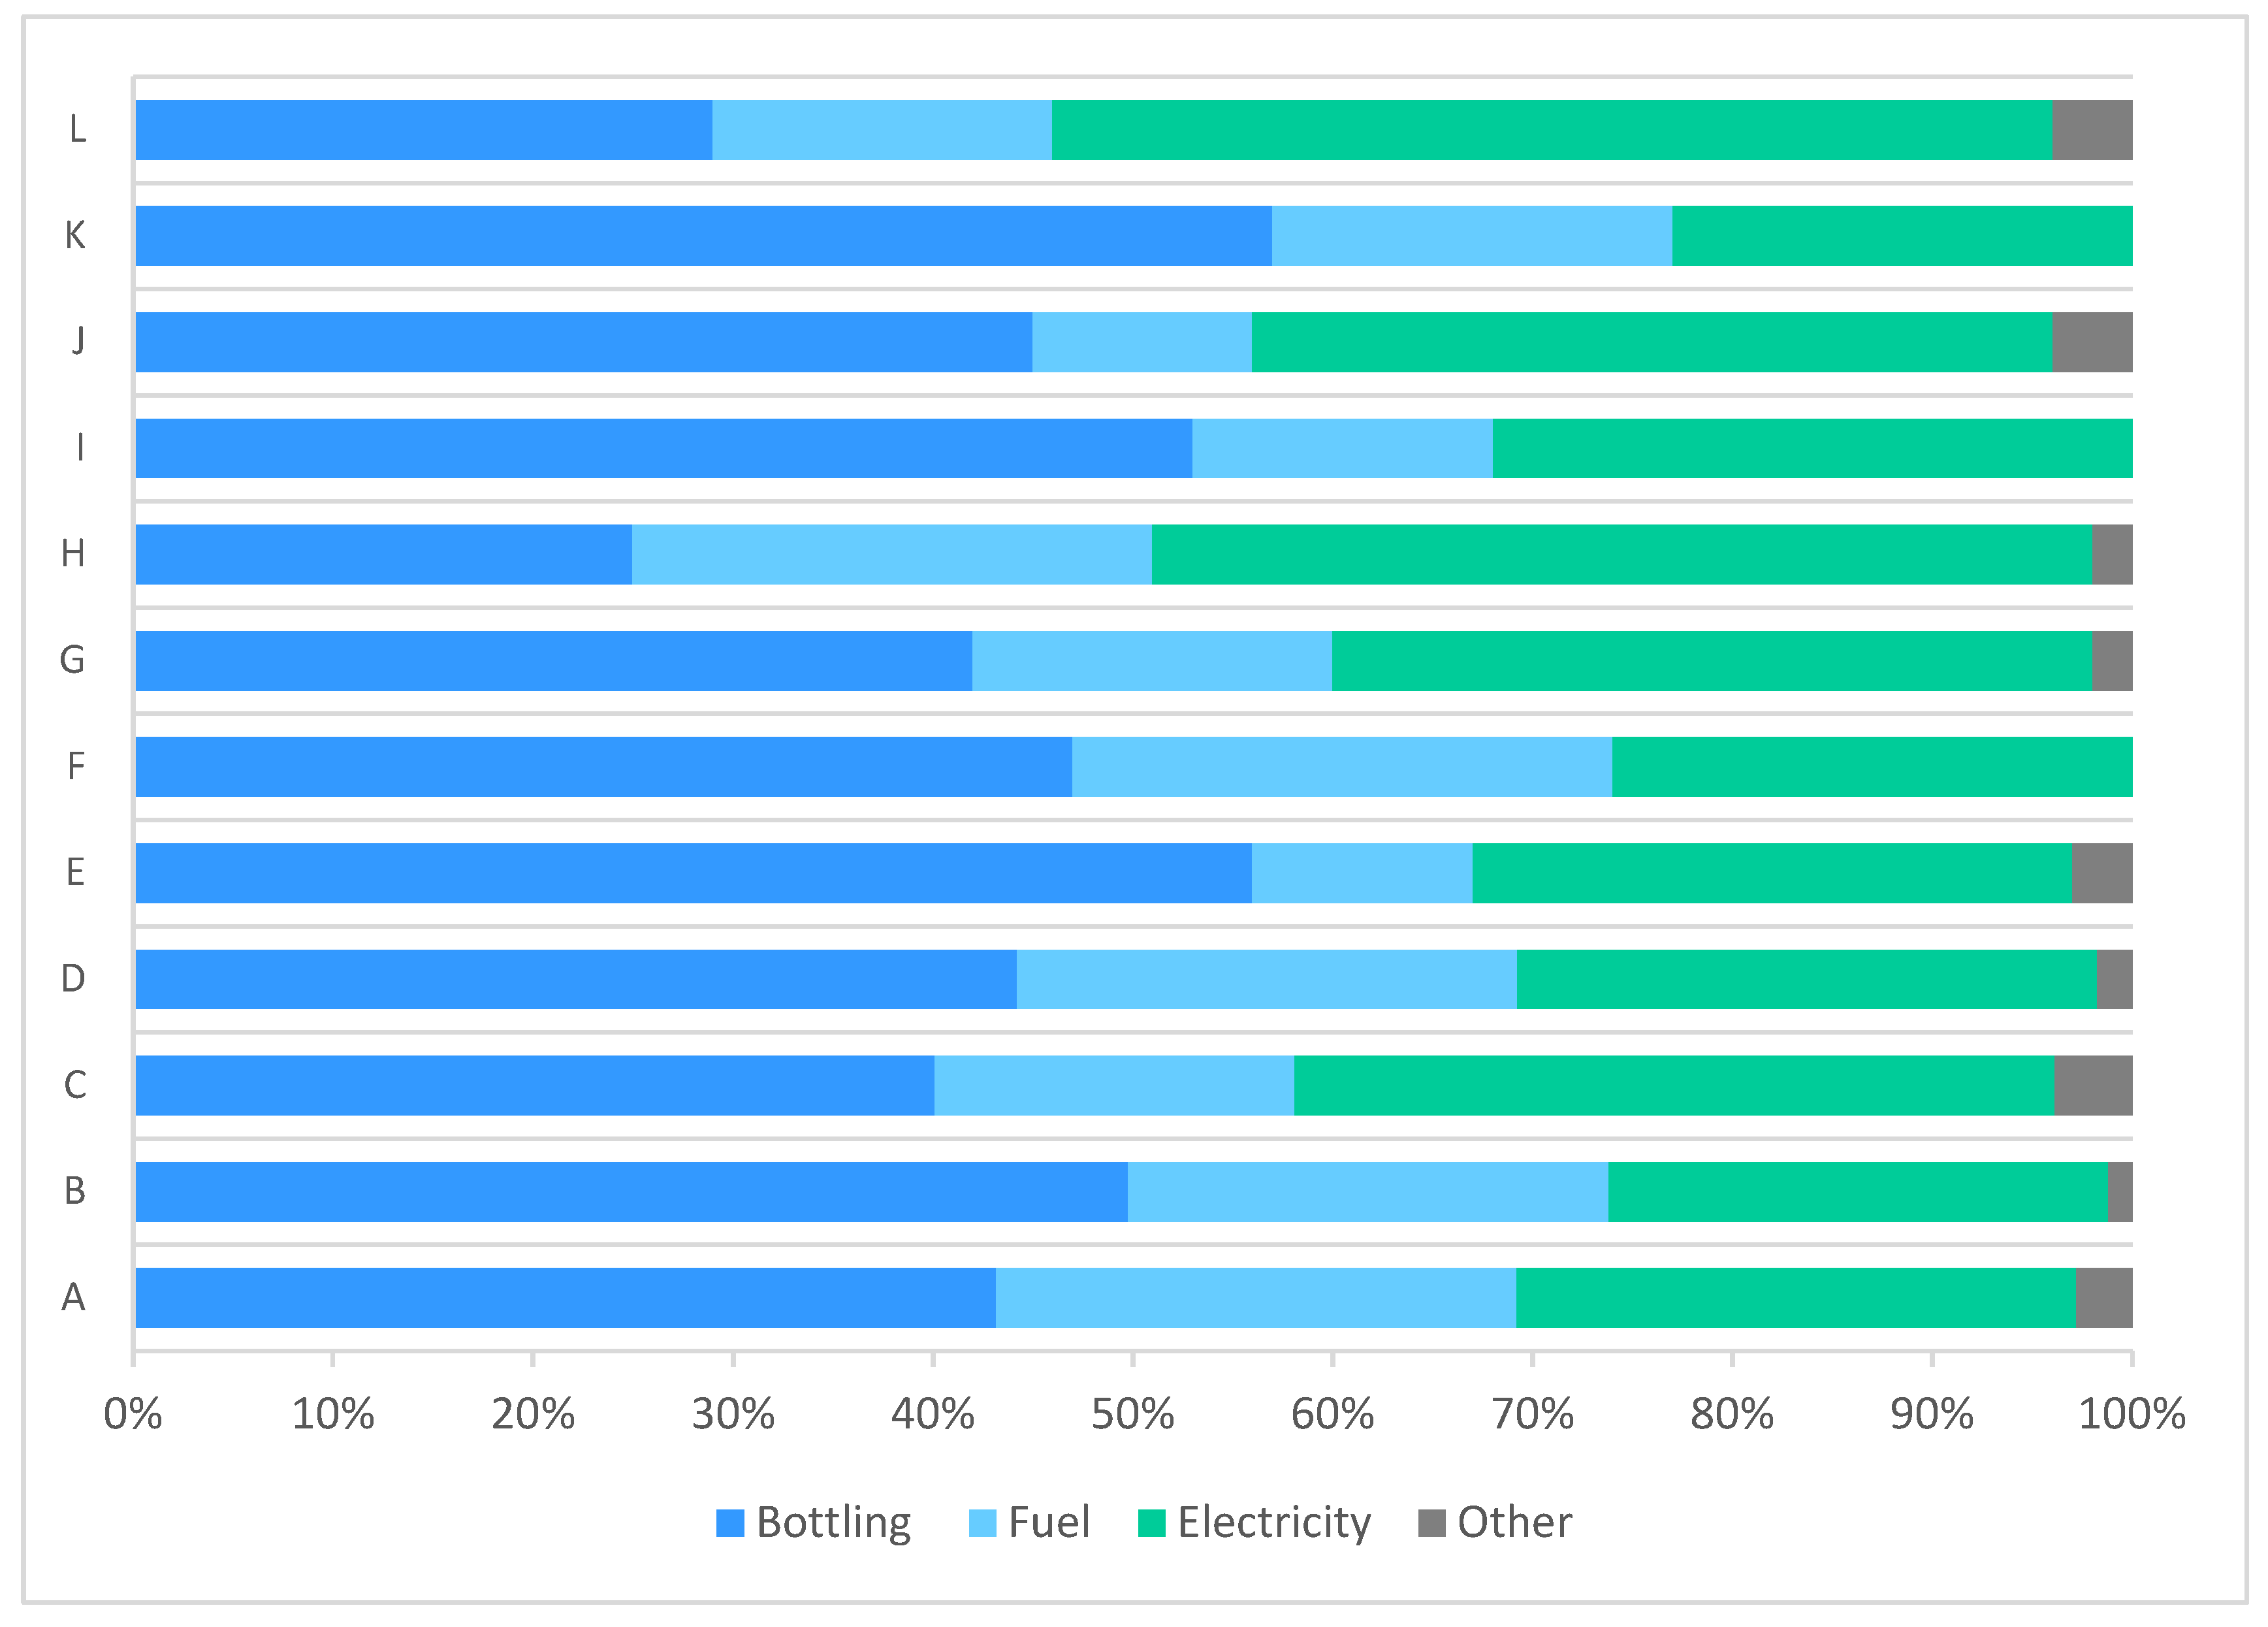
Considering the different contributions to the CF (Figure 3), bottling and specifically the glass bottle accounts for 44 ± 10% of the total footprint, and in viticulture, specifically the diesel fuel fed to agricultural equipment accounts for 20 ± 6%. Electric energy use during vinification accounts for 32 ± 7%, and other contributions (e.g., sulphides, copper oxide, sulphur dioxide) account for 4 ± 3%. Case studies using conventional agriculture, which is typified by a greater use of chemicals for agricultural techniques, had the greatest fertilizer content, like copper oxide. The average WF of the 12 case studies is 881 ± 252 L. This amount—considering the high standard deviation—is not unlike to literature data referred to Italy and a 0.75 L bottle of red wine, which are in the range 498–667 L [29,33,53], and consistent with the range 366–899 reported for Portugal [55]. About the various contributions to the WF (Figure 4), Green WF due to evapotranspiration is the prevalent component (98 ± 1.2%) compared to the sum of Blue and Grey WF (2 ± 1.7%) [23,24,29,31,35,45,55].
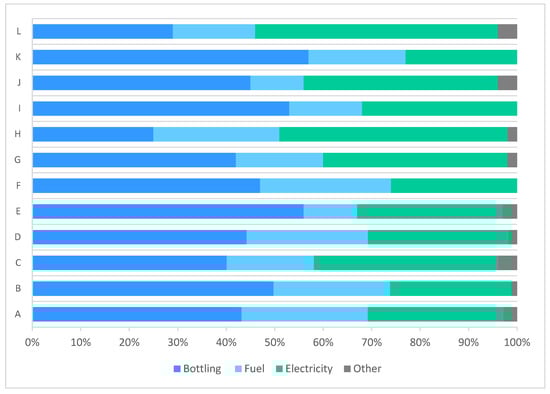
Figure 3.
Contributions to the Carbon Footprint of the 12 case studies associated with bottling, fuel fed to agricultural machines during viticulture, electricity used during vinification, and others (sulphides, copper oxide, sulphur dioxide).
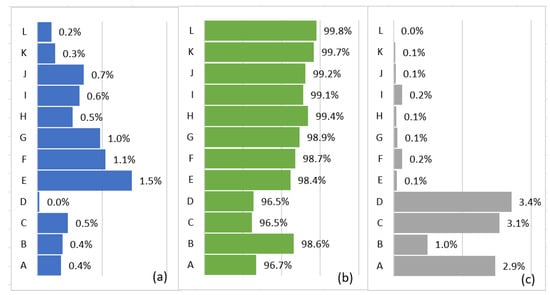
Figure 4.
Contributions to the Water Footprint (WF) of the 12 case studies: (a) Blue WF, (b) Green WF and (c) Grey WF.
The average EF was 81.3 ± 59.2 gha, with a range spanning from 9.46 to 231.2 gha (Figure 5). These results cannot be compared with literature data, as they are previously unknown. The average, 73 ± 3%, of the EF can be ascribed to the land assigned to the vineyard, while the 27 ± 3% to the area necessary for the assimilation of CO2 emissions. The minimum EF values calculated for Cases D and K are related with the small area of cultivated land, respectively, 5 and 2 hectares.
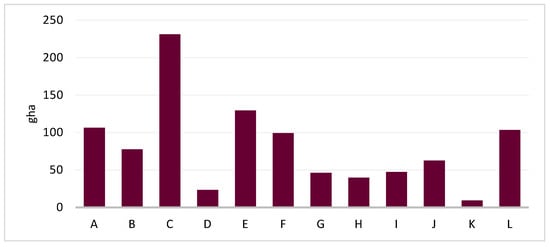
Figure 5.
Ecological Footprint (expressed in global hectars, gha) calculated for the 12 case studies.
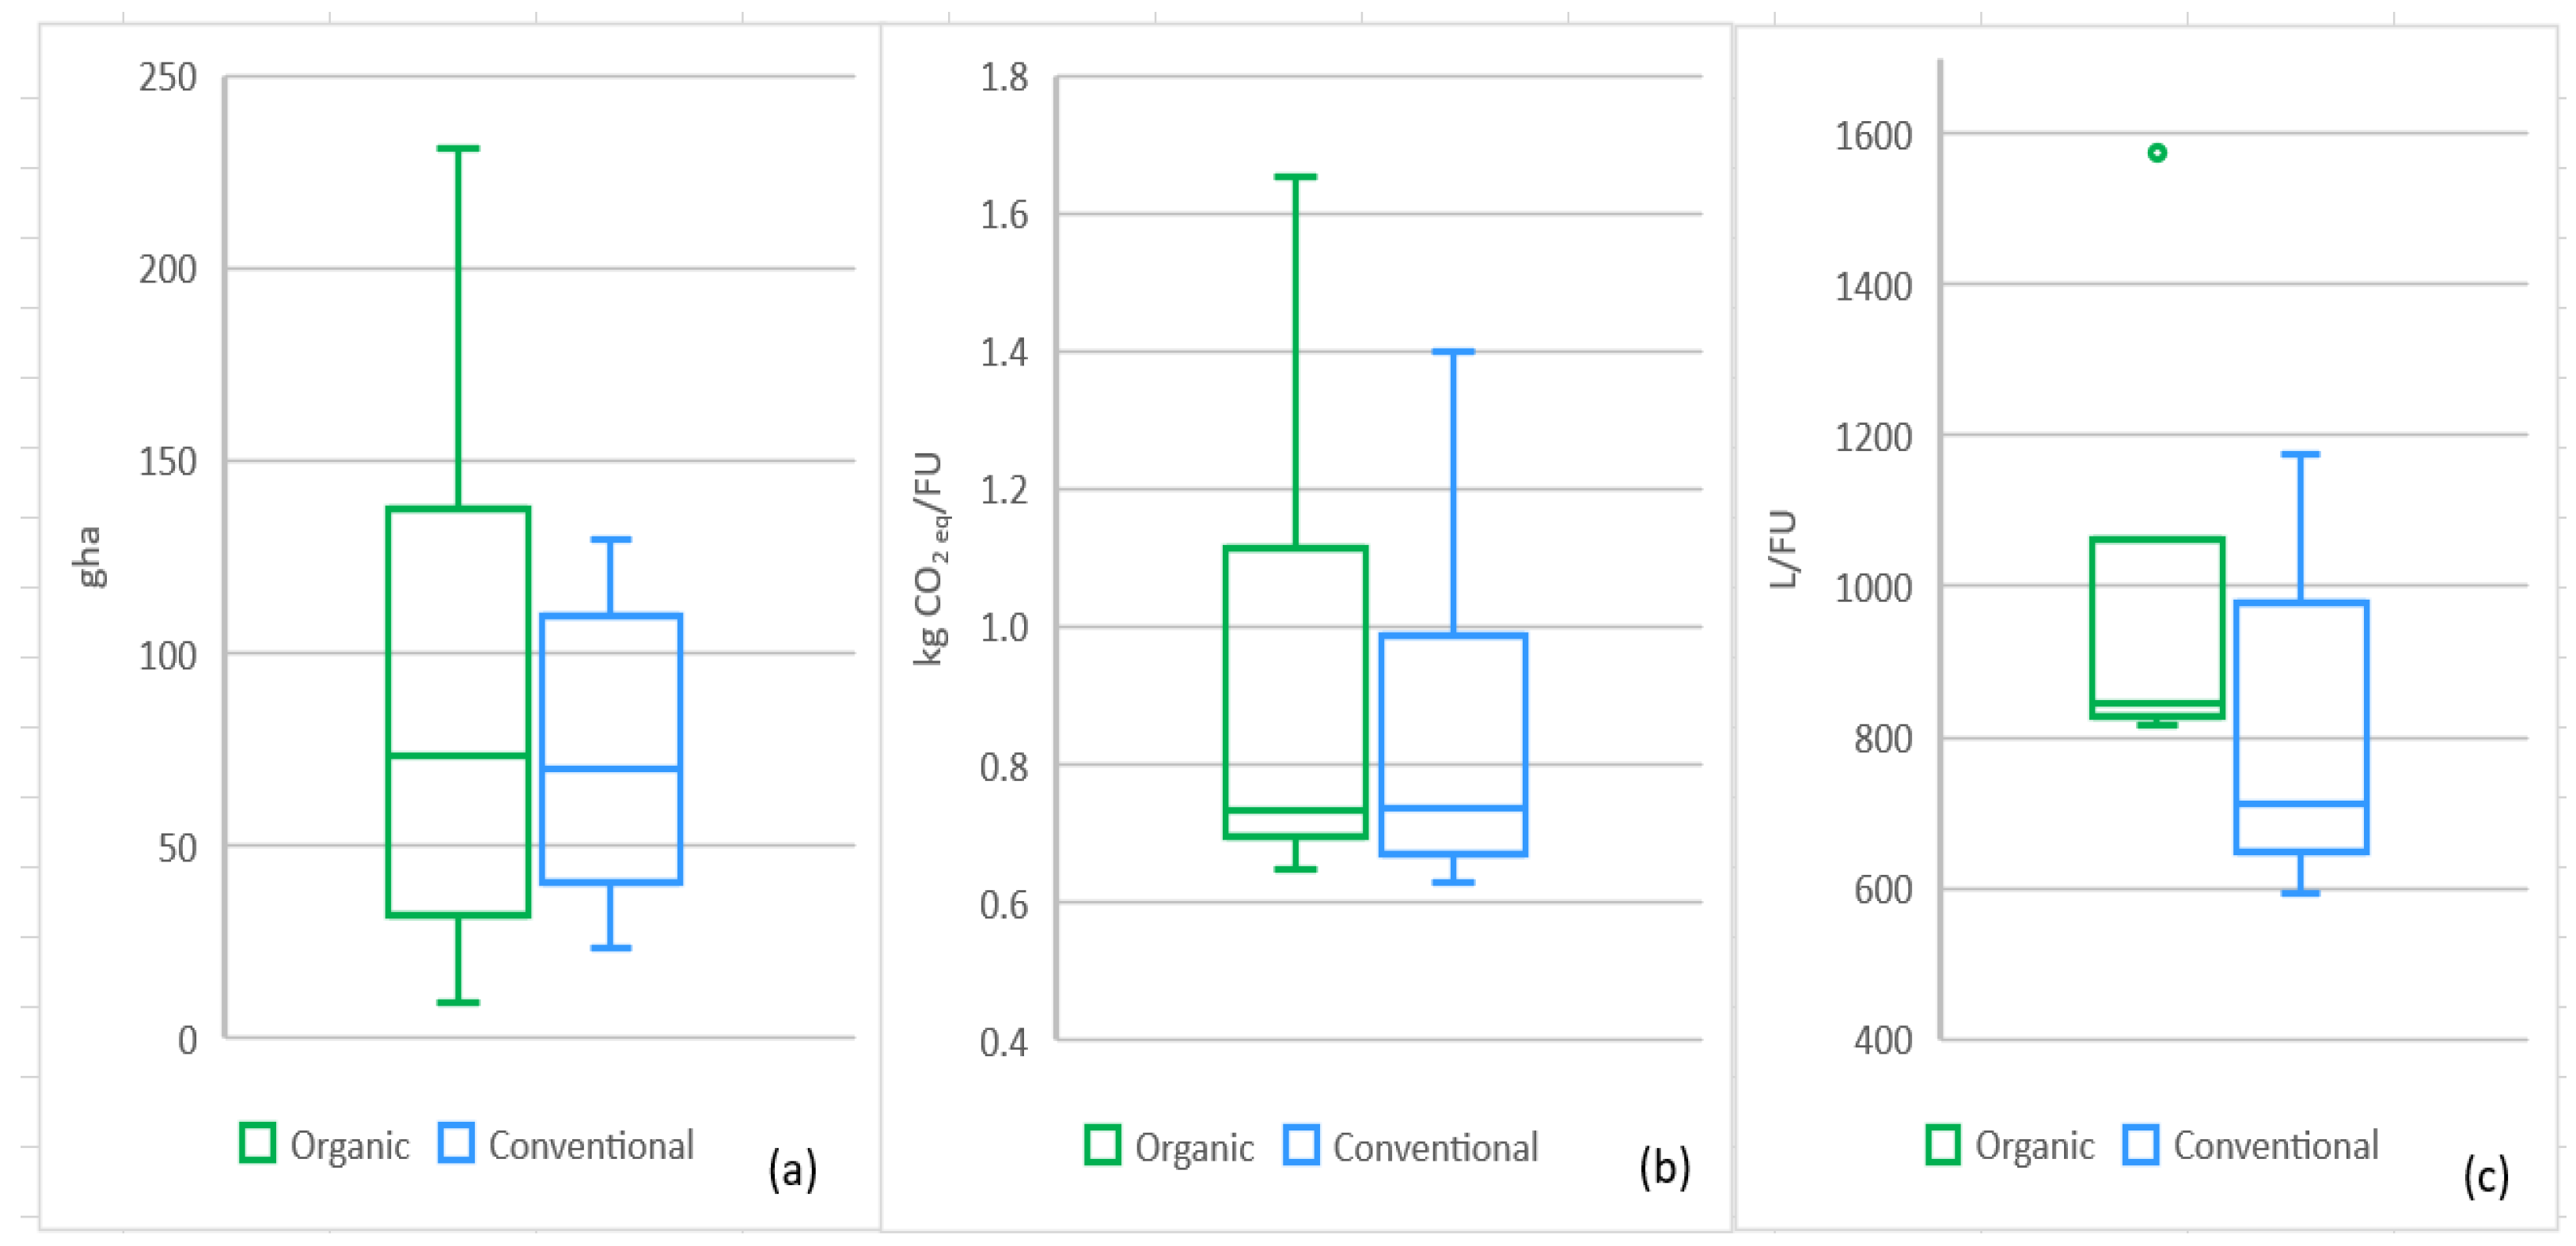
About the cultivation practices, the organic method (applied in 6 case studies out of 12) employs natural pesticides and plant growth regulators, produced through natural processes. The average CF calculated for the case studies implementing conventional agriculture operations (0.84 ± 0.3 kg CO2eq/bottle) is slightly lower than the CF calculated for the wine producers applying organic agriculture (0.92 ± 0.3 kg CO2eq/bottle) (Figure 6). On the other hand, even if the values are similar the ones presented in this study, another study [21] calculated for a 0.75 L red wine bottle derived from conventional agriculture a higher CF (1.25 kg CO2eq/bottle) compared to a bottle produced via organic agriculture (1.02 kg CO2eq/bottle). Overall, the results of the footprints analyses did not show any substantial variation based on the applied cultivation practices (Figure 3, Figure 4 and Figure 5). This is likely due to the dominant contributions identified through the footprints analyses, namely the production of the glass bottle for the CF, the Green WF due to evapotranspiration for the WF, and the significant requirement of land for vines cultivation for the EF.
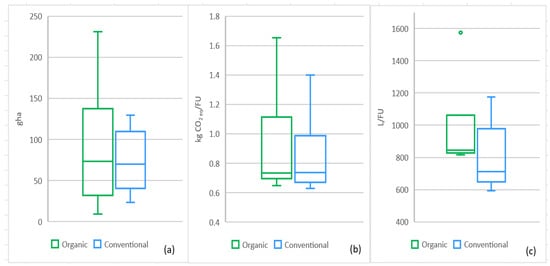
Figure 6.
Overall trend of (a) Ecological Footprint (EF), (b) Carbon Footprint (CF), and (c) Water Footprint (WF) within the 12 case studies comparing organic and conventional agricultural practices.
4. Discussions
Among the case studies, the largest Carbon Footprint value associated with bottling and electricity consumption during vinification are related to Cases E, I, and K. The Carbon Footprint values associated with fuel used during viticulture are related to Cases A, B, F and H, probably because the used farm equipment is most likely older and requires more energy. Literature reports highly variable data on the contributions to the Carbon Footprint of a 0.75 L bottle of red wine: packaging (18–25% of the total Carbon Footprint) [45,46], viticulture (15–50%) [17,27,45,46], and vinification (25–85%) [17,43,46], with detailed data about the contributions to the Carbon Footprint of agricultural fuel (8–19%) and of the chemicals applied in viticulture and vinification (4%) [16,33,45]. The only Carbon Footprint value obtained in this study that is higher than literature data is related to the glass bottle. This may be due to the type of bottle used by the considered producers, which is commonly associated in Italy with high-wine quality.
Out of all the many factors that contribute to the water footprint, evapotranspiration’s Green Water Footprint is the most common (98 ± 1.2%), while the combined Blue and Grey WF (2 ± 1.7%) are the least common. Case studies A, B, C, and D exhibit the largest share of Grey WF. Case study E displays the largest contribution to Blue WF, as a significant cellar phase contribution. The values calculated as contributions to the WF are consistent with literature, reporting shares of the Green WF in the range 81–98% [23,24,29,31,35,44,55].
A previous study [51] investigated the correlation between the results obtained applying CF and WF to red wine production in Portugal and found a linear correlation between the CF and the Blue WF, suggesting that an increase in the impact of global warming is correlated to a rise in volume of freshwater used and then its blue water footprint. A correlation analysis of the Carbon Footprint, Water Footprint, and Ecological Footprint values obtained for the 12 case studies considered in this study revealed a moderate correlation (Pearson’s r-index r = 0.54) between the contribution of the bottling phase and the total CF, and a strong correlation between the contribution of electricity and fuel consumption and the total CF (r = 0.83 and r = 0.97, respectively). Regarding the Water Footprint, the analysis shows a very strong linear correlation (r = 0.99) between the Green WF and the total Water Footprint. For the Ecological Footprint assessment, all components showed a strong correlation with an index r > 0.9.
Sensitivity Analysis
Since the main impact of the total water footprint comes from the green WF contribution, while for EF, land management and vineyard extent play a dominant role, a sensitivity analysis was conducted on the carbon footprint. By examining the factors that have the greatest influence on the overall impact of the same CF—fuel consumption and electricity—the sensitivity analysis of the CF has been carried out. France was specifically selected for two reasons: France’s energy mix differs greatly from Italy’s, and France is the second-largest producer of wine in Europe, with quantitatively equivalent production [7]. The Italian energy mix [76] in the year analyzed in this study is equal to 42% renewable sources, 43% natural gas, 8% natural coal, 4% nuclear, and 3% other sources [77] represented as follows: 71% nuclear, 21% renewable sources, and 8% fossil. This leads to a varied emission factor value, which in turn affects the overall effect in terms of electricity-related kg CO2 equivalent.
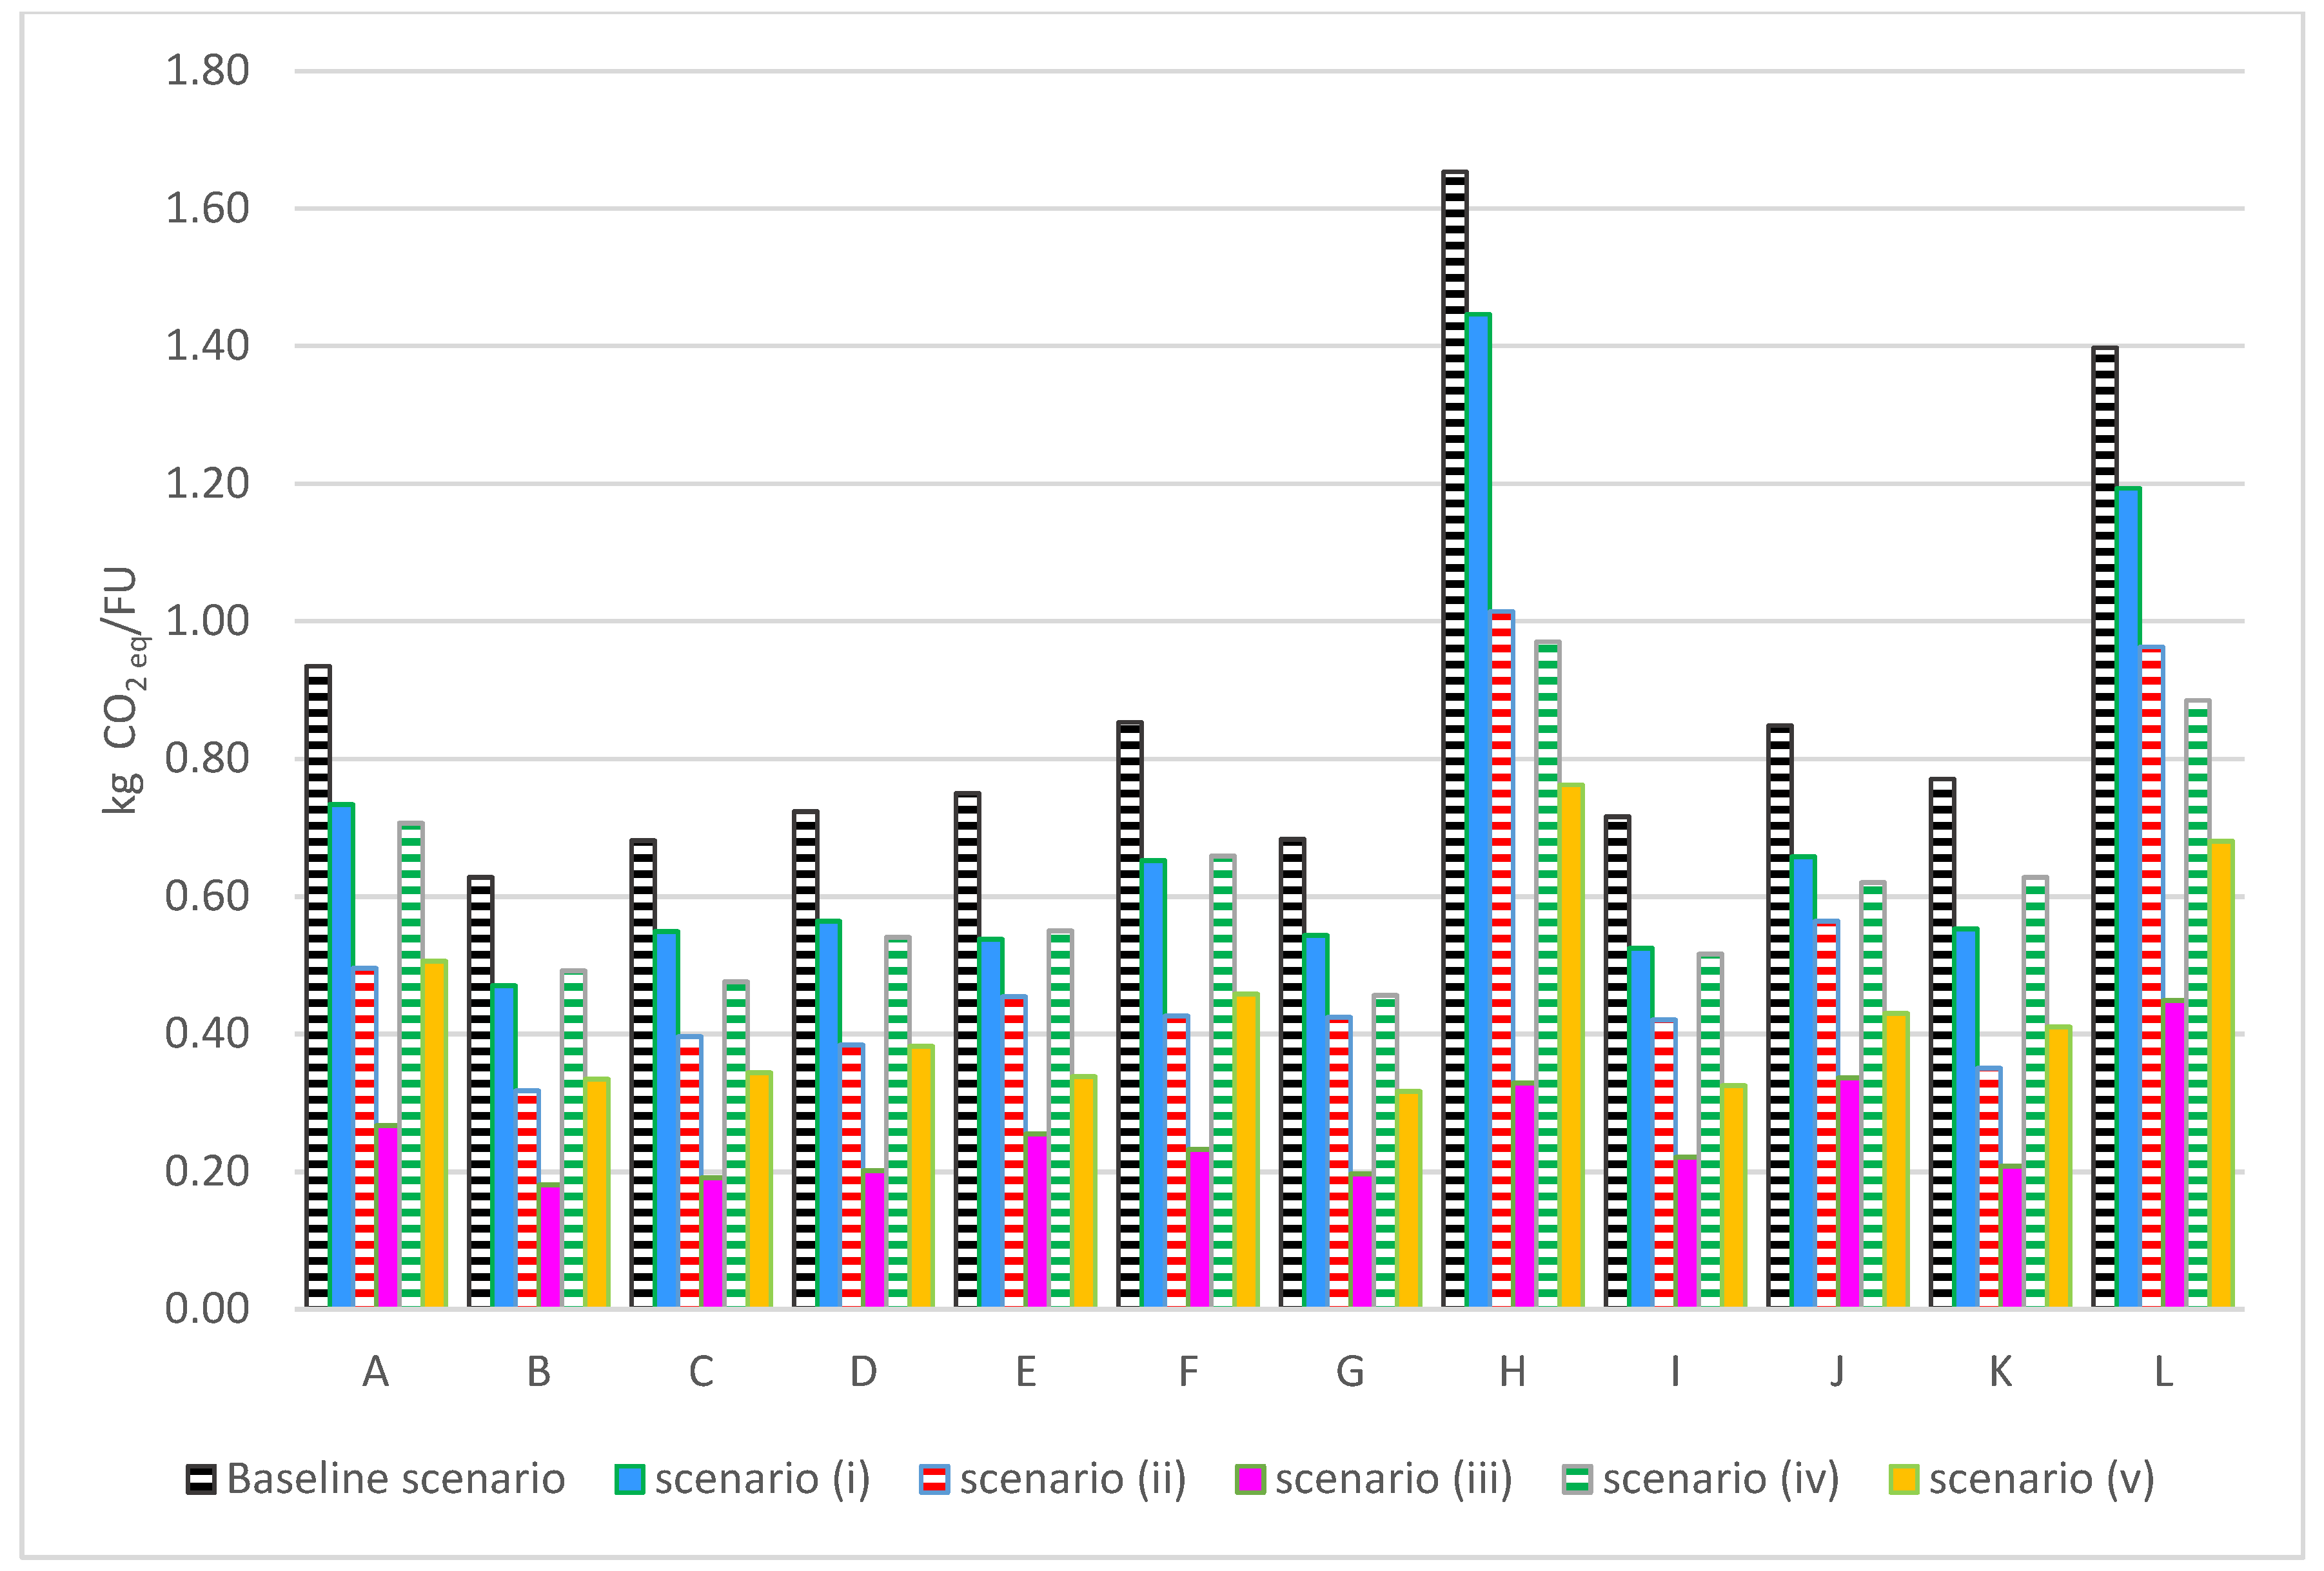
Precisely, five possible scenarios (Table 5) were used to conduct the sensitivity analysis: the baseline scenario calculation of CF of this study, (i) the same production process of this study located in France; (ii) process located in Italy using recycled glass and electric tractor for agricultural practices; (iii) process located in France using recycled glass and electric tractor for agricultural practices; (iv) use of recycled glass for the production of the glass bottle; (iii) process using recycled glass with the process in France. Figure 7 illustrates the results of the sensitivity analysis. The scenarios associated with the case studies in Italy (Baseline, Scenario ii, and Scenario iv) are shown with a dashed texture, while those related to France (Scenario i, Scenario iii, and Scenario v) are depicted in with a full-colour texture. The graph clearly indicates that the overall carbon footprint is consistently lower in the French scenarios compared to the Italian ones. This difference is primarily attributed to the distinct national energy mixes, which influence the emission factors used in the carbon footprint calculation. Notably, a substantial reduction, with respect to the baseline scenario, in impact is observed when recycled glass is used (scenario iv and scenario v): −22.0 ± 4.7% for Italy and −49.9 ± 3.4% for France. The environmental benefit becomes even more pronounced when the use of electric agricultural machinery is introduced, eliminating emissions associated with diesel fuel consumption. In fact, in the most favourable scenarios (scenario ii and scenario iii)—combining recycled glass and electric vehicles—the total carbon footprint is reduced by an average of −46.6 ± 6.7% in Italy and −70.6 ± 4.5% in France compared to the baseline scenario.
Table 5.
Definition of different scenarios for sensitivity analysis of Carbon Footprint.

Figure 7.
Overall trend of different scenarios assumed for all case studies of the analysis: baseline scenario: calculation of the CF of this study; (i) the same production process of this study located in France; (ii) process located in Italy using recycled glass and electric tractor for agricultural practices, (iii) Process located in France using recycled glass and electric tractor for agricultural practices; (iv) use of recycled glass for the production of the glass bottle; (v) process using recycled glass with the process in France.
5. Conclusions
The wine industry plays a significant role in both the global food distribution market and wines are increasingly being examined from an environmental perspective. Within this study, every single 0.75 L bottle of red wine is associated with an average Carbon Footprint equal to 0.88 ± 0.3 Kg , a Water Footprint equal to 881.2 ± 263.6 L, and an Ecological Footprint equal to 81.3 ± 59.7 gha. The major contributor of the Carbon Footprint is the bottling phase, e.g., the production of the glass bottle accounts for 39–69% of emissions per bottle. The glass bottle associated with quality wine has a long history that is deep-rooted in the Italian culture, and as of now, there is unfortunately no viable substitute for preserving properly the wine’s quality. To cut the overall carbon footprint emission by up to 40%, a possible solution would be using a thinner glass bottle [16]. A recent study [37] confirmed this perspective, evidencing that the Carbon Footprint of a 0.42 kg bottle (0.513 kg is lower compared to a 0.65 kg bottle (0.721 kg In relation to the Water Footprint analysis, the Green Water contribution is prevalent (98 ± 1.2%) of the total Water Footprint) compared to the Blue and Grey Water inputs. This is due to the amount of water used by the vines through evapotranspiration, and this finding is consistent with the results of the Ecological Footprint analysis. Only 27% of the Ecological Footprint is related to the area needed for the assimilation of carbon dioxide emissions, while the remaining 73% is associated with the land area hosting the vineyard. The Carbon and Water Footprint results achieved in this study align with the existing literature. However, any other Ecological Footprint results are available in the literature for a comparison with the data presented in this study. In conclusion, the wine sector has great significance for the history and traditions of a country and for its economy. From an environmental point of view there are operations that can be implemented to mitigate the environmental impacts of the wine sector (e.g., adopting glass bottles made of recycled glass and electric agricultural machines and using electric energy deriving from renewable energy sources) without sacrificing the intrinsic characteristics of all small producers of high-quality wine.
Author Contributions
Conceptualization, S.F. and I.O.; methodology, S.F. and I.O.; validation, I.O. and M.T.; formal analysis, I.O. and M.C.; investigation, M.C.; data curation, I.O. and M.C.; writing—original draft preparation, I.O.; writing—review and editing, S.F. and M.T.; visualization, I.O.; supervision, S.F.; funding acquisition, S.F. All authors have read and agreed to the published version of the manuscript.
Funding
This study was carried out within the Agritech National Research Center and received funding from the European Union Next-GenerationEU (PIANO NAZIONALE DI RIPRESA E RESILIENZA (PNRR)—MISSIONE 4 COMPONENTE 2, INVESTIMENTO 1.4—D.D. 1032 17/06/2022, CN00000022). This manuscript reflects only the authors’ views and opinions, neither the European Union nor the European Commission can be considered responsible for them.
Institutional Review Board Statement
Not applicable.
Informed Consent Statement
Not applicable.
Data Availability Statement
Data will be made available on request.
Conflicts of Interest
The authors declare no conflict of interest.
Abbreviations
The following abbreviations are used in this manuscript:
| CAP | Common Agricultural Policy |
| UE | European Union |
| CF | Carbon Footprint |
| WF | Water Footprint |
| EF | Ecological Footprint |
| FU | Functional Unit |
| SQNPI | System of National Integrated Quality Production |
| OIV | International Organization of Vine and Wine |
| ISTAT | Italian Institute for Statistics |
| DOC | Controlled Designation of Origin |
| DOCG | Controlled and Guaranteed Designation of Origin |
| R | Review paper |
| SA | Scientific article |
Appendix A
Table A1.
Questionnaire produced by the different case studies.
Table A1.
Questionnaire produced by the different case studies.
| Case Study A | Quantity | Unit |
|---|---|---|
| Hectares cultivated | 22 | ha |
| Quantity of grapes harvested | 135,000 | kg |
| Number of bottles produced annually | 110,000 | - |
| Applied agricultural practice (organic/conventional) | organic | - |
| Quantity of copper oxide | 3.5 | kg/ha |
| Quantity of sulphides | 110 | kg/ha |
| Quantity of sulphur dioxide | 25 | kg |
| Quantity of nitrogen fertilisers applied | 8000 | kg |
| Weight of the glass bottle | 0.55 | kg |
| Weight of the bottle cap | 4.4 | g |
| Weight of the PVC capsule | na | g |
| Weight of the aluminum capsule | 3.3 | g |
| Weight of the label | 2 | g |
| Fuel used | 7281.2 | L |
| Electricity consumption | 44,100 | kWh |
| Number of pesticide applications | 9 | - |
| Average volume of water used for pesticide dilution | 36 | m3 |
| Water consumption in the cellar | 323.1 | m3 |
| Case Study B | Quantity | Unit |
| Hectares cultivated | 16 | ha |
| Quantity of grapes harvested | 128,500 | kg |
| Number of bottles produced annually | 120,000 | - |
| Applied agricultural practice (organic/conventional) | conventional | - |
| Quantity of copper oxide | 4.6 | kg/ha |
| Quantity of sulphides | 30.7 | kg/ha |
| Quantity of sulphur dioxide | 71 | kg |
| Quantity of nitrogen fertilisers applied | 0.48 | kg |
| Weight of the glass bottle | 0.45 | kg |
| Weight of the bottle cap | 4.4 | g |
| Weight of the PVC capsule | na | g |
| Weight of the aluminum capsule | 3.3 | g |
| Weight of the label | 2 | g |
| Fuel used | 5100 | L |
| Electricity consumption | 28,594 | kWh |
| Number of pesticide applications | 14 | - |
| Average volume of water used for pesticide dilution | 1.9 | m3 |
| Water consumption in the cellar | 28.4 | m3 |
| Case Study C | Quantity | Unit |
| Hectares cultivated | 16 | ha |
| Quantity of grapes harvested | 128,500 | kg |
| Number of bottles produced annually | 120,000 | - |
| Applied agricultural practice (organic/conventional) | conventional | - |
| Quantity of copper oxide | 4.6 | kg/ha |
| Quantity of sulphides | 30.7 | kg/ha |
| Quantity of sulphur dioxide | 71 | kg |
| Quantity of nitrogen fertilisers applied | 0.48 | kg |
| Weight of the glass bottle | 0.45 | kg |
| Weight of the bottle cap | 4.4 | g |
| Weight of the PVC capsule | na | g |
| Weight of the aluminum capsule | 3.3 | g |
| Weight of the label | 2 | g |
| Fuel used | 5100 | L |
| Electricity consumption | 28,594 | kWh |
| Number of pesticide applications | na | - |
| Average volume of water used for pesticide dilution | 105 | m3 |
| Water consumption in the cellar | 1100 | m3 |
| Case Study D | Quantity | Unit |
| Hectares cultivated | 5 | ha |
| Quantity of grapes harvested | 30,000 | kg |
| Number of bottles produced annually | 28,000 | - |
| Applied agricultural practice (organic/conventional) | conventional | - |
| Quantity of copper oxide | 5 | kg/ha |
| Quantity of sulphides | 50 | kg/ha |
| Quantity of sulphur dioxide | 15 | kg |
| Quantity of nitrogen fertilisers applied | 1.25 | kg |
| Weight of the glass bottle | 0.45 | kg |
| Weight of the bottle cap | 4.4 | g |
| Weight of the PVC capsule | 3.3 | g |
| Weight of the aluminum capsule | no | g |
| Weight of the label | 2 | g |
| Fuel used | 1600 | L |
| Electricity consumption | 9000 | kWh |
| Number of pesticide applications | 2 | - |
| Average volume of water used for pesticide dilution | 0.4 | m3 |
| Water consumption in the cellar | 8 | m3 |
| Case Study E | Quantity | Unit |
| Hectares cultivated | 26 | ha |
| Quantity of grapes harvested | 193,000 | kg |
| Number of bottles produced annually | 180,000 | - |
| Applied agricultural practice (organic/conventional) | conventional | - |
| Quantity of copper oxide | 3 | kg/ha |
| Quantity of sulphides | 90 | kg/ha |
| Quantity of sulphur dioxide | 15 | kg |
| Quantity of nitrogen fertilisers applied | 0.78 | kg |
| Weight of the glass bottle | 0.6 | kg |
| Weight of the bottle cap | 4.4 | g |
| Weight of the PVC capsule | 3.3 | g |
| Weight of the aluminum capsule | no | g |
| Weight of the label | 2 | g |
| Fuel used | 5000 | L |
| Electricity consumption | 63,831 | kWh |
| Number of pesticide applications | 8 | - |
| Average volume of water used for pesticide dilution | 0.2 | m3 |
| Water consumption in the cellar | 1900 | m3 |
| Case Study F | Quantity | Unit |
| Hectares cultivated | 20 | ha |
| Quantity of grapes harvested | 128,000 | kg |
| Number of bottles produced annually | 120,000 | - |
| Applied agricultural practice (organic/conventional) | organic | - |
| Quantity of copper oxide | 3.8 | kg/ha |
| Quantity of sulphides | 4 | kg/ha |
| Quantity of sulphur dioxide | 0.15 | kg |
| Quantity of nitrogen fertilisers applied | 15,000 | kg |
| Weight of the glass bottle | 0.58 | kg |
| Weight of the bottle cap | 4.4 | g |
| Weight of the PVC capsule | 3.3 | g |
| Weight of the aluminum capsule | no | g |
| Weight of the label | 2 | g |
| Fuel used | 9000 | L |
| Electricity consumption | 60,616 | kWh |
| Number of pesticide applications | 14 | - |
| Average volume of water used for pesticide dilution | 5.6 | m3 |
| Water consumption in the cellar | 1049 | m3 |
| Case Study G | Quantity | Unit |
| Hectares cultivated | 9 | ha |
| Quantity of grapes harvested | 81,000 | kg |
| Number of bottles produced annually | 76,000 | - |
| Applied agricultural practice (organic/conventional) | conventional | - |
| Quantity of copper oxide | 3.6 | kg/ha |
| Quantity of sulphides | 4.2 | kg/ha |
| Quantity of sulphur dioxide | na | kg |
| Quantity of nitrogen fertilisers applied | 7000 | kg |
| Weight of the glass bottle | 0.54 | kg |
| Weight of the bottle cap | 4.4 | g |
| Weight of the PVC capsule | 3.3 | g |
| Weight of the aluminum capsule | no | g |
| Weight of the label | 2 | g |
| Fuel used | 3500 | L |
| Electricity consumption | 35,000 | kWh |
| Number of pesticide applications | 6 | - |
| Average volume of water used for pesticide dilution | 6.4 | m3 |
| Water consumption in the cellar | 500 | m3 |
| Case Study H | Quantity | Unit |
| Hectares cultivated | 8 | ha |
| Quantity of grapes harvested | 27,000 | kg |
| Number of bottles produced annually | 25,000 | - |
| Applied agricultural practice (organic/conventional) | organic | - |
| Quantity of copper oxide | 1.5 | kg/ha |
| Quantity of sulphides | 36 | kg/ha |
| Quantity of sulphur dioxide | na | kg |
| Quantity of nitrogen fertilisers applied | 3210 | kg |
| Weight of the glass bottle | 0.4 | kg |
| Weight of the bottle cap | 4.4 | g |
| Weight of the PVC capsule | 3.3 | g |
| Weight of the aluminum capsule | no | g |
| Weight of the label | 2 | g |
| Fuel used | 3000 | L |
| Electricity consumption | 37,899 | kWh |
| Number of pesticide applications | 2 | - |
| Average volume of water used for pesticide dilution | 1 | m3 |
| Water consumption in the cellar | 486 | m3 |
| Case Study I | Quantity | Unit |
| Hectares cultivated | 10 | ha |
| Quantity of grapes harvested | 64,000 | kg |
| Number of bottles produced annually | 60,000 | - |
| Applied agricultural practice (organic/conventional) | organic | - |
| Quantity of copper oxide | 3.8 | kg/ha |
| Quantity of sulphides | 39 | kg/ha |
| Quantity of sulphur dioxide | na | kg |
| Quantity of nitrogen fertilisers applied | 2000 | kg |
| Weight of the glass bottle | 0.57 | kg |
| Weight of the bottle cap | 4.4 | g |
| Weight of the PVC capsule | 3.3 | g |
| Weight of the aluminum capsule | no | g |
| Weight of the label | 2 | g |
| Fuel used | 3000 | L |
| Electricity consumption | 30,000 | kWh |
| Number of pesticide applications | 2 | - |
| Average volume of water used for pesticide dilution | 1 | m3 |
| Water consumption in the cellar | 200 | m3 |
| Case Study J | Quantity | Unit |
| Hectares cultivated | 12 | ha |
| Quantity of grapes harvested | 91,000 | kg |
| Number of bottles produced annually | 85,000 | - |
| Applied agricultural practice (organic/conventional) | conventional | - |
| Quantity of copper oxide | 354 | kg/ha |
| Quantity of sulphides | na | kg/ha |
| Quantity of sulphur dioxide | na | kg |
| Quantity of nitrogen fertilisers applied | 520 | kg |
| Weight of the glass bottle | 0.55 | kg |
| Weight of the bottle cap | 4.4 | g |
| Weight of the PVC capsule | no | g |
| Weight of the aluminum capsule | 3.3 | g |
| Weight of the label | 2 | g |
| Fuel used | 2600 | L |
| Electricity consumption | 34,000 | kWh |
| Number of pesticide applications | 2 | - |
| Average volume of water used for pesticide dilution | na | m3 |
| Water consumption in the cellar | 400 | m3 |
| Case Study K | Quantity | Unit |
| Hectares cultivated | 2 | ha |
| Quantity of grapes harvested | 13,000 | kg |
| Number of bottles produced annually | 12,000 | - |
| Applied agricultural practice (organic/conventional) | organic | - |
| Quantity of copper oxide | 3.5 | kg/ha |
| Quantity of sulphides | 2.4 | kg/ha |
| Quantity of sulphur dioxide | na | kg |
| Quantity of nitrogen fertilisers applied | na | kg |
| Weight of the glass bottle | 0.54 | kg |
| Weight of the bottle cap | 4.4 | g |
| Weight of the PVC capsule | 3.3 | g |
| Weight of the aluminum capsule | no | g |
| Weight of the label | 2 | g |
| Fuel used | 500 | L |
| Electricity consumption | 3000 | kWh |
| Number of pesticide applications | 2 | - |
| Average volume of water used for pesticide dilution | 0 | m3 |
| Water consumption in the cellar | 0.05 | m3 |
| Case Study L | Quantity | Unit |
| Hectares cultivated | 20 | ha |
| Quantity of grapes harvested | 90,000 | kg |
| Number of bottles produced annually | 84,000 | - |
| Applied agricultural practice (organic/conventional) | conventional | - |
| Quantity of copper oxide | 2.5 | kg/ha |
| Quantity of sulphides | 50 | kg/ha |
| Quantity of sulphur dioxide | 0.5 | kg |
| Quantity of nitrogen fertilisers applied | na | kg |
| Weight of the glass bottle | 0.58 | kg |
| Weight of the bottle cap | 4.4 | g |
| Weight of the PVC capsule | 3.3 | g |
| Weight of the aluminum capsule | no | g |
| Weight of the label | 2 | g |
| Fuel used | 6500 | L |
| Electricity consumption | 75,000 | kWh |
| Number of pesticide applications | 11 | - |
| Average volume of water used for pesticide dilution | 22 | m3 |
| Water consumption in the cellar | 190 | m3 |
References
- Kuo, T.C.; Chen, H.Y.; Chong, B.; Lin, M. Cost benefit analysis and carbon footprint of biogas energy through life cycle assessment. Clean. Environ. Syst. 2024, 15, 100240. [Google Scholar] [CrossRef]
- European Commission. Common Agricultural Policy: 2023-27. 2023. Available online: http://agriculture.ec.europa.eu/common-agricultural-policy/cap-overview/cap-2023-27_en (accessed on 16 February 2025).
- Gasso, V.; Barber, A.; Moller, H.; Bayonne, E.; Oudshoorn, F.W.; Sørensen, C.G. Benchmarking for locally tuned sustainability: The case of energy and water use in New Zealand vineyards. Environ. Sustain. Indic. 2025, 25, 100536. [Google Scholar] [CrossRef]
- Grigoroudis, E.; Kouikoglou, V.S.; Phillis, Y.A. Agricultural sustainability assessment and national policy-making using an axiomatic mathematical model. Environ. Sustain. Indic. 2024, 22, 100401. [Google Scholar] [CrossRef]
- CREA. 2022. Available online: https://www.csqa.it/en-us/certificazioni/agroalimentare/sqnpi-produzione-integrata (accessed on 16 February 2025).
- GAZZETTA UFFICIALE. Data about Agricultural Policy Laws. 2023. Available online: https://www.gazzettaufficiale.it/atto/serie_generale/caricaDettaglioAtto/originario?atto.dataPubblicazioneGazzetta=2025-06-13&atto.codiceRedazionale=25A03350&elenco30giorni=false (accessed on 16 February 2025).
- OIV. World Wine Production Outlook OIV First Estimates. International Organization of Vine and Wine. 2022. Available online: https://www.oiv.int/sites/default/files/documents/OIV_World_Wine_Production_Outlook_2023_2.pdf (accessed on 16 February 2025).
- ISTAT. Data about Statics on Wine Production. 2022. Available online: http://dati.istat.it/index.aspx?queryid=33706 (accessed on 16 February 2025).
- Ministero Della Giustizia. 2023. Available online: https://www.gazzettaufficiale.it/eli/id/2023/06/06/23A03238/SG (accessed on 16 February 2025).
- FEDERDOC. Data About High-Quality Italian Wine. 2023. Available online: https://www.federdoc.com (accessed on 16 February 2025).
- MASAF Data About High-Quality Italian Wine Regulation. Available online: https://www.masaf.gov.it/flex/cm/pages/ServeBLOB.php/L/IT/IDPagina/4625 (accessed on 16 May 2025).
- Casolani, N.; D’EUsanio, M.; Liberatore, L.; Raggi, A.; Petti, L. Life Cycle Assessment in the wine sector: A review on inventory phase. J. Clean. Prod. 2022, 379, 134404. [Google Scholar] [CrossRef]
- Iannone, R.; Miranda, S.; Riemma, S.; De Marco, I. Life cycle assessment of red and white wines production in southern Italy. Chem. Eng. Trans. 2014, 39, 595–600. [Google Scholar] [CrossRef]
- Salomé, C.; Coll, P.; Lardo, E.; Metay, A.; Villenave, C.; Marsden, C.; Blanchart, E.; Hinsinger, P.; Le Cadre, E. The soil quality concept as a framework to assess management practices in vulnerable agroecosystems: A case study in Mediterranean vineyards. Ecol. Indic. 2016, 61, 456–465. [Google Scholar] [CrossRef]
- Tsarouhas, P.; Papachristos, I. Environmental assessment of ouzo production in Greece: A Life Cycle Assessment approach. Clean. Environ. Syst. 2021, 3, 100044. [Google Scholar] [CrossRef]
- Vinci, G.; Prencipe, S.A.; Abbafati, A.; Filippi, M. Environmental Impact Assessment of an Organic Wine Production in Central Italy: Case Study from Lazio. Sustainability 2022, 14, 15483. [Google Scholar] [CrossRef]
- Chiriacò, M.V.; Belli, C.; Chiti, T.; Trotta, C.; Sabbatini, S. The potential carbon neutrality of sustainable viticulture showed through a comprehensive assessment of the greenhouse gas (GHG) budget of wine production. J. Clean. Prod. 2019, 225, 435–450. [Google Scholar] [CrossRef]
- Mura, R.; Vicentini, F.; Botti, L.M.; Chiriacò, M.V. Achieving the circular economy through environmental policies: Packaging strategies for more sustainable business models in the wine industry. Bus. Strat. Environ. 2024, 33, 1497–1514. [Google Scholar] [CrossRef]
- Massaglia, S.; Verduna, T.; Varchetta, V.; Brun, F.; Blanc, S. The impact of alternative packaging on the life cycle of wine on tap. Wine Econ. Policy 2023, 12, 51–62. [Google Scholar] [CrossRef]
- Letamendi, J.; Sevigne-Itoiz, E.; Mwabonje, O. Environmental impact analysis of a Chilean organic wine through a life cycle assessment. J. Clean. Prod. 2022, 371, 133368. [Google Scholar] [CrossRef]
- Tsalidis, G.A.; Kryona, Z.P.; Tsirliganis, N. Selecting south European wine based on carbon footprint. Resour. Environ. Sustain. 2022, 9, 100066. [Google Scholar] [CrossRef]
- Pattara, C.; Russo, C.; Antrodicchia, V.; Cichelli, A. Carbon footprint as an instrument for enhancing food quality: Overview of the wine, olive oil and cereals sectors. J. Sci. Food Agric. 2017, 97, 396–410. [Google Scholar] [CrossRef]
- Aivazidou, E.; Tsolakis, N. A water footprint review of Italian wine: Drivers, barriers, and practices for sustainable stewardship. Water 2020, 12, 369. [Google Scholar] [CrossRef]
- Miglietta, P.P.; Morrone, D. Managing water sustainability: Virtual water flows and economic water productivity assessment of the wine trade between Italy and the Balkans. Sustainability 2018, 10, 543. [Google Scholar] [CrossRef]
- Aivazidou, E.; Tsolakis, N.; Vlachos, D.; Iakovou, E. A water footprint management framework for supply chains under green market behaviour. J. Clean. Prod. 2018, 197, 592–606. [Google Scholar] [CrossRef]
- Ayuda, M.I.; Esteban, E.; Martín-Retortillo, M.; Pinilla, V. The blue water footprint of the Spanish wine industry: 1935–2015. Water 2020, 12, 1872. [Google Scholar] [CrossRef]
- Baiano, A. An overview on sustainability in the wine production chain. Beverages 2021, 7, 15. [Google Scholar] [CrossRef]
- Galletto, L.; Barisan, L. Carbon Footprint as a Lever for Sustained Competitive Strategy in Developing a Smart Oenology: Evidence from an Exploratory Study in Italy. Sustainability 2019, 11, 1483. [Google Scholar] [CrossRef]
- Bonamente, E.; Scrucca, F.; Asdrubali, F.; Cotana, F.; Presciutti, A. The water footprint of the wine industry: Implementation of an assessment methodology and application to a case study. Sustainability 2015, 7, 12190–12208. [Google Scholar] [CrossRef]
- Rinaldi, S.; Bonamente, E.; Scrucca, F.; Merico, M.C.; Asdrubali, F.; Cotana, F. Water and carbon footprint of wine: Methodology review and application to a case study. Sustainability 2016, 8, 621. [Google Scholar] [CrossRef]
- Borsato, E.; Giubilato, E.; Zabeo, A.; Lamastra, L.; Criscione, P.; Tarolli, P.; Marinello, F.; Pizzol, L. Comparison of Water-focused Life Cycle Assessment and Water Footprint Assessment: The case of an Italian wine. Sci. Total Environ. 2019, 666, 1220–1231. [Google Scholar] [CrossRef] [PubMed]
- Borsato, E.; Zucchinelli, M.; D’AMmaro, D.; Giubilato, E.; Zabeo, A.; Criscione, P.; Pizzol, L.; Cohen, Y.; Tarolli, P.; Lamastra, L.; et al. Use of multiple indicators to compare sustainability performance of organic vs conventional vineyard management. Sci. Total Environ. 2020, 711, 135081. [Google Scholar] [CrossRef]
- D’Ammaro, D.; Capri, E.; Valentino, F.; Grillo, S.; Fiorini, E.; Lamastra, L. A multi-criteria approach to evaluate the sustainability performances of wines: The Italian red wine case study. Sci. Total Environ. 2021, 799, 149446. [Google Scholar] [CrossRef]
- D’Ammaro, D.; Capri, E.; Valentino, F.; Grillo, S.; Fiorini, E.; Lamastra, L. Benchmarking of carbon footprint data from the Italian wine sector: A comprehensive and extended analysis. Sci. Total Environ. 2021, 779, 146416. [Google Scholar] [CrossRef]
- Ene, S.A.; Teodosiu, C.; Robu, B.; Volf, I. Water footprint assessment in the winemaking industry: A case study for a Romanian medium size production plant. J. Clean. Prod. 2013, 43, 122–135. [Google Scholar] [CrossRef]
- Frasnetti, E.; Ravaglia, P.; D’AMmaro, D.; Capri, E.; Lamastra, L. Can Italian wines outperform European benchmarks in environmental impact? An examination through the product environmental footprint method. Sci. Total Environ. 2024, 919, 170630. [Google Scholar] [CrossRef]
- García, J.G.; Castellanos, B.G.; García, B.G. Economic and Environmental Assessment of the Wine Chain in Southeastern Spain. Agronomy 2023, 13, 1478. [Google Scholar] [CrossRef]
- Gueddari-Aourir, A.; García-Alaminos, A.; García-Yuste, S.; Alonso-Moreno, C.; Canales-Vázquez, J.; Zafrilla, J. The carbon footprint balance of a real-case wine fermentation CO2 capture and utilization strategy. Renew. Sustain. Energy Rev. 2022, 157, 112058. [Google Scholar] [CrossRef]
- Guerra, M.; Ferreira, F.; Oliveira, A.A.; Pinto, T.; Teixeira, C.A. Drivers of Environmental Sustainability in the Wine Industry: A Life Cycle Assessment Approach. Sustainability 2024, 16, 5613. [Google Scholar] [CrossRef]
- Herath, I.; Green, S.; Horne, D.; Singh, R.; McLaren, S.; Clothier, B. Water footprinting of agricultural products: Evaluation of different protocols using a case study of New Zealand wine. J. Clean. Prod. 2013, 44, 159–167. [Google Scholar] [CrossRef]
- Iannone, R.; Miranda, S.; Riemma, S.; De Marco, I. Improving environmental performances in wine production by a life cycle assessment analysis. J. Clean. Prod. 2016, 111, 172–180. [Google Scholar] [CrossRef]
- Jradi, S.; Chameeva, T.B.; Delhomme, B.; Jaegler, A. Tracking carbon footprint in French vineyards: A DEA performance assessment. J. Clean. Prod. 2018, 192, 43–54. [Google Scholar] [CrossRef]
- Karalis, D.; Kanakoudis, V. Carbon footprint of products and services: The case of a winery in Greece. Sci. Total Environ. 2023, 878, 162317. [Google Scholar] [CrossRef]
- Lamastra, L.; Suciu, N.A.; Novelli, E.; Trevisan, M. A new approach to assessing the water footprint of wine: An Italian case study. Sci. Total Environ. 2014, 490, 748–756. [Google Scholar] [CrossRef]
- Litskas, V.D.; Tzortzakis, N.; Stavrinides, M.C. Determining the carbon footprint and emission hotspots for the wine produced in cyprus. Atmosphere 2020, 11, 463. [Google Scholar] [CrossRef]
- Manzardo, A.; Marson, A.; Zuliani, F.; Bacenetti, J.; Scipioni, A. Combination of product environmental footprint method and eco-design process according to ISO 14006: The case of an Italian vinery. Sci. Total Environ. 2021, 799, 149507. [Google Scholar] [CrossRef]
- Marchi, M.; Neri, E.; Pulselli, F.M.; Bastianoni, S. CO2 recovery from wine production: Possible implications on the carbon balance at territorial level. J. CO2 Util. 2018, 28, 137–144. [Google Scholar] [CrossRef]
- Marras, S.; Masia, S.; Duce, P.; Spano, D.; Sirca, C. Carbon footprint assessment on a mature vineyard. Agric. For. Meteorol. 2015, 214–215, 350–356. [Google Scholar] [CrossRef]
- Masotti, P.; Zattera, A.; Malagoli, M.; Bogoni, P. Environmental Impacts of Organic and Biodynamic Wine Produced in Northeast Italy. Sustainability 2022, 14, 6281. [Google Scholar] [CrossRef]
- Miglietta, P.P.; Morrone, D.; Lamastra, L. Water footprint and economic water productivity of Italian wines with appellation of origin: Managing sustainability through an integrated approach. Sci. Total Environ. 2018, 633, 1280–1286. [Google Scholar] [CrossRef] [PubMed]
- TPanizzon, T.; Salton, G.B.; Schneider, V.E.; Poletto, M. Identifying Hotspots and Most Relevant Flows for Red and White Wine Production in Brazil through Life Cycle Assessment: A Case Study. Resources 2024, 13, 88. [Google Scholar] [CrossRef]
- Ridoutt, B.; Sanguansri, P.; Bonney, L.; Crimp, S.; Lewis, G.; Lim-Camacho, L. Climate change adaptation strategy in the food industry-Insights from product carbon and water footprints. Climate 2016, 4, 26. [Google Scholar] [CrossRef]
- Bonamente, E.; Scrucca, F.; Rinaldi, S.; Merico, M.C.; Asdrubali, F.; Lamastra, L. Environmental impact of an Italian wine bottle: Carbon and water footprint assessment. Sci. Total. Environ. 2016, 560–561, 274–283. [Google Scholar] [CrossRef]
- Rugani, B.; Vázquez-Rowe, I.; Benedetto, G.; Benetto, E. A comprehensive review of carbon footprint analysis as an extended environmental indicator in the wine sector. J. Clean. Prod. 2013, 54, 61–77. [Google Scholar] [CrossRef]
- Saraiva, A.; Presumido, P.; Silvestre, J.; Feliciano, M.; Rodrigues, G.; e Silva, P.O.; Damásio, M.; Ribeiro, A.; Ramôa, S.; Ferreira, L.; et al. Water footprint sustainability as a tool to address climate change in the wine sector: A methodological approach applied to a Portuguese case study. Atmosphere 2020, 11, 934. [Google Scholar] [CrossRef]
- Soregaroli, C.; Ricci, E.C.; Stranieri, S.; Nayga, R.M.; Capri, E.; Castellari, E. Carbon footprint information, prices, and restaurant wine choices by customers: A natural field experiment. Ecol. Econ. 2021, 186, 107061. [Google Scholar] [CrossRef]
- Vagnoni, E.; Cesaraccio, C.; Pirino, P.; Duce, P. The environmental role of small organic wineries: The case study of a multi-year assessment of a local Italian red wine. Int. J. Life Cycle Assess. 2024, 29, 469–482. [Google Scholar] [CrossRef]
- Zambelli, M.; Giovenzana, V.; Casson, A.; Tugnolo, A.; Pampuri, A.; Vignati, S.; Beghi, R.; Guidetti, R. Is there mutual methodology among the environmental impact assessment studies of wine production chain? A systematic review. Sci. Total Environ. 2023, 857, 159531. [Google Scholar] [CrossRef]
- Barisan, L.; Lucchetta, M.; Bolzonella, C.; Boatto, V. How does carbon footprint create shared values in the wine industry? Empirical evidence from prosecco superiore PDO’s wine district. Sustainability 2019, 11, 3037. [Google Scholar] [CrossRef]
- Simona, C.; Nicola, F.; Micol, M.; Carmen, M.R.; Raffaella, M.; Daniele, P.; Andrea, V.; Roberto, Z. A multi-indicator approach to compare the sustainability of organic vs. integrated management of grape production. Ecol. Indic. 2024, 158, 111297. [Google Scholar] [CrossRef]
- Rotchés-Ribalta, R.; Marull, J.; Pino, J. Organic farming increases functional diversity and ecosystem service provision of spontaneous vegetation in Mediterranean vineyards. Ecol. Indic. 2023, 147, 110023. [Google Scholar] [CrossRef]
- Litskas, V.; Ledo, A.; Lawrence, P.; Chrysargyris, A.; Giannopoulos, G.; Heathcote, R.; Hastings, A.; Tzortzakis, N.; Stavrinides, M. Use of Winery and Animal Waste as Fertilizers to Achieve Climate Neutrality in Non-Irrigated Viticulture. Agronomy 2022, 12, 2375. [Google Scholar] [CrossRef]
- Vian, M.A.; Tomao, V.; Coulomb, P.O.; Lacombe, J.M.; Dangles, O. Comparison of the Anthocyanin Composition during Ripening of Syrah Grapes Grown Using Organic or Conventional Agricultural Practices. J. Agric. Food Chem. 2006, 54, 5230–5235. [Google Scholar] [CrossRef]
- Mulero, J.; Pardo, F.; Zafrilla, P. Antioxidant activity and phenolic composition of organic and conventional grapes and wines. J. Food Compos. Anal. 2010, 23, 569–574. [Google Scholar] [CrossRef]
- Dani, C.; Oliboni, L.S.; Vanderlinde, R.; Bonatto, D.; Salvador, M.; Henriques, J.A.P. Phenolic content and antioxidant activities of white and purple juices manufactured with organically- or conventionally-produced grapes. Food Chem. Toxicol. 2007, 45, 2574–2580. [Google Scholar] [CrossRef]
- ISO/TS 14067; Greenhouse Gases—Carbon Footprint of Products—Requirements and Guidelines for Quantifications and Guidelines for Quantification and Communication. 2018. Available online: https://www.iso.org/standard/71206.html (accessed on 16 February 2025).
- ISO 14046; Environmental Management—Water Footprint—Principles, Requirements and Guidelines. 2014. Available online: https://www.iso.org/standard/43263.html (accessed on 16 February 2025).
- Laio, F.; Tamea, S.; Tuninetti, M. The Water-Food Nexus in Italy: A Virtual Water Perspective. Water Resour. 2020, 5, 319–334. [Google Scholar]
- Legge N 238. 2016. Available online: https://www.normattiva.it/uri-res/N2Ls?urn:nir:stato:legge:2016;238 (accessed on 16 February 2025). (In Italian).
- Bove, A.; Masciocco, L. Studio geo-idrologico del bacino del Torrente Talloria (CN). In Analisi E Attività Di Mitigazione Dei Processi Geo-Idrologici in Italia; Codevintec: Milano, Italy, 2019; pp. 112–113. (In Italian) [Google Scholar]
- Niccolucci, V.; Galli, A.; Kitzes, J.; Pulselli, R.M.; Borsa, S.; Marchettini, N. Ecological Footprint analysis applied to the production of two Italian wines. Agric. Ecosyst. Environ. 2008, 128, 162–166. [Google Scholar] [CrossRef]
- Ventura, M.R.; Mazzaglia, C.M.; Saia, N.; Spampinato, E.C.; Carpitano, A. Carbon Footprint Emission’s Evaluation of High Control CO2 Level Wine Company. 2018. Available online: http://www.procedia-esem.eu (accessed on 16 February 2025).
- Kitzes, J.; Galli, A.; Bagliani, M.; Barrett, J.; Dige, G.; Ede, S.; Erb, K.; Giljum, S.; Haberl, H.; Hails, C.; et al. A research agenda for improving national Ecological Footprint accounts. Ecol. Econ. 2009, 68, 1991–2007. [Google Scholar] [CrossRef]
- Monfreda, C.; Wackernagel, M.; Deumling, D. Establishing national natural capital accounts based on detailed Ecological Footprint and biological capacity assessments. Land Use Policy 2004, 21, 231–246. [Google Scholar] [CrossRef]
- Global Footprint Network. 2023. Available online: https://www.footprintnetwork.org/our-work/ecological-footprint (accessed on 16 February 2025).
- GSE: Fuel Mix. Data on Italy’s Energy Mix. Available online: https://www.gse.it/servizi-per-te/news/fuel-mix-determinazione-del-mix-energetico-per-gli-anni-2019-2020 (accessed on 16 May 2025).
- RTE: Bilan Electrique 2019. Data on France’s Energy Mix. Available online: https://www.qualenergia.it/wp-content/uploads/2020/02/synthese_blianelectrique_2019_0.pdf (accessed on 16 May 2025).


Disclaimer/Publisher’s Note: The statements, opinions and data contained in all publications are solely those of the individual author(s) and contributor(s) and not of MDPI and/or the editor(s). MDPI and/or the editor(s) disclaim responsibility for any injury to people or property resulting from any ideas, methods, instructions or products referred to in the content. |
© 2025 by the authors. Licensee MDPI, Basel, Switzerland. This article is an open access article distributed under the terms and conditions of the Creative Commons Attribution (CC BY) license (https://creativecommons.org/licenses/by/4.0/).