Abstract
Foliar feeding has been confirmed to be the fastest way of dealing with nutrient deficiencies and increasing the yield and quality of crop products. The synthesis of chlorophyll and photosynthesis are directly related to magnesium (Mg), which operates in the improvement of plant tissues and enhances the appearance of plants. This study aimed to analyze the correlation between two biophysical variables, including the leaf area index (LAI), the fraction of absorbed photosynthetically active radiation (FAPAR), and seven spectral vegetation indices. The spectral indices under investigation were Atmospherically Resistant Vegetation Index (ARVI), Normalized Difference Vegetation Index (NDVI), Soil Adjusted Vegetation Index (SAVI), Disease–Water Stress Index (DSWI), Modified Chlorophyll Absorption Ratio Index (MCARI), the Red-Edge Inflection Point Index (REIP), and Pigment-Specific Simple Ratio (PSSRa). These indices were derived from Sentinel-2 data to investigate the impact of applying foliar applications of Mg from various sources in the production of green-onion crops. The biophysical variables were derived using field measurements and Sentinel-2 data under the effects of different sources of Mg foliar sprays. The correlation coefficient between field-measured LAI and remotely sensed, calculated LAI was 0.72 in two seasons. Concerning FAPAR, it was found that the correlation between remotely sensed calculated FAPAR and field-measured FAPAR was 0.66 in the first season and 0.89 in the second season. The magnesium oxide nanoparticle (nMgO) treatments resulted in significantly higher yields than the different treatments of foliar applications. The LAI and FAPAR variables showed a positive correlation with yield in the first season (October) and in the second season (March). Yield in treatment by nMgO varied significantly from that in the other treatments, ranging from 69-ton ha−1 in the first season to 74.9-ton ha−1 in the second season. Linear regression between LAI and PSSRa showed the highest correlation coefficient (0.90) compared with other vegetation indices in the first season. In the same season, the highest correlation coefficient (0.94) was found between FAPAR and PSSRa. In the second season, the highest accuracy to the estimate LAI was found in the correlation between MCARI and PSSRa, with correlation coefficients of 0.9 and 0.91, respectively. In the second season, the highest accuracy to the estimate FAPAR was found with the correlation between PSSRa, ARVI, and NDVI, with correlation coefficients 0.97 and 0.96, respectively. The highest correlation coefficients between vegetation indices and yield were found with ARVI and NDVI in the first season, and only with NDVI in the second season.
1. Introduction
One of the most important crops used for local consumption in Egypt is the green onion (Allium cepa L.), and it is an exportation commodity too [1]. The size of the green onion and its bulb diameter are the most common maturity indices [2]. In the Middle East, the green onion is used for green leaves. It constitutes a major part of each daily diet as it is included in almost all recipes [3]. Green leaves of onions are an important exportable commodity in Egypt, which among onion exporting countries ranks sixth after Holland [1]. Egypt produced 2,208,080 tons of green onions in 2012, which ranked 3rd among onion-exporting countries [1]. Therefore, there is a huge concern for improving the yield, quality, and time of maturation of the green onion [4].
Magnesium (Mg) is one of the seventeen (17) nutrients for growth quality needed for proper development. These nutrients must be available in sufficient quantities, from the appropriate sources, and in the correct ratios for optimal growth and crop quality [5]. Mg causes visual-appearance improvements and increases in deposited mass because of its direct relation to the synthesis of chlorophyll and photosynthesis [6].
Foliar applications, a method of feeding plants by spritzing liquid fertilizers directly onto their leaves, are more efficient in terms of reaching maximum yield and decreasing loss [7]. Magnesium, as a macro-element, plays a fundamental role in various physiological functions of plants [8]. It is an essential element for crops and affects carbohydrate partitioning and photosynthesis in crops [9]. Its fertilization significantly affects the crop yield of various crop species [10]. Recently, the utilization of nano-fertilizers has gained more attention than traditional fertilizers due to their lower environmental impact and their offering of sustainable agricultural development using conservation tactics with less waste of agricultural inputs, in addition to increasing low levels of minerals in particular Mg [11]. Several studies stated that foliar or land application of Mg nano-fertilizer significantly increased the production of the black-eyed pea [12], green beans [13], and mustard [14].
Remote sensing is the process of gathering data from the surface, utilizing the waves that the earth’s surface reflects and emits. Obtaining this information and data requires less time and effort. The main data that can be gathered using remote sensing are thought to be soil, geology, vegetation cover, water, nutrients, urban sprawl, and terrain [15]. It gives planners the ability to map and characterize an area at various scales. It is the fastest and most-efficient method for maximizing the economic potential of soil and crops [16]. The biophysical characterization of plants is currently the main focus of remote sensing data, which formerly concentrated on crop types and land cover [17]. Based on the biophysical characteristics of the crop and the soil, remote sensing technology has the capacity to estimate crop productivity [18]. Estimating crop yield can be conducted using data from remote sensing [19]. This method lowers labor costs while enhancing precision farming [16]. When employing bio-physical indicators to evaluate the health of plants, remote sensing is crucial. Remote sensing can be used to identify and assess a variety of physiological changes that crops go through in response to stresses [18,20,21,22,23]. Additionally, to assess the health of plants in the field, the NDVI (Normalized Difference Vegetation Index) is also utilized [24,25,26,27]. A unique technique for forecasting agricultural productivity is to find a correlation between vegetation indices and yield using remote sensing [28].
The leaf area index (LAI) is known as the proportion of total green leaf area to ground surface area [29]. It is a crucial variable in activities including photosynthesis, respiration, and interception and is recognized by the global community of climate change researchers (GCOS) as an essential climatic variable [30,31,32].
Direct and indirect methods can be used to measure LAI at the ground level, as in [32,33,34]. Direct approaches typically involve destructive sampling of leaves done by hand, either by plucking vegetative leaves and collecting leaf litter, or by harvesting leaves manually [35]. As a result of their time- and labor-intensive nature and frequent plant destruction, direct approaches have limited applications and are unfeasible for high-temporal and high-spatial frequency measurements [36,37].
Existing methods to calculate LAI may be categorized into two main groups: (a) ceptometer instruments that use radiation transmission and gap fraction theory to discuss vegetation [38], and (b) Sentinel-2 data that proposed an algorithm to estimate LAI [38]. The fraction of absorbed photosynthetically active radiation (FAPAR) is one of the biophysical variables which are important to calculate, and can provide information about the growth and vigor of the cropping [39]. Vegetation indices, on the other hand, are some of the most often employed indices for the remote sensing of vegetation features. Normalized Difference Vegetation Index (NDVI), which was first proposed by [40], is perhaps the most widely used index. It has been used in several studies that have examined the growth of vegetation, chlorophyll, biomass, and LAI. A wide range of other indices that intended to maximize sensitivity towards LAI were presented, in addition to NDVI. Bands in the red-edge area are used in the design of many of these indicators [41]. The largest red chlorophyll absorption occurs in the spectral area between 698 nm and 750 nm wavelengths, and the maximum NIR reflation is brought on by the abundance of the leaf’s cell structure, or the LAI [42].
The current study observed the correlation between estimated biophysical parameters: leaf area index (LAI) and fraction of absorbed photosynthetically active radiation (FAPAR), using Sentinel-2 satellite imagery. The same measured biophysical parameters were observed using ground-observation devices. This was carried out in order to test the potentiality of satellite imagery to estimate different biophysical parameters under Egyptian conditions. In addition, the study proposed different empirical mathematical models to estimate crop yield under different treatments of magnesium fertilization, under specific conditions for the study area and green onion.
2. Materials and Methods
2.1. Study Area
In Farm Abu Sultan, Ismailia Governorate, Egypt, the study area is located at 30°24′43.95″ N, 32°15′48.08″ E (Figure 1). It covers 6.27 hectares. The experiment was conducted throughout the summer season (2021) and winter season (2021/2022), when the temperature normally ranges from 35 °C to 42 °C in the summer and 15 °C to 20 °C in winter. The study used four magnesium sources to examine how they affect the nutritional status, plant growth, and quality of green onion (Allium cepa L.) plants grown under a pivot system.
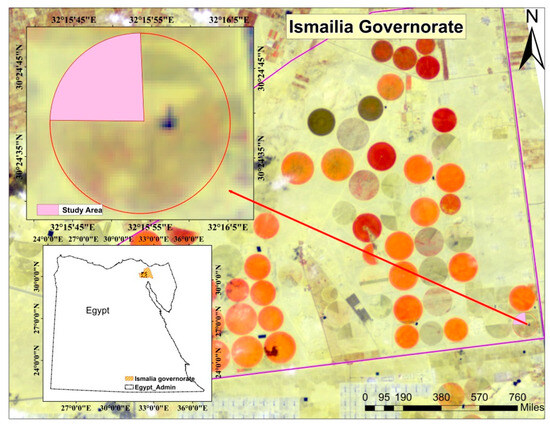
Figure 1.
Location of the study area.
2.2. Experimental Design
Four treatments were composed of foliar nutrition with different magnesium sources, and three replicates were established for each treatment (Figure 2). The treatments were magnesium sulphate and phenolic acid (magnesium chelate), magnesium nitrate (Mg-L), magnesium and phosphate (KAFOM Mg), and magnesium oxide nanoparticles (nMgO). The experiment was arranged in complete randomized design.

Figure 2.
Study area map, showing the experimental site location and treatments.
2.3. Field Data
Field data were collected according to the fertilization time, acquisition dates of the Sentinel-2 data, and condition of green-onion plants. Five campaigns were made, corresponding to the dates of Sentinel-2 data acquisition (Table 1). Finally, the green onions were harvested, and the output was calculated. The biophysical variables were calculated using the SNAP software V9, and all of the results were then correlated with field data.

Table 1.
Dates of sampling and Sentinel-2 data in green onion in two seasons (Abu Sultan, Ismailia Governorate, Egypt 2021/2022).
2.4. Field Measurements of Biophysical Variables
The hand-held ACCUPAR LP-80 ceptometer measures the linear PAR and includes a probe with 80 separate sensors along an 80 cm long rod and a read-out/data-logger unit. A supplemental external PAR sensor that may be connected to the system that is intended to detect radiation from above the canopy simultaneously is available. The optical sensors measure PAR in the 400–700 nm waveband, and the read-out unit shows PAR in μmol·m−2 and LAI in m2 m−2, respectively. The instrument’s logger mode allowed for unsupervised measurement, with readings being detected once every minute, as it is the lowest time delay between two consecutive measurements. Using a streamlined version of Equation (1) from the Norman–Jarvis radiation transmission and scattering model [43] and the above and below canopy PAR values, the integrated microprocessor of the LP-80 calculates the leaf area index (LAI). Using a simplified Equation (2), we may define FAPAR as the fraction of absorbed photochemically active radiation. In order to mimic photosynthesis and primary production, it is a crucial variable required in many ecosystems and agricultural functioning models [44].
where Θ is the zenith angle of the sun; χ is the parameter distribution of leaves, which refers to the distribution of leaf angles in a canopy; fb is the beam radiation fraction, which is the proportion of direct solar radiation to all other ambient radiation; and PARb and PARa are the values of photosynthetically active radiation measured above and below the canopy, respectively.
where Rc is the canopy reflectance, T is the transmittance of canopy, and Rs is the reflectance of soil background in the spectral domain of PAR.
A multitemporal analysis was conducted to estimate the link between the biophysical variables and crop yield. The overall crop yield for each treatment was associated with the monthly measurements of the samples, and the biophysical variables LAI and FAPAR were computed both in the field and using Sentinel-2 data.
2.5. Biophysical Variables Data of Satellite
Between July 2021 and March 2022, 10 Sentinel-2 (Table 2) images were downloaded. Using the Sen2cor plugin in SNAP [45], the images were corrected for atmospheric correction. The spatial resolution of 10 m was used during the atmospheric correction in order to maintain the red-edge region in the images. The images after atmospheric correction consisted of 12 bands shown in (Table 3).
Table 2.
Sentinel-2 satellite date acquisition from July 2021 to March 2022 used to observe green onion under different treatments in the study area.
Table 3.
Total spectral bands for the Sentinel-2 sensors.
Based on Sentinel-2 observations, the biophysical variables and vegetation indices were estimated [46]. Sentinel-2 images were obtained on cloud-free days that were close to the dates when the data were gathered across the whole phonological cycle (Table 1). The photos were retrieved from a level 2 (A and B) ESA server. Images of level 2A and 2B were obtained and atmospherically adjusted during the Sen2cor complement inclusion in the SNAP8.0 program [47]. The images were resampled in order to achieve 10 m pixels in all bands [48]. Finally, from the 10 pixels selected for field measurement, the value of the radiometric was retrieved in all bands. LAI (m2·m−2) and FAPAR (μg·cm−2) products were taken from the Biophysical Operator in SNAP 9.0 for each treatment.
2.6. Vegetation Indices Measurement
For each Sentinel-2 image, a spectral analysis was conducted in order to derive seven vegetation indices (VIs) based on the date of acquisition. Software SNAP 8.0 was used to construct the indices (Table 4). In earlier studies, VIs were examined and shown to be helpful for crop-yield modeling [49].
Table 4.
Formulas of calculated vegetation indices from Sentinel-2 data.
Two biophysical variables (1) leaf area index (LAI), and (2) fraction of absorbed photosynthetically active radiation (FAPAR) were calculated using top-of-canopy normalized reflectance of Sentinel-2 data and the ‘Biophysical Processor’ in SNAP toolbox [38].
2.7. Statistical Analysis
The experimental design was a randomized complete block design (RCBD) for four treatments, and each treatment was replicated three times. One-way variance analysis (ANOVA) and means were compared with the Tukey test (p < 0.05), using the Statistical 7 program (version 2004). Correlations were analyzed using linear regressions of the tracking and crop-yield variables.
2.8. Simple Linear Regressions (SLR)
Simple linear regression was used to model the relationship between biophysical variables LAI and FAPAR, with green-onion productivity applying the production function:
The applied production function could be rewritten following Equation (3):
where, Y is the actual green-onion productivity (ton ha−1); X is explained using biophysical variables (LAI and FAPAR); a is the intercept; b is the regression coefficient; and e is the error.
The main assumption was used to check the relationships between the dependent variable (yield in ton per hectare) and the independent biophysical variables (LAI and FAPAR).
Simple linear regression was used to model the relationship between vegetation indices (ARVI, DSWI, MCARI NDVI, PSSRa, REIP, and SAVI) and biophysical variables (LAI and FAPAR). The applied production function could be rewritten following Equation (4):
where, Y is the actual vegetation indices (ARVI, DSWI, MCARI NDVI, PSSRa, REIP, and SAVI); X is explained using biophysical variables (LAI and FAPAR); a is the intercept; b is the regression coefficient; and e is the error.
2.9. Model Validation
The coefficient of determination (R2), Equation (5), root mean square error (RMSE), Equation (6), the normalized root mean square error (NRMSE), and Equation (7) were used to evaluate the model performance.
where yi represents the actual green-onion productivity data; is the predicted green onion productivity data; and ȳ is the mean green-onion productivity of the model; n is the number of samples; and σ(y) is the standard deviation of y as used previously [48].
Biophysical variables, the relationships between the dependent and the independent variables, were linear; they were tested according to the method described by Casella et al. (2022) [49]. The linearity between green-onion productivity and the biophysical variables was tested using the Statistical 7 program (version 2004). The standard deviation-based NRMSE represents the ratio between the variation unexplained by the regression and the overall variation in y. It means that if the regression explains all the variations in y, none of the variations remain unexplained. In this case, the RMSE and the NRMSE are zero. If the regression explains some of the variations but leaves some unexplained, and this unexplained part has the same size as the overall variation, then the value of the NRMSE will be around one.
3. Results
3.1. Time Series of the Biophysical Variables
Over the sample dates, time series evolutions of LAI and FAPAR products acquired during SNAP were tracked (Figure 3, Figure 4, Figure 5 and Figure 6). The beginning of the growth is shown below.

Figure 3.
Time series of LAI images through the growth of green onion in first season.

Figure 4.
Time series of FAPAR images through the growth of green onion in first season.
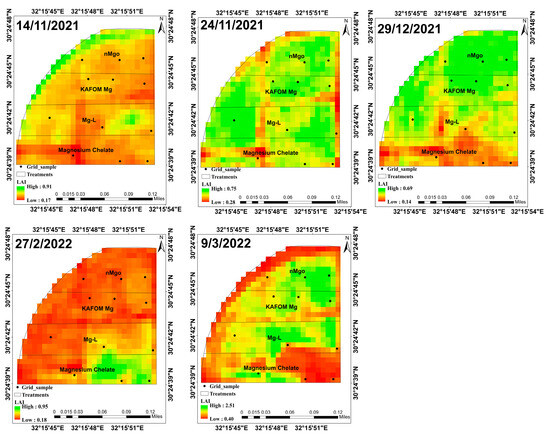
Figure 5.
Time series of LAI images through the growth of green onion in second season.

Figure 6.
Time series of FAPAR images through the growth of green onion in second season.
According to the progress of the vegetative development, which is the LAI value calculated from Sentinel-2 images, all treatments of foliar applications show an index increase from July at 0.13 to 0.73 in October (Figure 7a). From September to October, the LAI value in treatment with nMgO increased in relation to the other treatments. In October, close to the harvest, the highest value is shown to be 0.73 with nMgO treatment, and the lowest value is 0.42 in treatment with magnesium chelate. One-way variance analysis (ANOVA) and means were compared using the Tukey test (p < 0.05), using the Statistical 7 program (version 2004).

Figure 7.
Temporal variation of value LAI (a) and FAPAR (b) through the growth of green-onion plants in the first season, p-value < 0.05. a–c is a significant level.
According to the vegetative development progress, which is shown in the FAPAR value calculated from Sentinel-2 images, all treatments of foliar applications show an index increase from July at 0.04 to 0.4 in October (Figure 7b). The treatment with nMgO illustrated an increase of the FAPAR value from August at 0.13 to 0.3 in September. In October, the highest FAPAR value was 0.4 with nMgO treatment close to the harvest, and the lowest FAPAR value was 0.27 with magnesium chelate treatment. One-way variance analysis (ANOVA) and means were compared using the Tukey test (p < 0.05), using the Statistical 7 program (version 2004).
According to the vegetative development progress, analyzed using the LAI value calculated from Sentinel-2 images, from the beginning of November to the end December the LAI value increased in all treatments from 0.32 to 0.55 (Figure 8a). In February, as a result of the plants being sprayed with the pesticide lambda, which has an impact on leaf area index (LAI), the LAI values dropped in all the treatments However, the treatment with nMgO was not significantly affected [57]. After that, the plants returned to their regular development. In March, the highest LAI value was 1.67 with nMgO treatment, and the lowest LAI value was 1.02 with magnesium chelate treatment.

Figure 8.
Temporal variation of values for LAI (a) and FAPAR (b) through the growth of green-onion plants in second season; p-value < 0.05. a–c is a significant level.
According to the vegetative development progress, using the FAPAR value calculated from Sentinel-2 images, all treatments demonstrate an increase of index from December, with values from 0.16 to 0.55 in February (Figure 8b). In March, the highest FAPAR value was 0.55 with nMgO treatment close to the harvest, and the lowest FAPAR value was 0.38 with magnesium chelate treatment.
3.2. Comparison between Measurements of LAI and FAPAR in Field Data and from Sentinel-2 Data
This section displays the positive linear correlation of the two biophysical variables between the distribution of points in field data and Sentinel-2 data (Figure 9).

Figure 9.
Relationship between (a) LAI and (b) FAPAR in first season, and (c) LAI and (d) FAPAR in second season based on algorithm for Sentinel-2 data and field data on green onion; p-value < 0.05.
3.3. Vegetation Indices Analysis
A linear regression models for first-season vegetation indices and biophysical variables were appropriate (Table 5). The PSSRa and R2 = 0.9 indices in the first season were found to respond more favorably to LAI estimation. With R2 = 0.94, PSSRa provided the most sensitive response to calculate FAPAR.
Table 5.
Linear regression models between the vegetation indices and LAI and FAPAR in first season.
A linear regression model of vegetation indices and biophysical variables in the second season was appropriate (Table 6). The vegetation indices with the best responses to estimate LAI were found to be MCARI and PSSRa, with R2 values of 0.9 and 0.91, respectively. The most sensitive responses for calculating FAPAR were PSSRa (R2 = 0.97), followed by ARVI (R2 = 0.96), and NDVI.
Table 6.
Linear regression models between the vegetation indices and LAI and FAPAR in second season.
3.4. Relationship between Biophysical Variables and Yield
Crop yield was correlated with biophysical variables that were collected in the field and from Sentinel-2 data (Table 7). In the field LAI values, correlation for Sentinel-2 data had increased slightly, with R2 values for the first season of R2 = 0.88 and R2 = 0.76, respectively, and R2 = 0.78 and R2 = 0.56, respectively, in the second season. The Sentinel-2 values of FAPAR show a higher value than the one obtained using the field data; they were R2 = 0.89 and R2 = 0.82, respectively, in the first season, and R2 = 0.78 and R2 = 0.89, respectively, in the second season.
Table 7.
Relationship between the LAI and FAPAR and green-onion yield (ton ha−1) from field data and Sentinel-2 data.
Linear regression models of vegetation indices and yield in first season were appropriate (Table 8). Vegetation indices that responded positively to yield estimation were ARVI and NDVI with R2 = 0.94. But in second season, NDVI response decreased to R2 = 0.84.
Table 8.
Relationship between vegetation indices of the Sentinel-2 data and green-onion yield (ton ha−1).
3.5. Variation of Crop Yield under Various Treatments
An analysis was conducted on the crop yield of the green onion from each of the treatments (ton ha−1) (Figure 10). Significant changes between treatments in both seasons were discovered (p < 0.05). The nMgO treatment had the highest yield. Magnesium chelate treatment in both seasons was observed to differ significantly from one another. One-way variance analysis (ANOVA) and means were compared using the Tukey test (p < 0.05), using the Statistical 7 program (version 2004).

Figure 10.
Variation of crop yield in both seasons under effects of various treatments; p-value < 0.0001. a–c is a significant level.
3.6. Model Calibration
Datasets utilized for model validation included yield and biophysical variable values provided in farm datasets (observed data), versus predicted yield (ton ha−1). Therefore, commercial yield and biophysical variable outputs from field data and Sentinel-2 were compared during model validation. Root mean square error (RMSE) and normalized root mean square error (NRMSE) statistical indices were used to assess the model’s correctness in Table 9. Results show that these models were successfully validated using the simple regression model, and that the validation yielded accurate conclusions about the correlations between the biophysical variables and green-onion productivity. R2 was 0.90 for FAPAR (Field). RMSE and NRMSE were, respectively, 12.48 and 0.22.
Table 9.
Validation of the model for estimating green-onion-crop yield based on the biophysical variables from field data and Sentinel-2 data.
Datasets utilized for model validation included yield and vegetation indices values provided in farm datasets (observed data) versus predicted yield (ton ha−1). Therefore, commercial yield and vegetation indices outputs from field data and Sentinel-2 were compared during model validation in Table 10. Results show that these models were successfully validated using the simple regression model, and that the validation yielded accurate conclusions about the correlations between the vegetation indices and green-onion productivity. R2 was 0.92 for REIP. The RMSE and NRMSE were, respectively, 23.14 and 0.42.
Table 10.
Validation of the model for estimating green-onion-crop yield based on the vegetation indices.
4. Discussion
Field data were used to collect the temporal and spatial measurements for LAI and FAPAR variations. A significant decrease in leaf area was found between the end of February, during the second season, and as a result of the plants being sprayed with the pesticide lambda, which has an impact on leaf area index (LAI). At the same time, LAI values significantly increased with the treatments (Mg-L, KAFOM Mg, nMgO) [58]. The crop has reached its maximum LAI at this time as shown in Figure 3 and Figure 5. One of the variables with the greatest influence on crop yield is the LAI value which is mostly reliant on the availability of water, temperature, and nutrients at the stage of leaf development [49]. The biophysical variables and crop yield are mathematically correlated favorably according to Casella et al. (2022) [49].
In terms of yield, the nMgO treatment achieved 69.9-ton ha−1 and 74.9-ton ha−1 in the first and second seasons, respectively, as shown in Figure 10. This recommends that nMgO directly influences physiological status and yield of green onion [58]. Only a 32.3-ton ha−1 decrease was found when using magnesium chelate treatment; therefore, nMgO treatments were used for green-onion yield [58]. Generally, the increase in the yield quantity of treated onion plants with nMgO fertilizers rather than other utilized fertilizers might be associated with the properties of Mg nanoparticles, which are characterized by a smaller size, higher absorption, and more ease of attachment than other forms of magnesium [59,60]. In addition, the findings of the current study are similar to those found by [16], where foliar application with magnesium nano-fertilizers significantly increased the crop yield. These results could be attributed to the effective role of accumulated Mg ions on the growth and productivity of onion plants. Although several researchers confirmed that the application of a sufficient Mg rate improved the chlorophyll content, photosynthesis rate, and translocation of assimilates in leaves [10], these photosynthetic assimilates are transported from leaves to the sink organs (such as fruits, roots, and seeds), and stored as starch or transformed to hexoses [61] to upsurge crop quantity and quality [62,63].
The validation results of the LAI obtained from Sentinel-2 data (R2 = 0.72; F-a nova: 64.51; p < 0.05) in both seasons, FAPAR of R2 = 0.66; F-a nova: 47.62; p < 0.05 in the first season and R2 = 0.89; F-a nova: 208.35 p < 0.05 in second season resulted in higher correlation than the results that were achieved by the authors [54] analyzed Sentinel-2 data for a set of crops in the study area. Similar validation results and LAI were discussed for various croplands in Canada [55] and for wheat fields in northeastern China [56]. Both studies highlighted the benefits of using Sentinel-2 products, and more specifically, bands in the red-edge domain, for the analysis of vegetation’s biophysical characteristics. In a small field of green onions, the Sentinel-2 satellite’s spectral resolution, which combined the red-edge bands (705 and 740 nm), allowed for the study of biophysical parameters: LAI and FAPAR.
Regarding the correlation between LAI and different analyzed spectral indices, it was found that LAI had PSSRa and achieved the highest correlation coefficients with R2 = 0.90 and R2 = 0.91 in the first and second seasons, respectively. The vegetation index PSSRa was used to quantify pigments for the whole plant canopy. Its mathematical model showed the best and most linear relationships with canopy concentration per unit area of Chlorophyll a, Chlorophyll b and carotenoids [57]. Then, NDVI achieved the second place of accuracy with R2 = 0.78 in the first season and R2 = 0.82 in the second season. These results are comparable with the results achieved by [64]. PSSRa showed adequate accuracy to predict FAPAR with R2 = 0.94 and R2 = 0.97 in the first and second seasons, respectively, when NDVI showed R2 = 0.89 in the first season and R2 = 0.96 in the second season, according to the results obtained by [58].
The performance based on RMSE and NRMSE during the validation of various models for the prediction of green-onion productivity in our study showed high accuracy. The generated models were validated using the simple regression between actual and predicted yield. The same method for validation was used to calculate the accuracy of the predicted biophysical parameters, comparing them with measured ones for green-onion productivity.
5. Conclusions
This study showed the effectiveness of a simple, advanced methodology for analyzing the impact of foliar spraying with various magnesium sources on plants’ nutrient status, growth, and quality in the newly reclaimed area of Ismailia Governorate, Egypt. Farmers will be able to estimate yield better because of the availability of instruments that are simple to use. When it came to retrieving these biophysical characteristics, the LAI and FAPAR were based on Sentinel-2 spectral data and neural networks, and it was found to be suitable for tracking the intensive production of a crop with a leafy structure like Allium cepa L. There was a significant correlation between the estimates at the research site and the in situ measured biophysical variables. The examined vegetation indices can offer appropriate data for estimating the biophysical variables of LAI and FAPAR of green onion. It has been shown that using nMgO for green-onion crops increases yield.
Author Contributions
Data curation, N.M.; formal analysis, N.M. and A.M.A.; funding acquisition, N.Y.R.; investigation, E.A.A.; methodology, H.A.H., E.A.A., N.M., M.A. and A.M.A.; project administration, H.A.H. and E.A.A.; resources, H.A.H. and M.A.; software, N.M.; supervision, H.A.H., M.A. and A.M.A.; validation, M.A., D.E.K. and A.M.A.; visualization, D.E.K. and N.Y.R.; writing—original draft, N.M. and A.M.A.; writing—review and editing, E.A.A. All authors have read and agreed to the published version of the manuscript.
Funding
This research received no external funding.
Institutional Review Board Statement
Not applicable.
Informed Consent Statement
Not applicable.
Data Availability Statement
The authors state that all data generated or analyzed during this study are included in this article. The full data used to support the findings of this study are available from the corresponding author upon request.
Acknowledgments
The authors would like to thank the National Authority of Remote Sensing and Space Science (NARSS), Cairo, Egypt, Cairo University, Giza, Egypt. And also, this paper has been supported by the RUDN University Strategic Academic Leadership Program.
Conflicts of Interest
The authors declare no conflict of interest.
References
- El-Hamd, A.A.S.A.; Mohamed, A.A.M.; El-din, M.G.Z. Effect of some Agricultural Treatments on Productivity and Quality of Green Onion for Export (Allium cepa L.). Middle East J. Agric. Res. 2016, 5, 37–44. [Google Scholar]
- Mohamed, O.O.; Atress, A.S. Effect of Some Pre and Postharvest Treatments on Quality and Storability of Green Onion. Egypt. J. Agric. Res. 2016, 94, 689–706. [Google Scholar] [CrossRef]
- Goussous, S.J.; Mohammad, M.J. Comparative effect of two arbuscular mycorrhizae and N and P fertilizers on growth and nutrient uptake of onions. Int. J. Agric. Biol. 2009, 11, 463–467. [Google Scholar]
- Kandil, A.A.; Sharief, A.E.; Fathalla, F.H. Effect of Transplanting Dates of Some Onion Cultivars on Vegetative Growth, Bulb Yield and Its Quality. Crop Prod. 2013, 2, 73–82. [Google Scholar]
- Maathuis, F.J.M. Physiological functions of mineral macronutrients. Curr. Opin. Plant Biol. 2009, 12, 250–258. [Google Scholar] [CrossRef]
- Paulus, D.; Barbieri, L.; Becker, D. Growth and quality of chives in hydroponic system with concentrations of magnesium sulfate. Hortic. Bras. 2022, 40, 311–320. [Google Scholar] [CrossRef]
- Al-Juthery, H.W.A.; Hardan, H.M.; Al-Swedi, F.G.A.; Obaid, M.H.; Al-Shami, Q.M.N. Effect of foliar nutrition of nano-fertilizers and amino acids on growth and yield of wheat. IOP Conf. Ser. Earth Environ. Sci. 2019, 388, 012046. [Google Scholar] [CrossRef]
- Ceylan, Y.; Kutman, U.B. Magnesium applications to growth medium and foliage affect the starch distribution, increase the grain size and improve the seed germination in wheat. Plant Soil 2016, 406, 145–156. [Google Scholar] [CrossRef]
- Elkhouni, A.; Zorrig, W.; Smaoui, A. Effects of magnesium deficiency on photosynthesis and carbohydrate partitioning. Acta Physiol. Plant. 2016, 38, 145. [Google Scholar] [CrossRef]
- Wang, Z.; Hassan, M.U.; Nadeem, F.; Wu, L. Magnesium Fertilization Improves Crop Yield in Most Production Systems: A Meta-Analysis. Front. Plant Sci. 2020, 10, 1727. [Google Scholar] [CrossRef] [PubMed]
- Butt, B.Z.; Naseer, I. Nanofertilizers. In Nanoagronomy; Springer Nature: Cham, Switzerland, 2020; ISBN 9783030412753. [Google Scholar]
- Delfani, M.; Baradarn Firouzabadi, M.; Farrokhi, N.; Makarian, H. Some Physiological Responses of Black-Eyed Pea to Iron and Magnesium Nanofertilizers. Commun. Soil Sci. Plant Anal. 2014, 45, 530–540. [Google Scholar] [CrossRef]
- Salcido-Martínez, A.; Sánchez, E.; Lorena Licón-Trillo, P.; Pérez-Álvarez, S.; Palacio-Márquez, A.; Nubia Amaya-Olivas, I.; Preciado-Rangel, P. Impact of the foliar application of magnesium nanofertilizer on physiological and biochemical parameters and yield in green beans. Not. Bot. Horti Agrobot. Cluj-Napoca 2020, 48, 2167–2181. [Google Scholar] [CrossRef]
- Gautam, A.; Sharma, P.; Ashokhan, S.; Yaacob, J.S.; Kumar, V.; Guleria, P. Magnesium oxide nanoparticles improved vegetative growth and enhanced productivity, biochemical potency and storage stability of harvested mustard seeds. Environ. Res. 2023, 229, 116023. [Google Scholar] [CrossRef]
- Bhagat, V.S. Use of Remote Sensing Techniques for Robust Digital Change Detection of Land: Use of Remote Sensing Techniques for Robust Digital Change Detection of Land: A Review. Recent Patents Space Technol. 2012, 2, 123–144. [Google Scholar] [CrossRef]
- Kingra, P.K.; Majumder, D.; Banga, U.; Vishwavidyalaya, K.; Singh, S.P. Application of Remote Sensing and Gis in Agriculture and Natural Resource Management under Changing Climatic Conditions. Agric. Res. J. 2016, 53, 295–302. [Google Scholar] [CrossRef]
- Shanmugapriya, P.; Rathika, S.; Ramesh, T.; Janaki, P. Applications of Remote Sensing in Agriculture—A Review. Int. J. Curr. Microbiol. Appl. Sci. 2019, 8, 2270–2283. [Google Scholar] [CrossRef]
- Liaghat, S.; Balasundram, S.K. A Review: The Role of Remote Sensing in Precision Agriculture A Review: The Role of Remote Sensing in Precision Agriculture. Am. J. Agric. Biol. Sci. 2010, 5, 50–55. [Google Scholar] [CrossRef]
- Doraiswamy, P.C.; Sinclair, T.R.; Hollinger, S.; Akhmedov, B.; Stern, A.; Prueger, J. Application of MODIS derived parameters for regional crop yield assessment. Remote Sens. Environ. 2005, 97, 192–202. [Google Scholar] [CrossRef]
- Aboelghar, M.; Ali, A.-R.; Arafat, S. Spectral wheat yield prediction modeling using SPOT satellite imagery and leaf area index. Arab. J. Geosci. 2014, 7, 465–474. [Google Scholar] [CrossRef]
- Aboelghar, M.; Arafat, S.; Abo Yousef, M.; El-Shirbeny, M.; Naeem, S.; Massoud, A.; Saleh, N. Using SPOT data and leaf area index for rice yield estimation in Egyptian Nile delta. Egypt. J. Remote Sens. Sp. Sci. 2011, 14, 81–89. [Google Scholar] [CrossRef]
- Noureldin, N.A.; Aboelghar, M.A.; Saudy, H.S.; Ali, A.M. Rice yield forecasting models using satellite imagery in Egypt. Egypt. J. Remote Sens. Sp. Sci. 2013, 16, 125–131. [Google Scholar] [CrossRef]
- Nady, D.; Ali, A.M.; Mahmoud, A.G. The Egyptian Journal of Remote Sensing and Space Sciences Developing spatial model to assess agro-ecological zones for sustainable agriculture development in MENA region: Case study Northern Western. Egypt. J. Remote Sens. Sp. Sci. 2022, 25, 301–311. [Google Scholar] [CrossRef]
- Román, M.O.; Gatebe, C.K.; Schaaf, C.B.; Poudyal, R.; Wang, Z.; King, M.D. Variability in surface BRDF at different spatial scales (30 m–500 m) over a mixed agricultural landscape as retrieved from airborne and satellite spectral measurements. Remote Sens. Environ. 2011, 115, 2184–2203. [Google Scholar] [CrossRef]
- Weiss, M.; Baret, F.; Smith, G.J.; Jonckheere, I.; Coppin, P. Review of methods for in situ leaf area index (LAI) determination Part II. Estimation of LAI, errors and sampling. Agric. For. Meteorol. 2004, 121, 37–53. [Google Scholar] [CrossRef]
- Guangjian, Y.; Ronghai, H.; Jinghui, L.; Marie, W.; Hailan, J.; Xihan, M. Agricultural and Forest Meteorology Review of indirect optical measurements of leaf area index: Recent advances, challenges, and perspectives. Agric. For. Meteorol. 2018, 265, 390–411. [Google Scholar] [CrossRef]
- Zheng, G.; Moskal, L.M. Retrieving Leaf Area Index (LAI) Using Remote Sensing: Theories, Methods and Sensors. Sensors 2009, 9, 2719–2745. [Google Scholar] [CrossRef]
- Fang, H.; Li, W.; Wei, S.; Jiang, C. Agricultural and Forest Meteorology Seasonal variation of leaf area index (LAI) over paddy rice fields in NE China: Intercomparison of destructive sampling, LAI-2200, digital hemispherical photography (DHP), and AccuPAR methods. Agric. For. Meteorol. 2014, 198–199, 126–141. [Google Scholar] [CrossRef]
- Jonckheere, I.; Fleck, S.; Nackaerts, K.; Muys, B.; Coppin, P.; Weiss, M.; Baret, F. Review of methods for in situ leaf area index determination Part I. Theories, sensors and hemispherical photography. Agric. For. Meteorol. 2004, 121, 19–35. [Google Scholar] [CrossRef]
- Viña, A.; Gitelson, A.A.; Nguy-robertson, A.L.; Peng, Y. Remote Sensing of Environment Comparison of different vegetation indices for the remote assessment of green leaf area index of crops. Remote Sens. Environ. 2011, 115, 3468–3478. [Google Scholar] [CrossRef]
- Asner, G.P.; Braswell, B.H.; Schimel, D.S.; Wessman, C.A. Ecological Research Needs from Multiangle Remote Sensing Data. Remote Sens. Environ. 1998, 63, 155–165. [Google Scholar] [CrossRef]
- Delegido, J.; Verrelst, J.; Meza, C.M.; Rivera, J.P.; Alonso, L.; Moreno, J. A red-edge spectral index for remote sensing estimation of green LAI over agroecosystems. Eur. J. Agron. 2013, 46, 42–52. [Google Scholar] [CrossRef]
- Zeng, Y.; Chen, J.M.; Joiner, J.; Frankenberg, C. Optical vegetation indices for monitoring terrestrial ecosystems globally. Nat. Rev. Earth Environ. 2022, 3, 477–493. [Google Scholar] [CrossRef]
- Content, C. Evaluation of Sentinel-2 Red-Edge Bands for Empirical Estimation of Green LAI and Chlorophyll Content. Sensors 2011, 11, 7063–7081. [Google Scholar] [CrossRef]
- Norman, J.M.; Jarvis, P.G. Photosynthesis in Sitka Spruce (Picea sitchensis (Bong.) Carr.). III. Measurements of Canopy Structure and Interception of Radiation. J. Appl. Ecol. 1974, 11, 375–398. [Google Scholar] [CrossRef]
- Monteith, J. DigitalCommons @ University of Nebraska—Lincoln Light Interception and Radiative Exchange in Crop Stands. In Physiological Aspects of Crop Yield; American Society of Agronomy, Inc.: Madison, WI, USA, 1969. [Google Scholar]
- Bonansea, M.; Ledesma, M.; Bazán, R.; Ferral, A.; German, A.; Mill, P.O.; Rodriguez, C.; Pinotti, L. Journal of South American Earth Sciences Evaluating the feasibility of using Sentinel-2 imagery for water clarity assessment in a reservoir. J. S. Am. Earth Sci. 2019, 95, 102265. [Google Scholar] [CrossRef]
- Louis, J.; Debaecker, V.; Pflug, B.; Main-knorn, M.; Bieniarz, J. Sentinel-2 Sen2Cor: L2A Processor for Users. In Proceedings of the ESA Living Planet Symposium 2016, Prague, Czech Republic, 9–13 May 2016; Volume 2016, pp. 9–13. [Google Scholar]
- Chamorro Sevilla, H.E.; Erazo, A. Estudio multiespectral del cultivo de tuna para determinar los índices NDVI, CWSI y SAVI, a partir de imágenes SENTINEL 2A, en el cantón Guano, provincia de Chimborazo, Ecuador. Enfoque UTE 2019, 10, 55–66. [Google Scholar] [CrossRef]
- Hunt, M.L.; Blackburn, G.A.; Carrasco, L.; Redhead, J.W.; Rowland, C.S. Remote Sensing of Environment High resolution wheat yield mapping using Sentinel-2. Remote Sens. Environ. 2019, 233, 111410. [Google Scholar] [CrossRef]
- Tanre, D.; Holben, B.; Kaufman, Y. Atmospheric Correction Algorithm for NOAA-AVHRR Products: Theory and Application. IEEE Trans. Geosci. Remote Sens. 1992, 30, 231–248. [Google Scholar] [CrossRef]
- Sahoo, R.N.; Ray, S.S.; Manjunath, K.R. Hyperspectral remote sensing of agriculture. Curr. Sci. 2015, 108, 848–859. [Google Scholar]
- Sensing, R.; Sydney, T.; Huete, A.R. A soil-adjusted vegetation index (SAVI). Remote Sens. Environ. 1988, 25, 295–309. [Google Scholar] [CrossRef]
- Apan, A.; Held, A.; Phinn, S.; Markley, J. Formulation and assessment of narrow-band vegetation indices from EO-1 Hyperion imagery for discriminating sugarcane disease. In Proceedings of the Spatial Sciences Institute Biennial Conference (SSC 2003): Spatial Knowledge without Boundaries, Canberra, Australia, 22–26 September 2003; pp. 1–13. [Google Scholar]
- Daughtry, C.S.T.; Walthall, C.L.; Kim, M.S.; De Colstoun, E.B. Estimating Corn Leaf Chlorophyll Concentration from Leaf and Canopy Reflectance. Remote Sens. Environ. 2000, 74, 229–239. [Google Scholar] [CrossRef]
- Li, J.; Chen, X.; Tian, L.; Huang, J.; Feng, L. Improved capabilities of the Chinese high-resolution remote sensing satellite GF-1 for monitoring suspended particulate matter (SPM) in inland waters: Radiometric and spatial considerations. ISPRS J. Photogramm. Remote Sens. 2015, 106, 145–156. [Google Scholar] [CrossRef]
- Blackburn, G.A. Spectral indices for estimating photosynthetic pigment concentrations: A test using senescent tree leaves. Int. J. Remote Sens. 1998, 19, 657–676. [Google Scholar] [CrossRef]
- Hassler, S.C.; Baysal-Gurel, F. Unmanned aircraft system (UAS) technology and applications in agriculture. Agronomy 2019, 9, 618. [Google Scholar] [CrossRef]
- Casella, A.; Orden, L.; Pezzola, N.A.; Bellaccomo, C.; Winschel, C.I.; Caballero, G.R.; Manuel, L.; Gracia, N.; Verrelst, J. Analysis of Biophysical Variables in an Onion Crop (Allium cepa L.) with Nitrogen Fertilization by Sentinel-2 Observations. Agronomy 2022, 12, 1884. [Google Scholar] [CrossRef] [PubMed]
- Palacios, F.; Diago, M.P.; Melo-Pinto, P.; Tardaguila, J. Early yield prediction in different grapevine varieties using computer vision and machine learning. Precis. Agric. 2023, 24, 407–435. [Google Scholar] [CrossRef]
- Jean-Simon, L.; Mont-Gerard, J.B.; Sander, J.J. Effect of Early Season Weed Competition Duration on Onion Yield. Proc. Fla. State Hort. Soc. 2012, 125, 226–228. [Google Scholar]
- Teshika, J.D.; Zakariyyah, A.M.; Zaynab, T.; Zengin, G.; Rengasamy, K.R.R.; Pandian, S.K.; Fawzi, M.M. Traditional and modern uses of onion bulb (Allium cepa L.): A systematic review. Crit. Rev. Food Sci. Nutr. 2019, 59, S39–S70. [Google Scholar] [CrossRef]
- Kanjana, D. Foliar application of magnesium oxide nanoparticles on nutrient element concentrations, growth, physiological, and yield parameters of cotton. J. Plant Nutr. 2020, 43, 3035–3049. [Google Scholar] [CrossRef]
- Abdulridha, J.; Ampatzidis, Y.; Roberts, P. ScienceDirect Detecting powdery mildew disease in squash at different stages using UAV-based hyperspectral imaging and artificial intelligence. Biosyst. Eng. 2020, 197, 135–148. [Google Scholar] [CrossRef]
- Djamai, N.; Fernandes, R.; Weiss, M.; Mcnairn, H.; Goïta, K.; Centre, C.; Canada, N.R.; Street, R.; Ka, O. Remote Sensing of Environment Validation of the Sentinel Simplified Level 2 Product Prototype Processor (SL2P) for mapping cropland biophysical variables using Sentinel-2/MSI and Landsat-8/OLI data. Remote Sens. Environ. 2019, 225, 416–430. [Google Scholar] [CrossRef]
- Xie, Q.; Dash, J.; Huete, A.; Jiang, A.; Yin, G.; Ding, Y.; Peng, D.; Hall, C.C.; Brown, L.; Shi, Y.; et al. Retrieval of crop biophysical parameters from Sentinel-2 remote sensing imagery. Int. J. Appl. Earth Obs. Geoinf. 2019, 80, 187–195. [Google Scholar] [CrossRef]
- Psomiadis, E.; Dercas, N.; Dalezios, N.R. Evaluation and cross-comparison of vegetation indices for crop monitoring from sentinel-2 and worldview-2 images. In Proceedings of the Remote Sensing for Agriculture, Ecosystems, and Hydrology XIX, Warsaw, Poland, 12–14 September 2017. [Google Scholar] [CrossRef]
- Rahman, M.M.; Lamb, D.W.; Stanley, J.N. Agricultural and Forest Meteorology The impact of solar illumination angle when using active optical sensing of NDVI to infer fAPAR in a pasture canopy. Agric. For. Meteorol. 2015, 202, 39–43. [Google Scholar] [CrossRef]
- Azzaza, S.; El-Hilo, M.; Narayanan, S.; Judith Vijaya, J.; Mamouni, N.; Benyoussef, A.; El Kenz, A.; Bououdina, M. Structural, optical and magnetic characterizations of Mn-doped MgO nanoparticles. Mater. Chem. Phys. 2014, 143, 1500–1507. [Google Scholar] [CrossRef]
- Abdel-Hakim, S.G.; Shehata, A.S.A.; Moghannem, S.A.; Qadri, M.; El-Ghany, M.F.A.; Abdeldaym, E.A.; Darwish, O.S. Nanoparticulate Fertilizers Increase Nutrient Absorption Efficiency and Agro-Physiological Properties of Lettuce Plant. Agronomy 2023, 13, 691. [Google Scholar] [CrossRef]
- Lemoine, R.; La Camera, S.; Atanassova, R.; Dédaldéchamp, F.; Allario, T.; Pourtau, N.; Bonnemain, J.-L.; Laloi, M.; Coutos-Thévenot, P.; Maurousset, L.; et al. Source-to-sink transport of sugar and regulation by environmental factors. Front. Plant Sci. 2013, 4, 272. [Google Scholar] [CrossRef] [PubMed]
- Mahmoud, A.W.M.; Rashad, H.M.; Esmail, S.E.A.; Alsamadany, H.; Abdeldaym, E.A. Application of Silicon, Zinc, and Zeolite Nanoparticles—A Tool to Enhance Drought Stress Tolerance in Coriander Plants for Better Growth Performance and Productivity. Plants 2023, 12, 2838. [Google Scholar] [CrossRef]
- Laing, W.; Greer, D.; Sun, O.; Beets, P.; Lowe, A.; Payn, T. Physiological impacts of Mg deficiency in Pinus radiata: Growth and photosynthesis. New Phytol. 2000, 146, 47–57. [Google Scholar] [CrossRef]
- Aklilu Tesfaye, A.; Gessesse Awoke, B. Evaluation of the saturation property of vegetation indices derived from sentinel-2 in mixed crop-forest ecosystem. Spat. Inf. Res. 2021, 29, 109–121. [Google Scholar] [CrossRef]
Disclaimer/Publisher’s Note: The statements, opinions and data contained in all publications are solely those of the individual author(s) and contributor(s) and not of MDPI and/or the editor(s). MDPI and/or the editor(s) disclaim responsibility for any injury to people or property resulting from any ideas, methods, instructions or products referred to in the content. |
© 2023 by the authors. Licensee MDPI, Basel, Switzerland. This article is an open access article distributed under the terms and conditions of the Creative Commons Attribution (CC BY) license (https://creativecommons.org/licenses/by/4.0/).