Article

Political Divisions and Socio-Economic Disparities in Poland: A Geographical Approach

by
Tomasz Herodowicz
*,
Barbara Konecka-Szydłowska
,
Paweł Churski
and
Robert Perdał
Faculty of Human Geography and Planning, Adam Mickiewicz University Poznań, 61-712 Poznań, Poland
*
Author to whom correspondence should be addressed.
Sustainability 2021, 13(24), 13604; https://doi.org/10.3390/su132413604
Submission received: 4 November 2021 / Revised: 30 November 2021 / Accepted: 6 December 2021 / Published: 9 December 2021
(This article belongs to the Section Sustainability in Geographic Science)

Abstract

:
This article attempts to identify the relationship between the persistent polarisation of political opinions and diverse levels of social and economic development. The coexistence of these phenomena may indicate a barrier to inclusive economic development, which connects with the United Nations Agenda for Sustainable Development. A research aim was to test two hypotheses: Hypothesis 1 (H1)—The increase in the spatial disparity of political support in Poland is persistent; and Hypothesis 2 (H2)—The spatial distribution of support for specific political options shows significant correlations with the distribution of social and economic growth. The study involves the following research methods implementation: desk research, intensity indicators and regression analysis. The results confirmed the persistence of spatial divisions in political support, whose distribution reflects to a large extent the diverse levels of social and economic development that exist. Two axes dividing Poland are identified, one between west and east and the other between urban and rural areas. The article connects with the international debate regarding “places that don’t matter” and the reasons behind the growing popularity of populist ideas in society.

1. Introduction

In December 2016, The Economist aptly noted that “regional inequality is proving too politically dangerous to ignore”. Indeed, the Austrian presidential elections of 2016 [1], the Brexit referendum in the United Kingdom in June 2016 [2,3], the United States presidential elections in November 2016 [4,5] and the recent parliamentary elections in Poland [6,7,8] all clearly indicate an increase in the importance of populist groups. These groups claim to fight against corrupt elites, stress the need to understand “ordinary people” and to rely on one’s own resources and often demonstrate a belief in an authoritarian way of exercising power [9,10]. The growing scale of support for these groups proves a radical response that emphasises a lack of consent for the consequences of socio-economic processes and the unsatisfactory effectiveness of the existing public intervention within the development policy. This is especially true of inhabitants of areas that are peripheral in terms of both geography and socio-economic status (relatively long physical and time distances from large urban agglomerations, i.e., growth poles; and relatively poor access to jobs and services). For this reason, developmental convergence, directly connecting with the goals of sustainable development identified by the United Nations (UN) in 2015 (UN General Assembly, Transforming Our World: The 2030 Agenda for Sustainable Development, 21 October 2015, A/RES/70/1, available at: https://www.refworld.org/docid/57b6e3e44.html (accessed on 21 September 2021)), remains the overarching objective of public intervention.
In the past 30 years, Poland has undergone a spectacular transformation from a backward post-communist country into one of the most dynamically growing members of the European Union (EU). However, persisting and even progressing inter- and intra-regional divergence constitutes a growing threat to sustainable development. Increasing developmental differences have been met with growing social opposition, fostering populist tendencies. It should be noted that the costs and benefits of globalisation under the conditions of progressive integration are unevenly distributed both in terms of territories and social groups [11,12]. This has led not only to the aforementioned developmental differentiation of territories, but also (and perhaps above all) to the polarisation of social views. Unfortunately, in both cases the scale of polarisation has become dangerous. This raises the research relevance on the impact of regional differentiation on electoral preferences.
Zarycki [7], among other scholars, deals with the problems of electoral geography. He shows the connection between the differences of political behaviour referring to the division of Poland among three annexationists in the 19th century and the contemporary structure of electoral support, as well as local differences in three capitals that make up important development factors: economic, social and cultural. Grabowski’s study [13] is also a very topical analysis in this area. It constitutes a very interesting sociological examination of regularities in spatial differences of electoral behaviour in Poland. Moreover, analysing electoral geography in Poland, Kowalski [14] in his research pays attention to historical and cultural determinants of the emergence of political divisions. Political behaviour is becoming an indicator of the economic and social situation determined by the historical background. This can be observed especially in the past decade in which persistent poverty, economic decay and lack of opportunities are at the root of considerable discontent [15].
Given the above, the research aim was to identify the spatial relationship between the pattern of electoral behaviour that reflects social sentiments and the level of socio-economic development at the local (commune, called gmina) level in Poland. The following hypotheses are tested in the research procedure: H1, The increase in the spatial disparity of political support in Poland is persistent; and H2, The spatial distribution of support for specific political options shows significant correlations with the distribution of social and economic growth.
Further material is divided into several parts. Thus, Section 2 includes Materials and Methods. Section 3 presents Results divided into characteristic of political scene in Poland, geographical patterns of electoral behaviour in Poland, and correlation identification between socio-economic growth and political preferences. In Section 4 the results were interpreted in the light of current scientific literature. Last section includes conclusions referring to research hypotheses verification.

2. Materials and Methods

The research procedure consisted of three main stages. In the first stage, the contemporary Polish political scene was characterised. In the second stage, the spatial patterns of electoral behaviour were analysed. In the third and fundamental stage, the relationship between electoral behaviours (including those leading to the growth of solidary attitudes supported by populist political slogans) and persistent spatial differences in socio-economic development was examined.
In stage one, the key research method applied to characterise the contemporary political arena in Poland (from the late 20th to early 21st century) involved the examination of documents and literature studies (desk research, qualitative research). In stage two, intensity indicators of political preferences (indicators of support for specific parties) were used to describe the spatial distribution of changes in voting behaviour in Poland with respect to local administrative units (LAU-2). The timeframe of the survey was 2001–2019, during which six parliamentary elections took place. Special attention was devoted to 2005, 2015 and 2019, years for which choropleth maps were drawn on the basis of data provided by the National Electoral Commission (PKW). In stage three, the indicators method and regression methods were used, specifically ordinary least squares (OLS) regression and geographically weighted regression (GWR). The goal of this stage was to analyse the connection between political support for selected political parties and local socio-economic development in Poland. A synthetic indicator was used to identify the level of socio-economic development in Polish communes, providing the basis for their synthetic classification. Simply speaking, the procedure of developing the synthetic indicator relied on selecting partial indicators subjected to min–max normalisation. To this end, the Bray–Curtis dissimilarity was applied [16], transformed per similarity with the model: a hypothetical unit assuming the maximum value for all the indicators. As a result, it was possible to arrange in the linear order all the communes in Poland. This procedure was carried out for each year between 2004 and 2018, a period for which the complete series of statistical data was available. As a result, it was possible to identify the values of the synthetic indicator of development for each commune in Poland, for 15 years of observation.
Furthermore, in order to obtain a synthetic classification of communes (encompassing the results for the entire period), a classification procedure was carried out, based on the values of the synthetic indicator including set of diagnostic variables describing five aspects corresponding to development factors: human capital, social capital, material capital, financial capital, and innovations. To this end, a cluster analysis (k-means clustering) was used, followed by verification by means of the random forest method. As a result, the synthetic approach was used to identify communes with high, average-high, average, average-low and low levels of socio-economic development. A detailed description of the procedure of developing the synthetic indicator together with the classification procedure is presented in [17]. On the other hand, in order to examine the strength of the relationship between political support and socio-economic development, regression methods were applied. The development of linear models (OLS) was the starting point. Notably, OLS assumes that the modelled phenomena are independent of their location and that the relationships between the studied phenomena are constant. Therefore, it is assumed that at each point of observation, the same (constant) correlations between the dependent variable and the explanatory variable occur. Nevertheless, socio-economic phenomena show a high degree of spatial instability and are differently shaped in, for example, urban areas and agricultural areas or in communes with high or low levels of development. Such a situation fully justifies the use of spatial regression and in particular models with instability of structural parameters, such as GWR [18], which captures the variability of regression coefficients in space for each observation. Therefore, assessments of model parameters are estimated separately for each observation for which the values of the dependent and the explanatory variables are known. Explanatory variables from neighbouring observations are used to estimate the assessment of the parameters of local regression models, with decreasing significance for subsequent observations [18]. As a result of the GWR procedure, an n-elementary set of localised parameter assessments (n local regression equations) and local model-matching quality measures (local standard estimation errors, local R2) is produced. For a detailed description of the GWR procedure, see Charlton and Fotheringham [19] and Fotheringham et al. [18]. In each of the applied regression models, the dependent variable (Y) stood for the level of political support, while the independent variable (X) was the socio-economic development expressed by means of the synthetic indicator. The data were obtained from the Central Statistical Office (GUS) and the National Electoral Commission (PKW). The analysis was conducted at the level of LAU-2 units, enabling a detailed identification of intra-regional disparities. In stage three, just as in stage two, cartographic presentation methods were used (choropleth maps).

3. Results

3.1. The Political Scene in Poland

The single-party political system has marked its presence in all the countries of Central and Eastern Europe which, following the socio-economic transformation and the demise of the communist system from the late 1980s, attempted to establish or recreate a pluralist party system, in line with the idea that political parties represent vehicles of contemporary democracy [20]. In Poland, the re-structuring of the political scene resulted from the Round Table Agreements (The Round Table Agreements: negotiations conducted between 6 February and 5 April 1989 by representatives of the government of the Polish People’s Republic, the democratic opposition and Church organisations (the Catholic Church and the Evangelical Church of the Augsburg Confession)), leading to the country’s constitution being amended in April 1989. For the first time for 40 years, the communist party (the Polish United Workers’ Party, PZPR) did not affect the opposition’s tickets (Solidarność, Solidarity), a breakthrough moment that paved the way for a pluralist party system [21]. During the transformation, the Polish political scene emerged dynamically and was accompanied by new antagonisms. The original, idealist assumption of maintaining unity in the post-Solidarity milieu proved unrealistic. Once the common “enemy” in the form of the PZPR had been defeated, the post-Solidarity (rightist) factions started to compete, at the same time representing one of the major areas of the Polish political scene in the early 1990s. Across the divide, tentatively referred to as “post-communist”, the new leftist movement was in the making. Notably, during the four years following the 1989 elections, attempts at stabilising the political scene proved futile. The fragmentation of political parties and the changing of coalitions resulted in a liquid political scene and short-term governance [22]. During these four years, governments ruled on average for about a year. The negative experiences of these years triggered a change to the electoral system, specifically the introduction of an electoral threshold of 5% for political parties and 8% for party coalitions. Exempt from the threshold were electoral committees of organisations of ethnic minorities. The new electoral system, based on the d’Hondt method preferring the biggest parties, limited the number of small parties in Parliament [23]. This contributed to the introduction to the lower chamber of the Parliament a maximum of six parties (election committees) [21]. The establishment of a more stable party system did not eliminate turbulence: throughout the transformation, political parties emerged and disappeared. The political scene in Poland has not assumed its stable shape to date.
2005 was a breakthrough year from the point of view of the development of the present-day political stage, as for the first time since the shift of the political and economic system, parliamentary and presidential elections were held in the same year [24,25]. As a result, the strategies and tactics of political life differed from before, and therefore the election campaign was unique. This had an impact on the sphere of public discourse, the image of politics in the media and its social perception. Moreover, the election results were unusual, because for the first time in post-communist history the candidates and groups associated with the former system did not play a major role. The last time the new leftist party marked a significant political presence was in 2001, when the SLD-UP coalition (the Democratic Left Alliance and Labour Union) won in the parliamentary elections (Table 1). This new, exceptional situation saw the 2005 elections described as critical elections. An important consequence of these changes was a fundamental shift in the structure of competition in the Polish political scene. The political and electoral axis of division into left and right, which had previously delineated political and electoral rivalry, was no longer important. Of greater significance was the older, less prominent yet still relevant division into “Solidary Poland” and “Liberal Poland” [26,27,28]. Since that time, the Polish political scene has been clearly polarised, bringing the party system closer to the two-block/bipolar system [28,29] in which two factions—“Solidary Poland” and “Liberal Poland”—fight for power. The groups forming the “new” opposition differ more clearly from each other in terms of their socio-demographic characteristics than the left and the right. The opposition of “Solidary Poland” vs “Liberal Poland” is closely linked to real interests and, above all (and of particular interest for this article), to matters of socio-economic growth [24,28]. In a generalised perspective, given the values and ideologies professed, the Polish political scene can be divided along two axes: conservatism vs liberalism and individualism vs communitarianism (Figure 1).
Thus, the political parties that won seats in national parliamentary elections during the period of Poland’s integration with the EU (2005, 2007, 2011 2015 and 2019) can be further aggregated into two main political camps. The core of the first—the conservative and communitarian “Solidary Poland”—essentially consists of two parties, Law and Justice (Prawo i Sprawiedliwość, or PiS, 2005, 2007, 2011, 2015 and 2019) and the League of Polish Families (Liga Polskich Rodzin, or LPR, 2005). In the other camp, the liberal and individual “Liberal Poland” is represented by four political parties, Civic Platform (Platforma Obywatelska, PO, 2005, 2007, 2011 and 2015), Ruch Palikota (RP, 2011), Modern (Nowoczesna, N, 2015) and Koalicja Obywatelska (KO, mainly consisting of Platforma Obywatelska, PO, and Nowoczesna, N, 2019). The electoral programmes of these parties are strictly in line with the slogans of the political camp, whereas those of the other parties are more varied and only partially in line with the main slogans of one of the camps.
Dominant among the supporters of the “Solidary Poland” camp are the so-called losers of the transformation process, who find ideological options referring to social solidarity particularly attractive. They expect, among other aspects, state aid, equal opportunities and an extensive social policy [24]. Supporters of this camp also call for greater state control over local self-government, which may contribute to the centralisation of power. The voters of “Solidary Poland” are primarily inhabitants of rural areas, showing relatively greater conservatism and conformism [26,30]. By contrast, “Liberal Poland” is composed of winners who have “made it” in the wake of the transformation process. They are in favour of broad liberalism, which emphasises individual freedom. To pursue their interests, the winners of the transformation expect as few restrictions as possible from state institutions [24]. They advocate economic freedom based on the free market and private property and support the devolution of power and the development of self-government [31]. Voters supporting the “Liberal Poland” camp are much more often residents of larger cities, who are more open to change and more concerned about their own interests than their more rural counterparts [26,30].

3.2. Geographical Patterns of Electoral Behaviour in Poland

As has already been emphasised, during the system transformation the new leftist movement played a significant role in the Polish political scene until 2001. On the other hand, in the years to come, the new leftist movement (Sojusz Lewicy Demokratycznej, SLD consistently made its way to the lower chamber of the Parliament (except for in 2015), although since 2005, it was not capable of creating a governmental coalition, support for this faction oscillating between 8% and 13% (Table 1). In any analysis of the emerging balance of power in the Polish Parliament in the years 2005–2019, one should first of all point to the dominance of two opposition political camps and their constituent parties. In 2005, voters cast almost 60% of the votes for the “Solidary Poland” camp, represented by PiS and LPR, and the “Liberal Poland” camp, associated with PO (Table 1). In the subsequent parliamentary elections, the positions of these camps on the Polish political scene were clearly strengthened. In 2015, the two camps, respectively represented by PiS and PO together with N, enjoyed a total support level of 70%. It should be noted that in 2007 and 2011, this increase mainly owed to an increase in support for only one party in the “Liberal Poland” camp: PO (from 24.14% to approximately 40%). The situation in the parliamentary elections in 2015 was different, as PO recorded a significant decline whereas PiS’ share increased to over 37%. In the period under analysis, the remaining groups were much less significant in shaping the Polish political scene, support for them usually not exceeding 10%.
The results of the parliamentary elections (Table 1) justify the statement that the Polish political scene is subject to polarisation, bringing the party system closer to a bipolar system [28,29] in which the power struggle takes place between “Solidary Poland” and “Liberal Poland” camps. For this reason, geographical patterns of electoral behaviour can be identified on the basis of support for these two dominant political options. The choice between them essentially reflects the social mood in Poland and the directions of developmental changes desired by citizens. PiS, which is the core of “Solidary Poland”, can be classified as a radical, populist right-wing party. It supports traditional values, a solidary policy and close relations between Church and State [32,33]. By contrast, the main “Liberal Poland” party, PO, has a more lax economic programme, which aims to limit the regulatory role of the state and decentralise power. At the same time, PO is in favour of separating Church from State as well as openness and religious and sexual tolerance [34].
This analysis of the spatial differentiation of the two main political camps’ election results (i.e., “Solidary Poland” and “Liberal Poland”) in local units is based on the level of electoral support recorded in the parliamentary elections of 2005, 2015 and 2019 (Table 1, Figure 2). The spatial distribution of support for the two opposition camps in the 2005 and 2015 parliamentary elections reveals significant changes in the growing polarisation of political views in Poland. In 2005, the highest concentration of support for the “Solidary Poland” camp could be observed in the south-eastern part of the country and ranged from over 70% in selected communes of Podkarpackie Voivodeship to just 3–5% in some communes of Podlaskie Voivodeship, home to a Belarusian minority, Orthodox Christians and Muslim descendants of Polish Tatars. On the other hand, the highest support (50–60%) for the “Liberal Poland” camp could be found in north-western Poland as well as in highly urbanised areas of south and eastern Poland, including the Warsaw and Krakow agglomerations. It should be stressed, however, that the distribution of communes with an above-average level of support for both political formations was to a large extent spot-centred (Figure 2), indicating a relatively small degree of differentiation among Poles in terms of their political views.
Nevertheless, this situation would change significantly over the next ten years. In 2015, political views unequivocally divided Poland into two parts and the distribution of support was territory-centred. Voters of the “Liberal Poland” camp were concentrated in north-western Poland (e.g., the Poznań agglomeration), with a level of support of 50–60%, whereas voters of the “Solidary Poland” camp dominated in central-eastern Poland (e.g., selected communes of the Podlaskie, Podkarpackie and Małopolskie voivodeships), with more than 70% of support (Figure 2). Furthermore, in 2005 and 2015 an additional distinct concentration of support for the “Liberal Poland” camp occurred in the Bieszczady Mountains in Podkarpackie Voivodeship, where there is a high percentage of migrants from various regions of Poland, a consequence on the one hand of the “Vistula” operation (The “Vistula” operation was a forced pacification action of a military character carried out in the years 1947–1950 by the state structures of the Polish People’s Republic against the Ukrainian Insurgent Army (UPA) and the Organisation of Ukrainian Nationalists operating in the territory of Poland, in order to cut off the fighting units from their natural base. The operation consisted of the mass displacement of the civilian population from south-eastern Poland (mainly from Bieszczady) to western territories. From the 1960s, these areas started to be repopulated (e.g., via financial incentives for migration), with people coming from various regions of Poland, including large cities [35,36,37]) and on the other of the specificity of this area, which attracts “unconventional” inhabitants. Those were, e.g., economic migrants, political refugees from Greece and Macedonia, or generally individuals looking for widely understood freedom and their own “place on Earth” in a romantic mountain landscape.
Notably, the results of the 2019 elections showed a significant increase in support for the “Solidary Poland” camp (e.g., support for PiS exceeded 40%), as demonstrated by a large number of communes where maximum support exceeded 80% (40 communes), while minimum support in selected communes increased to approximately 20%. In the area of prevailing support for the “Solidary Poland” camp, in 2019 (just as in 2015) there were clusters of communes where such support was relatively weak. Exceptions included highly urbanised communes of the Warsaw and Lodz agglomerations, selected communes located in north-eastern Poland (Podlasie) inhabited by Belarusians, Muslims and members of the Orthodox Church, and the Bieszczady Mountains located in peripheral parts of south-eastern Poland and inhabited by a population from western Poland. Additionally notably, in 2005 the distribution of communes with above-average support for either political formation was to a large extent of a point-concentric nature, providing evidence that Poles did not vary greatly in their political opinions. However, the situation changed dramatically in the next few years. Starting in 2007, political views continued to divide Poland into two parts, while the distribution of support changed into surface-concentric. This may be interpreted as an increase in the diversity of citizens’ political views in a spatial arrangement.

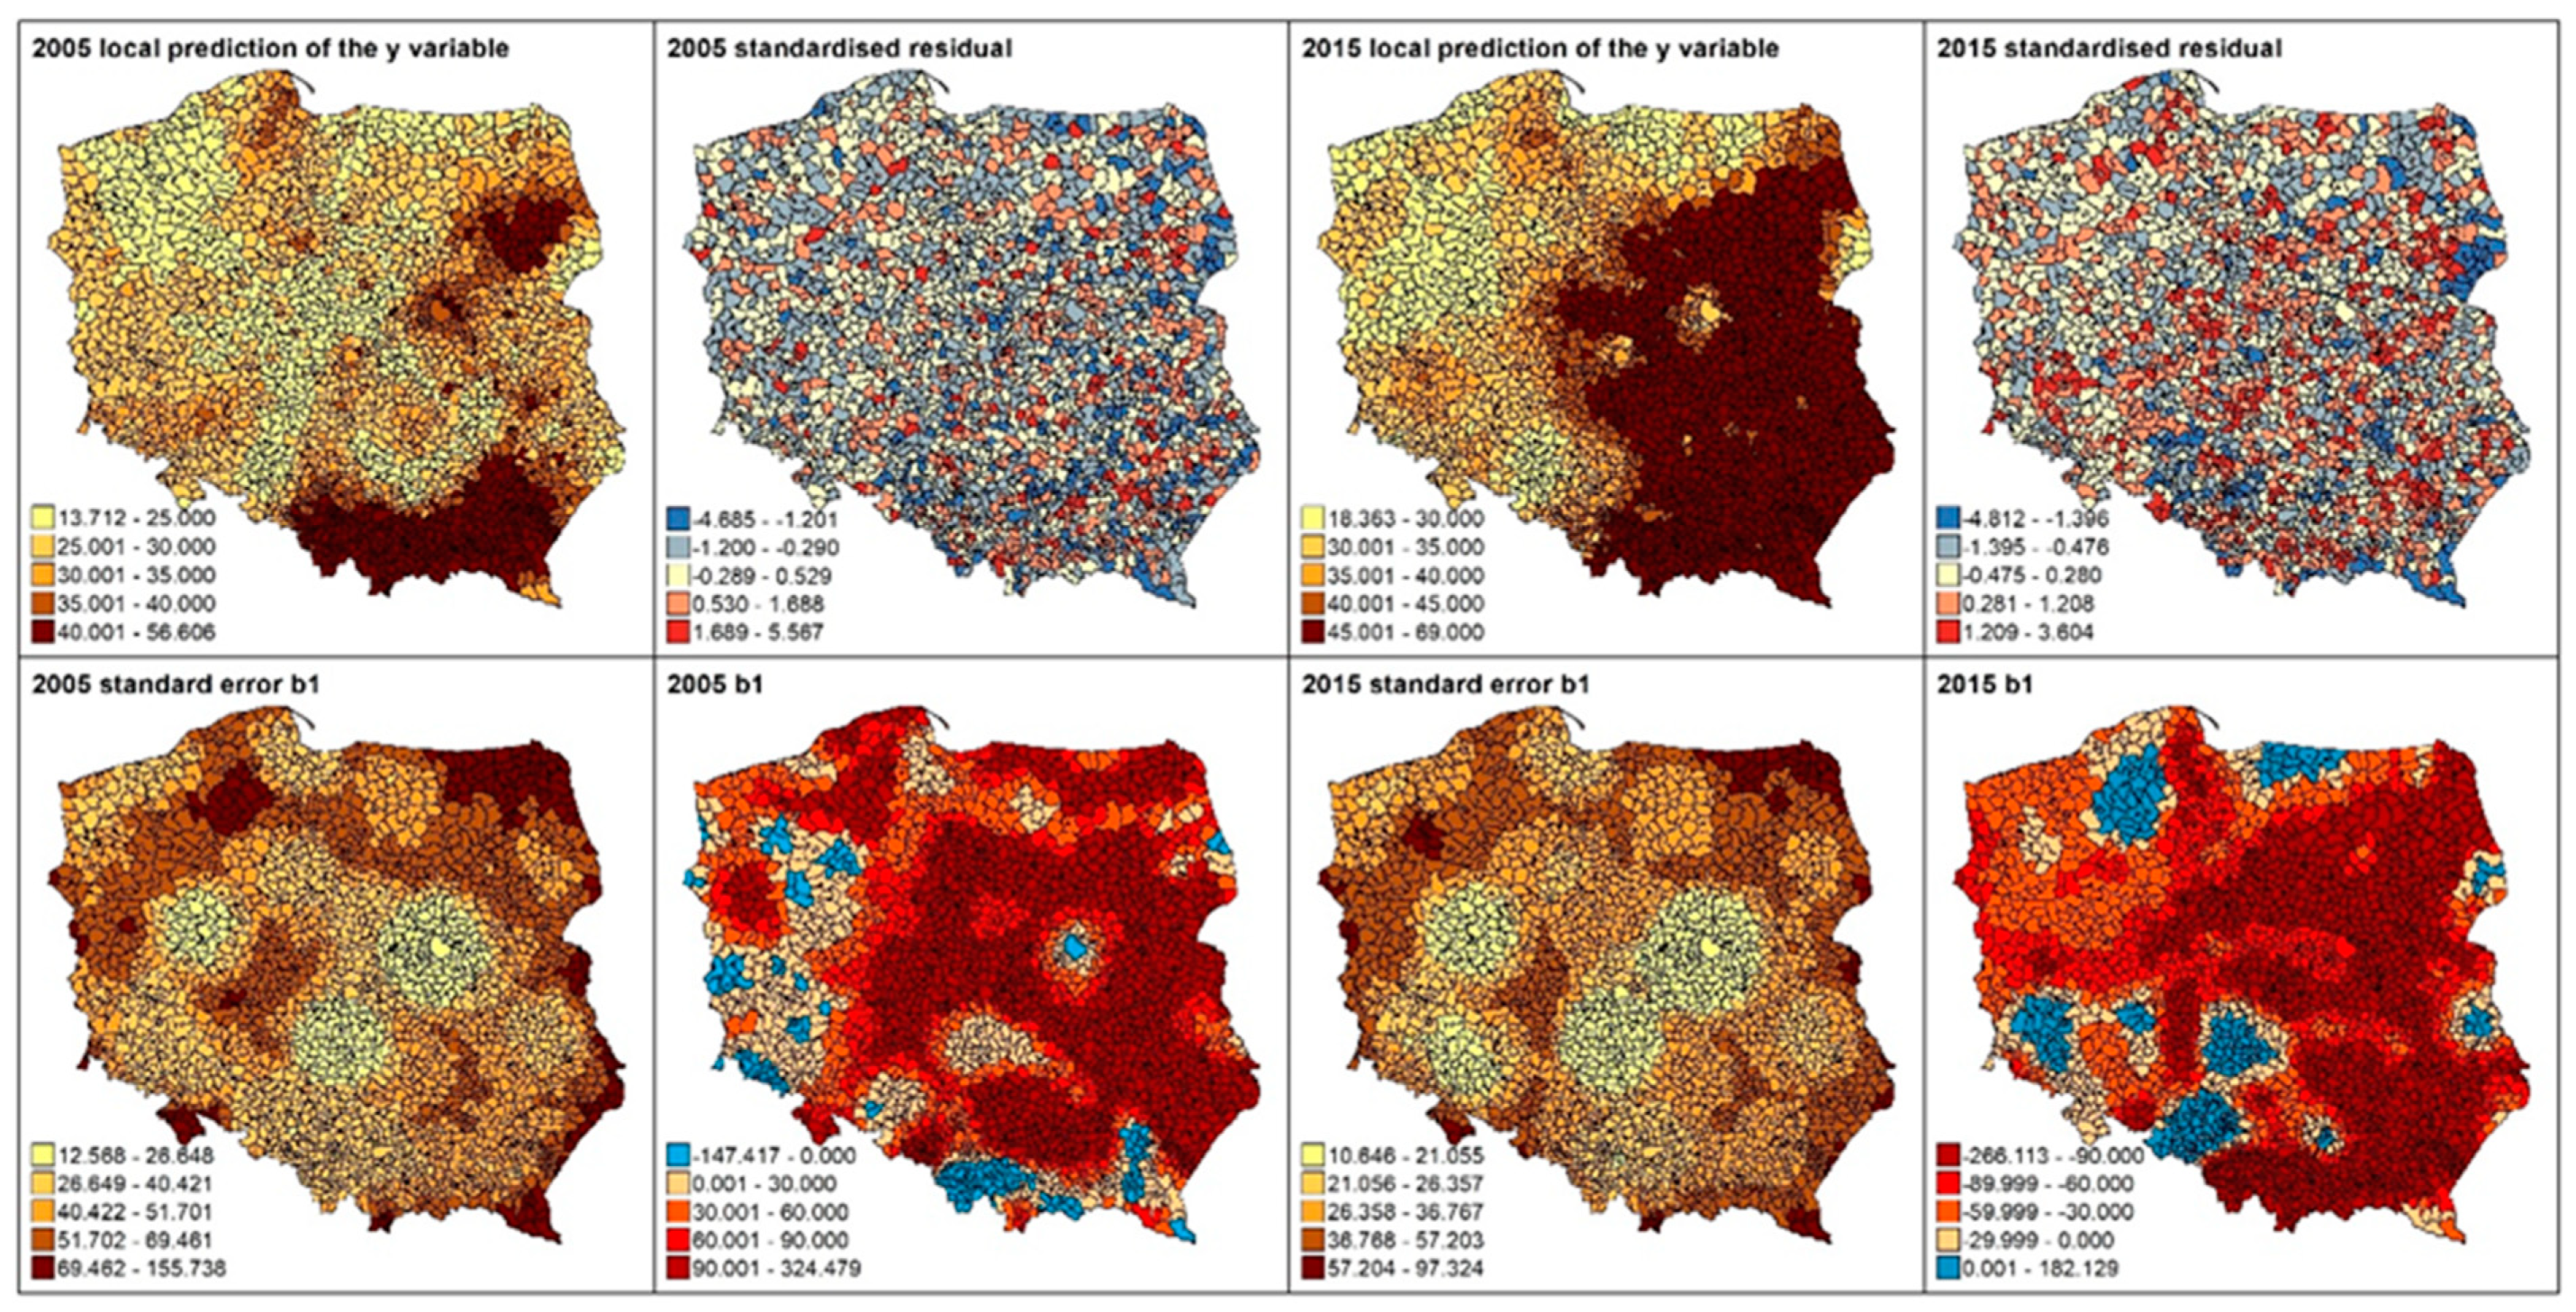
3.3. Socio-Economic Growth vs. Political Preferences in Poland in the Years 2005–2015

The spatial distribution of the level of social and economic development demonstrates clear regularities, corresponding to the spatial distribution of political support (especially in 2015) for the political parties representing “Solidary Poland” and “Liberal Poland”.
In Poland, differences in socio-economic development are quite apparent at a local level, in a generalised division between western and eastern Poland. To present these differences, we use classification showing in a synthetic way the development of communes in 2004–2018. Due to the fact that a classification is a synthetic picture, we can assume that it depicts fixed social and economic differences in Poland at a local level, as confirmed by the partial distributions for 2005 and 2015 (Figure 3).
In the classification, five types of communes can be identified, encompassing units with high to low levels of development. The spatial distribution of communes with high and average-high levels of growth strongly corresponds with highly urbanised (and, to some extent, highly industrialised) areas (Figure 3). The biggest cities and their immediate vicinities can be treated as growth poles and areas of socio-economic development, in a national and regional approach (mainly in western Poland). The major cities include Warsaw, Poznań, Wrocław, Krakow, Tri-City, Szczecin and, to a lesser extent, the remaining capitals of the provinces. On the other hand, eastern Poland hosts an above-average concentration of communes with low and average-low levels of development, located chiefly in regional and industrial centres. Therefore, poorly developed areas can be treated as peripheries of socio-economic growth [17,38].
Therefore, an attempt was made to verify the hypothesis concerning the relationship between the level of social and economic development and the level of political support. For this purpose, several regression methods were used, in which the level of political support for political parties representing the “Solidary Poland” block, expressed as a percentage of votes cast for parties from this block, was assumed as a dependent variable (Y), while the value of a synthetic indicator presenting the level of social and economic development was assumed as an explanatory variable. Each time the survey was conducted for both 2005 and 2015. The variables used in the analysis were continuous (quotient), but they did not have a normal distribution (tests for normality: Kolmogorov–Smirnov, Lilliefors, Shapiro–Wilk, p < 0.00000).
In the first step, a simple regression analysis using the least squares method was carried out. OLS regression modelling showed no correlation between the indicated variables. The determination factor R2 was 0.04 and 0.08, respectively, at Akaike information criterion values of 19,248 and 19,524. To identify the spatial differentiation of the relationship between the level of socio-economic development and the level of political support, GWR models were estimated. As a result of the estimation procedure, a set of 2478 localised regression equations and local measures of the degree of matching were obtained (Table 2). The GWR models, through which for each observation, equations were estimated taking into account the characteristics (explanatory variable) of the neighbouring locations, indicated a much better match between the model and the empirical data. The global values of the adjusted GWR model determination factor were 0.553 and 0.767, respectively, while the AIC values were 17,506 and 16,237 (σ = 8.022 and 6.258) (All computations were based on ArcGIS 10.3 software with the GWR module [19]). However, it should be remembered that GWR only allows one to determine the strength of the impact of an explanatory variable on a dependent variable in a specific location. The local values of R2 indicate how well the explanatory variable values around a specific point replicate the dependent variable. Therefore, these values should not be directly identified with R2 from the global model. Local R2 values reflect two issues: how well the model replicates data and how stationary the modelled processes are.
The spatial distribution of predicted values of political support resulting from the level of socio-economic development in both years under review is generally highly consistent with the actual distribution of political preferences (Figure 4). Nevertheless, in both 2005 and 2015 there was spatial autocorrelation of standardised remnants of regression (GWR). The values of Moran I global statistics were 0.124 (z-score 9.99, p = 0.00000) and 0.216 (z-score 17.375, p = 0.00000), respectively, but it is worth noting that no LISA (Local Indicators of Spatial Association) was statistically significant at α = 0.001. At α = 0.05, by contrast, there were several statistically significant hot spots, most of which were relatively easy to interpret. The low-low areas include the south-eastern part of Podlaskie Voivodeship where there are Belarusian, Orthodox and Muslim minorities, the area of Opole Silesia inhabited by a German minority, the Silesian-Dąbrowa Basin with a traditionally left-wing electorate (Sosnowiec was the birthplace of Edward Gierek, First Secretary of the Polish United Workers’ Party between 1970 and 1980, who is associated with industrialisation and improving people’s quality of life) and the Bieszczady Mountains with a significant immigrant population. In turn, hot-hot areas are found in Kashubia and Podhale (traditional family model), in the Legnica-Głogów Basin and in the vicinity of Bełchatów and Stalowa Wola (industrial districts characterised by a large share of workers and their families).
This situation indicates that the GWR model does not take into account variables related, for example, to the intensity of occurrence of national and/or religious minorities. The lack of such data in the communal perspective in both analysed periods results from the lack of official public statistics (the last data come from 2002 from the National Census). By contrast, the standard errors of the explanatory variables in both cases are highest in border areas, associated instead with the edge effect occurring when estimating the bandwidth and the kernel function.

4. Discussion

Support for the “Liberal Poland” camp can be found in areas with a relatively higher level of development, which are better able to use the spatial effects of agglomeration. Such areas mainly found in western Poland and cities with their functional areas and rural areas inhabited by immigrants lacking strong emotional relationships with their place of residence, relatively low levels of religiosity and higher levels of openness and tolerance. Support for the “Solidary Poland” camp is typical of economically weaker areas, which include all peripheries and areas with permanent economic and social marginalisation, affected by the negative consequences of increasingly polarised development. The vast majority of the electorate living in these areas supports the “Solidary Poland” camp and both its electoral behaviour and its variability correspond to the patterns indicated in the results of other studies [1,2,3,4,5,39]. It should be stressed, however, that in the case of Poland, this dynamic does not translate into growing dissatisfaction manifested in the form of negative attitudes towards EU membership, as is increasingly observed in Europe [40] (Despite the developmental spatial differences indicated, Poles’ high level of support for EU membership and its consequences have been record-breaking since 2004, when the country joined the EU. According to Centre for Public Opinion Research (CBOS) surveys from 2019, 91% of Poles support EU membership and only 5% are against it).
The results indicate strong and statistically significant relations between the distribution of political support and the spatial regularities of socio-economic development. Importantly—and especially in the case of Poland—these spatial regularities are not limited to a simple dependence of the structure of political views on the structure of the level of development and require a more detailed interpretation. As to their condition and character, they make up a set of three main groups of determinants, as presented in works by Domański [41], Gorzelak [42,43], Hryniewicz [14], Kowalski [44] and Zarycki [7], among others. These groups include: (1) persistent, historically formed differences in socio-economic development; (2) the post-communist transformation; and 3) inhabitants’ social and cultural attitudes.
The contemporary socio-economic disparity in Poland is well-established and, to a large extent, reflects both historical spatial arrangements and contemporary developmental processes. The historical differences, which are related to the contemporary division into east and west, date back to the late Middle Ages, when the Wisła River constituted a barrier against the technological and institutional advances occurring in the West [43,44]. This arrangement was modified by the borders of the three Partitions from 1815 to 1918. The division into “Solidary Poland” and “Liberal Poland” resulted from the diverse levels of socio-economic development seen as a function of the relict borders from these Partitions, as confirmed by the results of other studies [7,43]. The former Prussian Partition, encompassing present-day western and northern Poland, today enjoys a superior economic situation to the rest of the country, underpinned to some extent by its historical foundation. This is the result of the systemic policy adopted by Prussia in the Polish territory under its jurisdiction, targeted at creating conditions for boosting the economy’s effectiveness. Indeed, efforts were made to improve commercial food production and create the necessary infrastructure for food processing. Another focus area was the industrialisation not only of large cities but also sub-regional and local cities, resulting in the development and reinforcement of the settlement grid. The effectiveness of the economic system in these areas was underpinned by a dense transport network. This area now represents the majority political support for the “Liberal Poland” camp. The Russian Empire adopted an entirely different policy in Polish territory, which in central and eastern Poland (coinciding with the Russian Partition) has had a long-term negative effect on social and economic processes. Indeed, the Empire’s negligence of these areas and their inhabitants resulted in stagnation and marginalisation. This can be attributed to poor-quality agriculture coupled with point and relatively low-level industrialisation and accompanied by a non-existent transport network. This area now represents the political base for the majority support for the “Solidary Poland” camp. The situation in the Austrian Partition was intermediate and has resulted today in a diverse level of socio-political development in the southern part of Poland. In this area, support for the “Solidary Poland” camp prevails, with distinct enclaves of supporters of “Liberal Poland” (e.g., Krakow with a large share of the intelligentsia and the Bieszczady Mountains with a large share of immigrants from the West).
After 1990, post-communist transformation processes in Poland led to structural changes related to deindustrialisation and the development of modern services, taking place in the most rapidly growing cities and urbanised regions. These processes have resulted in a division into metropolitan and extra-metropolitan areas in Poland’s spatial structure, replacing the former juxtaposition of urban and rural areas [42,43]. The diverse voting preferences are reflected in this arrangement, because the biggest agglomerations and their functional (metropolitan) areas enjoy the highest levels of socio-economic development, with prevailing “Liberal Poland” voters.
Inhabitants’ social and cultural attitudes, revolving around piety, devotion to one’s family and tradition as well as the population’s “settled-down nature” [34,45], greatly affect the spatial distribution of political support in Poland. This is a good basis for identifying the general regularities of specific populations and explaining the exceptions, namely zones of contrasting characteristics. The residents of western Poland tend to be more open, modern and flexible about changes. They represent the natural electorate of “Liberal Poland”. On the other hand, the inhabitants of eastern and southern Poland are mainly historically settled, conservative, have considerable respect for traditional values and religion and are very attached to land passed from one generation to the next. They are mainly representants of the “Solidary Poland” electorate. The social and cultural features of these inhabitants justify their deviations from the regularities presented above. A case in point is the aforementioned Bieszczady Mountains, located on the outskirts of south-eastern Poland, which are characterised by a low level of socio-economic development and are extremely marginalised, but are also home to a large number of inhabitants from western Poland. As a result, the low level of growth here is accompanied by relatively strong support for “Liberal Poland”.
The deliberations presented in this article connect with the latest discourse related to “places that don’t matter” [39,46], representing peripheral and often marginalised areas whose inhabitants hope for growth and a higher standard of living, as promised by populist parties. This leads to a growing sense of inequality and social injustice and, consequently, possible social conflict, a significant barrier to accomplishing the latest goals of sustainable development, including the suggestion that every person has the right to inclusive economic progress (UN General Assembly, Transforming Our World: The 2030 Agenda for Sustainable Development, 21 October 2015, A/RES/70/1, available at: https://www.refworld.org/docid/57b6e3e44.html (accessed on 21 September 2021)). Reduction of the negative impact of indicated barrier requires a coordinated use of the endogenous potential of each area and not limit oneself to waiting for the effects of development spillover from growth pole areas. That problem is taking into consideration within the new scientific field defining as the geography of discontent [47]. As Rodríguez-Pose [48] stresses, “place-sensitive development policies” should focus on uncovering undiscovered and dormant potential and strengthening underused opportunities. This requires the creation of conditions for the complete and objective identification of the networked local resources forming the capital of each territory. This should be done on the basis of theoretical assumptions for evidence-based policy programming, objectively tailored to local realities, as well as the application of the principles of people-based and place-based policies. However, first of all we should strive to strengthen the capacities of local stakeholders to shape the future growth of a given area, regardless of its current level of development [49]. Importantly, this does not require increasing the scope of intervention as much as improving its quality, which is mostly determined by institutional factors [50].
Research results expand the knowledge of “geography of discontent”. We confirmed i.e., the results achieved by Essletzbichler et al. [1] who indicated that voting preferences apart socio-demographic characteristics of individuals also depend on the geographical context in which decisions are made. Essletzbichler et al. [1] took into account also such factors as the impact of immigration and urban size. Our research complements the catalogue of these factors with the impact of historical heritage deeply rooted in past reaching back to the 19th century and even the Middle Ages [17]. The analysis also expands the catalogue of country types where the issue of “places that don’t matter” arises. It is not only problem of most often analysed countries of old democracies with the highest level of socio-economic development such as the USA [4,5] or UK [2,3,4] but also Poland, which is example of relatively young democracy with political scene which is still under construction. The study also develops methodology of electoral geography through geographically weighted regression implementation what allowed to build regression models satisfactory in terms of statistical and mathematical criteria [6].
The future research directions of the issues presented here should pertain to more detailed and quantitative analyses of the relationship between the current distribution of political support and the remaining factors that significantly determine voting preferences, including cultural, ethnic and religious factors. To some extent, the spatial diversity of these factors coincides with differences in the levels and dynamics of socio-economic development in Poland. We can therefore question the exclusive dependence of the spatial disparity of political behaviour on economic factors [17,42,44,49]. In such research, it would also be helpful to evaluate the importance of cohesion policy interventions and to increasingly account for a place-based approach, in order to limit the negative phenomena accompanying “places that don’t matter”.

5. Conclusions

This research’s results have verified hypothesis H1: the increase in the spatial disparity of political support in Poland is persistent. Indeed, the results of the parliamentary elections between 2005 and 2019 have confirmed that the voting preferences of Polish people have become increasingly spatially polarised. The existing divisions can be viewed in two dimensions: in relation to the division of Poland into east (with its considerable support for the populist “Solidary Poland” camp) and west (where voters’ prevailing preference is for the “Liberal Poland” faction). The other identified division of political support runs along either the urban–rural axis or the metropolitan–extra-metropolitan line. Traditionally, the former faction has been most popular in peripheral rural areas, while support for the latter has prevailed in the biggest cities, which act as regional growth centres. Support for “Solidary Poland” is typical of economically weaker areas, which also include all peripheries and areas with permanent economic and social marginalisation, affected by the negative consequences of the polarisation of development. These areas are characterised by significant depopulation, low and weak industrialisation, relatively lower efficiency and competitiveness of fragmented agriculture and limited access to services. They are located mainly in eastern, central and southern Poland, showing a very high dependence on rural areas with a range of traditional, multi-generational, small-scale and semi-subsistence individual farms.
The other hypothesis (H2, The spatial distribution of support for specific political options shows significant correlations with the distribution of social and economic growth) may be deemed largely plausible. The results of the analyses presented here indicate strong and statistically significant relations between the distribution of political support and the spatial regularities of socio-economic phenomena. In particular, this is confirmed by the high values of the coefficient of determination of the GWR models (0.553 and 0.767) and the values of the AIC criterion (17.506 and 16.237). However, it would be misleading to state unequivocally that diverse levels of socio-economic development determine the spatial distribution of political support. It should be also remembered that traditional cultural divisions are the key factor affecting ideological attitudes and political choices.
In the process of achieving the study goal and hypotheses verification, results were obtained, providing the elements of scientific novelty. What was proved was the spatial relationship between the level of socio-economic development and the growing support for populist groups. Moreover, the proposed methodological approach can be treated as an innovative use of econometric methods (ordinary least squares regression and geographically weighted regression).

Author Contributions

Conceptualisation, T.H. and B.K.-S.; methodology, R.P.; validation, R.P.; formal analysis, T.H. and R.P.; investigation, T.H., B.K.-S., P.C. and R.P.; resources, T.H. and B.K.-S.; data curation, R.P., B.K.-S. and T.H.; writing—original draft preparation, T.H., B.K.-S., P.C. and R.P.; writing—review and editing, T.H., B.K.-S., P.C. and R.P.; visualisation, T.H. and R.P.; supervision, T.H. and P.C.; project administration, P.C.; funding acquisition, T.H., B.K.-S., P.C. and R.P. All authors have read and agreed to the published version of the manuscript.

Funding

This research was carried out as part of the FORSED research project (www.forsed.amu.edu.pl, accessed on 30 November 2021) funded by the National Science Centre (No. 2015/19/B/HS5/00012): New challenges of regional policy in shaping socio-economic development factors of less developed regions.

Institutional Review Board Statement

Not applicable.

Informed Consent Statement

Not applicable.

Data Availability Statement

Publicly available data sets were analysed in this study. The data can be found here: https://stat.gov.pl/en/ accessed on 1 December 2021, https://wybory.gov.pl/index/?language=en&tab=wybory&accessibility=off accessed on 1 December 2021.

Conflicts of Interest

The authors declare no conflict of interest. The funders had no role in the design of the study, in the collection, analysis or interpretation of data, in the writing of the manuscript or in the decision to publish the results.

References

  1. Essletzbichler, J. The victims of neoliberal globalization and the rise of the populist vote: A comparative analysis of three recent electoral decisions. Cambridge J. Reg. Econ. 2018, 11, 73–94. [Google Scholar] [CrossRef]
  2. Goodwin, M.J.; Heath, O. The 2016 referendum, Brexit and the left behind: An aggregate level analysis of the result. Political Q. 2016, 87, 323–332. [Google Scholar] [CrossRef]
  3. Harris, R.; Charlton, M. Voting out of the European Union: Exploring the geography of leave. Environ. Plan A 2016, 48, 2116–2128. [Google Scholar] [CrossRef] [Green Version]
  4. Inglehart, R.F.; Norris, P. Trump, Brexit, and the Rise of Populism: Economic Have-nots and Cultural Backlash; Faculty Research Working Paper Series, RWP16-026; Harvard Kennedy School: Cambridge, MA, USA, 2016; Available online: https://www.hks.harvard.edu/publications/trump-brexit-and-rise-populism-economic-have-nots-and-cultural-backlash (accessed on 14 June 2020).
  5. McCarty, N.; Poole, K.T.; Rosenthal, H. Polarized America; The MIT Press: Cambridge, MA, USA, 2016. [Google Scholar]
  6. Rykiel, Z. Polish electoral geography and its methods. Przestrz. Społecz. 2011, 1, 17–48. [Google Scholar]
  7. Zarycki, T. The electoral geography of Poland: Between stable spatial structures and their changing interpretations. Erdkunde 2015, 69, 107–124. [Google Scholar] [CrossRef] [Green Version]
  8. Tworzecki, H. Poland: A case of top-down polarization. Ann. Am. Acad. Pol. Soc. Sci. 2019, 681, 97–119. [Google Scholar] [CrossRef]
  9. Müller, J.W. Was ist Populismus? Suhrkamp: Berlin, Germany, 2016. [Google Scholar]
  10. Rodrik, D. Populism and the Economics of Globalization; Working Paper 23559; National Bureau of Economic Research: Cambridge, MA, USA, 2017; Available online: https://www.nber.org/papers/w23559 (accessed on 14 October 2021).
  11. Kriesi, H.P.; Grande, E.; Lachat, R.; Dolezal, A.; Bornschi, S.; Frey, T. Globalization and the transformation of the national political space: Six European countries compared. Eur. J. Political Res. 2006, 45, 921–956. [Google Scholar] [CrossRef] [Green Version]
  12. Kriesi, H.P.; Koopmans, R.; Duyvendak, J.W.; Giugni, M.G. New Social Movements in Western Europe: A Comparative Analysis; University of Minnesota Press: Minneapolis, MN, USA, 1995. [Google Scholar]
  13. Grabowski, W. 2018. Determinanty przestrzennego zróżnicowania wyników głosowania w wyborach parlamentarnych z 2015 roku. Stud. Socjol. 2018, 1, 35–64. [Google Scholar]
  14. Hryniewicz, J.T. Endo- i egzogenne czynniki rozwoju gospodarczego gmin i regionów. Stud. Reg. Lokal. 2000, 2, 53–77. [Google Scholar]
  15. Gawryszewski, A. Ludność Polski w XX Wieku; IGiPZ PAN: Warszawa, Poland, 2005. [Google Scholar]
  16. Bray, J.R.; Curtis, J.T. An ordination of the upland forest communities of southern Wisconsin. Ecol. Monogr. 1957, 27, 325–349. [Google Scholar] [CrossRef]
  17. Churski, P.; Herodowicz, T.; Konecka-Szydłowska, B.; Perdał, R. European Regional Development: Contemporary Regional and Local Perspectives of Socio-Economic and Socio-Political Changes; Springer: Cham, Switzerland, 2021. [Google Scholar]
  18. Fotheringham, A.S.; Brunsdon, C.; Charlton, M. Geographically Weighted Regression: The Analysis of Spatially Varying Relationships; John Wiley & Sons: Chichester, UK, 2002. [Google Scholar]
  19. Charlton, M.; Fotheringham, A.S. Geographically Weighted Regression. White Paper. National Centre for Geocomputation, National University of Ireland Maynooth. 2009. Available online: https://www.geos.ed.ac.uk/~gisteac/fspat/gwr/gwr_arcgis/GWR_WhitePaper.pdf (accessed on 15 January 2019).
  20. Lai, B.; Melkonian-Hoover, R. Democratic progress and regress: The effect of parties on the transitions of states to and away from democracy. Polit Res. Q. 2005, 58, 551–564. [Google Scholar] [CrossRef]
  21. Suchocka, H. Kształt sceny politycznej w Polsce w okresie transformacji systemowej. Toruń. Stud. Pol.-Włoskie 2016, 12, 9–24. [Google Scholar] [CrossRef]
  22. Szczerbiak, A. Poles Together? Emergence and Development of Political Parties in Post-Communist Poland; Central European University Press: Budapest, Hungary, 2001. [Google Scholar]
  23. Nyzio, A. W słabości siła. Bilans ewolucji polskich partii politycznych w latach 1989–2013. Poliarchia 2014, 2, 199–232. [Google Scholar] [CrossRef]
  24. Cześnik, M.; Kotnarowski, M. Nowy wymiar politycznego współzawodnictwa: Solidary Poland versus Liberal Poland. Studia Polityczne 2011, 27, 129–158. [Google Scholar]
  25. Obacz, P. Podział „Solidary Poland—Liberal Poland” w świetle Wybranych Koncepcji Pluralizmu Politycznego; LIBRON: Kraków, Poland, 2018. [Google Scholar]
  26. Raciborski, J. Polskie Wybory. Zachowania Wyborcze Społeczeństwa Polskiego w Latach 1989–1995; Scholar: Warszawa, Poland, 1997. [Google Scholar]
  27. Grabowska, M. Podział Postkomunistyczny. Społeczne Podstawy Polityki w Polsce po 1989 Roku; Wydawnictwo Naukowe Scholar: Warszawa, Poland, 2004. [Google Scholar]
  28. Radkiewicz, P. Ideological inconsistencies on the left and right as a product of coherence of preferences for values: The case of Poland. Pol. Psychol. Bull. 2017, 48, 93–104. [Google Scholar] [CrossRef] [Green Version]
  29. Heydrych, J. Amerykański system wyborczy–czy w Polsce również się sprawdzi? In Prawo Wyborcze i Wybory—Doświadczenia Dwudziestu lat Procesów Demokratycznych w Polsce; Stelmach, A., Ed.; Wydawnictwo Naukowe UAM: Poznań, Poland, 2010; pp. 257–271. [Google Scholar]
  30. Pilch, I. Wartości podstawowe a preferencje ideologiczne i decyzje wyborcze w wyborach do Sejmu 2011. Polit. Prefer. 2012, 3, 127–144. [Google Scholar]
  31. Hołubiec, J.; Szkatuła, G.; Wagner, D.; Małkiewicz, A. Baza wiedzy wyborów parlamentarnych 2007 roku i jej analiza. Stud. Proc. Pol. Assoc. Knowl. Manag. 2009, 19, 57–67. [Google Scholar]
  32. Mudde, C. Populist Radical Right Parties in Europe; Cambridge University Press: Cambridge, UK, 2007. [Google Scholar]
  33. Słomczynski, K.; Shabad, G. Perceptions of political party corruption and voting behaviour in Poland. Party Politics 2011, 18, 897–917. [Google Scholar] [CrossRef]
  34. Grosfeld, I.; Zhuravskaya, I. Cultural vs. economic legacies of empires: Evidence from the partition of Poland. J. Comp. Econ. 2015, 43, 55–75. [Google Scholar] [CrossRef]
  35. Maryański, A. Współczesne Migracje Ludności w Południowej Części Pogranicza Polsko-Radzieckiego i ich Wpływ na Rozmieszczenie sił Wytwórczych Tego Obszaru; WSP: Kraków, Poland, 1963. [Google Scholar]
  36. Jadam, H. Pionierska Społeczność w Bieszczadach; WSP: Rzeszów, Poland, 1976. [Google Scholar]
  37. Perdał, R.; Churski, P.; Herodowicz, T.; Konecka-Szydłowska, B. Cities in the polarised socio-economic space of Poland. Studia Miej. 2019, 34, 11–26. [Google Scholar] [CrossRef]
  38. Rodríguez-Pose, A. The revenge of the places that don’t matter (and what to do about it). Cambridge J. Reg. Econ. 2017, 11, 189–209. [Google Scholar] [CrossRef]
  39. Rodríguez-Pose, A. The rise of populism and the revenge of the places that don’t matter. LSE Public Policy Rev. 2020, 1, 1–9. [Google Scholar] [CrossRef]
  40. Dijkstra, L.; Poelman, H.; Rodríguez-Pose, A. The geography of EU discontent. Reg. Stud. 2019, 54, 737–753. [Google Scholar] [CrossRef]
  41. Domański, B. Sprawiedliwość społeczna a przestrzenne zróżnicowanie rozwoju społeczno-gospodarczego Polski–kilka refleksji dyskusyjnych. Stud. Reg. Lokal. 2021, 2, 109–116. [Google Scholar]
  42. Gorzelak, G. Czynniki i wymiary regionalnych zróżnicowań Polski. In Transformacje. Przewodnik po Zmianach Społeczno-Ekonomicznych w Polsce; Górny, A., Kaczmarczyk, P., Lesińska, M., Eds.; Wydawnictwo Naukowe Scholar: Warszawa, Poland, 2016; pp. 202–209. [Google Scholar]
  43. Gorzelak, G. Różnice regionalne–preferencje polityczne–sprawiedliwość społeczna. Stud. Reg. Lokal. 2021, 2, 117–127. [Google Scholar]
  44. Kowalski, M. 2016, Trwałość Geograficzna Wyników Wyborów w Polsce; IGiPZ PAN. Available online: https://www.igipz.pan.pl/tl_files/igipz/ZGMiL/osoby/sleszynski/JOW_seminarium_Prezentacja_MKowalski.pdf (accessed on 16 November 2021).
  45. Zarycki, T. Politics in the periphery: Political cleavages in Poland interpreted in their historical and international context. Eur. Asia Stud. 2000, 52, 851–873. [Google Scholar] [CrossRef]
  46. McCann, P.; Rodríguez-Pose, A. Why and when development policy should be place-based. In OECD Regional Outlook; Organisation for Economic Co-operation and Development (OECD): Paris, France, 2011; pp. 203–213. [Google Scholar]
  47. Iammarino, S.; Rodríguez-Pose, A.; Storper, M. Why Regional Development Matters for Europe’s Economic Future; Working Papers of the Directorate-General for Regional and Urban Policy, WP 07/2017; European Commission: Brussels, Belgium, 2017. [Google Scholar]
  48. Rodríguez-Pose, A. Do institutions matter for regional development? Reg. Stud. 2013, 47, 1034–1047. [Google Scholar] [CrossRef] [Green Version]
  49. Churski, P.; Konecka-Szydłowska, B.; Herodowicz, T.; Perdał, R. Does History Matter? Development Differences in Poland. In Dilemmas of Regional and Local Development; Bański, J., Ed.; Routledge Taylor & Francis Group: London, UK, 2021; pp. 185–205. [Google Scholar]
  50. Churski, P.; Herodowicz, T.; Konecka-Szydłowska, B.; Perdał, R. Spatial Differentiation of the Socio-Economic Development of Poland–“Invisible” Historical Heritage. Land 2021, 10, 1247. [Google Scholar] [CrossRef]
Figure 1. The principal division of the Polish political scene in 2005–2019 (source: own elaboration). Legend: PiS—Prawo i Sprawiedliwość; LPR—Liga Polskich Rodzin; SAM—Samoobrona; Kuk—Kukiz’15; Kor—KORWiN; PSL—Polskie Stronnictwo Ludowe; SLD—Sojusz Lewicy Demokratycznej; ZL—Zjednoczona Lewica (SLD, Zieloni, etc.); SDPL—Socjaldemokracja Polska; PO—Platforma Obywatelska; N—Nowoczesna; RP—Ruch Palikota; KO—Koalicja Obywatelska.
Sustainability 13 13604 g001
Figure 2. Support for the political camps in parliamentary elections in 2005–2019 (source: own elaboration on the basis of data from the National Electoral Committee).
Sustainability 13 13604 g002
Figure 3. Socio-economic development in Poland by commune (source: authors’ own elaboration).
Sustainability 13 13604 g003
Figure 4. Selected local parameters of GWR (source: own elaboration).
Sustainability 13 13604 g004
Table 1. Political parties’ results in elections to the Parliament of the Republic of Poland in 2001–2019 * (source: own elaboration on the basis of data from the National Electoral Commission).
200120052007 **201120152019
Party% of VotesParty% of VotesParty% of VotesParty% of VotesParty% of VotesParty% of Votes
SLD-UP41.04PiS26.99PO41.51PO39.18PiS37.58PiS43.59
PO12.68PO24.14PiS32.11PiS29.89PO24.09KO27.40
SRP10.20Samoobrona11.41SLD13.51Ruch Palikota10.02Kukiz’158.81SLD12.56
PiS9.50SLD11.31PSL8.91PSL8.36Nowoczesna7.60PSL8.55
PSL8.98LPR7.97 SLD8.24PSL5.13KWiN6.81
LPR7.87PSL6.96 KORWiN4.76
ZL7.55
Italics—“Solidary Poland”, Bold—“Liberal Poland”, Normal—other political parties. * The table specifies the parties with a minimum level of 5.0% of support (the threshold for entering the Parliament and obtaining a proportionate number of mandates). ** In 2007, at the request of Sojusz Lewicy Demokratycznej (SLD), the tenure of the Parliament was shortened, and early elections were organised as a result of a deepening political crisis.
Table 2. Properties of the estimated GWR models * (source: authors’ own compilation).
20052015
R2 adj.0.5530.767
AIC17,50616,237
Sigma8.0226.258
Effective number327256
Bandwidth (m)28,47032,329
SEb0b1SE b1local R2SEb0b1SE b1local R2
Min0.83–32.34–147.4212.570.0000.93–5.41–266.1110.640.000
Max7.8875.26324.48155.740.4316.17123.40182.1397.320.595
Mean7.4516.2285.9844.370.1055.9261.05–79.1131.170.133
St. dev.0.5315.9871.1715.690.0990.3222.1863.0411.650.125
coefficient of variation0.070.990.830.350.9450.050.360.800.370.940
* Parameter h (the bandwidth), specifying the number of observations used to estimate the coefficients related to each observation, was based on the criterion minimising the AIC value. The kernel function was identified based on the fixed method. All calculation were made in ArcGIS 10.3 software with an embedded GWR module described in the work [19].
Publisher’s Note: MDPI stays neutral with regard to jurisdictional claims in published maps and institutional affiliations.

