Abstract
The EU Green Deal, beginning in 2019, promoted a roadmap for operating the transition to a sustainable EU economy by turning climate issues and environmental challenges into opportunities in all policy areas and making the transition fair and inclusive for all. Focusing on the built environment, the voluntary adoption of rating systems for sustainability assessment is growing, with an increasing market value, and is perceived as a social responsibility both by public administration and by private companies. This paper proposes a framework for shifting from a static sustainability assessment to a digital twin (DT)-based and Internet of Things (IoT)-enabled dynamic approach. This new approach allows for a real-time evaluation and control of a wide range of sustainability criteria with a user-centered point of view. A pilot building, namely, the eLUX lab cognitive building in the University of Brescia, was used to test the framework with some sample applications. The educational building accommodates the daily activities of the engineering students by constantly interacting with the sensorized asset monitoring indoor comfort and air quality conditions as well as the energy behavior of the building in order to optimize the trade-off with renewable energy production. The framework is the cornerstone of a methodology exploiting the digital twin approach to support the decision processes related to sustainability through the whole building’s life cycle.
1. Introduction
Europe is currently engaging the threat of climate change and environmental degradation as crucial for the preservation of our community. The strategy should be inclusive and invest in sustainable growth and transformation, adopting and boosting the vision of a modern, resource-efficient, and competitive economy. The European Green Deal [1] thus has the tasks to avoid net emissions of greenhouse gases by 2050, promoting a model of economic growth that is decoupled from resource use with a main focus on inclusivity where no person and no place have to be left behind. The European Green Deal is the action plan to make the EU’s economy sustainable, turning climate and environmental challenges into opportunities, and making inclusive the transition. The main points range between the efficient use of resources by moving to a clean, circular economy; the restoration of biodiversity; and the decisive cut of emission and soil, water, and air pollution. A selection of financing tools have also been made available to support the creation of a European Climate Law, which is needed to turn the theoretical and political commitment into a legal obligation and hence an effective action. Achieving this target will require actions by all sectors of the European economy, including investing in environmentally friendly and innovative cross field technologies [2]; supporting industry to innovate; rolling out cleaner, cheaper, and healthier forms of private and public transport; decarbonizing [3] the energy sector; ensuring buildings are more energy efficient; and working with international partners to improve global environmental standards. Energy efficiency [4] maintains a driving role, however, a holistic approach is now clearly compulsory when the Green Deal approach entails further environmentally related issues such as mobility, technology, and social inclusive methodologies. Sustainability assessment in the built environment encompasses this holistic approach and it is the direct answer [5,6] for the built environment response with the connection both with the urban and natural environments.
Rating systems are used in the construction sector to support in the life cycle design, construction, and operating of buildings [7]; however, in some cases, the labeling and the score process can lead to a point fever [8,9] that is more market-oriented [10,11] than actually focused on environmentally friendly actions [12]. Furthermore, in these cases, the voluntary certification is conceived as an arrival point when the building is realized; however, in fact it is a starting point for the life cycle assessment of the evolution of the building facing the changes that it will have during its lifespan [13,14].
The rating systems for assessing sustainability in buildings are organized in evaluation areas, which include criteria and multiple indicators for each criterion. The more points gained, thus increasing the given score, the more architectural quality, reliability, energy efficiency, economic convenience, and reduced environmental impact should be reached. Nevertheless, the score is not the unique worldwide shared definition of sustainability in buildings, since different countries have diverse national rating systems that can provide a distinct score, as similar evaluation areas have different indicator weights [15,16]. Additionally, the incessant revising of the evaluation protocols struggles to incorporate in the rating procedures an evolving concept rooted in the field experience [17,18]. The first and second generation of rating systems born in the late 1990s (e.g., LEED - Leadership in Energy and Environmental Design, BREEAM - Building Research Establishment Environmental Assessment Method, 1998–2004; SBC - Sustainable Building Council, ITACA - 2009–2012) have a building and then district focus, while in the last decades, the third generation of rating systems incorporate the social aspect as a key driver of the wellbeing in indoor space evaluation (e.g., WELL, Living Building Challenge 2006–2016), stressing the user-centered approach, although great fragmentation of perspectives persists [19,20].
An additional strength of the assessment tools is their use as guidelines in the design phase and certification framework in the construction phase; however, the voluntary nature of the instrument reduces a wider adoption and the use of the checklist as tool of evaluation, which has a static configuration, and fails in detecting possible dynamic changes. From this limit starts the idea of shifting the static approach to a dynamic real-time monitoring procedure of assessing the sustainability indicators frequently associated with energy efficacy, which represent the evaluation area with the highest percentage weight [21,22,23]. This paper, therefore, depicts a sustainable digital twin (SDT) framework, partially implemented in the pilot Cognitive Building eLUX lab at University of Brescia, and partially to be possibly executed in scalable application on further assets, aiming at the compliance verification to specific client targets (e.g., materials, green mobility, energy and environmental impact, waste management, water saving, innovation, users’ wellbeing, resilience, urban agriculture), crossing the main sustainability protocols.
The SDT leverages the IoT network installed in the educational pilot building, and it can possibly be expanded on the basis of the following described steps in order to measure and endorse the assessment of different criteria that the building information modeling (BIM) methodology empowers [24,25,26] in the direction of a green BIM concept [27,28,29,30]. The traditional static checklist for sustainability assessment becomes a dynamic cockpit driving the KPI (key performance indicator) adjusting processes timely updated by actuators through the digital twin dashboard. This paper develops a preliminary innovative idea that demonstrates the possibility to create a dynamic tunable method capable of pursuing the building in the life cycle and establishing a BIM-based structure, which includes the calculation of a significant fraction of evaluation areas and criteria where the sustainability is rooted. The method could effectively support the built environment control and monitoring to durably evolve towards a green and sustainable dimension, adopting the digital twin as a reliable AI (artificial intelligence)-based calculation environment for predictive models.
2. Background
The digital twin (DT) is a relative new trend in the construction sector [31], although it is widely used in manufacturing as one of the enabling technologies of Industry 4.0 [32]. The sustainability of the built environment, on the other hand, is a research topic that, despite its extraordinary topicality, has a long history in the construction sector. In the following part of this paragraph, the most recent issues related to rating systems for sustainability assessments and the use of BIM and IoT for the development of DT are presented.
2.1. Sustainability Rating Systems
Rating systems have been adopted in the past 15 years as instruments to assist the sustainability evaluation at building and district level. The Bruntland Report of the World Commission on Environment and Development “Our Common Future” [33] dates to 1987 and enshrines the idea of a systemic view linking the three pillars of environmental, social, and economic sustainability [34,35]. Currently, rating systems are employed in many states [36,37], adopting a main framework that is customized at national level considering cultural, geographic, and economic background [38,39] and calculation methodologies [40,41]. In this panorama, some tools have a higher rank of adoption and lead the real estate market (e.g., LEED, BREEAM, SBC) working at a cultural level by increasing the public and private sector consciousness and understanding. In the structure of the evaluation areas, in which the protocols are articulated, the energy section is predominantly significant, especially in the tools of the first generation; however, it is included in all the checklists (Figure 1), and although in most of the EU countries, specific regulations are in force, in countries where inadequate attention is dedicated to energy issues, the protocols are adopted as design guidelines from conscious designers and environmentally oriented municipalities [42].
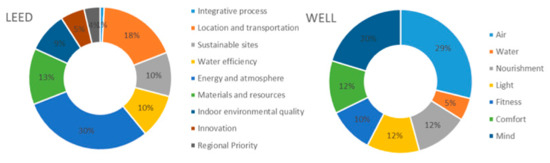
Figure 1.
Distribution of the evaluation scores for LEED protocol and WELL certification system.
A side effect of the rating systems checklist-based structure is that they are applied to obtain the accessible certification score for market placement in the real estate sector, rather than focusing on the whole building life cycle optimization. Furthermore, a high score cannot always be considered the best solution, as according with local specific needs, economic, structural, or technological constraints could change the game [43]. Ultimately, the significance of the rating systems relies in the control of multiple topics that are additionally linked, and strategies and technologies adopted for one indicator can empower or interfere with other indicators. For the complex nature of the phenomena, the checklist arrangement is not suitable to emphasize these correlations and to predict the possible fallouts [44,45]. The main evaluation areas shared by rating systems for building sustainability assessment are depicted in Figure 2. This figure shows the interconnections among all the various topics considered by main sustainability rating protocols and highlights the fact that many of them, even if there are some differences in the names, are shared.
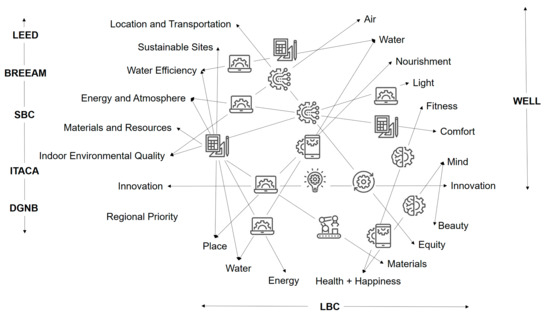
Figure 2.
Evaluation areas in different rating systems with strategies and technologies for enabling the dynamic monitoring approach.
The dominant protocols, i.e., LEED [46], BREEAM [47], SBC [48], ITACA [49], and DGNB - German Sustainable Building Council [50], are located in the left side and show common evaluation areas including site and location, water and energy saving, environmental impacts, materials and resources, indoor environmental quality, innovation, and regional priority. It is worth noting that in the different systems, some areas differ in name but the same indicators are included. On the opposite side and at the bottom of the scheme, the areas for the WELL rating system [51] and for the Living Building Challenge (LBC) protocol [52] are itemized.
These protocols, as mentioned above, are the third-generation protocols and are promoting a new emphasis on occupants’ health and wellbeing extending to evaluation areas included in their scoreboards. Most criteria are intended to deliver the final score of the project, however, some of them can change in time, also in real-time (such as the net positive energy, the solar glare control, the net positive waste, or mindful eating, to range over different areas) or following the maintenance schedule (such as periodic water quality testing, the change of adaptable spaces, and the post occupancy survey, which affect the Building Life-Cycle Impact Reduction calculation). As an example, in the WELL certification framework, the air quality indicators start to have a dynamic approach on the basis of sensorized environments and monitoring systems (such as the indicators air quality monitoring and feedback, air infiltration management, and self-monitoring), and feedback and data gathering involves users and building facilities. In this scenario, the idea of a bi-directional relationship between a cognitive building and its users [53,54] endorses the new approach to the SDT (sustainable digital twin).
2.2. BIM, IoT, and Digital Twin
Making a BIM model a digital twin is a matter of being able to collect, analyze, and visualize data—data collected in time series modify the way people interact with the built environment [55]. As an example, researchers are applying this concept to smart contracts [56], facility management [57], and maintenance [58].
Before the installation, the scope(s) of a sensor network must be carefully defined, with attention on where the sensor is positioned, which data are to be collected, and which protocol needs to be used [59]. Common choices [60,61] are temperature, humidity, light, sound, pressure, ultrasound, CO2, temperature, VOC, and motion sensors, but the granularity of the information to be collected must be considered when defining the number of sensors to be placed. We recommend the reader reviews [62] for a comprehensive review of the existing sensors and their performance in various context and situations.
Moreover, the communication technology is relevant because being able to easily collect data in real time is mandatory. An approach that has increased in recent literature has a possible solution—LoRa (low range) low-power wide-area network, which interconnects the sensor network so that longer ranges of some hundred meters between each node can be achieved. In this case, all sensor nodes send data through the LoRa network to a specialized node charged to gather the data and add them to the database. An example is given in [63].
Authors [64] highlight the importance of data visualization for the involvement of stakeholders, which goes in the same direction of the objective of this current research.
3. Methods and Tools
The eLUX DT, described in detail in the following paragraph, has many BIM uses, i.e., many methods of applying building information modeling during a facility’s lifecycle to achieve one or more specific objectives [65]. Some of these uses are related to sustainability and aim at involving users in reaching the goals set by the university. The four main uses of the eLUX DT in the sustainability field are illustrated by Figure 2:
- (a)
- DT set up;
- (b)
- Real-time data collection;
- (c)
- Users’ behavior adaptation;
- (d)
- Sustainability monitoring.
In the remaining part of the paragraph, each process is defined and described to provide a full picture of methods and tools used in this research, whereas an in-depth description of the structure of the DT is given in Section 3.2.
3.1. Digital Twin Set up and Real-Time Data Collection
Although eLUX DT was made well after the building was built, the process to create the DT (left side of Figure 3) was as compliant to the International Organization for Standardization ISO 19650-3 [66] as possible.
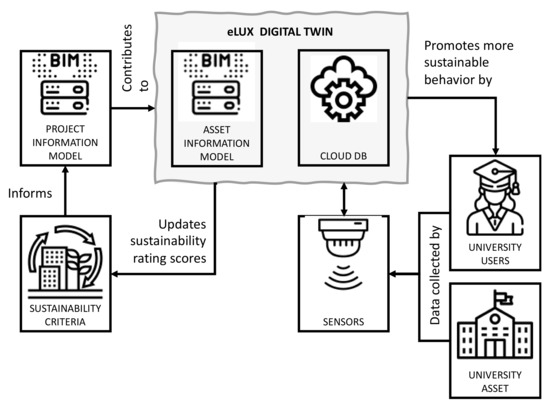
Figure 3.
Working schema of eLUX sustainable digital twin for sustainability dynamic assessment.
During the last major refurbishment, the BIM model in the DT, namely, the asset information model (AIM), was made upon the project information model (PIM) created in the design stage and implemented in the construction stage. The PIM, in turn, was designed according to information requirements informed by the sustainability rating protocol used. Maltese et al. [67,68] suggests using BIM guidelines for this purpose [69,70,71]. A more technical explanation of the DT is given in the case study description.
3.2. Sustainability Monitoring and Users’ Behaviour Adaptation
Focusing on sustainability, there are two main kinds of users of the data collected in the DT: those who work, teach, study, and live on the campus, i.e., the university users, and the consultants in charge of updating and maintaining the sustainability rating of the building [72,73]. The former are educated experts who can access data through complex tools specific for their job, such as, for example, BIM authoring tools. The latter need simple and usable access [74], all the more so if the aim is to persuade users to change their habits and behavior towards more sustainable attitudes.
This consideration raised two research questions:
- How can the DT and the sensors’ network be expanded to cover more rating criteria and thus better help sustainability experts in their work?
- How can data be better communicated to users so that they can change their behaviors to achieve greater sustainability?
Two main research activities, whose first results are described in the following paragraphs, were set up to answer these questions. To ensure that more data could be provided to sustainability experts, we carried out an analysis of the data required by some of the most common rating protocols. This analysis highlighted different types of data:
- data required by rating protocols and already collected in the DT;
- data required by rating protocols, not collected in the DT and included in the Industry Foundation Classes(IFC) schema;
- data required by rating protocols, not collected in the DT and not included in the IFC schema;
- data not needed for rating protocols, but that could be useful to improve users’ behavior from a sustainability (rating) point of view.
In addition to this classification, the necessary data were analyzed to determine the origin, the type, the intended use, the dimensional range, and the variability over time. This data analysis has a paramount importance when facing the problem of defining where to store the data in the DT.
Data already in the IFC schema, to be used by sustainability experts and with a slow variability over time, are better stored in the AIM. On the other hand, data to be fed by users, with a high variability over time and maybe not in the IFC schema, are better kept in a database connected to the AIM [75,76].
Changing the behavior of building users to achieve greater sustainability is quite complex. eLUX users are already accustomed to visualizing data on informative monitors [77] and energy control equipment [78,79] (such as the charging station of the electrical vehicle or the dashboard about photovoltaic production) [80], as well as interacting with the building through an app [81]; therefore, it was easier to retrieve information to be communicated to the users from the data in the DT in order to improve their behavior from the sustainability point of view.
4. Case Study and Results
After an exhaustive description of the case study building and the information and communication technologies used in it for the connection with the DT, we, in the remaining part of the section, illustrate two examples of the use of the DT for the continuous monitoring of LEED sustainability parameters. In particular, the first example shows how some parameters of the “indoor environmental quality” credit category are monitored during the use phase of the building, while the second illustrates how the parameters of the “materials and resources” and “indoor environmental quality” categories are updated in the case of maintenance.
4.1. The Case Study Building
The technological framework, deployed in the last 5 years through National funding programs, has promoted the eLUX lab [82] as a strategic objective of the University of Brescia [83] to boost up an advanced concept of the future buildings and shaping the multidisciplinary research in the field. The living laboratory of eLUX encompasses a group of versatile Information and Communications technology (ICT) and energy infrastructures and services, which are located in the engineering faculty area at the University of Brescia, Italy. The University of Brescia Engineering Campus is situated in the northern side of Brescia, Italy, and contains all departmental facilities (i.e., staff offices, meeting rooms, labs, and lecture halls) and campus amenities, including students’ resident home, reading rooms, a lunchroom, and a fitness center, among others. The buildings of the campus are fed by a private medium voltage (MV) power grid connected to the main network by means of a MV point of delivery (POD). All the campus facilities are connected to the MV grid through medium to low voltage (M/V) electrical substations. The power consumption of each of the building of the campus and the energy production of the renewable generators distributed in the campus is monitored through a real-time monitoring system [84].
The “Modulo Didattico” building, one of the oldest structures on the campus, was considered to be the main driver and experimental site for the design, testing, and analyzing the smart building approach. The “Modulo Didattico” hosts computer labs in the recently renovated basement, as well as classrooms on the ground and first floors. The “Modulo Didattico” building is also the headquarters of eLUX lab. IoT sensors, controllable plants, and ICT tools turned the “Modulo Didattico” building into a living environment. The building is able to automatically calculate and evaluate the use of spaces and energy-related infrastructures by collaborating (directly or by machine learning algorithms) with end-users. A graphical representation of sensors and assets of eLUX building is shown in Figure 4. eLUX lab and the IoT assets.
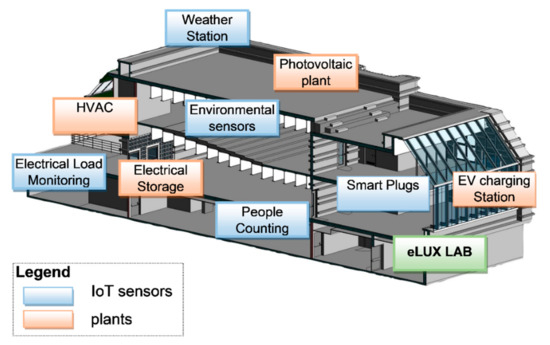
Figure 4.
eLUX lab and the IoT assets.
Measurements of indoor air quality [85] (e.g., carbon dioxide (CO2), volatile organic compounds (VOC), temperature, and relative humidity) and outdoor environmental conditions (i.e., temperature, relative humidity, barometric pressure, external irradiance) are tracked through IoT sensors, installed, separately, in the rooms and on the building roof. Feedback about the quality of the perceived comfort are collected from the users of the building through a dedicated app (Figure 5).
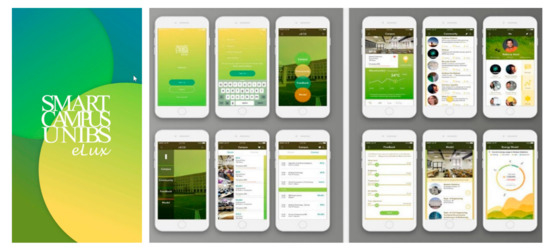
Figure 5.
Smart Campus Unibs eLUX app.
The information collected by the sensors and from the users can be used to optimize the daily heating ventilation and air conditioning (HVAC) schedules. Each of the parameters of the HVAC plant is monitored and can be remotely modified. A 10 kWp photovoltaic (PV) field, located on the roof of eLUX building, is connected to the main electric plant. Each of the parameters of the PV field are monitored and controlled by a supervision system. Such a system is able to forecast the power profile of PV generators the day ahead, using a mixed deterministic model and machine learning-based models. The electric consumption (in terms of active and reactive energy and power) of each of the sections of the eLUX building is monitored through a distributed monitoring system, formed by smart meters. An AC Level 2 charging station (7.7 kW/single-phase, slow, 25.6 kW/three-phase fast) is installed on the electric plant of the eLUX building. The total energy provided by the charging station is constantly monitored by a dedicated smart meter. The building is equipped with a total of seven informative monitors installed in common areas, which are used by the users to visualize to the aggregated information about the energy behavior of the building.
4.2. The eLUX Digital Twin
The building, the headquarters of the eLUXlab, hosts a small server room equipped with a hyper-converged system (produced by the company Syneto), working as a storage area network (SAN) with virtualizing capabilities, personal computers, and servers (Dell PowerEdge Server), and a real-time digital simulator (produced by OPAL-RT, CPU Intel Xeon E5, 4-core with 3GHz to 32 cores/2.3GHz, FPGA Xilinx Viretx7 485T) with power hardware in the loop (PHIL) test capabilities. The server room is responsible of physically hosting the data acquired by the plants described in the previous section. In particular, the SAN has been configured in order to store the real-time stream of data generated by the IoT sensors and transmitted on the building physical Ethernet network.
The real-time data are stored in a noSQL time series database (InfluxDB) that is potentially able to manage the stream generated by hundreds of thousands of sensors and thousands of contemporary queries. The stream of real-time data stored in the database (DB) are used to feed the DT of the building, and can be used to estimate the current level of the sustainability of the building as SDT by monitoring the information about the plants (e.g., energy production from renewables, HVAC energy consumption) and by tracking the user behavior (e.g., the total amount of recycled waste). The SAN also hosts enterprise resource planning (ERP; based on the open source Odoo framework), which is used to store the information about the assets (i.e., state of plants, components of each plant, and much more information). The architectural and structural details of the building are available through the BIM of the building. The BIM is used as the basis of the digital twin of the eLUX building and it can be connected to the data obtained by the sensors in order to highlight the current state of KPIs of the building.
4.3. Indoor Environmental Quality Monitoring
The LEED Reference Guide for Building Design and Construction [86] has some minimum program requirements (MPRs) that are the minimum characteristics or conditions that make a project appropriate to pursue LEED certification [87]. These requirements are foundational to all LEED projects and define the types of buildings, spaces, and neighborhoods that the LEED rating system is designed to evaluate. Focusing on the rating protocol for schools, among the credit category “indoor environmental quality”, one of the required credits is, for example, “minimum indoor air quality performance”, set by LEED with the intent of contributing to the comfort and well-being of building occupants by establishing minimum standards for indoor air quality. One of the requirements in this credit is “monitor carbon dioxide (CO2) concentrations within each thermal zone”. LEED requires that CO2 “monitors must have an audible or visual indicator or alert the building automation system if the sensed CO2 concentration exceeds the setpoint by more than 10%”. eLUX SDT records CO2 levels in many points inside the building.
Regarding LEED indoor environmental quality, the SDT records every change in values of temperature, relative humidity, and CO2 concentration. These three recorded parameters are used to calculate the comfort condition on a scale from 1 to 27, as described in [76]. This scale represents all the possible indoor condition states, going from 1 (best condition), to 13 (average condition), to 27 (worst condition). The best-case scenario considers (a) both the indoor air temperature and the relative humidity in the comfort range, and (b) CO2 concentration lower than 600 ppm, which means a healthy indoor air quality. The average condition (13) is defined when an issue is perceived; however, the condition is not strongly critical, i.e., the temperature is below 20 °C (a little bit cold), the relative humidity is lower than 30% (dry air perceived), and CO2 concentration is between 600 and 1000 ppm (between fresh air and lower limit of fresh air). The critical conditions are defined when the temperature is higher than 22 °C (too warm implies a reduction of optimal cognitive performance), relative humidity above 45% (wet perception), and CO2 concentration higher than 1000 ppm. Figure 6 shows an example of how sensor outputs can be processed and communicated. In this figure, each grey disk in the edges of the triangle represents the measurement of the parameter compared to the average value of the reference period (dotted circle), which in this case is the winter period. The central disk, instead, is the comfort condition calculated from the measurements gathered (from 1 (best) to 27 (worst)) and compared to the worst possible condition (dash-dotted circle); the closer the disk and the circle, the worse the indoor environmental quality.
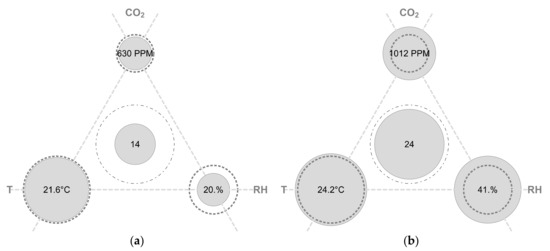
Figure 6.
Two winter days (a) with comfort conditions and (b) with comfort issues in MLAB2 indoor environmental quality as measured by eLUX sustainable digital twin (SDT). The grey disks picture the measured or computed values (left—temperature; right—relative humidity; top—CO2; centre—overall condition in a scale from 1 (best) to 27 (worst)). The dotted grey circles describe the average winter conditions and the dash-dotted circle in the center describes the worst possible condition, i.e., condition 27.
The same information on environmental parameters and comfort conditions can be provided to more expert users via the BIM model by means of thematic plans (Figure 7), also supporting possible corrective actions to the HVAC to provide suitable indoor conditions.
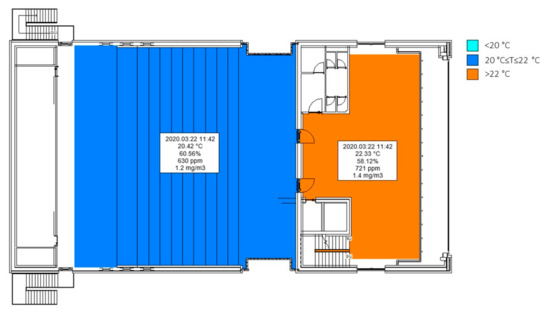
Figure 7.
Example of a thematic plan describing comfort conditions in two rooms of the eLUX building.
Thematic plans are a useful instrument for showing data, which could be updated e.g., by using VPL (visual programming language) compatible with the BIM authoring tools (e.g., Dynamo in this case); thus, the DT is an instant picture of the real building, with a specific time stamp. Larger datasets are otherwise stored in proper database, more suitable to manage high volumes of data.
4.4. Sustainability Monitoring During Building Maintenance
Another effective example of how SDT is used for building sustainability is the case of building maintenance. In this case, the main users of the SDT are the certification experts and not the building users, and thus nearly all information is communicated directly through the BIM model. When maintenance works are carried out on the building, the DT is updated in accordance with established procedures. This keeps track of changes in all the data it contains and, as far as sustainability is concerned, ensures that the information is always up to date. Below are two examples of how the data is managed with regard to two LEED categories: “materials and resources” and “indoor environmental quality”.
In relation to the first category, “materials and resources”, one of the requirements of the LEED protocol is called “building product disclosure and optimization—environmental product declarations”. To comply with this requirement in the building, there should be at least 20 different permanently installed products sourced from at least 5 different manufacturers with industry-wide Environmental Product Declarations (EPDs) which conform to ISO 14025, and EN 15804 or ISO 21930.
In the same category, another requirement is “building product disclosure and optimization—sourcing of raw materials”. To conform to this requirement, products sourced from at least three different manufacturers that meet at least one of the LEED responsible sourcing and extraction criteria for at least 20%, by cost, of the total value of permanently installed building products should be used. The information relating to these two requirements is recorded in the DT and kept up to date in the BIM model of which it forms a part. In detail, data on EPD certifications are stored as parameters of the Revit object families (in Figure 8 the EPD consists in a document accessible by URL). Similarly, for each building or system component, information on the content of recycled material is stored in the parameters.
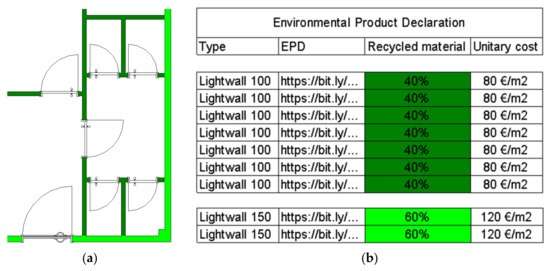
Figure 8.
Example of a thematic plan and schedule with data about EPD and recycled material.
An example related to the EPD and the sourcing of raw materials criteria is shown in Figure 8, where a thematic plan has been created in the BIM authoring software to help in rating calculations. In the map, walls’ color matches the percentage of recycled material, but other visual output can be arranged according to the needs of the sustainability experts. In this way, the BIM supports the calculation required by the sustainability framework and can provide the consistent SDT for the life cycle and the decision making processes, updating the information on the life cycle.
5. Discussion
The DT, when looked at from the sustainability point of view, has some limitations when a SDT creation is the target [87]. In the presented case study, among these limitations, the first that can deserve a mention is that the DT has been created during a long time span and, thus, with (information) requirements changing over time. The data collection systems have been developed to ease data mining for predictive maintenance, indoor air quality preservation, space organization, and people flow optimization with the main focus on energy efficiency, given the nature of the first foundation program at the basis of eLUX development. Sustainability assessment has been added later, and this caused some problems and in progress adjustments. The creation of a SDT with the sustainability kay role could be a smarter solution to overcome some rigidity of the system. This research envisions the possibility to establish a link between BIM and the checklists (e.g., LEED or WELL checklists) to revise the building score in real-time through a continuously updated connection between sensor data of database (DB) and sustainable digital twin (SDT). However, the process of managing information through the BIM model cannot be effectively interoperable nowadays. Reference standards, particularly the industry foundation classes (IFC) 4.1 [88], do not specify a unique name and standard storage mode for much of the information required to manage rating protocols such as LEED or WELL. This limitation has been overcome in the present research with the introduction of proprietary property sets that do limit the exchange of information with third parties.
Moreover, the proposed methodology can be extended to the district level (for example, adopting the LEED neighborhood checklist and including the whole smart campus at the University of Brescia [89]).
A further possible implementation in the eLUX pilot could be the development of a dashboard to guide the sustainability and the users’ behaviors towards a more sustainable living and building management. The possibility to promote an inception of this concept in the smart [90] and cognitive buildings and campuses can enable future developments in educational buildings [91,92], where the indoor conditions are strictly related to learning performance and academic results [93]. The advantages of this approach could be also exploited in in office buildings [94], where the workers’ productivity can be boosted by comfort conditions and interactive actions that can promote the adoption of the adaptive comfort model and strategies with consistent energy saving and comfort optimization.
6. Conclusions
The paper describes the use of digital twin for sustainability assessment through rating systems such as LEED, extending its use throughout the whole lifecycle of an asset encompassing design phase as well as use phase. Leveraging the SDT in the use phase allows for a better building management and real-time sustainability evaluation, overcoming the limits of the check-listed approach of the sustainability rating protocols. The pilot eLUX building, a cognitive asset prototype, was used as case study to test the SDT-based approach and define some exemplary applications. The eLUX is equipped with sensors and monitors that gather and display the information about indoor environmental quality and occupancy flows. The BIM-based SDT could support the users’ behavior, showing a sustainability scoreboard that could be implemented by the use of the existing monitors in the eLUX building in order to show the current status and suggest and support sustainable behaviors (increase recycling, correct waste breakdown, food education, etc.). This scenario could uplift the user experience, productivity, wellness, and green mindset driven by an app for customized messages (recharge vehicles or bicycles, switch off the laptop, etc.). The SDT is oriented by the concept of green BIM, providing a methodology framework that, although in its preliminary stage, has been proven to be useful for all the stakeholders involved in the process, including people working and studying in the building.
Author Contributions
L.C.T.: conceptualization, introduction, sustainability expertise contribution and discussion, editing and review; F.R.C.: methodology, research scheme, case studies and discussion; S.M.: application and case studies development, formal analysis; S.R.: DT organization, IoT network, data curation, validation; A.L.C.C.: BIM and DT discussion, A.F. funding acquisition. All authors have read and agreed to the published version of the manuscript.
Funding
This research received no external funding.
Institutional Review Board Statement
Ethical review and approval were waived for this study, because they were not applicable.
Informed Consent Statement
Informed consent was obtained from all subjects involved in the study.
Data Availability Statement
The data are not publicly available due to privacy reasons.
Conflicts of Interest
The authors declare no conflict of interest.
References
- Green Deal. Available online: https://ec.europa.eu/info/strategy/priorities-2019-2024/european-green-deal_it (accessed on 29 November 2020).
- Fraga-Lamas, P.; Fernández-Caramés, T.M. Leveraging Blockchain for Sustainability and Open Innovation: A Cyber-Resilient Approach toward EU Green Deal and UN Sustainable Development Goals. In Computer Security Threats; IntechOpen: London, UK, 2020. [Google Scholar] [CrossRef]
- Matijas, B. From the Captains of Industry to the Trustees of Sustainability: The Positioning of the Large Family-Owned Companies’ Core Values Regarding the Green Deal for Europe’s Decarbonization Goals. Master’s Thesis, Environmental Studies and Sustainability Science, Lund University, Lund, Sweden, 2020. [Google Scholar] [CrossRef]
- European Parliament. Directive (EU) 2018/844 of the European Parliament and of the Council of 30 May 2018 amending Directive 2010/31/EU on the energy performance of buildings and Directive 2012/27/EU on energy efficiency, L 156/75. Off. J. Eur. Union 2018, 156, 75–91. [Google Scholar]
- Bain, P.G.; Kroonenberg, P.M.; Johansson, L.-O.; Milfont, T.L.; Crimston, C.R.; Kurz, T.; Bushina, E.; Calligaro, C.; Demarque, C.; Guan, Y.; et al. Public views of the sustainable development goals across countries. Nat. Sustain. 2019, 2, 819–825. [Google Scholar] [CrossRef]
- D’Amato, D.; Droste, N.; Allen, B.; Kettunen, M.; Lähtinen, K.; Korhonen, J.; Leskinen, P.; Matthies, B.D.; Toppinen, A. Green, circular, bio economy: A comparative analysis of sustainability avenues. J. Clean. Prod. 2017, 168, 716–734. [Google Scholar] [CrossRef]
- Nguyen, B.K.; Altan, H. Comparative review of five sustainable rating systems. Procedia Eng. 2011, 21, 376–386. [Google Scholar] [CrossRef]
- He, Y.; Kvan, T.; Liu, M.; Li, B. How green building rating systems affect designing green. Build. Environ. 2018, 133, 19–31. [Google Scholar] [CrossRef]
- Zhao, D.X.; He, B.J.; Johnson, C.; Mou, B. Social problems of green buildings: From the humanistic needs to social acceptance. Renew. Sustain. Energy Rev. 2015, 51, 1594–1609. [Google Scholar] [CrossRef]
- Chegut, A.; Eichholtz, P.; Kok, N. Supply, demand and the value of green buildings. Urban Stud. 2014, 51, 22–43. [Google Scholar] [CrossRef]
- Zhang, L.; Wu, J.; Liu, H. Turning green into gold: A review on the economics of green buildings. J. Clean. Prod. 2018, 172, 2234–2245. [Google Scholar] [CrossRef]
- Gou, Z.; Lau, S.S.Y.; Prasad, D. Market readiness and policy implications for green buildings: Case study from Hong Kong. J. Green Build. 2013, 8, 162–173. [Google Scholar] [CrossRef]
- Dwaikat, L.N.; Ali, K.N. Green buildings life cycle cost analysis and life cycle budget development: Practical applications. J. Build. Eng. 2018, 18, 303–311. [Google Scholar] [CrossRef]
- Li, S.; Lu, Y.; Kua, H.W.; Chang, R. The economics of green buildings: A life cycle cost analysis of non-residential buildings in tropic climates. J. Clean. Prod. 2020, 252, 119771. [Google Scholar] [CrossRef]
- Chandratilake, S.R.; Dias, W.P.S. Sustainability rating systems for buildings: Comparisons and correlations. Energy 2013, 59, 22–28. [Google Scholar] [CrossRef]
- Doan, D.T.; Ghaffarianhoseini, A.; Naismith, N.; Zhang, T.; Ghaffarianhoseini, A.; Tookey, J. A critical comparison of green building rating systems. Build. Environ. 2017, 123, 243–260. [Google Scholar] [CrossRef]
- Bernardi, E.; Carlucci, S.; Cornaro, C.; Bohne, R.A. An analysis of the most adopted rating systems for assessing the environmental impact of buildings. Sustainability 2017, 9, 1226. [Google Scholar] [CrossRef]
- Awadh, O. Sustainability and green building rating systems: LEED, BREEAM, GSAS and Estidama critical analysis. J. Build. Eng. 2017, 11, 25–29. [Google Scholar] [CrossRef]
- Tagliabue, L.C.; Manfren, M. Sustainability Indicators for Buildings: Network Analysis and Visualization. In Expanding Boundaries Systems Thinking in the Built Environment, Proceedings of the Sustainable Built Environment (SBE) Regional Conference, Zurich, Switzerland, 13–17 June 2016; vdf Hochschulverlag: Zurich, Switzerland, 2016; Volume I, ISBN 978-3-7281-3774-6. Available online: https://vdf.ch/expanding-boundaries.html (accessed on 30 November 2020).
- Mattoni, B.; Guattari, C.; Evangelisti, L.; Bisegna, F.; Gori, P.; Asdrubali, F. Critical review and methodological approach to evaluate the differences among international green building rating tools. Renew. Sustain. Energy Rev. 2018, 82, 950–960. [Google Scholar] [CrossRef]
- Shan, M.; Hwang, B.G. Green building rating systems: Global reviews of practices and research efforts. Sustain. Cities Soc. 2018, 39, 172–180. [Google Scholar] [CrossRef]
- Newsham, G.R.; Mancini, S.; Birt, B.J. Do LEED-certified buildings save energy? Yes, but…. Energy Build. 2009, 41, 897–905. [Google Scholar] [CrossRef]
- Amiri, A.; Ottelin, J.; Sorvari, J. Are LEED-certified buildings energy-efficient in practice? Sustainability 2019, 11, 1672. [Google Scholar] [CrossRef]
- El-Diraby, T.; Krijnen, T.; Papagelis, M. BIM-based collaborative design and socio-technical analytics of green buildings. Autom. Constr. 2017, 82, 59–74. [Google Scholar] [CrossRef]
- Cheng, J.C.; Das, M. A BIM-based web service framework for green building energy simulation and code checking. J. Inf. Technol. Constr. ITcon 2014, 19, 150–168. [Google Scholar]
- Wong, J.K.W.; Zhou, J. Enhancing environmental sustainability over building life cycles through green BIM: A review. Autom. Constr. 2015, 57, 156–165. [Google Scholar] [CrossRef]
- Raouf, A.M.; Al-Ghamdi, S.G. Building information modelling and green buildings: Challenges and opportunities. Archit. Eng. Des. Manag. 2019, 15, 1–28. [Google Scholar] [CrossRef]
- Lee, S.; Tae, S.; Roh, S.; Kim, T. Green template for life cycle assessment of buildings based on building information modeling: Focus on embodied environmental impact. Sustainability 2015, 7, 16498–16512. [Google Scholar] [CrossRef]
- Lu, Y.; Wu, Z.; Chang, R.; Li, Y. Building Information Modeling (BIM) for green buildings: A critical review and future directions. Autom. Constr. 2017, 83, 134–148. [Google Scholar] [CrossRef]
- Solla, M.; Ismail, L.H.; Yunus, R. Investigation on the potential of integrating BIM into green building assessment tools. ARPN J. Eng. Appl. Sci. 2016, 11, 2412–2418. [Google Scholar]
- Al-Sehrawy, R.; Kumar, B. Digital Twins in Architecture, Engineering, Construction and Operations. A Brief Review and Analysis. In Lecture Notes in Civil Engineering, Proceedings of the 18th International Conference on Computing in Civil and Building Engineering. ICCCBE 2020, Sao Paolo, Brazil, 18–20 August 2020; Toledo Santos, E., Scheer, S., Eds.; Springer: Cham, Switzerland, 2021; Volume 98. [Google Scholar] [CrossRef]
- Tao, F.; Zhang, H.; Liu, A.; Nee, A.Y.C. Digital Twin in Industry: State-of-the-Art. IEEE Trans. Ind. Inform. 2019, 15, 2405–2415. [Google Scholar] [CrossRef]
- Brundtland, G.H. Report of the World Commission on Environment and Development Our Common Future, WCED 1987. Available online: http://www.un-documents.net/wced-ocf.htm (accessed on 30 November 2020).
- Hansmann, R.; Mieg, H.A.; Frischknecht, P. Principal sustainability components: Empirical analysis of synergies between the three pillars of sustainability. Int. J. Sustain. Dev. World Ecol. 2012, 19, 451–459. [Google Scholar] [CrossRef]
- Sneddon, C.; Howarth, R.B.; Norgaard, R.B. Sustainable development in a post-Brundtland world. Ecol. Econ. 2006, 57, 253–268. [Google Scholar] [CrossRef]
- Reed, R.; Wilkinson, S.; Bilos, A.; Schulte, K. A comparison of International Sustainable Building Tools—An Update. In Proceedings of the 17th Annual Pacific Rim Real Estate Society Conference, Gold Coast, Australia, 16–19 January 2011. [Google Scholar]
- Liu, G.; Nolte, I.; Potapova, A.; Michel, S.; Ruckert, K. Comparison of worldwide certification systems for sustainable buildings. In Proceedings of the SET2010—9th International Conference on Sustainable Energy Technologies, Shanghai, China, 24–27 August 2010. [Google Scholar]
- Motzl, H.; Fellner, M. Environmental and health related criteria for buildings. In Proceedings of the IBO Österreichisches Institut für Baubiologie und ökologie GmbH Austrian Institute for Healthy and Ecological Building, Final Report, Vienna, Austria, 31 March 2011. [Google Scholar]
- Alyami, S.H.; Rezgui, Y. Sustainable building assessment tool development approach. Sustain. Cities Soc. 2012, 5, 52–62. [Google Scholar] [CrossRef]
- Ng, S.T.; Chen, Y.; Wong, J.M.W. Variability of building environmental assessment tools on evaluating carbon emissions. Environ. Impact Assess. Rev. 2013, 38, 131–141. [Google Scholar] [CrossRef]
- Rezaallah, A.; Bolognesi, C.; Khoraskani, R.A. LEED and BREEAM.; Comparison between policies, assessment criteria and calculation methods. In Proceedings of the 1st International Conference on Building Sustainability Assessment (BSA 2012), Porto, Portugal, 23–25 May 2012; pp. 23–25. [Google Scholar]
- Işıl, R.S. The Multi-Level Perspective On Sustainable Building Design: An Account On Building Environmental Assessment Tools. In Proceedings of the CESB—Central Europe towards Sustainable Building 2013, Decision-Support Tools and Assessment Methods, Prague, Czech Republic, 26–28 June 2013. [Google Scholar]
- Asdrubali, F.; Baldinelli, G.; Bianchi, F.; Sambuco, S. A comparison between environmental sustainability rating systems LEED and ITACA for residential buildings. Build. Environ. 2015, 86, 98–108. [Google Scholar]
- Lupisek, A. Multicriteria assessment of building in context of sustainable building. Ph.D. Thesis, Czech Technical University in Prague, Faculty of Civil Engineering, Department of Building Structures, Prague, Czech Republic, 2013. [Google Scholar]
- Berardi, U. Sustainability assessment in the construction sector: Rating systems and rated buildings. Sustain. Dev. 2012, 20, 411–424. [Google Scholar] [CrossRef]
- LEED Leadership in Energy and Environmental Design. Available online: https://www.usgbc.org/leed (accessed on 30 November 2020).
- BREEAM Building Research Establishment Environmental Assessment Method. Available online: https://www.breeam.com (accessed on 30 November 2020).
- SBC Sustainable Building Challenge. Available online: http://www.iisbe.org/taxonomy/term/64 (accessed on 30 November 2020).
- ITACA Istituto Per La Trasparenza, L’aggiornamento E La Certificazione Degli Appalt. Available online: http://www.itaca.org/valutazione_sostenibilita.asp (accessed on 30 November 2020).
- DGNB German Sustainable Building Council. Available online: https://www.dgnb-system.de/en/system/index.php (accessed on 30 November 2020).
- Well Certification. Available online: https://www.wellcertified.com (accessed on 30 November 2020).
- Living Building Challenge certification. Available online: https://living-future.org/lbc-3_1/certification (accessed on 30 November 2020).
- Bittenbinder, F.; Liu, C.; Rinaldi, S.; Bellagente, P.; Ciribini, A.L.C.; Tagliabue, L.C. Bi-Directional Interactions between Users and Cognitive Buildings by means of Smartphone App. In Proceedings of the IEEE Second International Smart Cities Conference (ISC2 2016), Improving the Citizens Quality of Life, Trento, Italy, 12–15 September 2016. [Google Scholar] [CrossRef]
- Bittenbinder, F.; Liu, C.; Moretti, N.; Re Cecconi, F.; Tagliabue, L.C.; Ciribini, A.L.C.; Kovacic, I. A Vision for a Cognitive Campus Network of Universities: The Learnscapes of Poveglia Island. In Proceedings of the 3rd SDEWES Conference, Novi Sad, Serbia, 30 June–3 July 2018. [Google Scholar] [CrossRef]
- Bhargav, D.; Buda, A.; Nurminen, A.; Främling, K. A framework for integrating BIM and IoT through open standards. Autom. Constr. 2018, 95, 35–45. [Google Scholar] [CrossRef]
- Li, J.; Kassem, M.; Ciribini, A.L.C.; Bolpagni, M. A Proposed Approach Integrating DLT, BIM, IoT and Smart Contracts: Demonstration Using a Simulated Installation Task. In Proceedings of the International Conference on Smart Infrastructure and Construction 2019 (ICSIC), Cambridge, UK, 8–10 July 2019; pp. 275–282. [Google Scholar] [CrossRef]
- Chang, K.-M.; Dzeng, R.-J.; Wu, Y.-J. An Automated IoT Visualization BIM Platform for Decision Support in Facilities Management. Appl. Sci. 2018, 8, 1086. [Google Scholar] [CrossRef]
- Cheng, J.C.P.; Chen, W.; Chen, K.; Wang, Q. Data-driven predictive maintenance planning framework for MEP components based on BIM and IoT using machine learning algorithms. Autom. Constr. 2020, 112, 103087. [Google Scholar] [CrossRef]
- Tang, S.; Shelden, D.R.; Eastman, C.M.; Pishdad-Bozorgi, P.; Gao, X. A review of building information modeling (BIM) and the internet of things (IoT) devices integration: Present status and future trends. Autom. Constr. 2019, 101, 127–139. [Google Scholar] [CrossRef]
- Zemouri, S.; Magoni, D.; Zemouri, A.; Gkoufas, Y.; Katrinis, K.; Murphy, J. An Edge Computing Approach to Explore Indoor Environmental Sensor Data for Occupancy Measurement in Office Spaces. In Proceedings of the 2018 IEEE International Smart Cities Conference (ISC2), Kansas City, MO, USA, 16–19 September 2018; pp. 1–8. [Google Scholar] [CrossRef]
- Adeogun, R.; Rodriguez, I.; Razzaghpour, M.; Berardinelli, G.; Christensen, P.H.; Mogensen, P.E. Indoor Occupancy Detection and Estimation using Machine Learning and Measurements from an IoT LoRa-based Monitoring System. In Proceedings of the 2019 Global IoT Summit (GIoTS), Aarhus, Denmark, 17–21 June 2019; pp. 1–5. [Google Scholar] [CrossRef]
- Alioto, M.; Shahghasemi, M. The Internet of Things on Its Edge: Trends Toward Its Tipping Point. IEEE Consum. Electron. Mag. 2018, 7, 77–87. [Google Scholar] [CrossRef]
- Rodriguez Larrad, I.; Lauridsen, M.; Vasluianu, G.; Poulsen, A.N.; Mogensen, P.E. The Gigantium Smart City Living Lab: A Multi-Arena LoRa-based Testbed. In Proceedings of the 15th International Symposium on Wireless Communication System (ISWCS 2018), Lisbon, Portugal, 28–31 August 2018. [Google Scholar] [CrossRef]
- Kaewunruen, S.; Peng, S.; Phil-Ebosie, O. Digital Twin Aided Sustainability and Vulnerability Audit for Subway Stations. Sustainability 2020, 12, 7873. [Google Scholar] [CrossRef]
- Kreider, R.G.; Messner, J.I. The Uses of BIM: Classifying and Selecting BIM Uses. Version 0.9; The Pennsylvania State University: University Park, PA, USA, 2013; Available online: http://bim.psu.edu (accessed on 30 November 2020).
- ISO. ISO/FDIS 19650-3. Organization and Digitization of Information about Buildings and Civil Engineering Works, Including Building Information Modelling (BIM)—Information Management Using Building Information Modelling—Part 3: Operational Phase of the Assets; ISO: Geneva, Switzerland, 2020. [Google Scholar]
- Maltese, S.; Tagliabue, L.C.; Re Cecconi, F.; Pasini, D.; Manfren, M.; Ciribini, A.L.C. Sustainability Assessment through Green BIM for Environmental, Social and Economic Efficiency, International High-Performance Built Environment Conference—A Sustainable Built Environment Conference 2016 Series (SBE16), iHBE 2016. Procedia Eng. 2017, 180, 520–530. [Google Scholar] [CrossRef]
- Maltese, S.; Moretti, N.; Cecconi, F.R.; Ciribini, A.L.C.; Kamara, J.M. A lean approach to enable sustainability in the built environment through BIM. TECHNE J. Technol. Archit. Environ. 2017, 278–286. [Google Scholar] [CrossRef]
- Re Cecconi, F.; Tagliabue, L.C.; Maltese, S.; Ciribini, A.; Kovacic, I. Green BIM—A lean methodology to support sustainability assessment protocols. In Proceedings of the 17th International Multidisciplinary Scientific Geoconference SGEM 2017, Vienna, Austria, 27–29 November 2017; pp. 889–896, ISBN 978-619-7408-29-4. [Google Scholar] [CrossRef]
- Kaewunruen, S.; Xu, N. Digital twin for sustainability evaluation of railway station buildings. Front. Built Environ. 2018, 4, 77. [Google Scholar] [CrossRef]
- Kaewunruen, S.; Rungskunroch, P.; Welsh, J. A digital-twin evaluation of net zero energy building for existing buildings. Sustainability 2019, 11, 159. [Google Scholar] [CrossRef]
- Quay, R.; Hutanuwatr, K. Visualization of sustainability indicators: A conceptual framework. In Visualizing Sustainable Planning; Springer: Berlin/Heidelberg, Germany, 2009; pp. 203–213. [Google Scholar] [CrossRef]
- Tagliabue, L.C.; Maltese, S.; Re Cecconi, F.; Ciribini, A.L.C.; De Angelis, E. BIM-based interoperable workflow for energy improvement of school buildings over the life cycle. In Proceedings of the 35th International Symposium on Automation and Robotics in Construction (ISARC 2018), Berlin, Germany, 20–25 June 2018. [Google Scholar] [CrossRef]
- Re Cecconi, F.; Moretti, N.; Tagliabue, L.C.; Maltese, S. A BIM based decision support system for building maintenance. In Proceedings of the 35th CIB W78 2018 Conference IT in Design, Construction, and Management, Chicago, IL, USA, 1–3 October 2018; ISBN 978-3-030-00219-0. [Google Scholar] [CrossRef]
- Rinaldi, S.; Flammini, A.; Tagliabue, L.C.; Ciribini, A.L.C. On the use of IoT Sensors for Indoor Conditions Assessment and Tuning of Occupancy Rates Models. In Proceedings of the IEEE International Workshop on Metrology for Industry 4.0 and IoT, Brescia, Italy, 16–18 April 2018. [Google Scholar] [CrossRef]
- Tagliabue, L.C.; Re Cecconi, F.; Rinaldi, S.; Ciribini, A.L.C. IoT network-based ANN for ventilation pattern prediction and actuation to optimize IAQ in educational spaces. IOP Conf. Ser. Mater. Sci. Eng. 2019, 609. [Google Scholar] [CrossRef]
- De Angelis, E.; Ciribini, A.L.C.; Tagliabue, L.C.; Paneroni, M. The Brescia Smart Campus Demonstrator. Renovation towards a zero Energy Classroom Building. Procedia Eng. 2015, 28, 735–743. [Google Scholar] [CrossRef]
- Tagliabue, L.C.; Manfren, M.; Ciribini, A.L.C.; De Angelis, E. Probabilistic behavioural modelling in building performance simulation—the Brescia eLUX lab. Energy Build. 2016, 128, 119–131. [Google Scholar] [CrossRef]
- Re Cecconi, F.; Manfren, M.; Tagliabue, L.C.; Cirbini, A.L.C.; De Angelis, E. Probabilistic behavioural modeling in building performance simulation: A Monte Carlo approach. Energy Build. 2017, 148, 128–141. [Google Scholar] [CrossRef]
- Tagliabue, L.C.; Rinaldi, S.; Flammini, A.; Ciribini, A.L.C. Energy and comfort management of the educational spaces through IoT network for IAQ assessment in the eLUX lab. In Proceedings of the SBE19—Resilient Built Environment for Sustainable Mediterranean Countries, Milan, Italy, 3–6 September 2019. [Google Scholar] [CrossRef]
- eLUX Lab and SCUOLA Project, University of Brescia. Available online: https://elux.unibs.it/project-s-cu-o-l-a (accessed on 30 November 2020).
- University of Brescia, Italy. Available online: https://www.unibs.it (accessed on 30 November 2020).
- Flammini, A.; Pasetti, M.; Rinaldi, S.; Bellagente, P.; Ciribini, A.C.; Tagliabue, L.C.; Zavanella, S.; Zanoni, G.; Oggioni, G.; Pedrazzi, G. A living lab and testing infrastructure for the development of innovative smart energy solutions: The eLUX laboratory of the University of Brescia. In Proceedings of the 2018 AEIT International Annual Conference, Bari, Italy, 3–5 October 2018; pp. 1–6. [Google Scholar] [CrossRef]
- Rinaldi, S.; Flammini, A.; Tagliabue, L.C.; Ciribini, A.L.C. An IoT framework for the assessment of indoor conditions and estimation of occupancy rates: Results from a real case study. Acta IMEKO 2019, 8, 70–79. [Google Scholar] [CrossRef]
- LEED Reference Guide for Building Design and Construction, Updated 2 July 2018, Published 25 July 2019. Available online: https://www.usgbc.org/resources/leed-v4-building-design-and-construction-current-version (accessed on 30 November 2020).
- Azhar, S.; Carlton, W.A.; Olsen, D.; Ahmad, I. Building information modeling for sustainable design and LEED® rating analysis. Autom. Constr. 2011, 20, 217–224. [Google Scholar] [CrossRef]
- He, B.; Bai, K.J. Digital twin-based sustainable intelligent manufacturing: A review. Adv. Manuf. 2020, 1–21. [Google Scholar] [CrossRef]
- LEED Certification for Neighborhood Development. Available online: https://www.usgbc.org/leed/rating-systems/neighborhood-development (accessed on 30 November 2020).
- BuildingSMART International Limited, Industry Foundation Classes 4.1.0.0. Available online: https://standards.buildingsmart.org/IFC/RELEASE/IFC4_1/FINAL/HTML (accessed on 30 November 2020).
- Francisco, A.; Mohammadi, N.; Taylor, J.E. Smart City Digital Twin-Enabled Energy Management: Toward Real-Time Urban Building Energy Benchmarking. J. Manag. Eng. 2020, 36, 04019045. [Google Scholar] [CrossRef]
- Azeta, A.; Agono, F.; Falade, A.; Nwaocha, V. A Digital Twin Framework for Analysing Students’ Behaviours Using Educational Process Mining. J. Big Data 2020. in evaluation. [Google Scholar] [CrossRef]
- Sepasgozar, S.M. Digital Twin and Web-Based Virtual Gaming Technologies for Online Education: A Case of Construction Management and Engineering. Appl. Sci. 2020, 10, 4678. [Google Scholar] [CrossRef]
- Zaballos, A.; Briones, A.; Massa, A.; Centelles, P.; Caballero, V. A Smart Campus’ Digital Twin for Sustainable Comfort Monitoring. Sustainability 2020, 12, 9196. [Google Scholar] [CrossRef]
- Khajavi, S.H.; Motlagh, N.H.; Jaribion, A.; Werner, L.C.; Holmström, J. Digital twin: Vision, benefits, boundaries, and creation for buildings. IEEE Access 2019, 7, 147406–147419. [Google Scholar] [CrossRef]


Publisher’s Note: MDPI stays neutral with regard to jurisdictional claims in published maps and institutional affiliations. |
© 2021 by the authors. Licensee MDPI, Basel, Switzerland. This article is an open access article distributed under the terms and conditions of the Creative Commons Attribution (CC BY) license (http://creativecommons.org/licenses/by/4.0/).