
How Is Ultrasonic-Assisted CO2 EOR to Unlock Oils from Unconventional Reservoirs?


Abstract
:1. Introduction
2. Materials and Methods
2.1. Materials
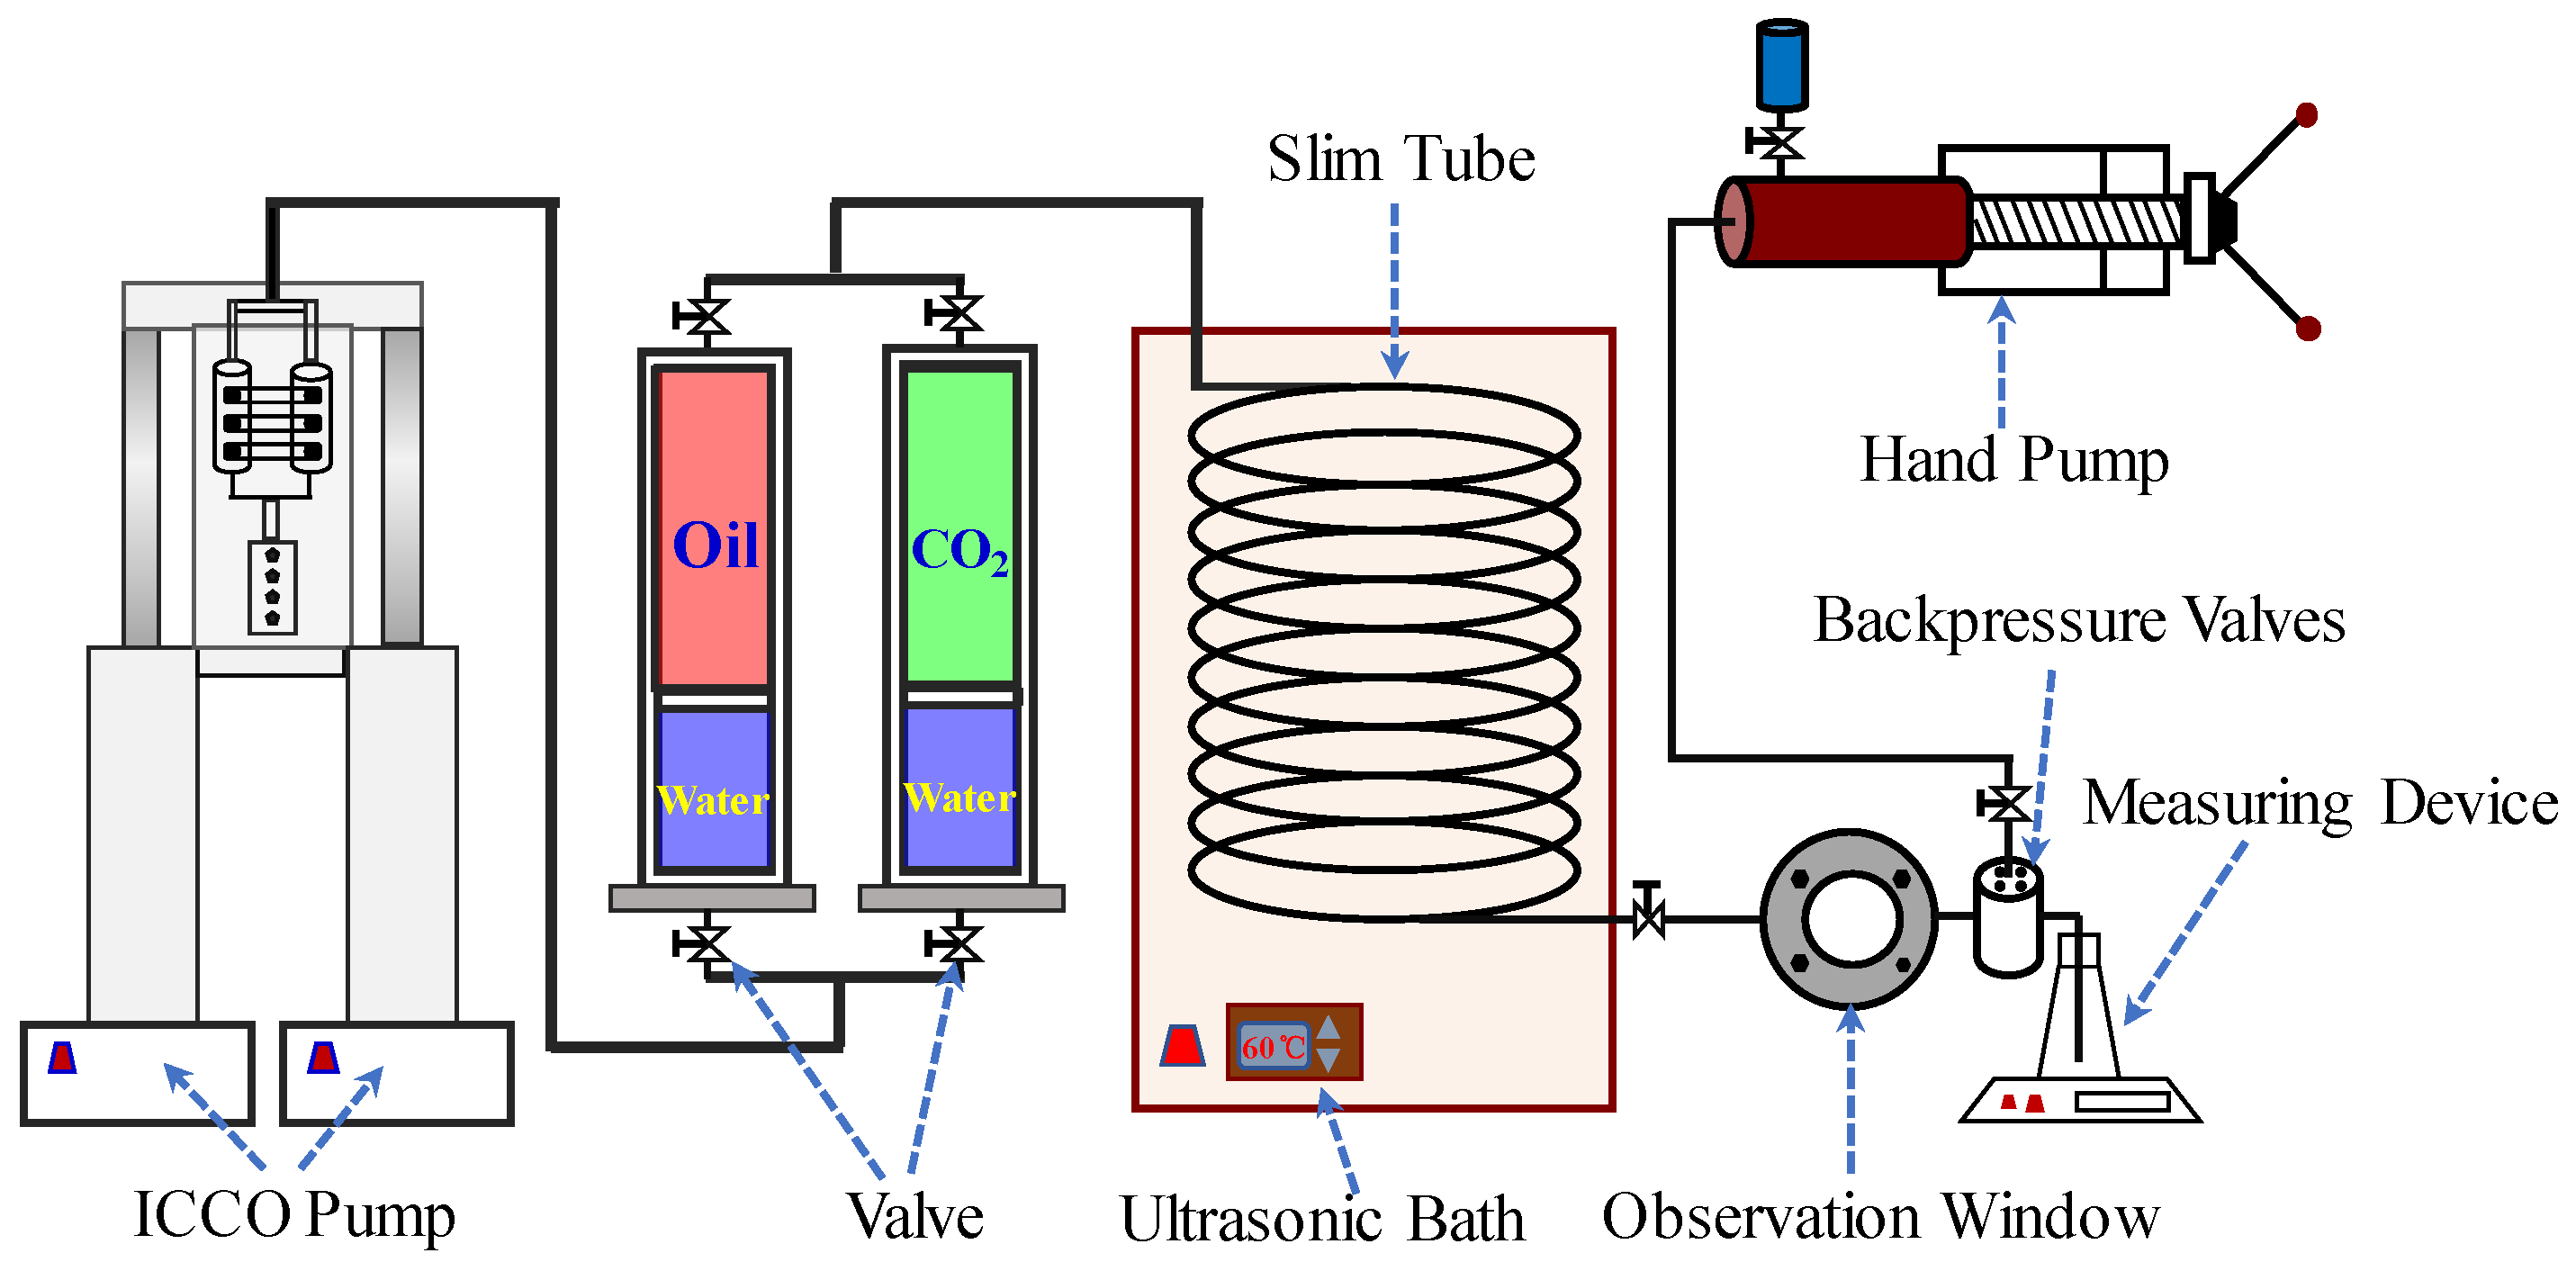
2.2. Equipment Setup
2.2.1. Subsubsection
2.2.2. Slim-Tube Test
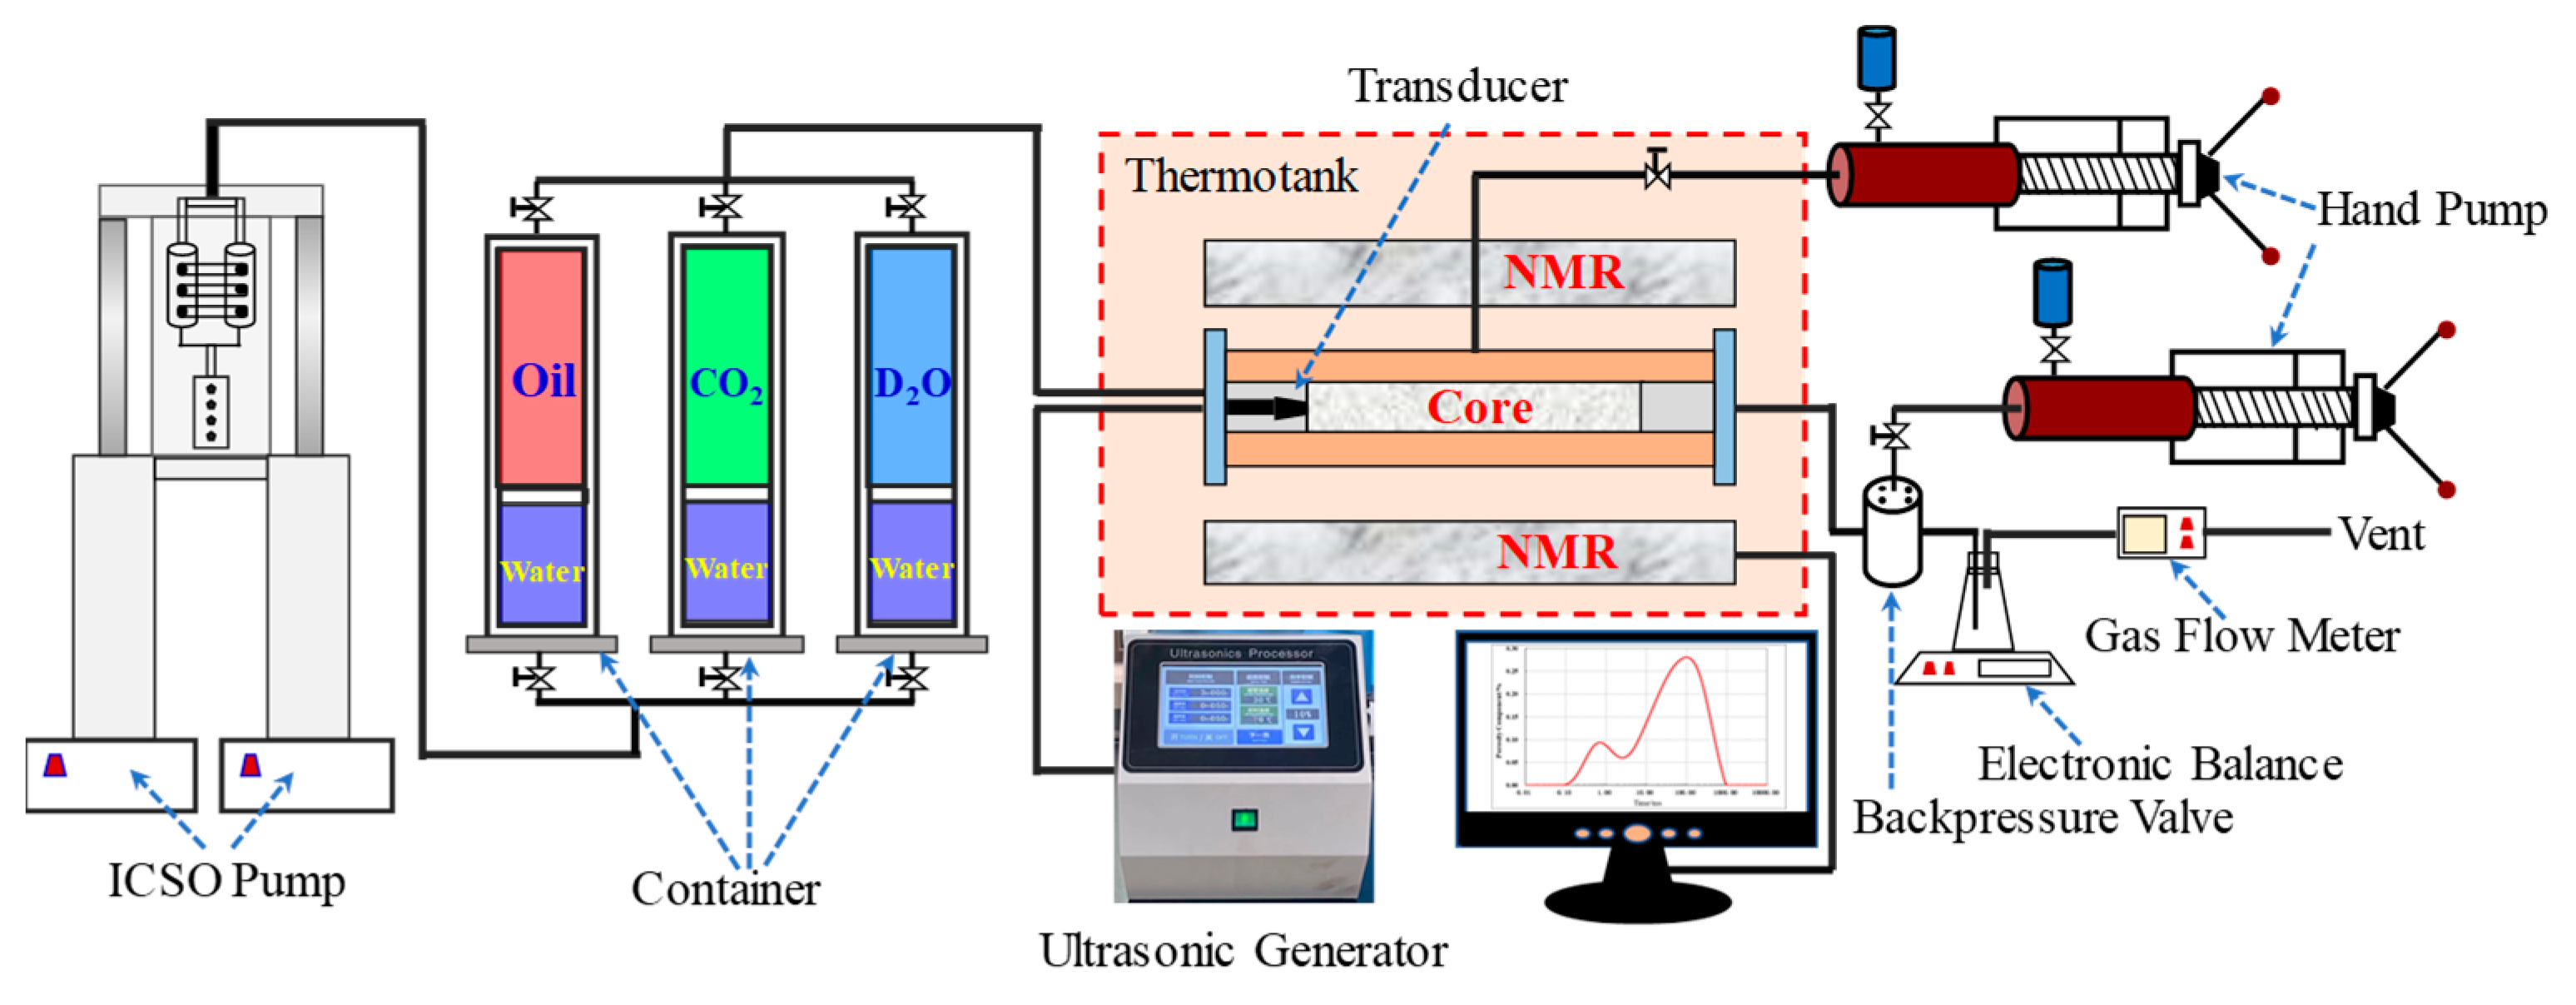
2.2.3. NMR and CO2 Flooding
2.3. Procedure
2.3.1. Physical Property Measurement
2.3.2. Slim-Tube Test
2.3.3. NMR and CO2 Flooding
- Step #1:
- After the gas permeability measurement of core samples was completed, the sample was vacuum pressurized (15 MPa) with saturated brine and placed in the core holder in Figure 2 for the NMR test.
- Step #2:
- The sample was dried and the brine made of deuterium oxide with purity of 99.99% was saturated by vacuum pressure (15 MPa). Then, the crude oil was saturated by the displacement method with the displacement pressure 16 MPa, the displacement pressure difference 1 MPa, and the confining pressure 18 Mpa. Stop injecting crude oil if the outlet does not produce water for an hour in a row, and the remaining water in the core is bound water that cannot flow. Then, the core sample was placed in the core gripper and aged with confining pressure for 120 h for NMR test.
- Step #3:
- The samples were replaced with CO2 at a displacement pressure of 15 MPa, displacement pressure difference of 1 MPa and confining pressure of 17 MPa. Record oil and gas production data, respectively. When the injection volume of CO2 reached 1.6 PV, the displacement experiment was stopped for the NMR test.
- Step #4:
- The residual oil in the pores was thoroughly washed by the solution prepared with alcohol and benzene at a volume ratio of 1:3, then dried at 105 °C for 12 h. Repeat step #2.
- Step #5:
- Open the ultrasonic generator, repeat step #3, measure ultrasonic-assisted CO2 displacement recovery.
3. Results and Discussion
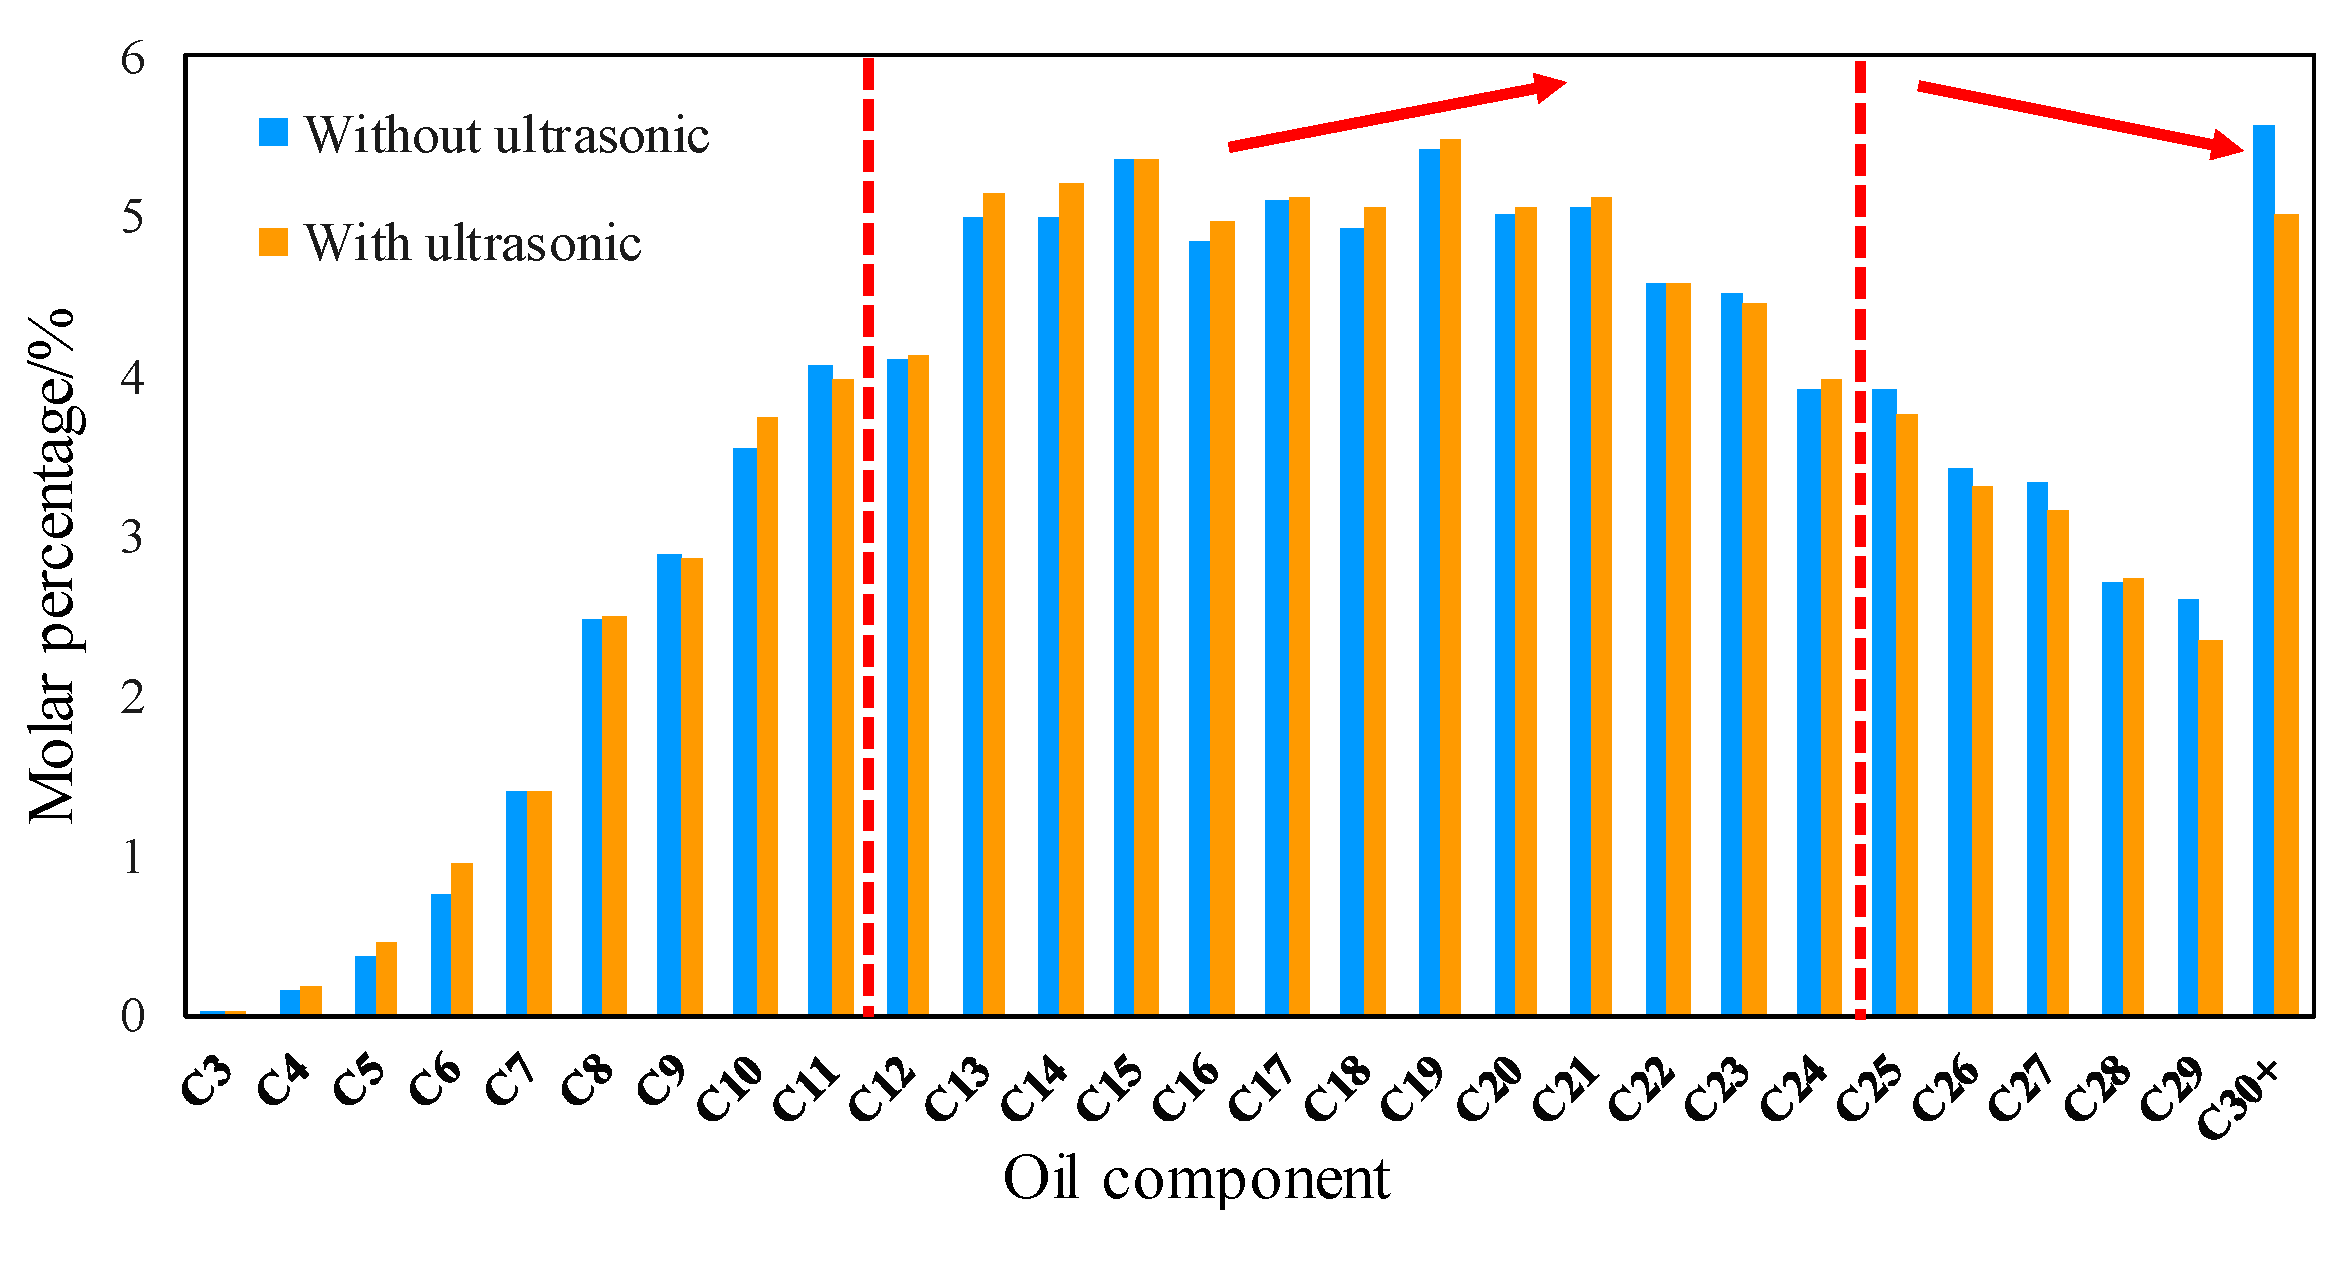
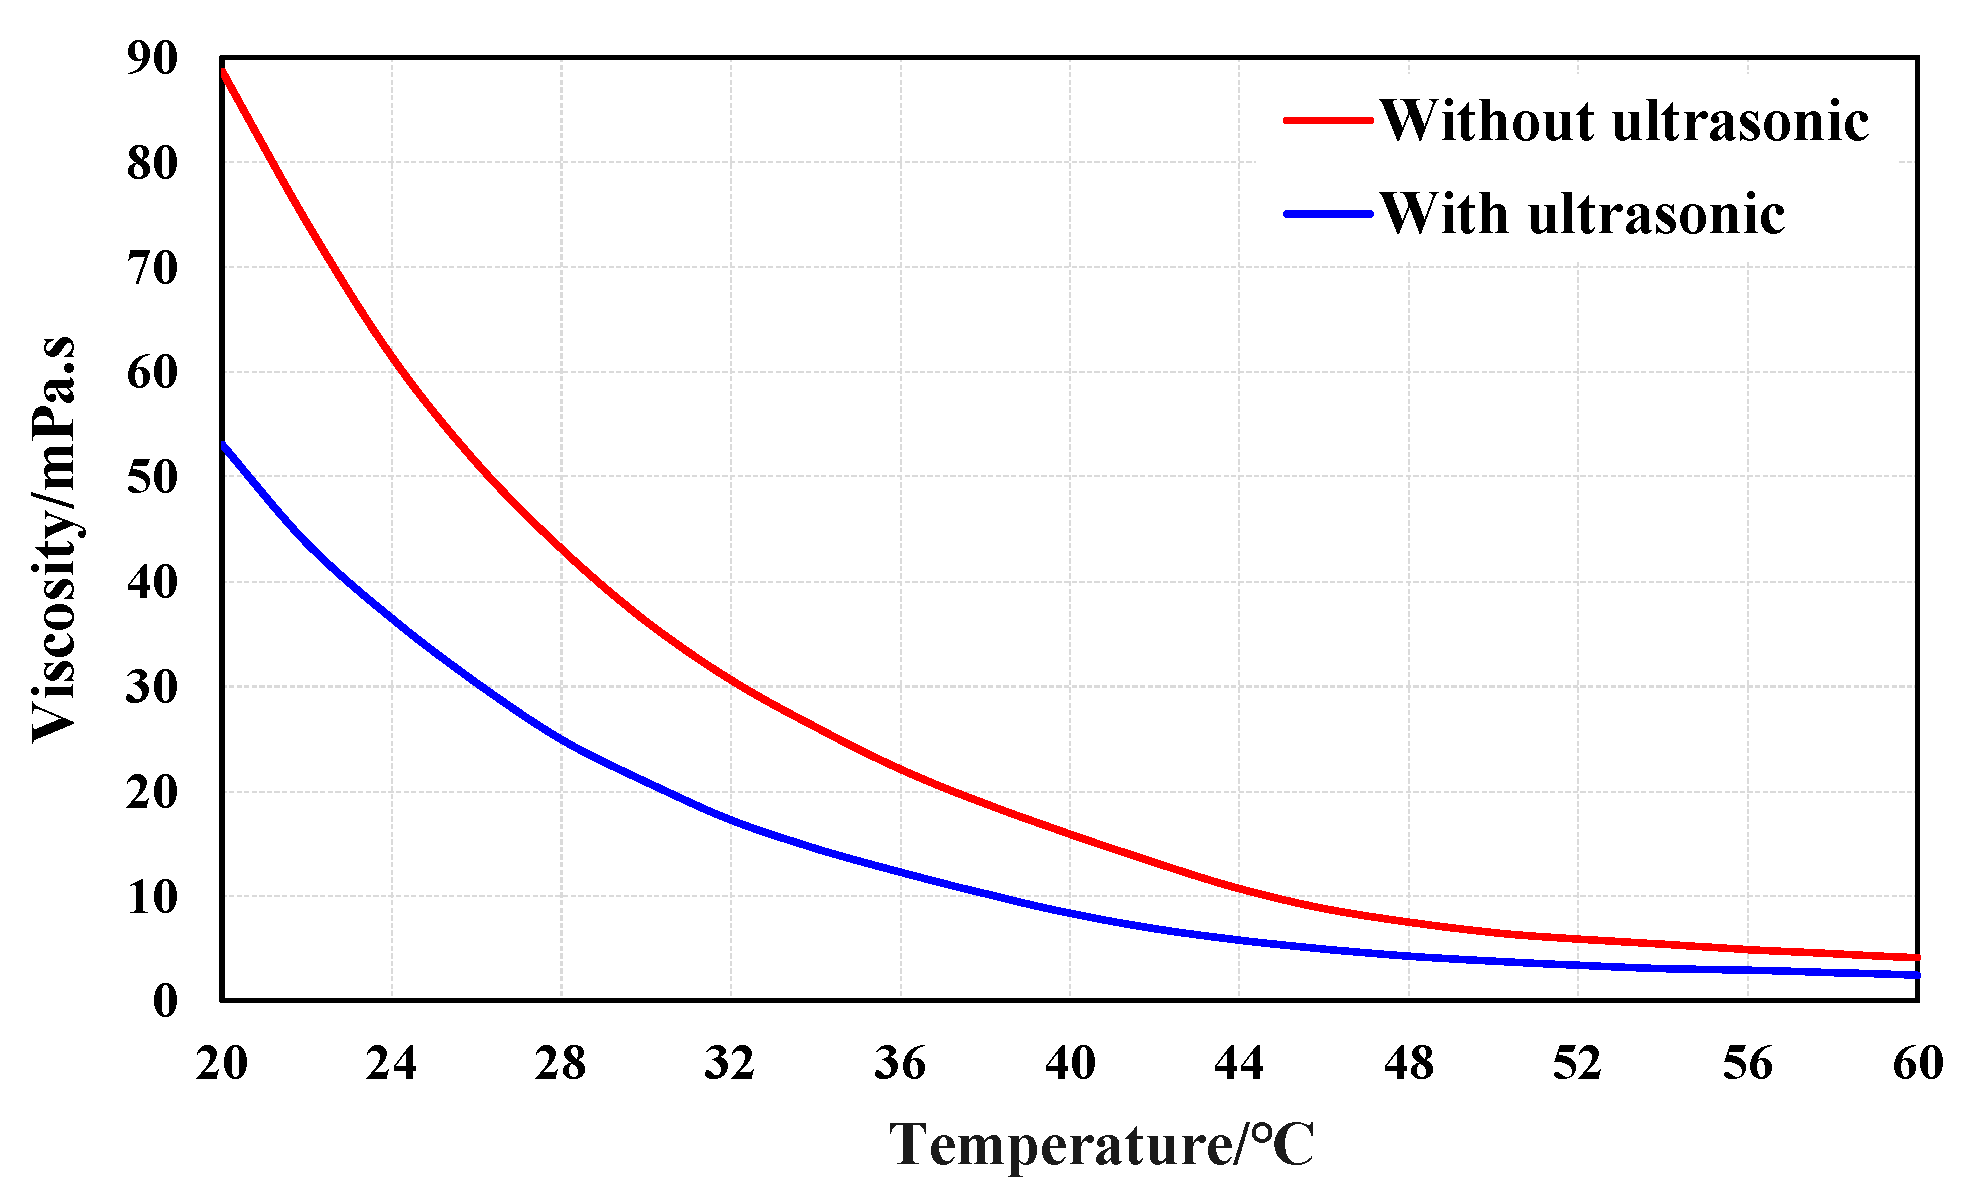
3.1. Oil Physical Properties
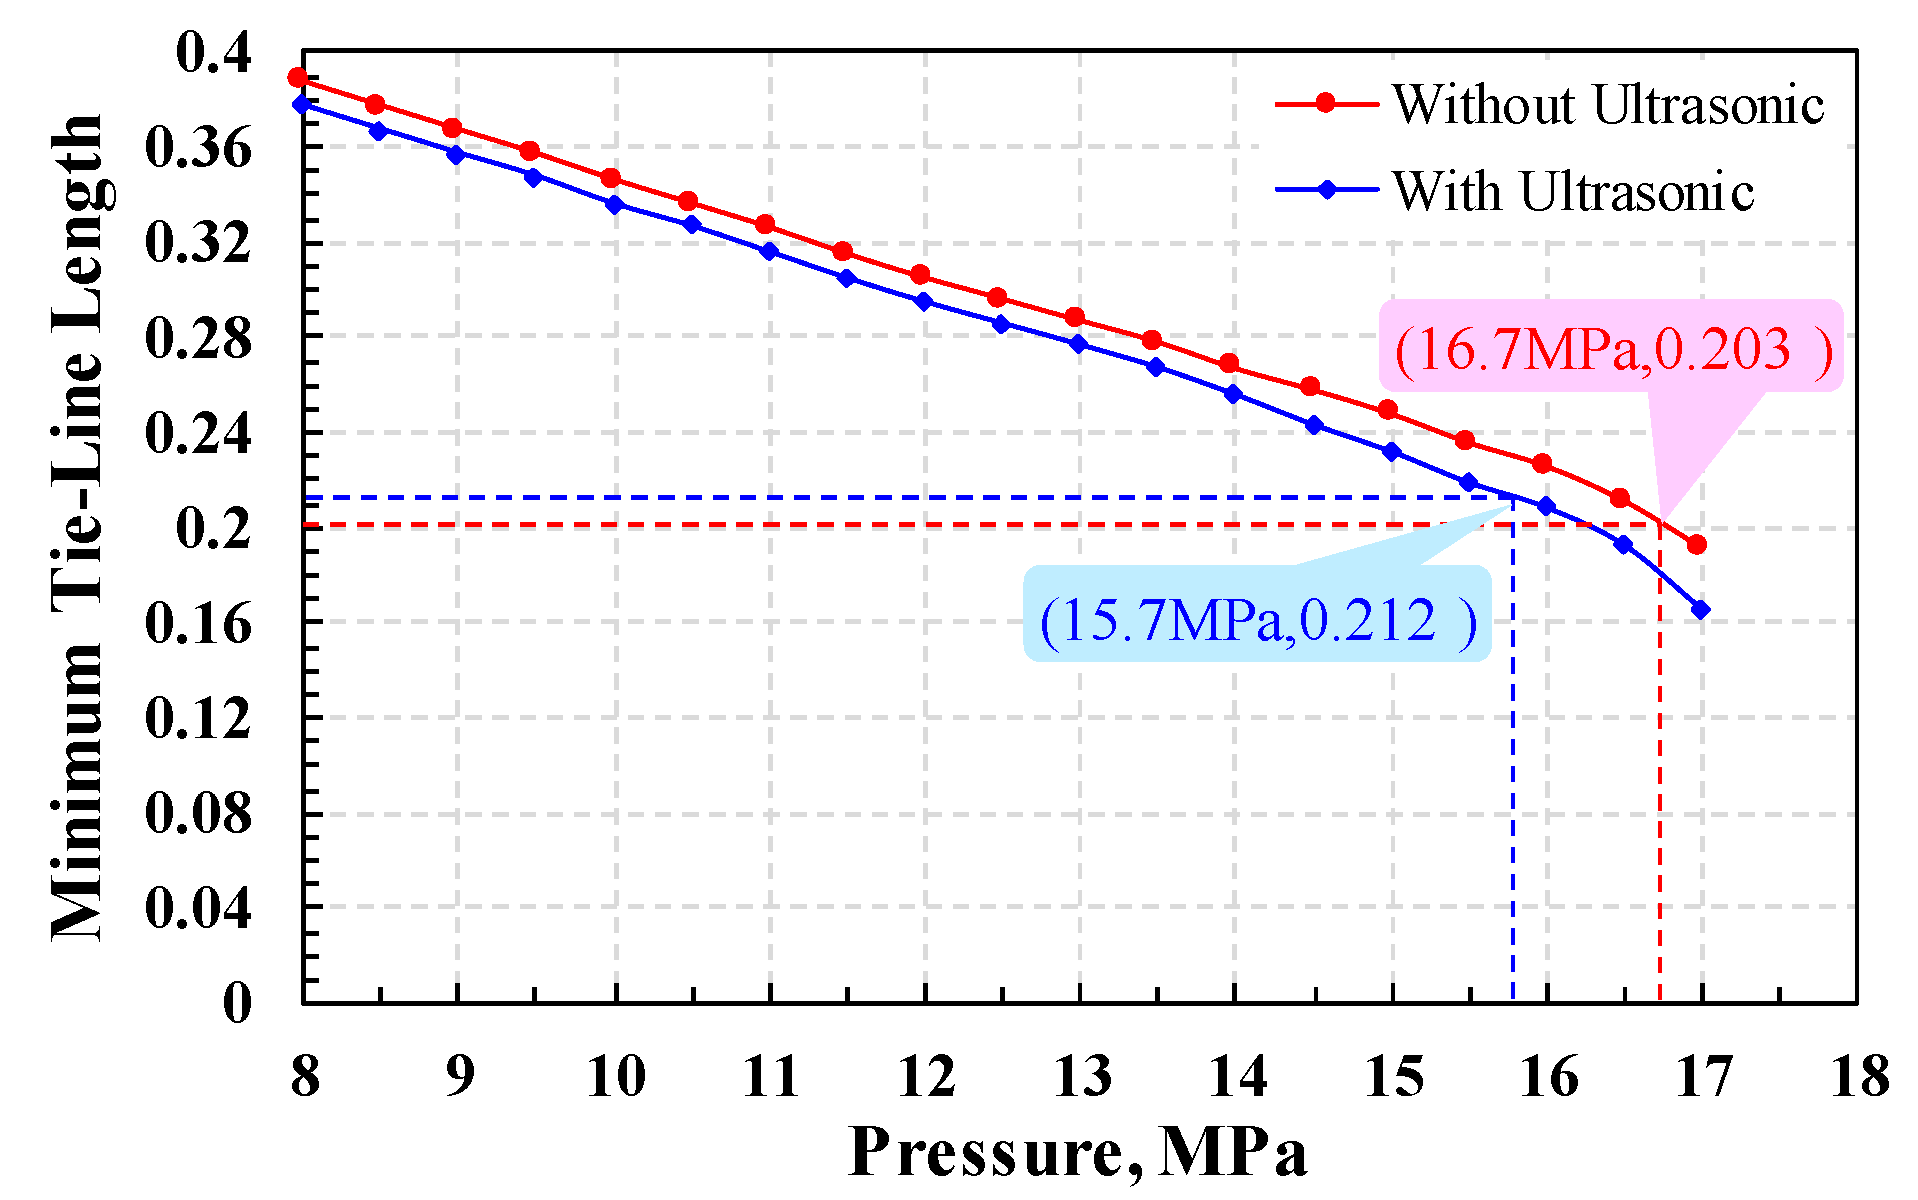
3.2. Miscibility Development
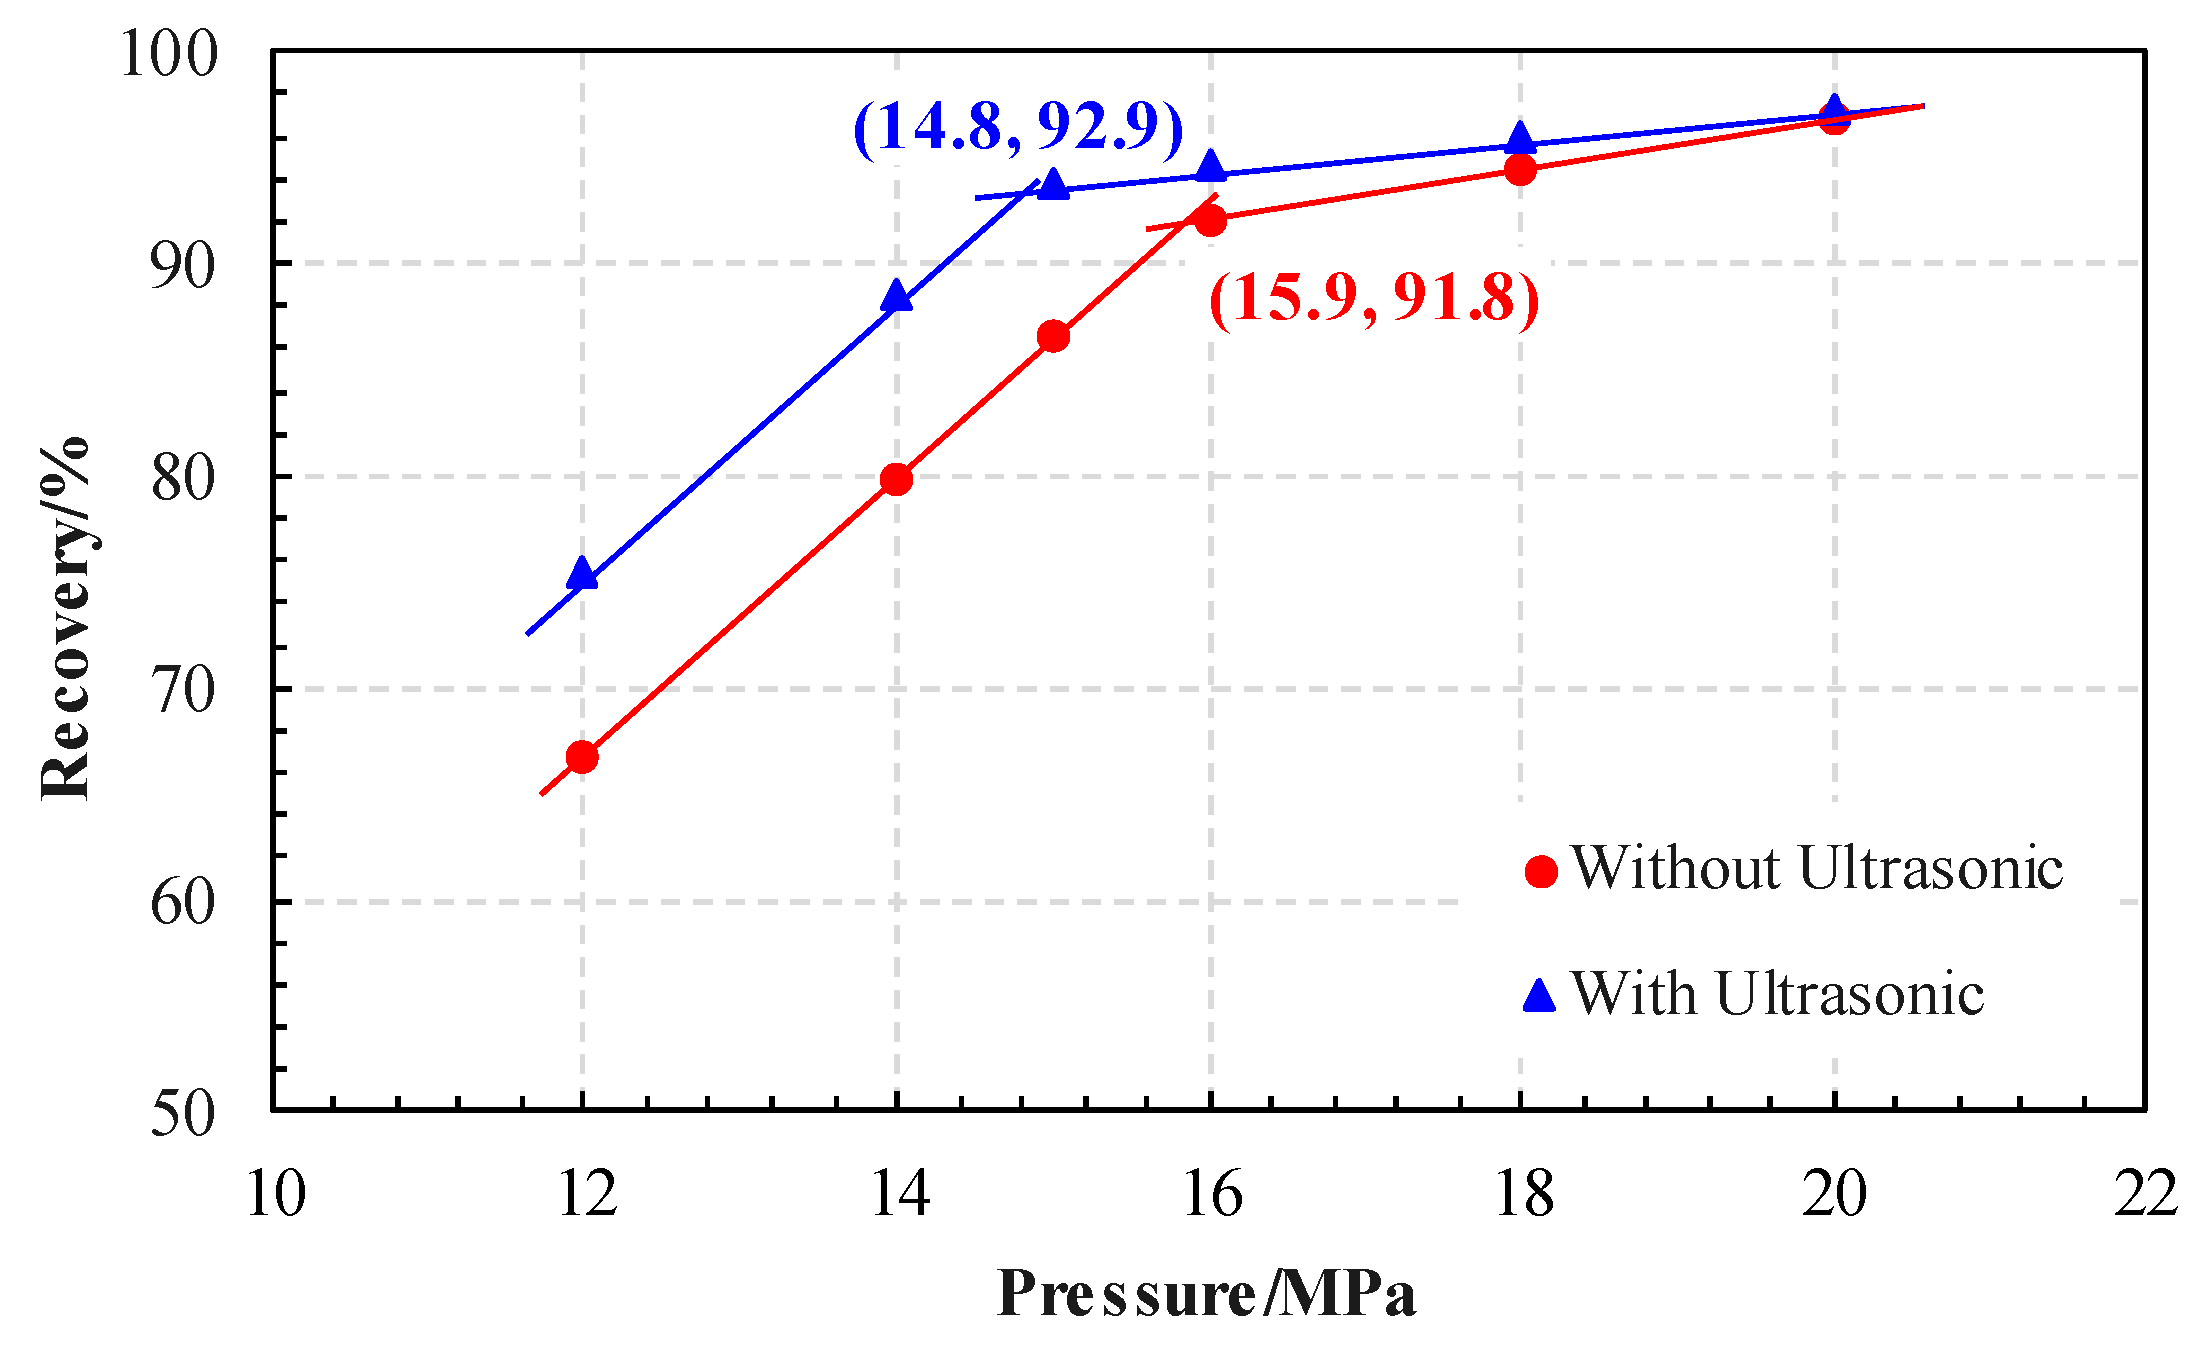
3.3. Oil Recovery
4. Conclusions
Author Contributions
Funding
Institutional Review Board Statement
Informed Consent Statement
Data Availability Statement
Acknowledgments
Conflicts of Interest
References
- Dara, S.; Lindstrom, M.; English, J.; Bonakdarpour, A.; Wetton, B.; Wilkinson, D.P. Conversion of saline water and dissolved carbon dioxide into value-added chemicals by electrodialysis. J. CO2 Util. 2017, 19, 177–184. [Google Scholar] [CrossRef]
- Abbasi, J.; Ghaedi, M.; Riazi, M. A new numerical approach for investigation of the efects of dynamic capillary pressure in imbibition process. J. Pet. Sci. Eng. 2018, 162, 44–54. [Google Scholar] [CrossRef]
- Huang, X.; Qi, Z.; Yan, W.; Yuan, Y.; Tian, J.; Qin, T. Functions of capillary pressure and dissolution in the CO2 flooding process in low permeability reservoirs. J. Pet. Explor. Prod. Technol. 2020, 10, 1881–1890. [Google Scholar] [CrossRef] [Green Version]
- Min, B.; Mamoudou, S.; Dang, S.; Tinni, A.; Sondergeld, C.; Rai, C. Comprehensive experimental study of huff-n-puff enhanced oil recovey in eagle ford: Key parameters and recovery mechanism. In Proceedings of the SPE Symposium on Improved Oil Recovery, v 2020-August, Society of Petroleum Engineers–SPE Improved Oil Recovery Conference 2020, IOR 2020, Tulsa, OK, USA, 31 August–4 September 2020; Society of Petroleum Engineers (SPE): Tulsa, OK, USA, 2020. ISBN 13 9781613997055. [Google Scholar]
- Su, X.; Yue, X. Mechanism study of the relation between the performance of CO2 immiscible flooding and rock permeability. J. Pet. Sci. Eng. 2020, 195, 107891. [Google Scholar] [CrossRef]
- Gao, C.; Zhao, M.; Wang, J.; Zong, C. Performance and gas breakthrough during CO2 immiscible flooding in ultra-low permeability reservoirs. Pet. Explor. Dev. 2014, 41, 88–95. [Google Scholar] [CrossRef]
- Hao, S.; Yang, Z.; Li, X.; Peng, Y.; Lin, M.; Zhang, J.; Dong, Z. CO2-responsive agent for restraining gas channeling during CO2 flooding in low permeability reservoirs. Fuel 2021, 292, 120306. [Google Scholar]
- Wang, Y.; Shang, Q.; Zhou, L.; Jiao, Z. Utilizing macroscopic areal permeability heterogeneity to enhance the effect of CO2 flooding in tight sandstone reservoirs in the Ordos Basin. J. Pet. Sci. Eng. 2021, 196, 107633. [Google Scholar] [CrossRef]
- Chen, X.; Li, Y.; Tang, X.; Qi, H.; Sun, X.; Luo, J. Effect of gravity segregation on CO2 flooding under various pressure conditions: Application to CO2 sequestration and oil production. Energy 2021, 226, 120294. [Google Scholar]
- Zhao, Y.; Fan, G.; Song, K.; Li, Y.; Chen, H.; Sun, H. The experimental research for reducing the minimum miscibility pressure of carbon dioxide miscible flooding. Renew. Sustain. Energy Rev. 2021, 145, 111091. [Google Scholar] [CrossRef]
- Zhang, K.; Jia, N.; Zeng, F.; Li, S.; Liu, L. A review of experimental methods for determining the oil-gas minimum miscibility pressures. J. Pet. Sci. Eng. 2019, 183, 106366. [Google Scholar] [CrossRef]
- Chen, H.; Zhang, C.; Jia, N.; Ian, D.; Yang, S.; Yang, Y. A machine learning model for predicting the minimum miscibility pressure of CO2 and crude oil system based on a support vector machine algorithm approach. Fuel 2021, 290, 120048. [Google Scholar] [CrossRef]
- Ge, D.; Cheng, H.; Cai, M.; Zhang, Y.; Dong, P. A new predictive method for CO2-Oil minimum miscibility pressure. Geofluids 2021, 2021, 8868529. [Google Scholar] [CrossRef]
- Zhang, K.; Meng, Z.; Liu, L. Factorial two-stage analyses of parameters affecting the oil-gas interface and miscibility in bulk phase and nanopores. J. Colloid Interface Sci. 2019, 555, 740–750. [Google Scholar] [CrossRef] [PubMed]
- Zhang, K.; Jia, N.; Li, S.; Liu, L. Thermodynamic phase behaviour and miscibility of confined fluids in nanopores. Chem. Eng. J. 2018, 351, 1115–1128. [Google Scholar] [CrossRef]
- Gunde, A.C.; Bera, B.; Mitra, S.K. Investigation of water and CO2 (carbon dioxide) flooding using micro-CT (micro-computed tomography) images of Berea sandstone core using finite element simulations. Energy 2010, 35, 5209–5216. [Google Scholar] [CrossRef]
- Song, Z.; Li, Z.; Yu, C. D-optimal design for rapid assessment model of CO2 flooding in high water cut oil reservoirs. J. Nat. Gas Sci. Eng. 2014, 21, 764–771. [Google Scholar] [CrossRef]
- Choubineh, A.; Helalizadeh, A.; Wood, D.A. The impacts of gas impurities on the minimum miscibility pressure of injected CO2-rich gas-crude oil systems and enhanced oil recovery potential. Pet. Sci. 2019, 16, 117–126. [Google Scholar] [CrossRef] [Green Version]
- Ghorbani, M.; Momeni, A.; Safavi, S.; Gandomkar, A. Modified vanishing interfacial tension(VIT) test for CO2-oil minimum miscibility pressure(MMP) measurement. J. Nat. Gas Sci. Eng. 2014, 20, 92–98. [Google Scholar] [CrossRef]
- Zhang, C.; Xi, L.; Wu, P.; Li, Z. A novel system for reducing CO2-crude oil minimum miscibility pressure with CO2-soluble surfactants. Fuel 2020, 281, 118690. [Google Scholar] [CrossRef]
- Yang, Z.; Wu, W.; Dong, Z.; Lin, M.; Zhang, S.; Zhang, J. Reducing the minimum miscibility pressure of CO2 and crude oil using alcohols. Colloids Surf. A—Physicochem. Eng. Asp. 2019, 568, 105–112. [Google Scholar] [CrossRef]
- Liu, J.; Sun, L.; Li, Z.; Wu, X. Experimental study on reducing CO2–Oil minimum miscibility pressure with hydrocarbon agents. Energies 2019, 12, 1975. [Google Scholar] [CrossRef] [Green Version]
- Zhao, Y.; Song, K.; Fan, G.; Pi, Y.; Liu, L. The experiment for reducing the minimum miscible pressure of crude oil and carbon dioxide system with eater compounds. Acta Pet. Sin. 2017, 38, 1066–1072. [Google Scholar]
- Wang, X.; Gu, Y. Oil recovery and permeability reduction of a tight sandstone reservoir in immiscible and miscible CO2 flooding processes. Ind. Eng. Chem. Res. 2011, 50, 2388–2399. [Google Scholar] [CrossRef]
- Cao, M.; Gu, Y. Physicochemical characterization of produced oils and gases in immiscible and miscible CO2 flooding processes. Energy Fuels 2013, 27, 440–453. [Google Scholar] [CrossRef]
- Cao, M.; Gu, Y. Oil recovery mechanisms and asphaltene precipitation phenomenon in immiscible and miscible CO2 flooding processes. Fuel 2013, 109, 157–166. [Google Scholar] [CrossRef]
- Mohamed, A.; Wu, Z.; Matthew, B.M.; Colin, D.W.; Nasser, S.A.; Liu, Y.; Renke, R.; Ali, S.; Xie, Q. Chemical-assisted minimum miscibility pressure reduction between oil and methane. J. Pet. Sci. Eng. 2021, 196, 108094. [Google Scholar]
- Zhao, Y.; Fan, G.; Li, Y.; Zhang, X.; Chen, H.; Sun, H. Research for reducing minimum miscible pressure of crude oil and carbon dioxide and miscible flooding experiment by injecting citric acid isopentyl ester. Arab. J. Chem. 2020, 13, 9207–9215. [Google Scholar] [CrossRef]
- Luo, H.; Zhang, Y.; Fan, W.; Nan, G.; Li, Z. Effects of the non-ionic surfactant (CiPOj) on the interfacial tension behavior between CO2 and crude oil. Energy Fuels 2018, 32, 6708–6712. [Google Scholar] [CrossRef]
- Bjorndalen, N.; Islam, M.R. The effect of microwave and ultrasonic irradiation on crude oil during production with horizontal well. J. Pet. Sci. Eng. 2004, 43, 139–150. [Google Scholar] [CrossRef]
- Mohsin, M.; Meribout, M. Oil–water de-emulsification using ultrasonic technology. Ultrason. Sonochem. 2015, 22, 573579. [Google Scholar] [CrossRef]
- Abramov, V.O.; Abramova, A.V.; Bayazitov, V.M.; Altunina, L.K.; Gerasin, A.S.; Pashin, D.M.; Mason, T.J. Sonochemical approaches to enhanced oil recovery. Ultrason. Sonochem. 2015, 25, 76–81. [Google Scholar] [CrossRef]
- Abramov, V.O.; Mullakaev, M.S.; Abramova, A.V.; Esipov, I.B.; Mason, T.J. Ultrasonic technology for enhanced oil recovery from failing oil wells and the equipment for its implemention. Ultrason. Sonochem. 2013, 20, 1289–1295. [Google Scholar] [CrossRef]
- Hamidi, H.; Mohammadian, E.; Asadullah, M.; Azdarpour, A.; Rafati, R. Effect of ultrasound radiation duration on emulsification and demulsification of paraffin oil and surfactant solution/brine using hele-shaw models. Ultrason. Sonochem. 2015, 6, 428–436. [Google Scholar] [CrossRef]
- Hamidi, H.; Rafati, R.; Junin, R.; Manan, M.; Busra, N. A technique for evaluating the oil/heavy-oil viscosity changes under ultrasound in a simulated porous medium. Ultrasonics 2013, 54, 655–662. [Google Scholar] [CrossRef] [PubMed]
- Mohammadian, E.; Junin, R.; Rahmani, O. Effects of sonication radiation on oil recovery by ultrasonic waves stimulated water-flooding. Ultrasonics 2013, 53, 607–614. [Google Scholar] [CrossRef] [PubMed]
- Hossein, H.; Amin, S.H.; Erfan, M.; Roozbeh, R.; Amin, A.; Panteha, G.; Peter, O.; Tobias, N.; Aaron, Z. Ultrasound-assisted CO2 flooding to improve oil recovery. Ultrason. Sonochem. 2017, 35, 243–250. [Google Scholar]
- Czarnota, R.; Janiga, D.; Stopa, J.; Wojnarowski, P.; Kosowski, P. Minimum miscibility pressure measurement for CO2 and oil using rapid pressure increase method. J. CO2 Util. 2017, 21, 156–161. [Google Scholar] [CrossRef]
- Czarnota, R.; Janiga, D.; Stopa, J.; Wojnarowski, P. Determination of minimum miscibility pressure for CO2 and oil system using acoustically monitored separator. J. CO2 Util. 2017, 17, 32–36. [Google Scholar] [CrossRef]
- Ren, B.; Duncan, I.J. Maximizing oil production from water alternating gas (CO2) injection into residual oil zones: The impact of oil saturation and heterogeneity. Energy 2021, 222, 119915. [Google Scholar] [CrossRef]
- Gopinath, R.; Dalai, A.K.; Adjaye, J. Effects of ultrasound treatment on the upgradation of heavy oil. Energy Fuels 2006, 20, 271–277. [Google Scholar] [CrossRef]
- Liu, J.; Yang, F.K.; Xia, J.Y.; Wu, F.P.; Pu, C.S. Mechanism of ultrasonic physical-chemical viscosity reduction for different heavy oils. ACS Omega 2021, 6, 2276–2283. [Google Scholar] [CrossRef]
- Chen, B.; Han, X.X.; Jiang, X.M. In situ FTIR analysis of the evolution of functional groups of oil shale during pyrolysis. Energy Fuels 2016, 30, 5611–5616. [Google Scholar] [CrossRef]
- Shaw, A.; Zhang, X.L. Density functional study on the thermal stabilities of phenolic bio-oil compounds. Fuel 2019, 225, 115732. [Google Scholar] [CrossRef]
- Wartini, N.; Brendan, P.M.; Budiman, M. Rapid assessment of petroleum-contaminated soils with infrared spectroscopy. Geoderma 2017, 289, 150–160. [Google Scholar]
- Zhang, W.; Ning, Z.; Cheng, Z.; Wang, Q.; Wu, X.; Huang, L. Experimental investigation of the role of DC voltage in the wettability alteration in tight sandstones. Langmuir 2020, 36, 11985–11995. [Google Scholar] [CrossRef]
- Lee, Y.; Chung, H.; Kim, N. Spectral range optimization for the near-infrared quantitative analysis of petrochemical and Petroleum products: Naphtha and gasoline. Appl. Spectrosc. 2006, 60, 892–897. [Google Scholar] [CrossRef]
- Galán-Freyle, N.J.; Ospina-Castro, M.L.; Medina-González, A.R.; Villarreal-González, R.; Hernández-Rivera, S.P.; Pacheco-Londoño, L.C. Artificial intelligence assisted mid-infrared laser spectroscopy in situ detection of petroleum in soils. Appl. Sci. 2020, 10, 1319. [Google Scholar] [CrossRef] [Green Version]
- Cao, M.; Gu, Y. Temperature effects on the phase behaviour, mutual interactionsand oil recovery of a light crude oil–CO2 system. Fluid Phase Equilibria 2013, 356, 78–89. [Google Scholar] [CrossRef]
- Liao, C.; Liao, X.; Chen, J.; Ye, H.; Chen, X.; Wang, H. Correlations of minimum miscibility pressure for pure and impure CO2 in low permeability oil reservoir. J. Energy Inst. 2014, 87, 208–214. [Google Scholar] [CrossRef]
- Lai, F.; Li, Z.; Hu, X. Improved minimum miscibility pressure correlation for CO2 flooding using various oil components and their effects. J. Geophys. Eng. 2017, 14, 331–340. [Google Scholar] [CrossRef] [Green Version]
- Zhang, K.; Jia, N.; Liu, L. CO2 storage in fractured nanopores underground: Phase behaviour study. Appl. Energy 2019, 238, 911–928. [Google Scholar] [CrossRef]
- Holm, L.W.; Josendal, V.A. Effect of oil composition on miscible-type displacement by carbon dioxide. Soc. Pet. Eng. J. 1982, 22, 87–98. [Google Scholar] [CrossRef]
- Chen, H.; Li, B.; Ian, D.; Moayad, E.; Liu, X. Empirical correlations for prediction of minimum miscible pressure and near-miscible pressure interval for oil and CO2 systems. Fuel 2020, 278, 118272. [Google Scholar] [CrossRef]
- Chen, G.; Fu, K.; Liang, Z.; Teerawat, S.; Li, C.; Paitoon, T.; Raphael, I. The genetic algorithm based back propagation neural network for MMP prediction in CO2-EOR process. Fuel 2014, 126, 202–212. [Google Scholar] [CrossRef]
- Chen, G.; Gao, H.; Fu, K.; Zhang, H.; Liang, Z.; Paitoon, T. An improved correlation to determine minimum miscibility pressure of CO2–Oil system. Green Energy Environ. 2018, 5, 97–104. [Google Scholar] [CrossRef]
- Zhang, K.; Gu, Y. Two different technical criteria for determining the minimum miscibility pressures (MMPs) from the slim-tube and coreflood tests. Fuel 2015, 161, 146–156. [Google Scholar] [CrossRef]
- Zhang, K.; Gu, Y. New qualitative and quantitative technical criteria for determining the minimum miscibility pressures (MMPs) with the rising-bubble apparatus (RBA). Fuel 2016, 175, 172–181. [Google Scholar] [CrossRef]
- Dang, S.; Sondergeld, C.; Rai, C. Interpretation of Nuclear-Magnetic-Resonance Response to Hydrocarbons: Application to Miscible Enhanced-Oil-Recovery Experiments in Shales. SPE Reserv. Eval. Eng. 2019, 22, 302–309. [Google Scholar] [CrossRef]


| Saturated Hydrocarbon/% | Aromatic Hydrocarbon/% | Resin/% | Asphaltene/% | |
|---|---|---|---|---|
| Without ultrasonic | 52.38 | 13.65 | 27.94 | 6.03 |
| With ultrasonic | 62.15 | 19.87 | 14.20 | 3.79 |
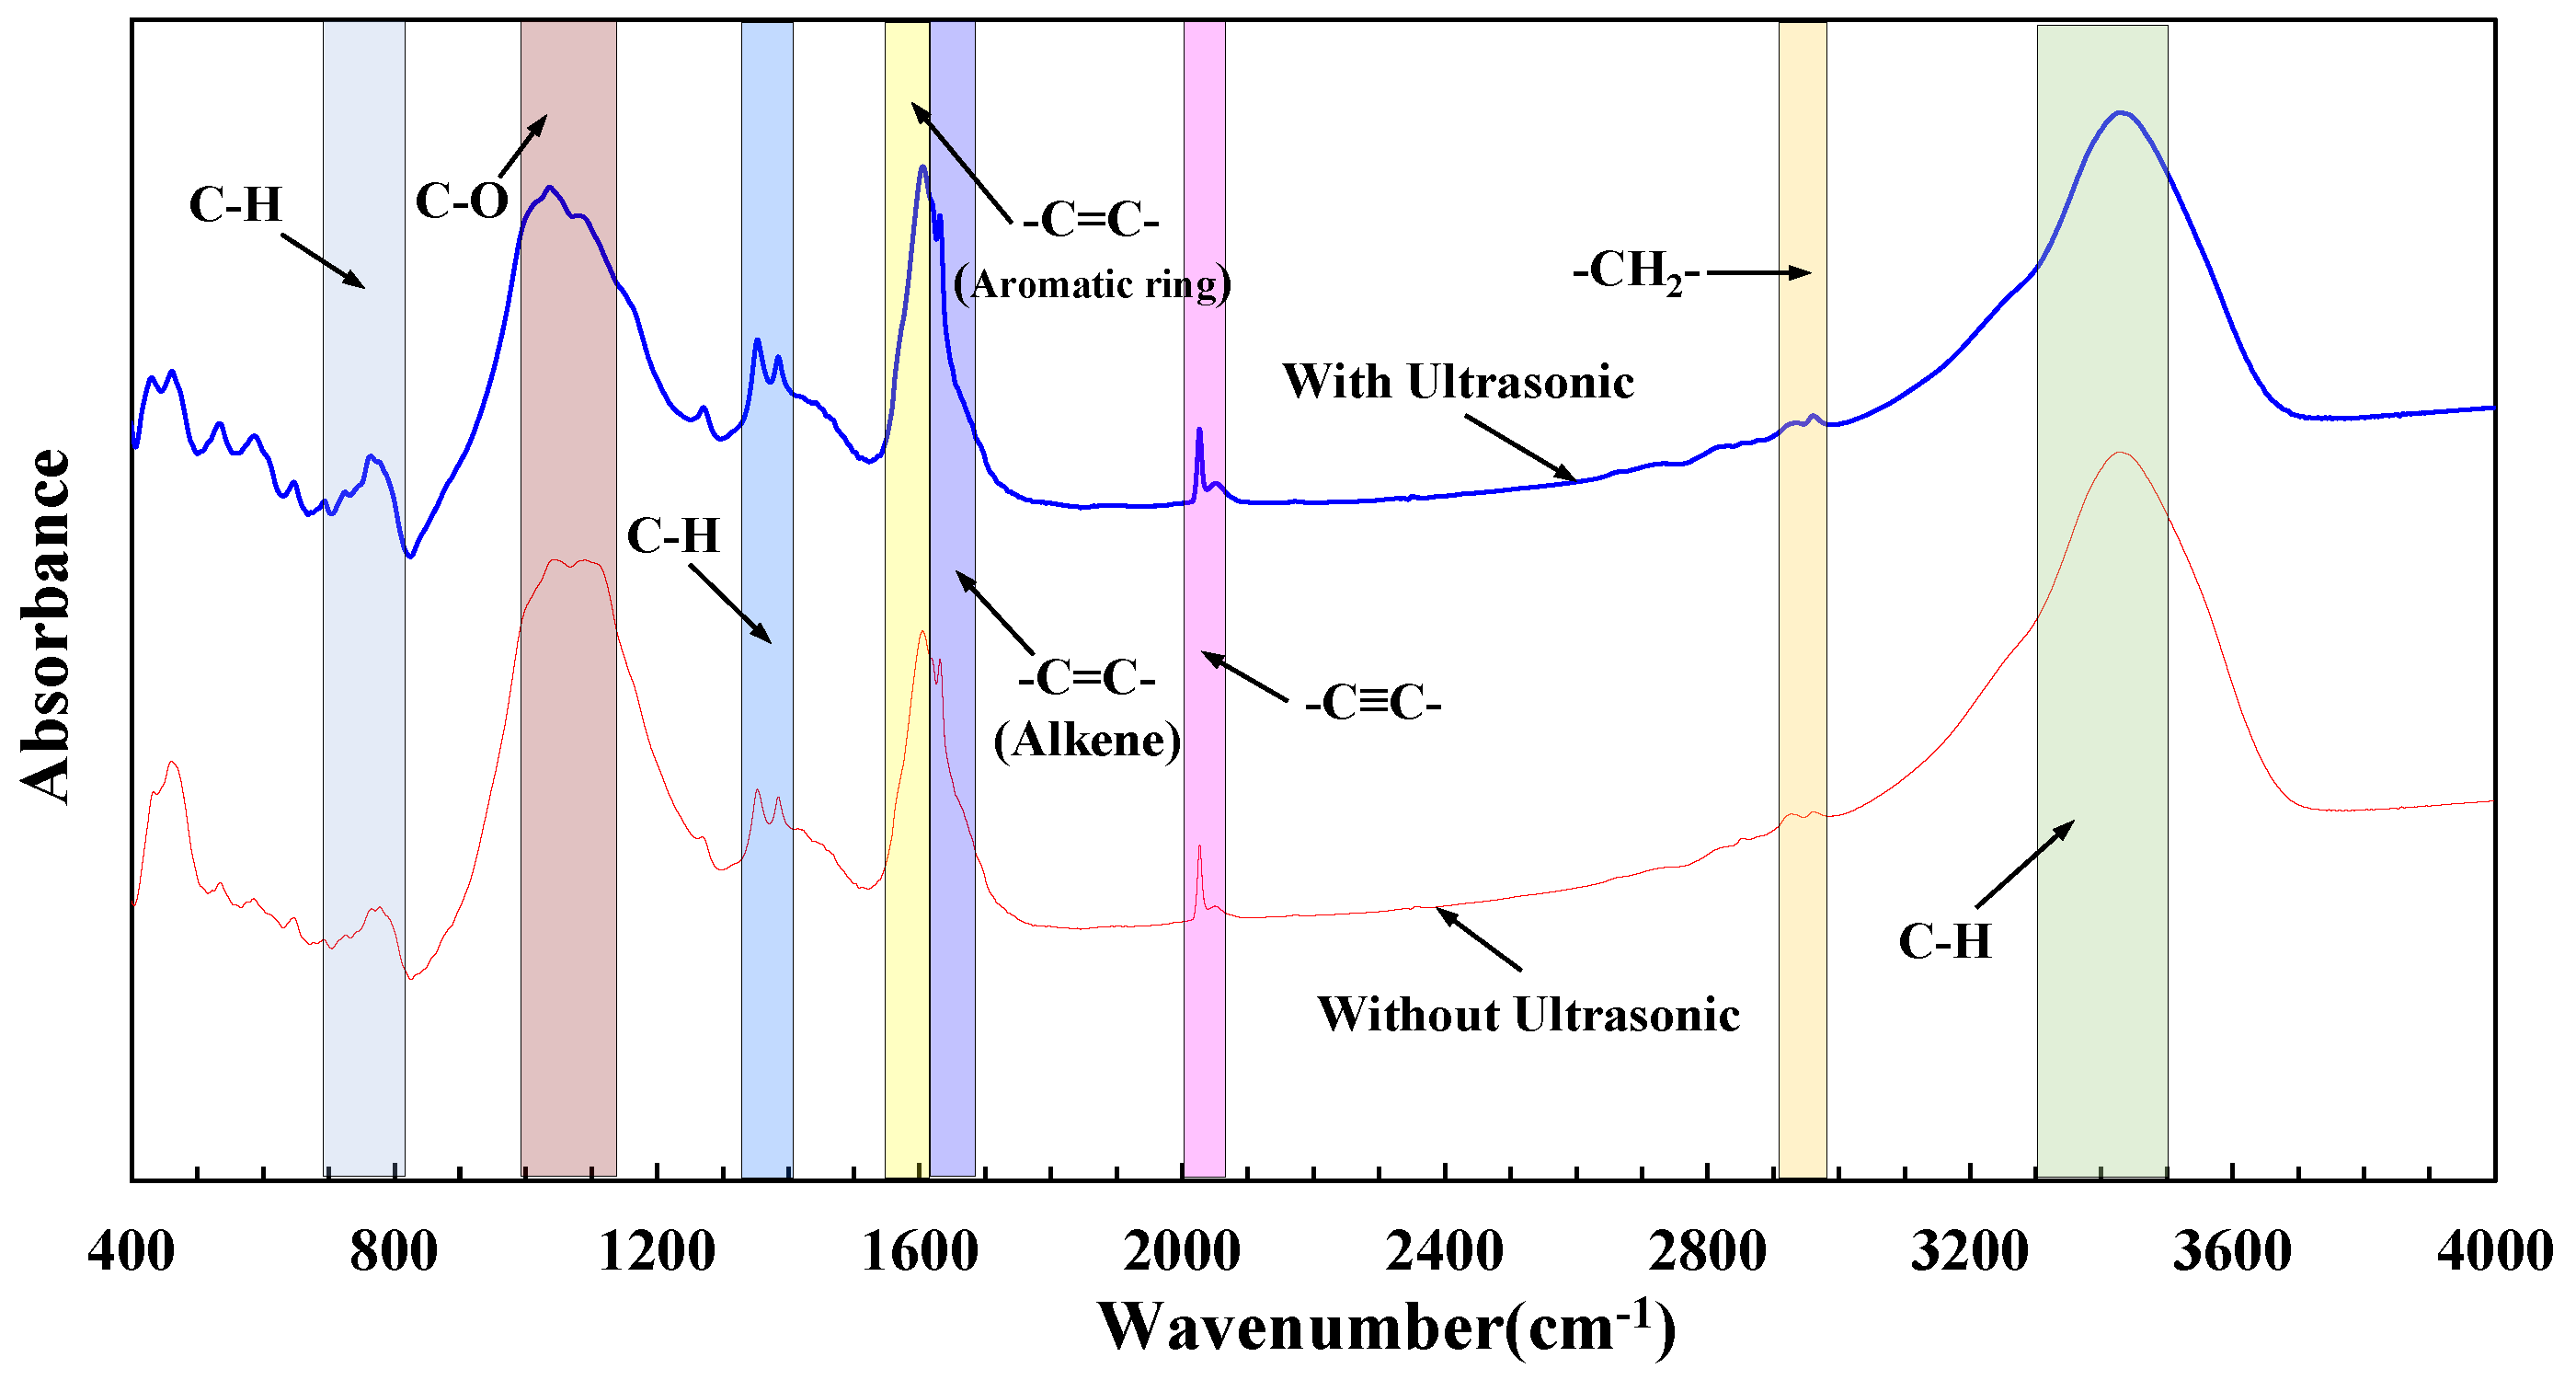
| Functional Groups | C-H (Out-Plane Bending Vibration) | C-O | C-H (In-Plane Bending Vibration) | C=C (Aromatic Ring) | C=C (Alkene) | C≡C | -CH2 | C-H (Stretching Vibration) |
|---|---|---|---|---|---|---|---|---|
| Range/cm−1 | 700–820 | 1000–1100 | 1340–1410 | 1560–1620 | 1620–1680 | 2010–2070 | 2920–2980 | 3300–3500 |
| Area (Without ultrasonic) | 23.27 | 78.56 | 20.58 | 8.78 | 15.11 | 4.38 | 1.82 | 96.3 |
| Area (With ultrasonic) | 26.74 | 70.21 | 21.35 | 9.46 | 16.07 | 4.07 | 1.81 | 88.7 |
| T/°C | C7–15/% | C16–26/% | C27+/% | Vmin | |
|---|---|---|---|---|---|
| Without ultrasonic | 60 | 33.82 | 50.67 | 15.51 | 0.203 |
| With ultrasonic | 60 | 34.32 | 54.44 | 11.24 | 0.212 |
Publisher’s Note: MDPI stays neutral with regard to jurisdictional claims in published maps and institutional affiliations. |
© 2021 by the authors. Licensee MDPI, Basel, Switzerland. This article is an open access article distributed under the terms and conditions of the Creative Commons Attribution (CC BY) license (https://creativecommons.org/licenses/by/4.0/).
Share and Cite
Wang, H.; Tian, L.; Zhang, K.; Liu, Z.; Huang, C.; Jiang, L.; Chai, X. How Is Ultrasonic-Assisted CO2 EOR to Unlock Oils from Unconventional Reservoirs? Sustainability 2021, 13, 10010. https://doi.org/10.3390/su131810010
Wang H, Tian L, Zhang K, Liu Z, Huang C, Jiang L, Chai X. How Is Ultrasonic-Assisted CO2 EOR to Unlock Oils from Unconventional Reservoirs? Sustainability. 2021; 13(18):10010. https://doi.org/10.3390/su131810010
Chicago/Turabian StyleWang, Hengli, Leng Tian, Kaiqiang Zhang, Zongke Liu, Can Huang, Lili Jiang, and Xiaolong Chai. 2021. "How Is Ultrasonic-Assisted CO2 EOR to Unlock Oils from Unconventional Reservoirs?" Sustainability 13, no. 18: 10010. https://doi.org/10.3390/su131810010
APA StyleWang, H., Tian, L., Zhang, K., Liu, Z., Huang, C., Jiang, L., & Chai, X. (2021). How Is Ultrasonic-Assisted CO2 EOR to Unlock Oils from Unconventional Reservoirs? Sustainability, 13(18), 10010. https://doi.org/10.3390/su131810010