
Determination of Dehumidification Capacity of Water Wall with Controlled Water Temperature: Experimental Verification under Laboratory Conditions


Abstract
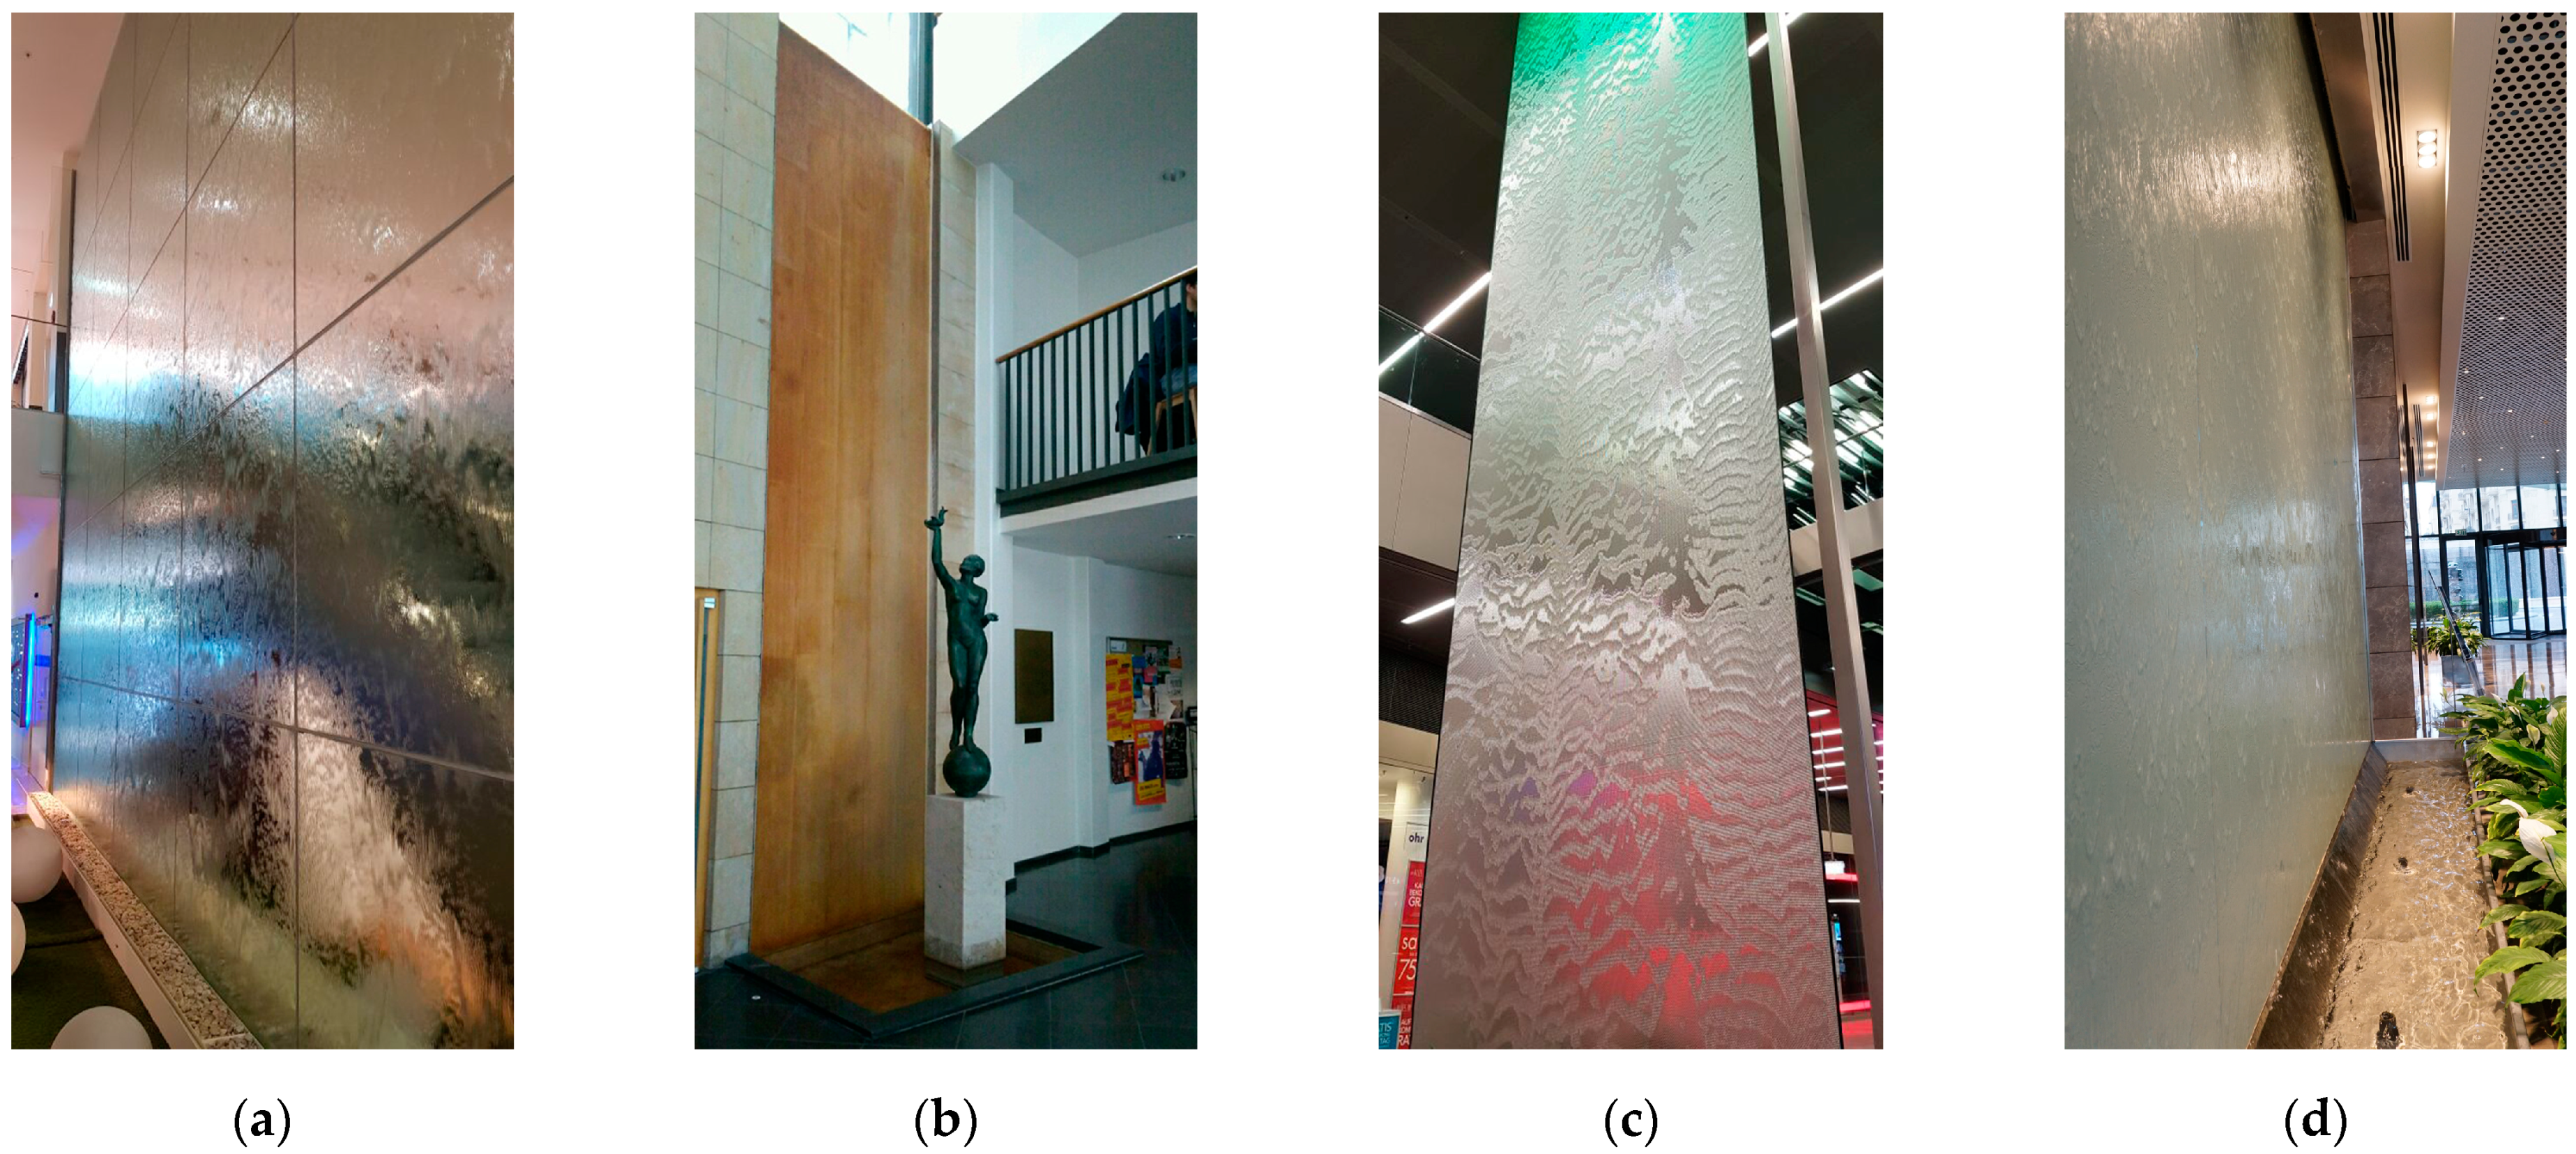
1. Introduction
2. Materials and Methods
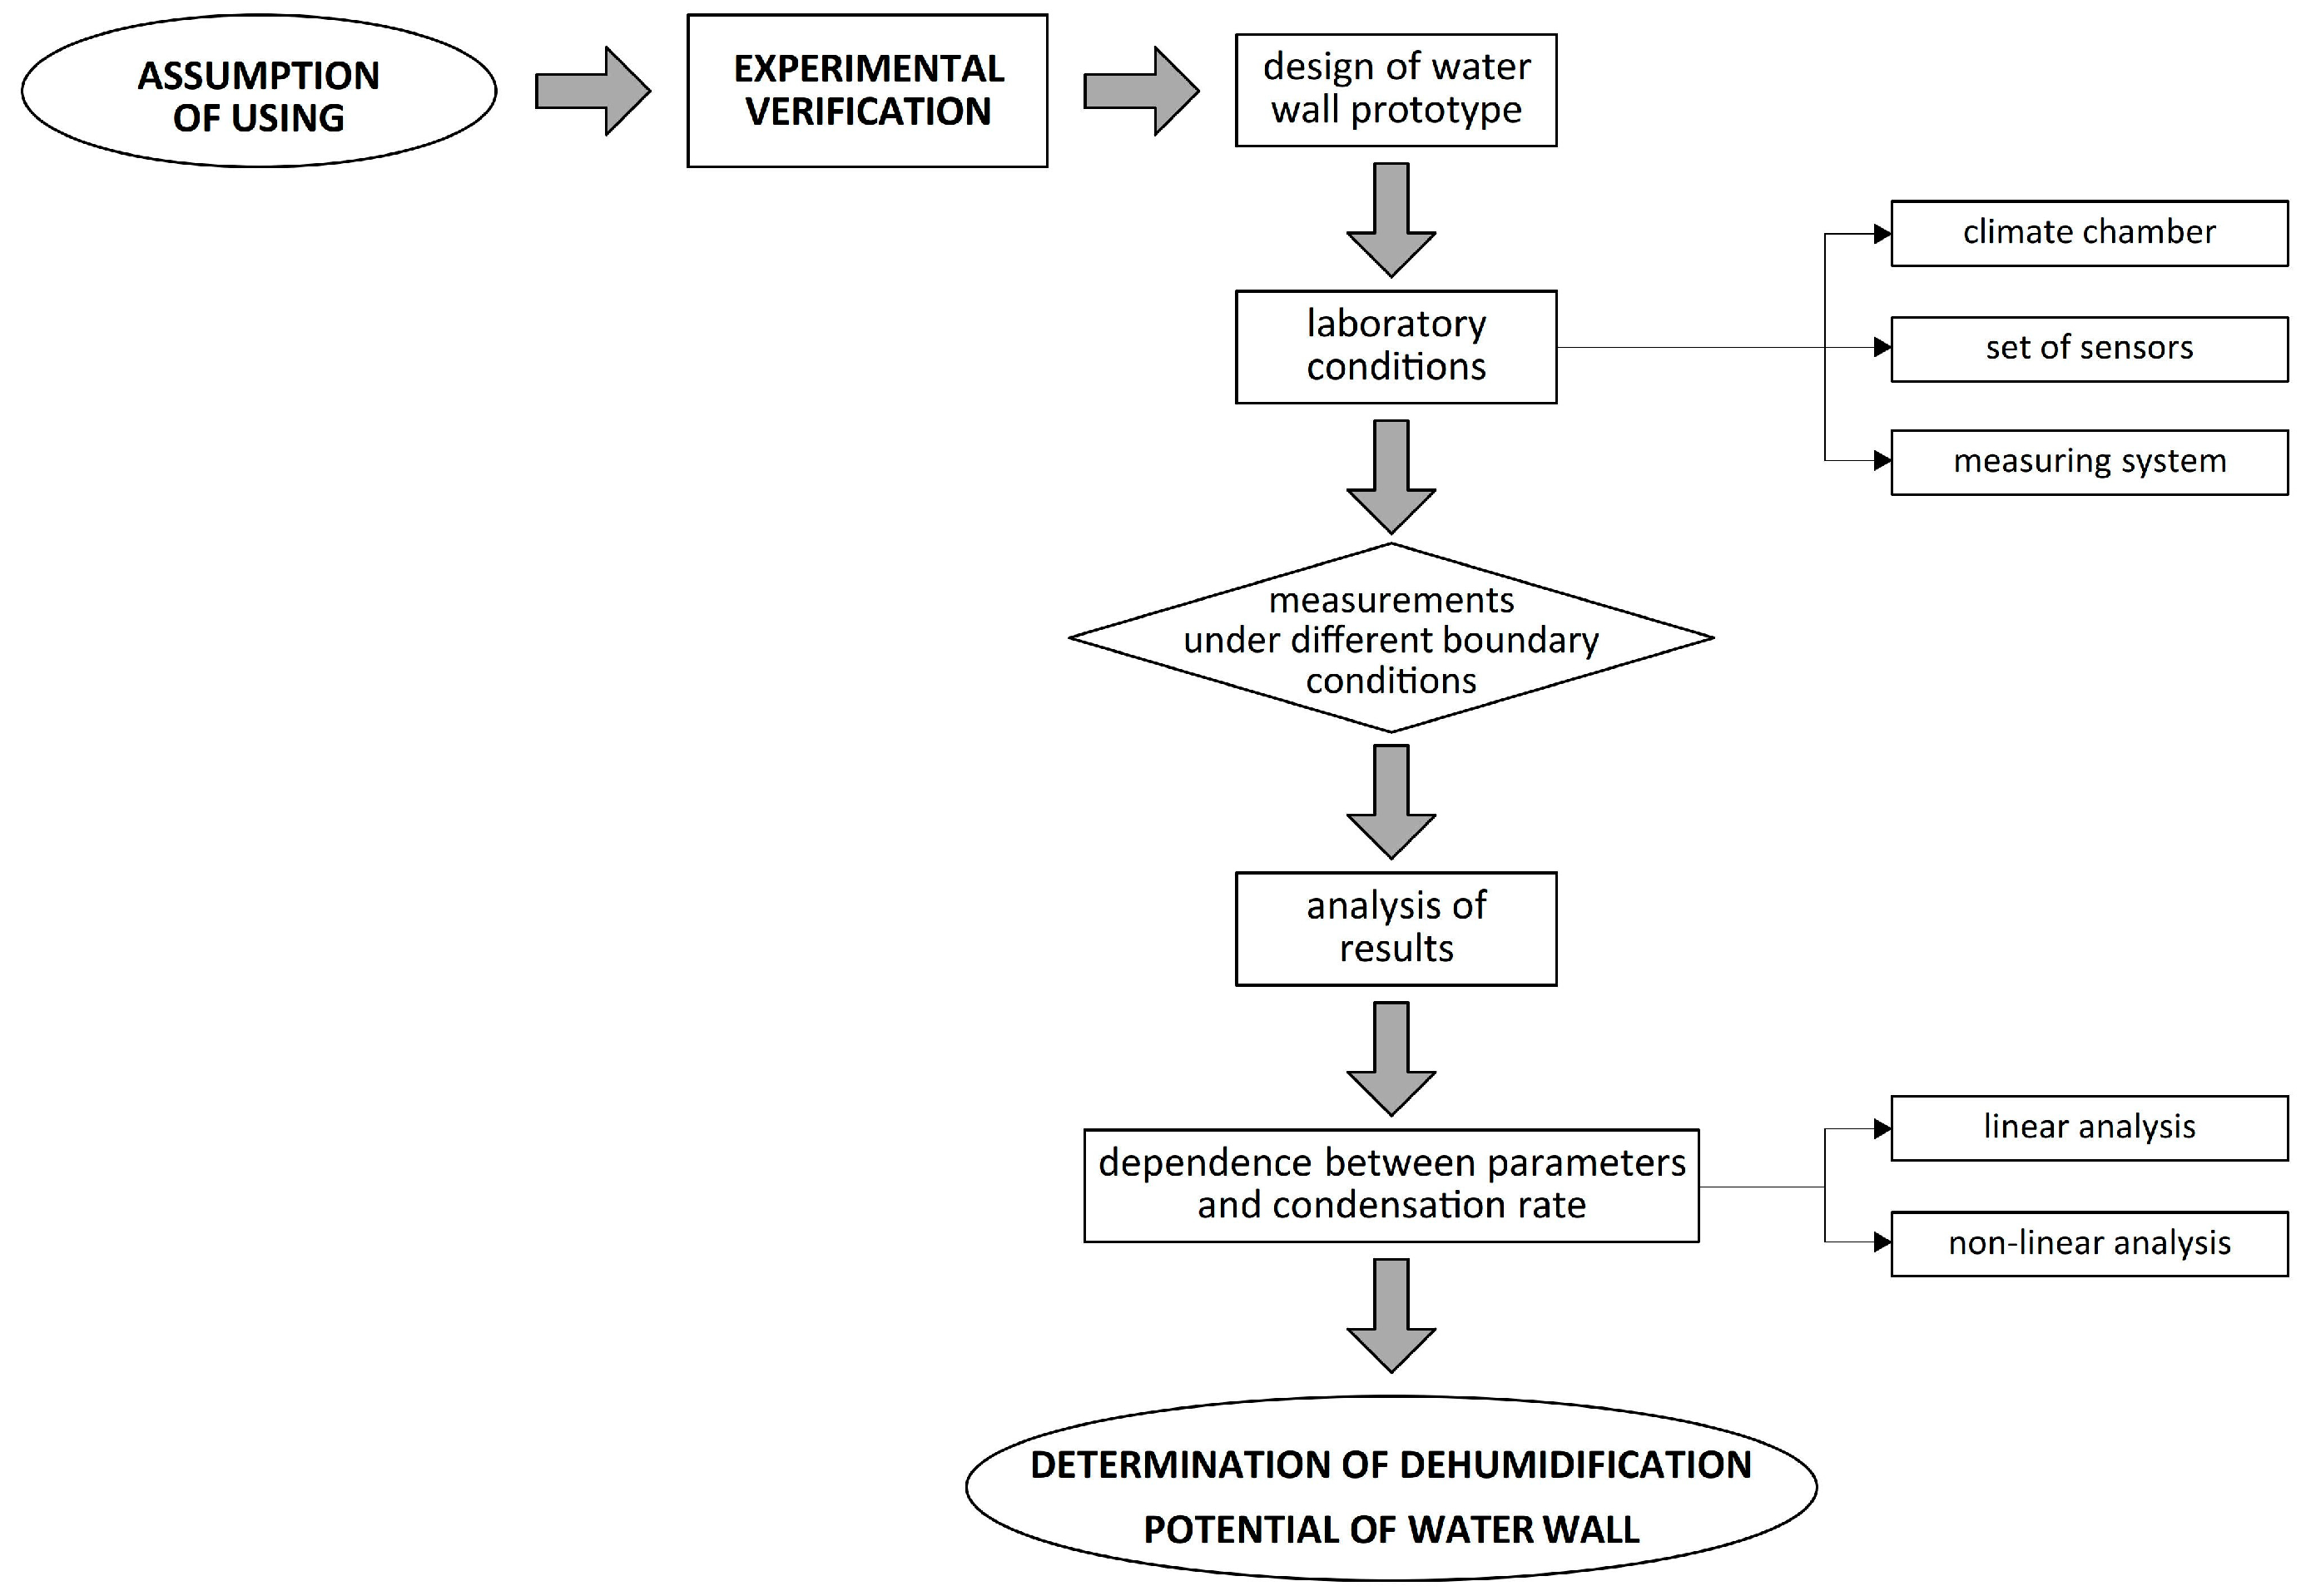
2.1. Research Scheme
2.2. Assumption of Water Wall Use to Dehumidify Air
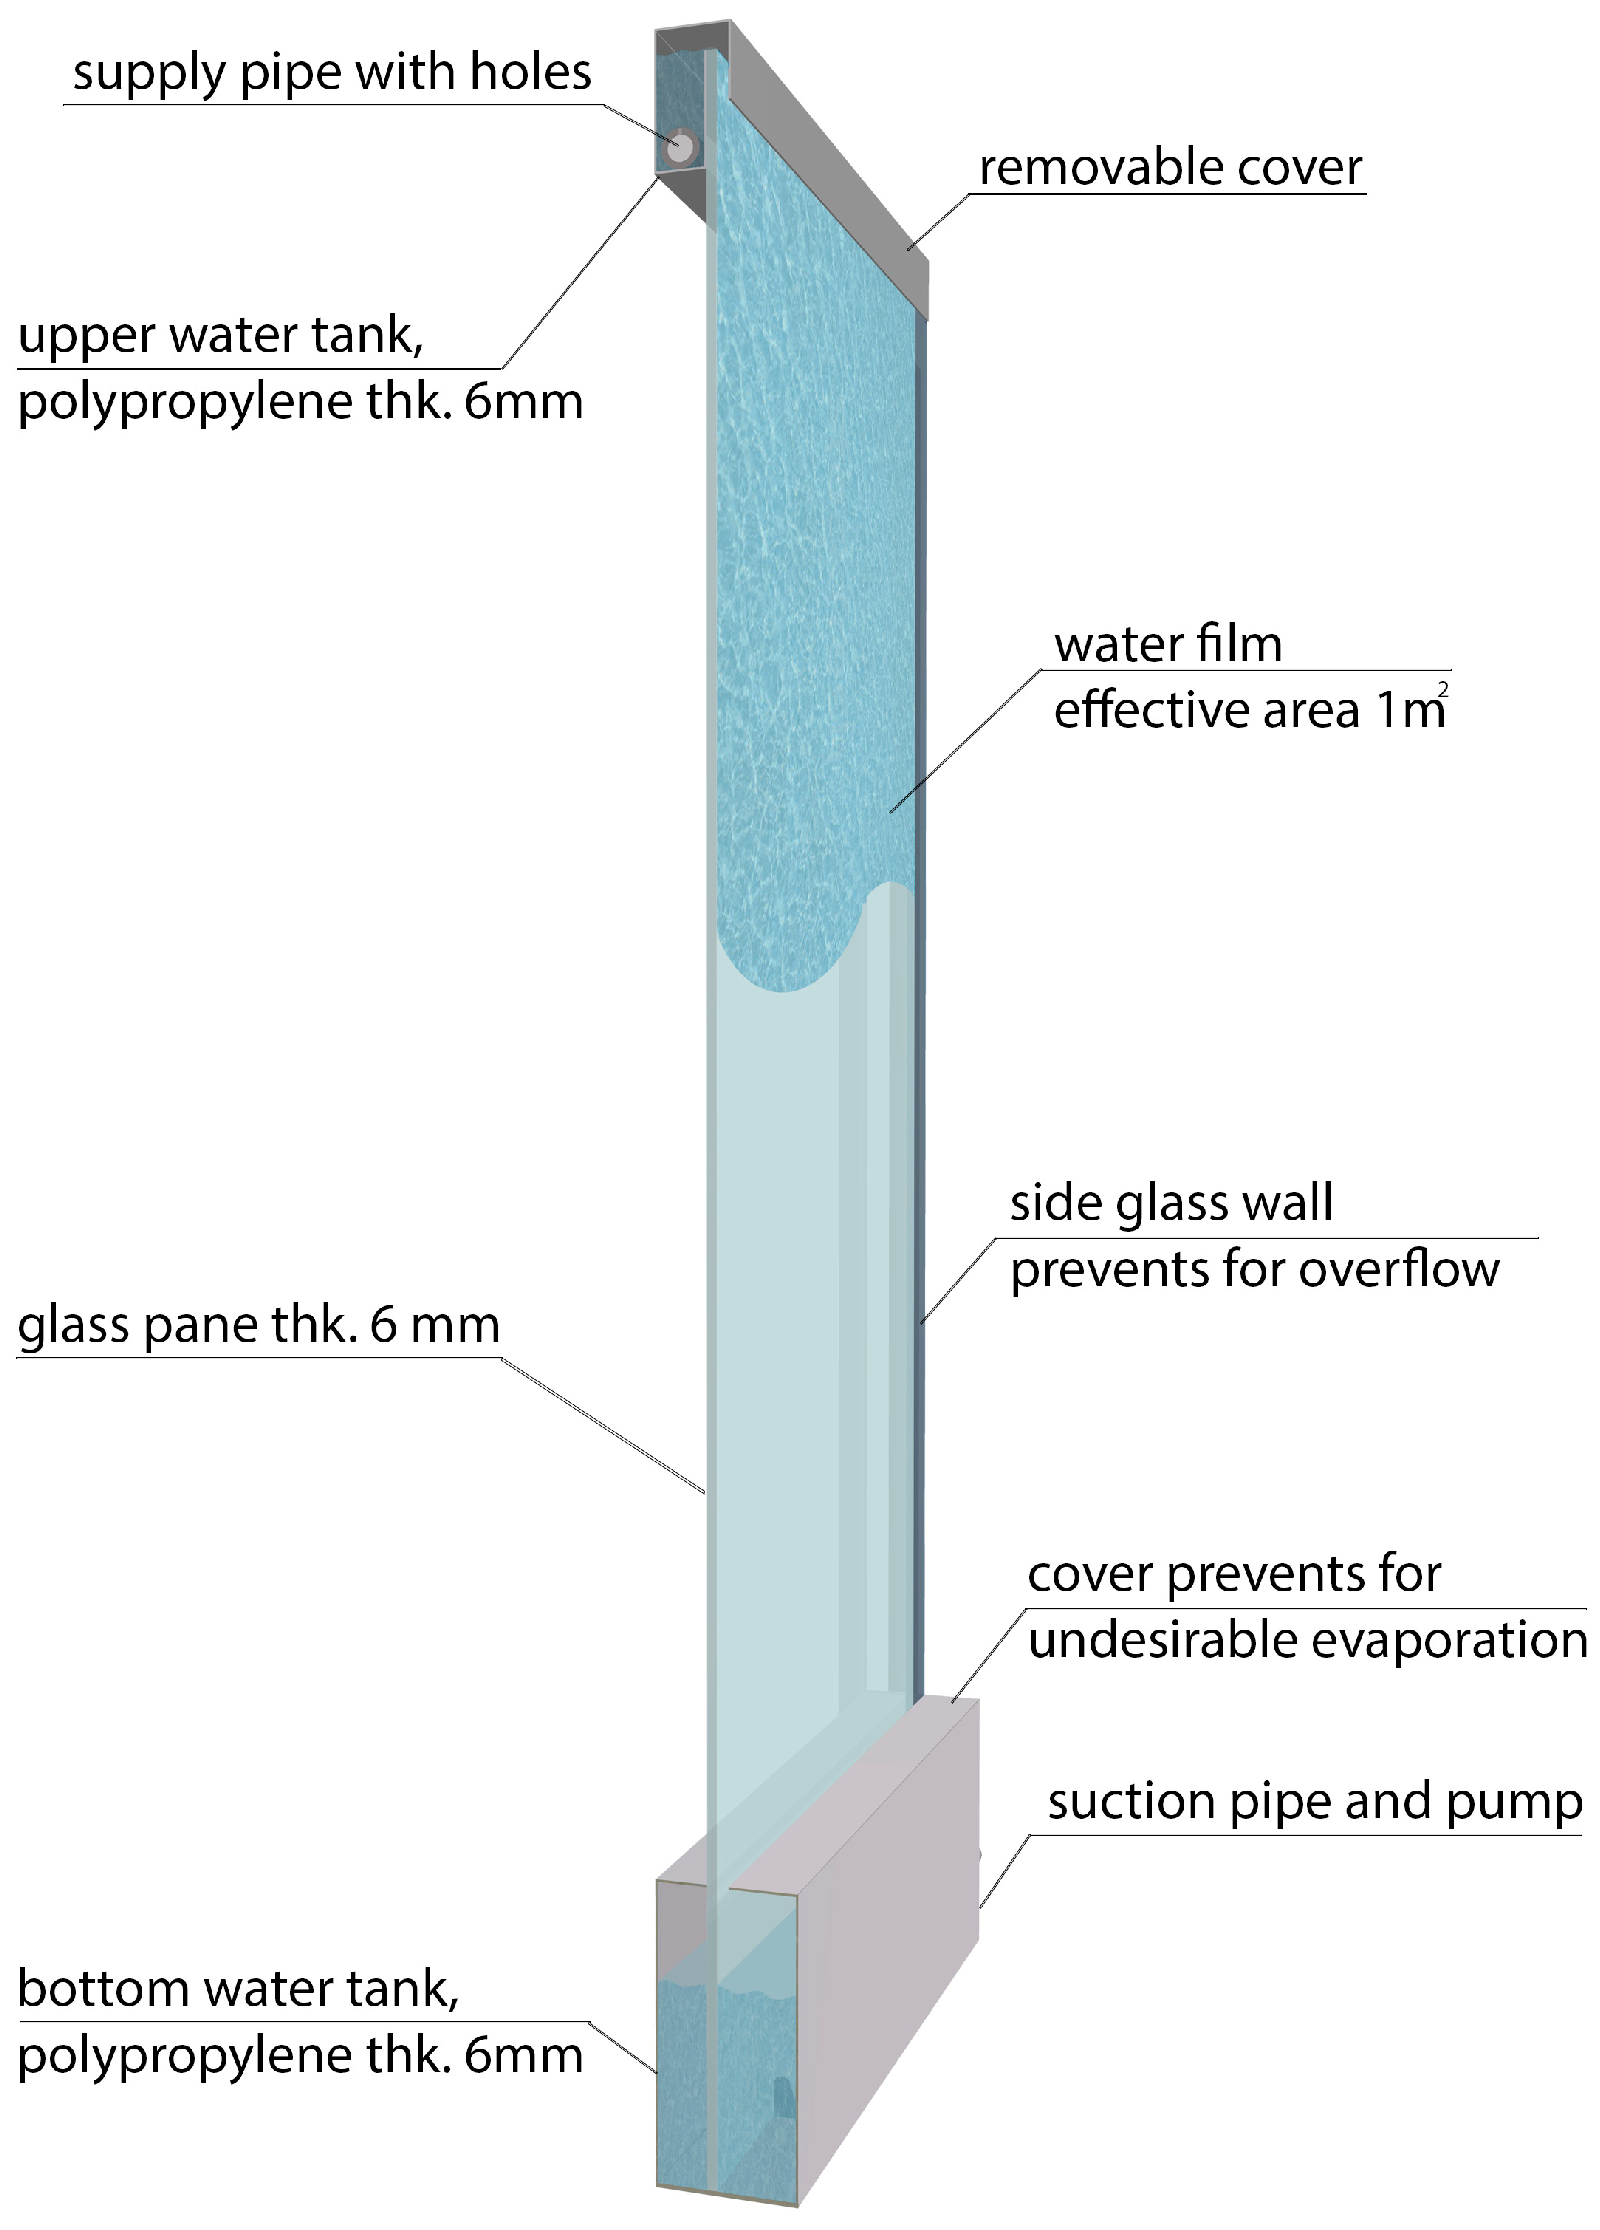
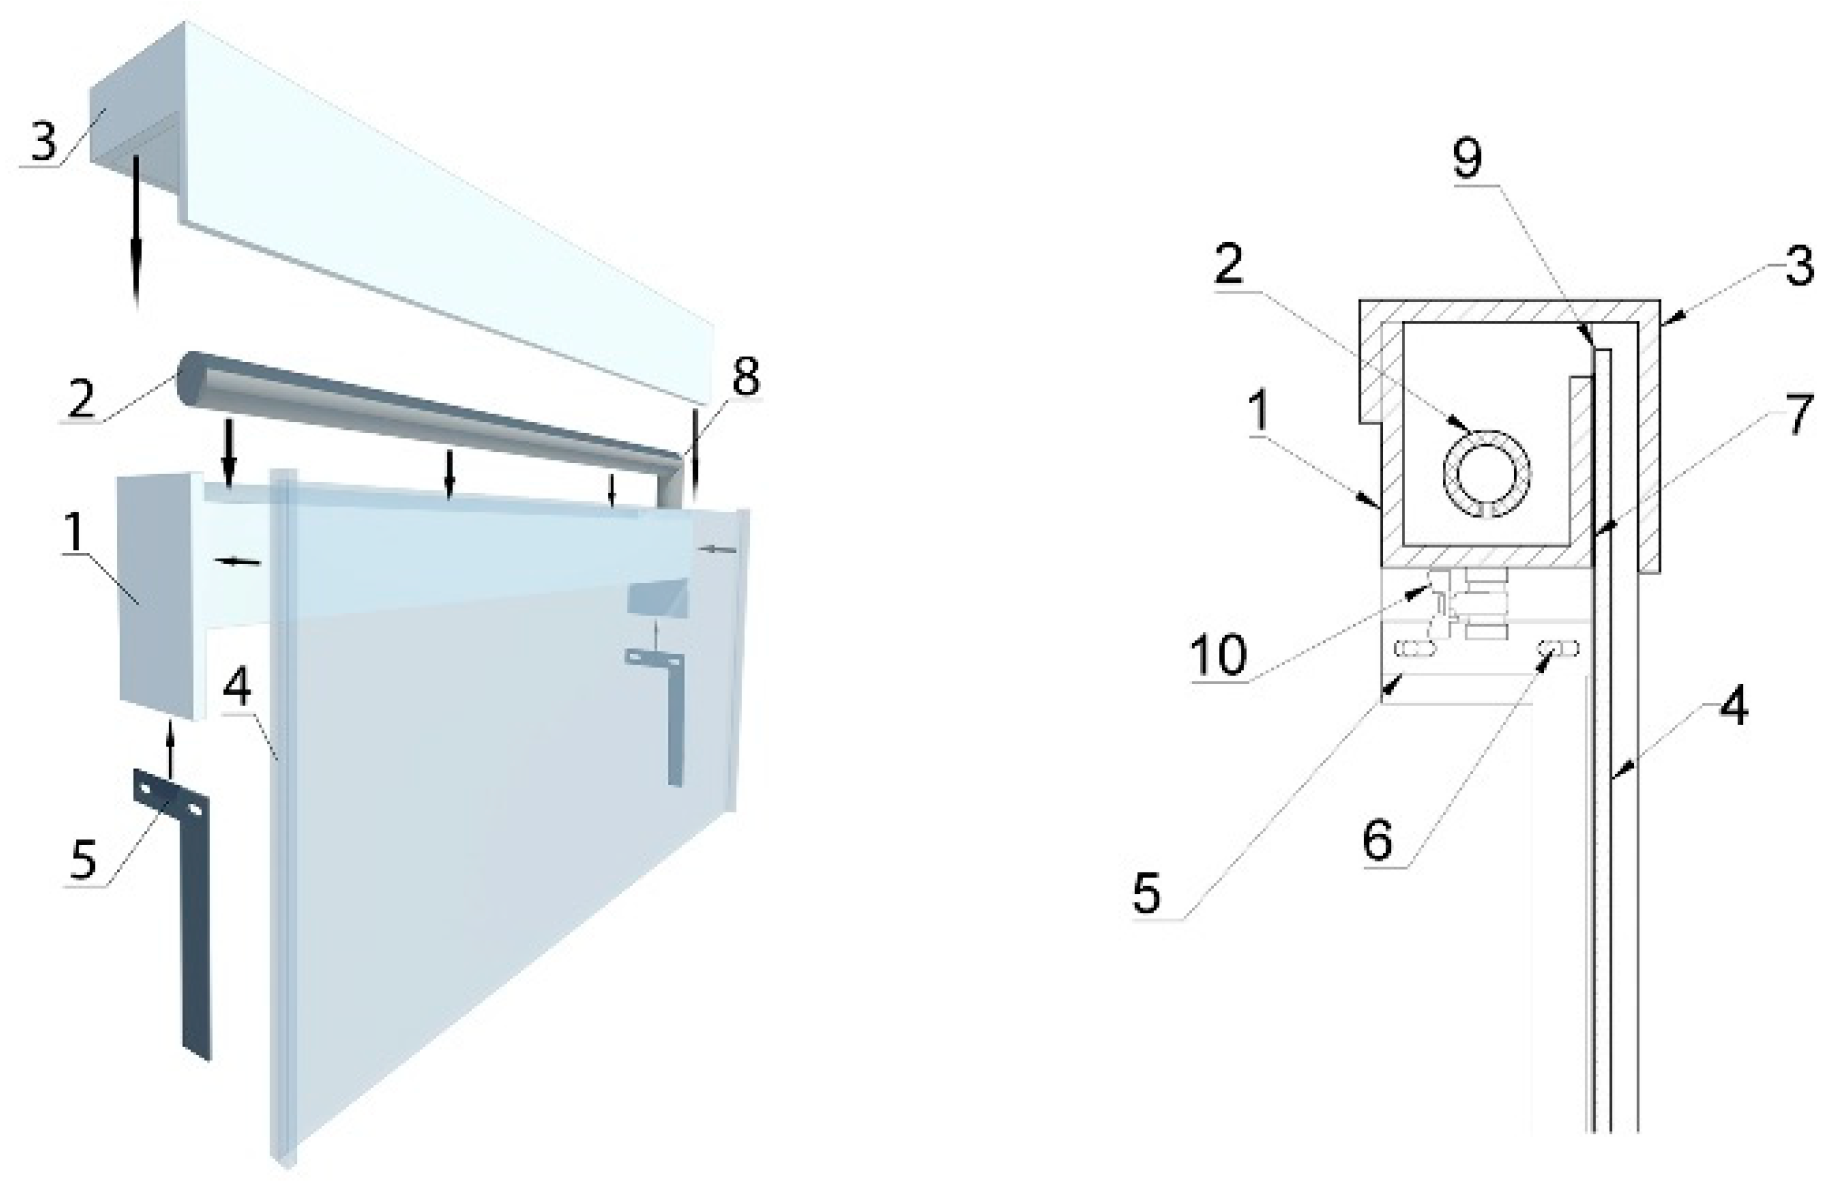
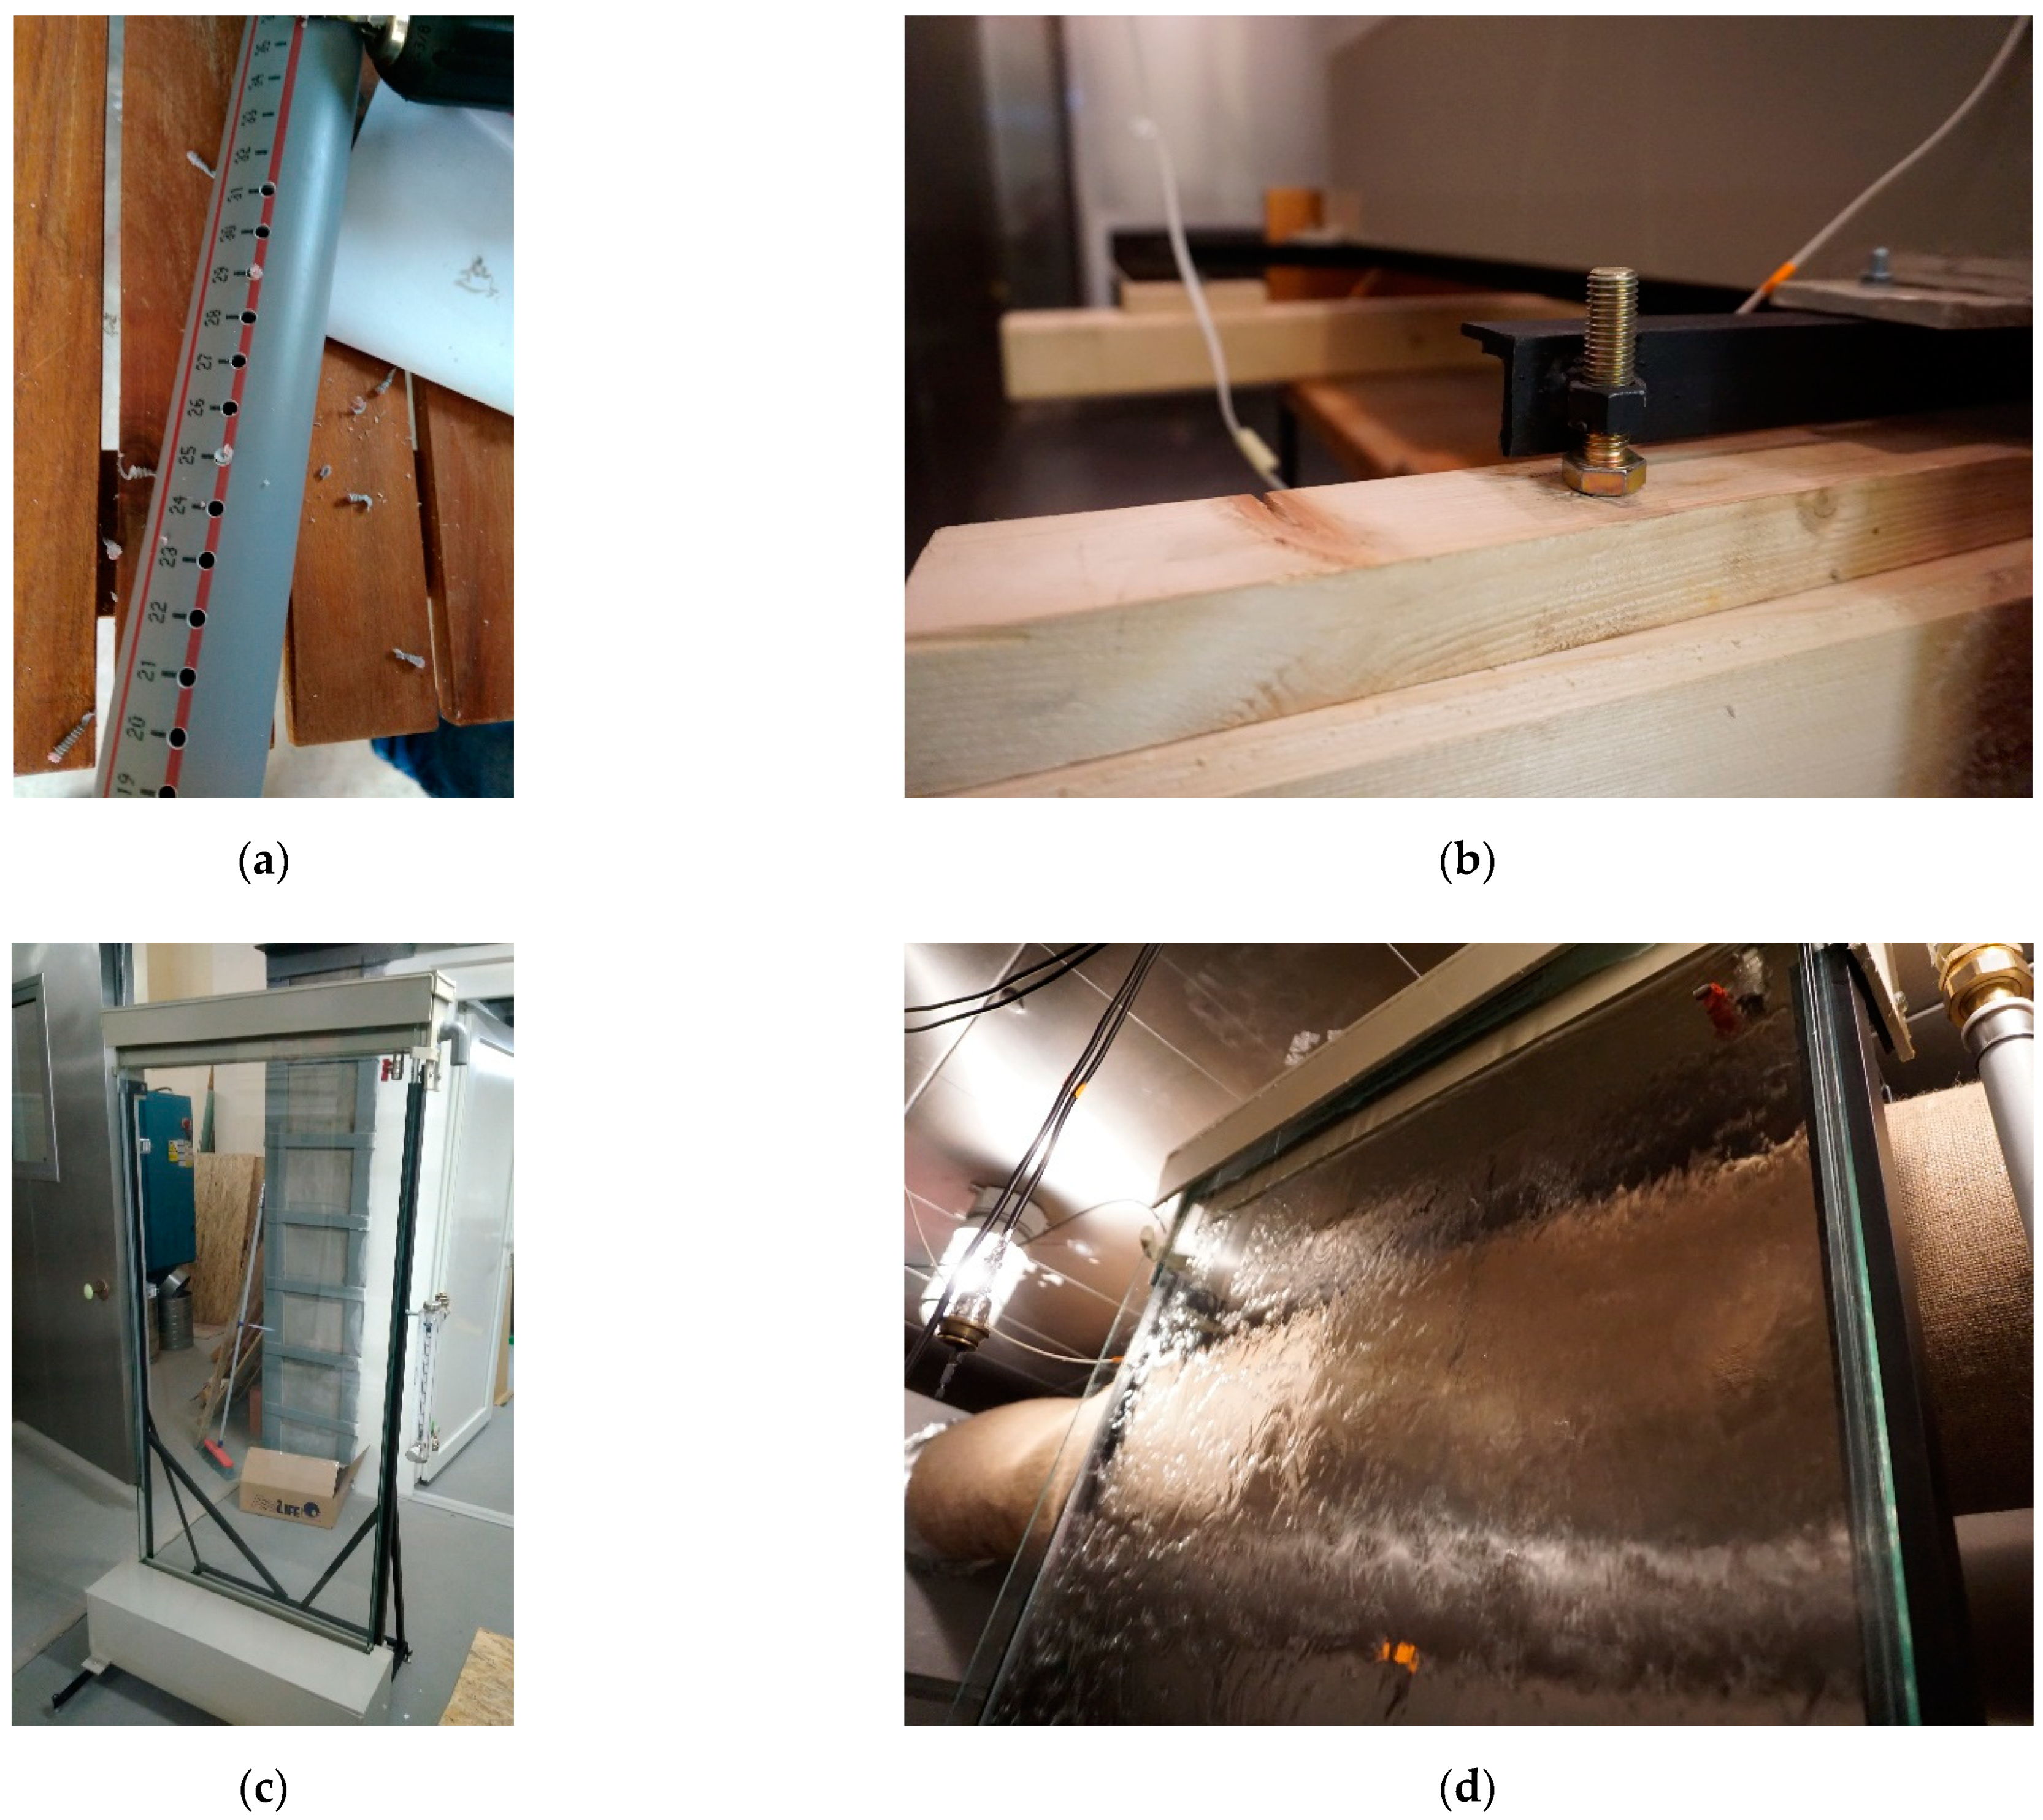
2.3. Design of Water Wall Prototype
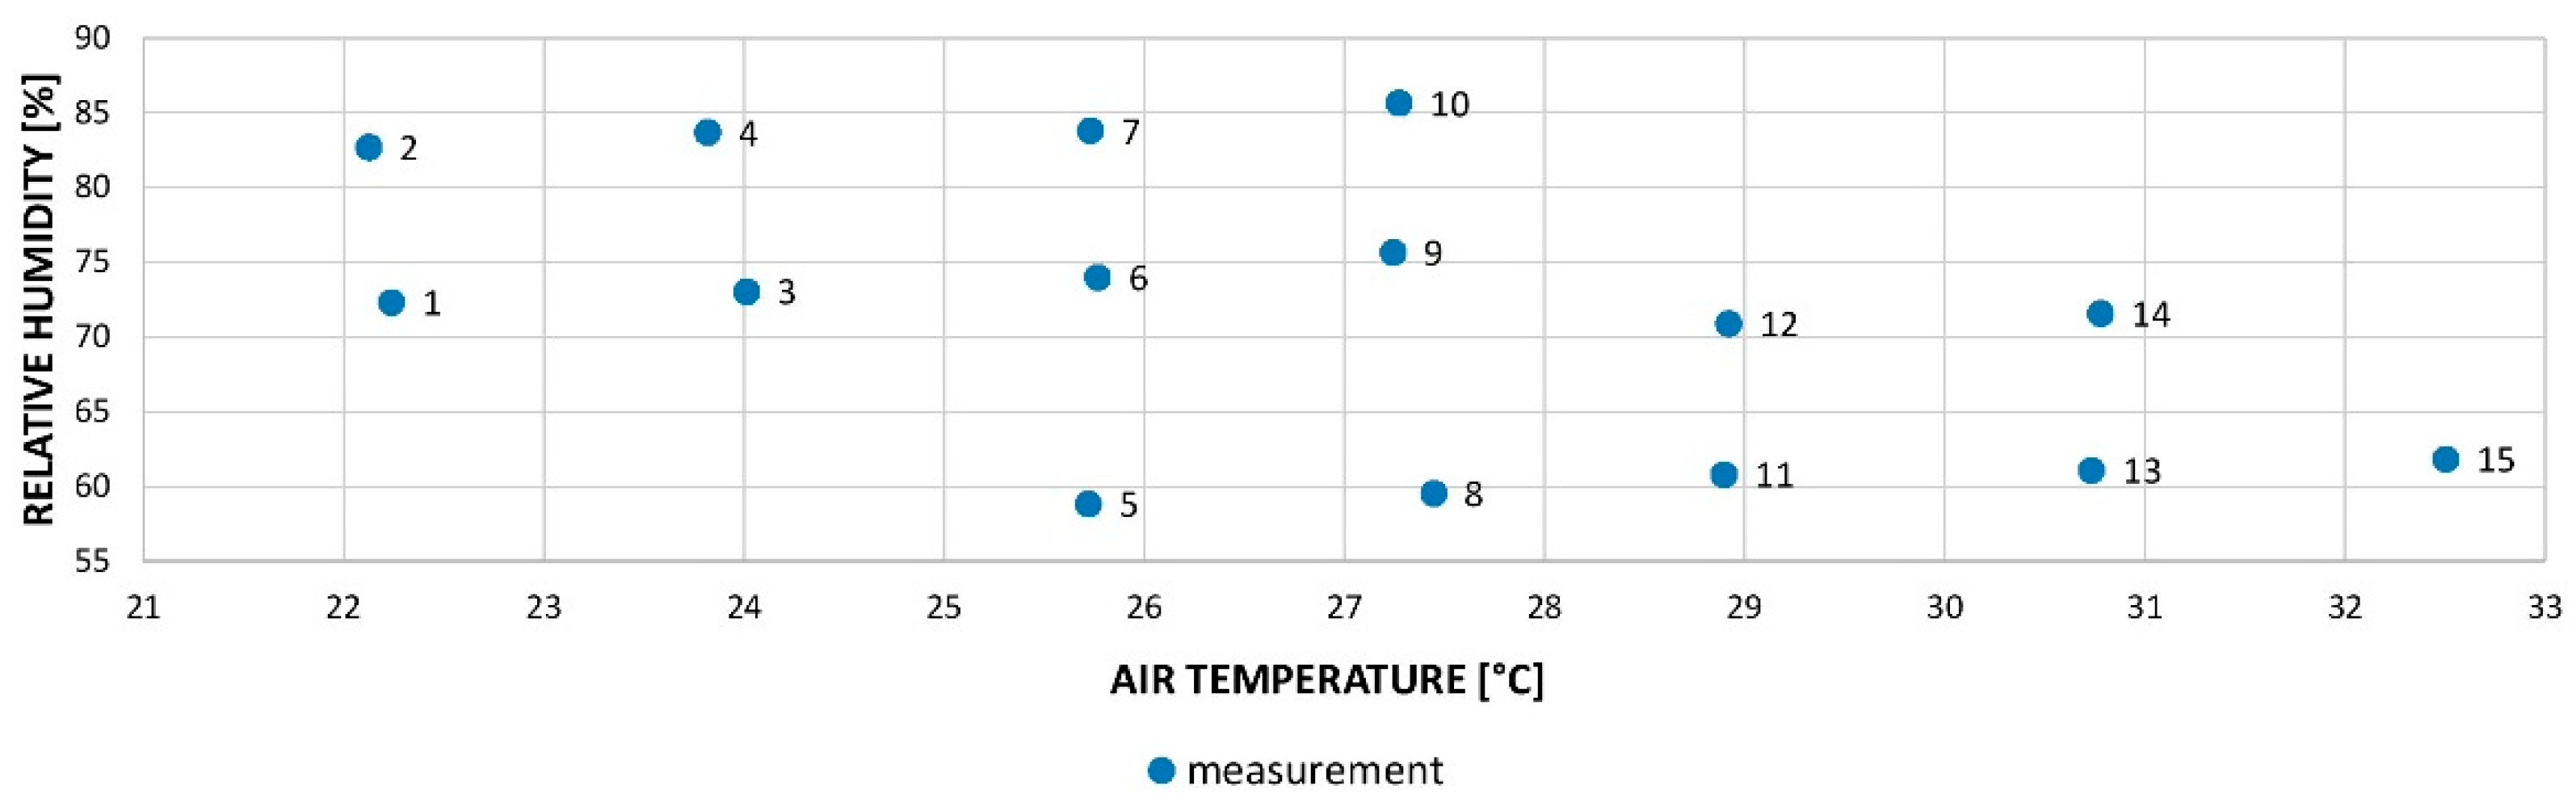
2.4. Laboratory Conditions
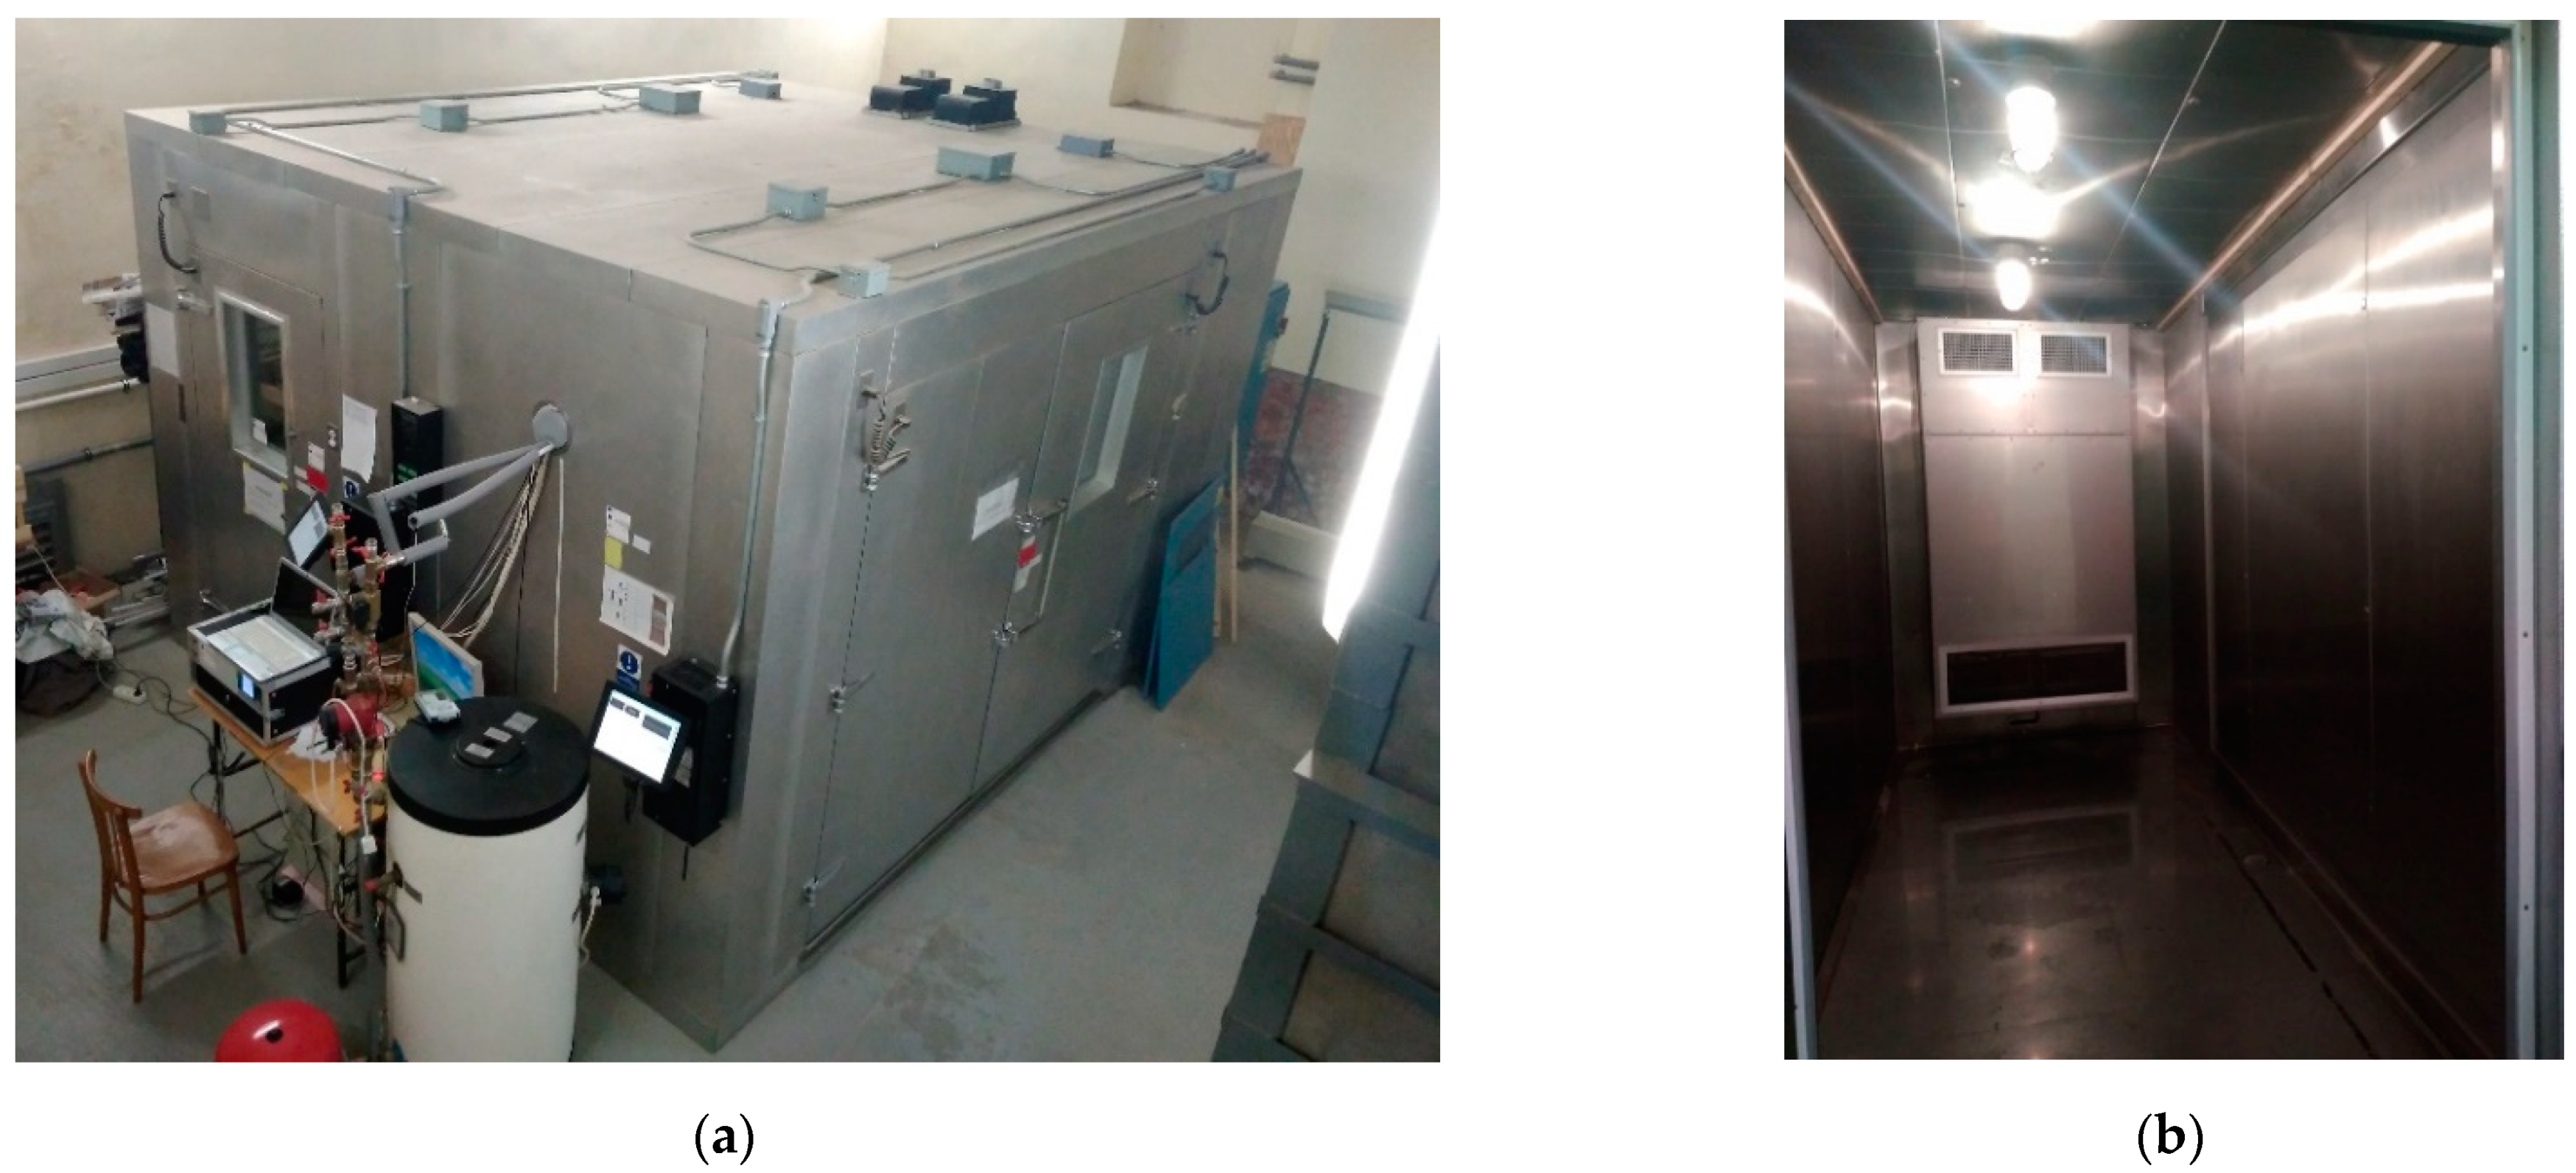
2.4.1. Climate Chamber
2.4.2. Set of Sensors
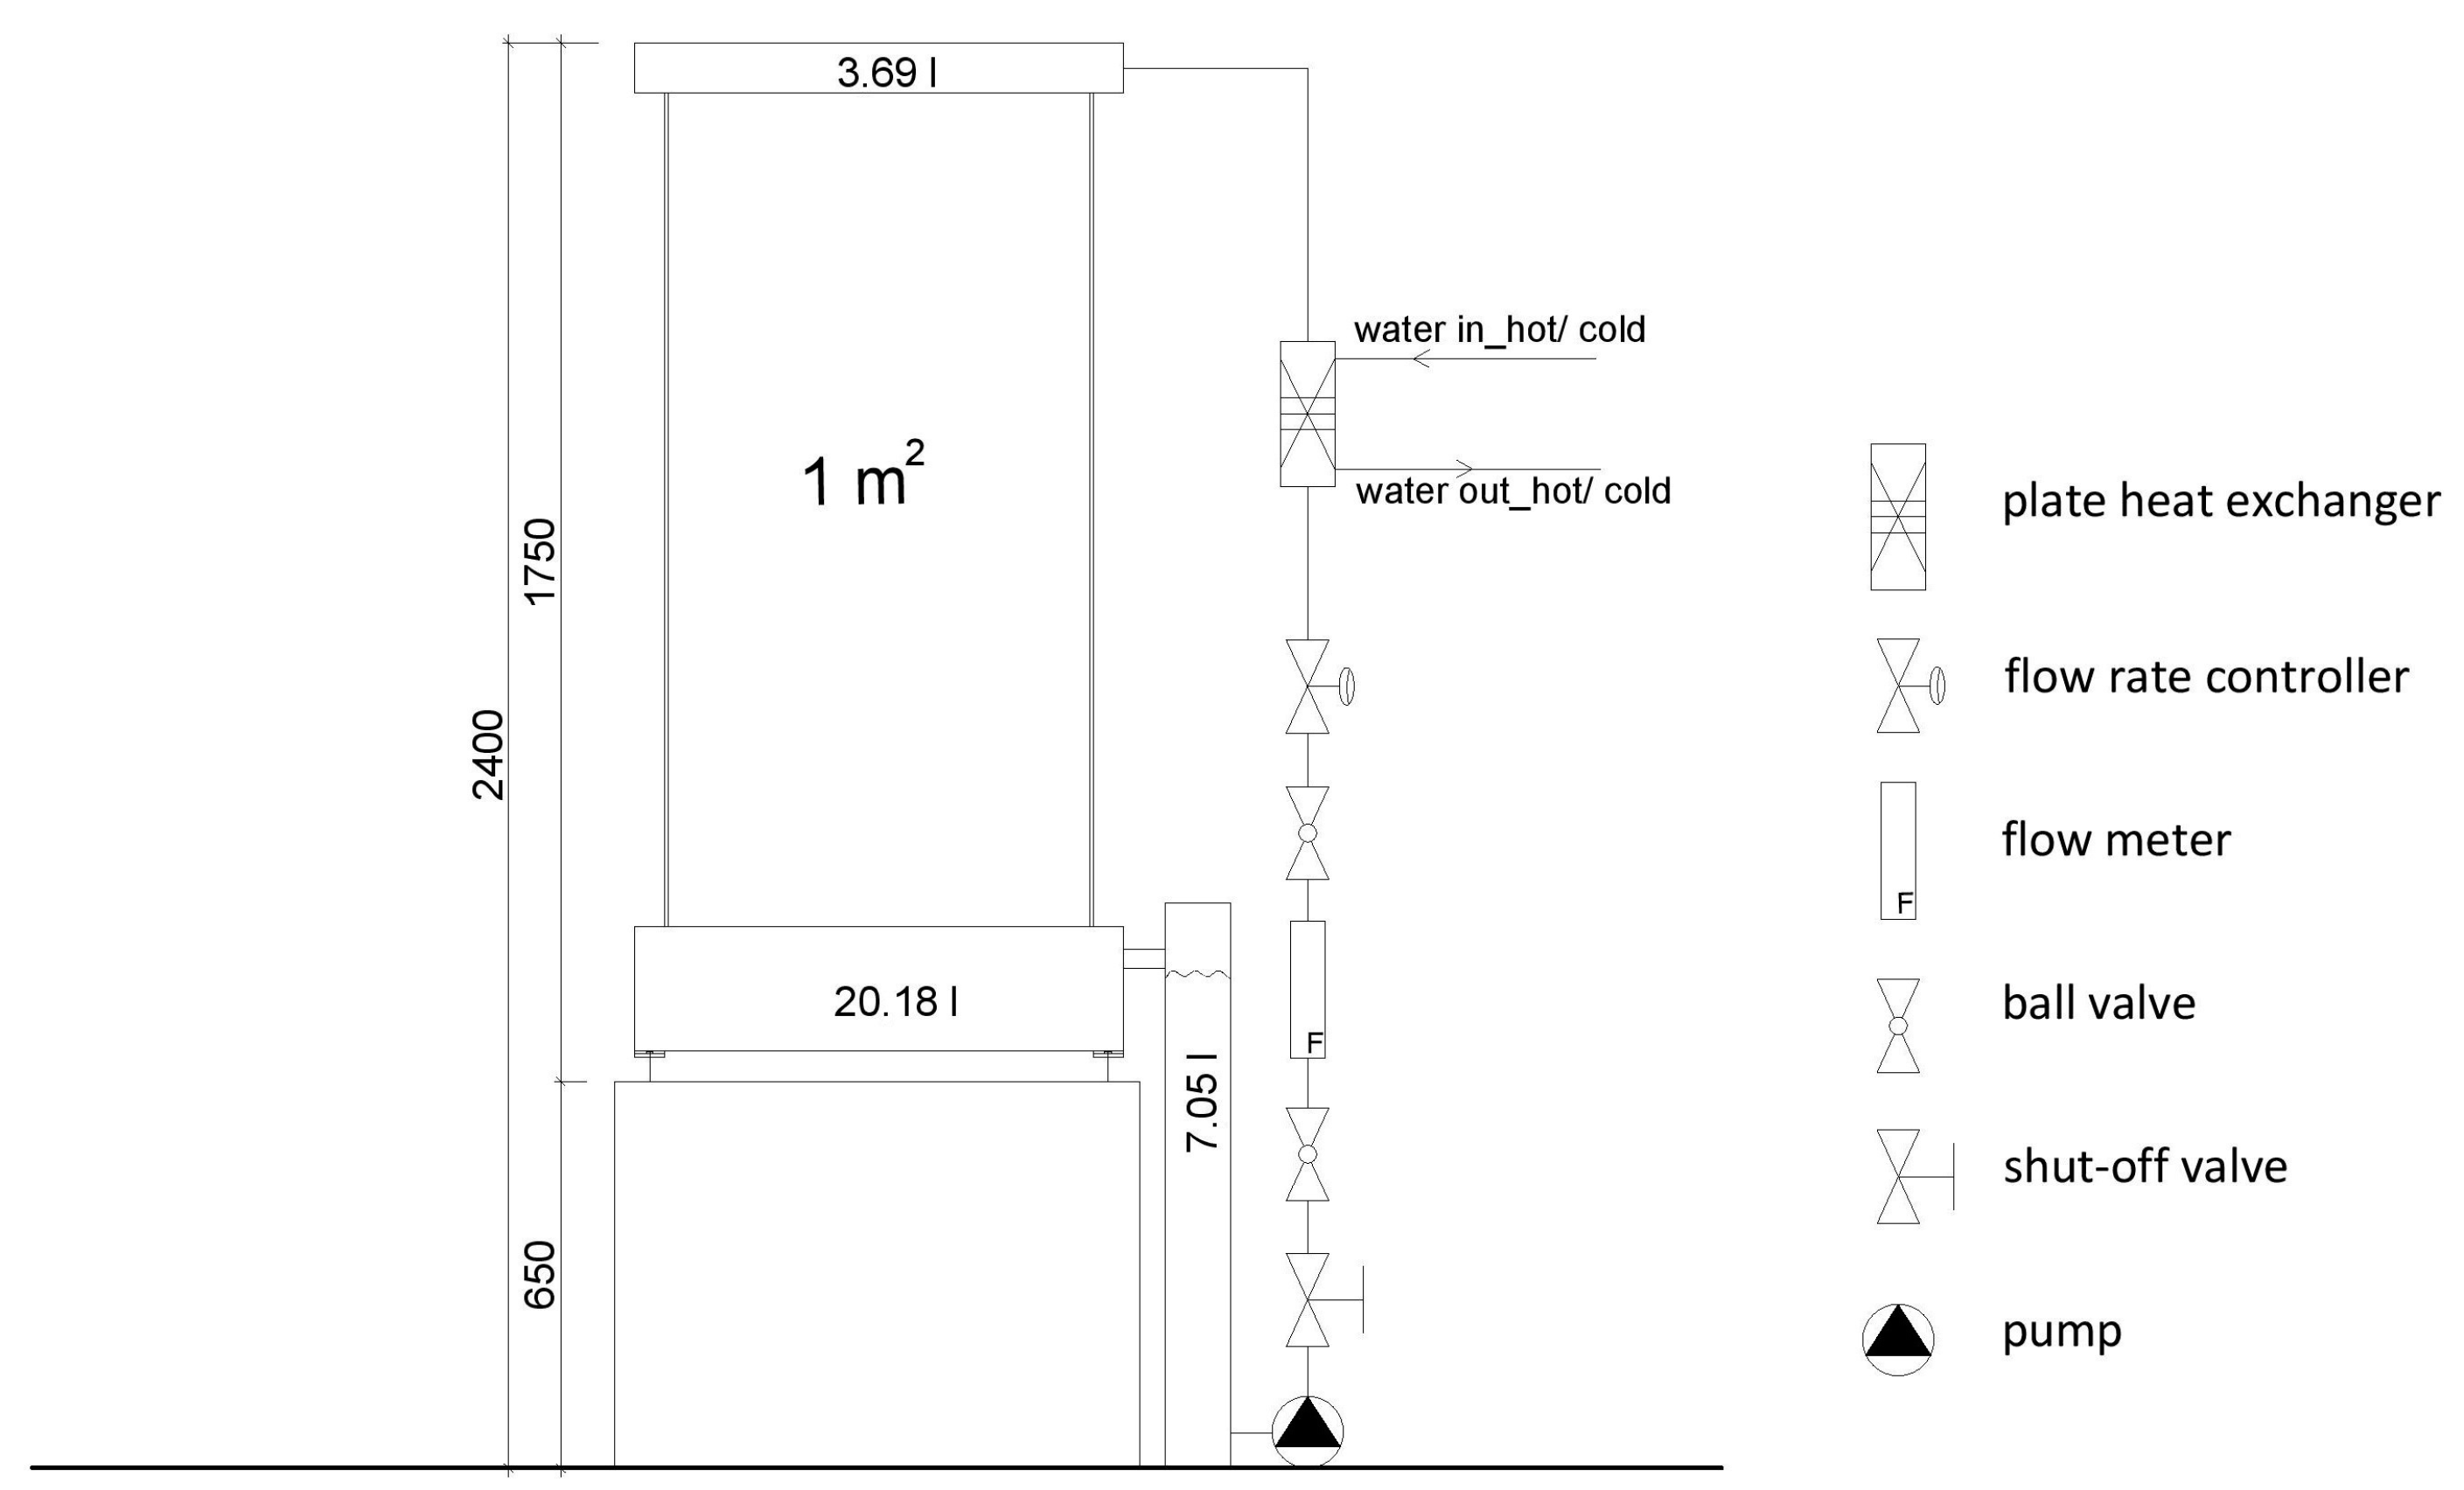
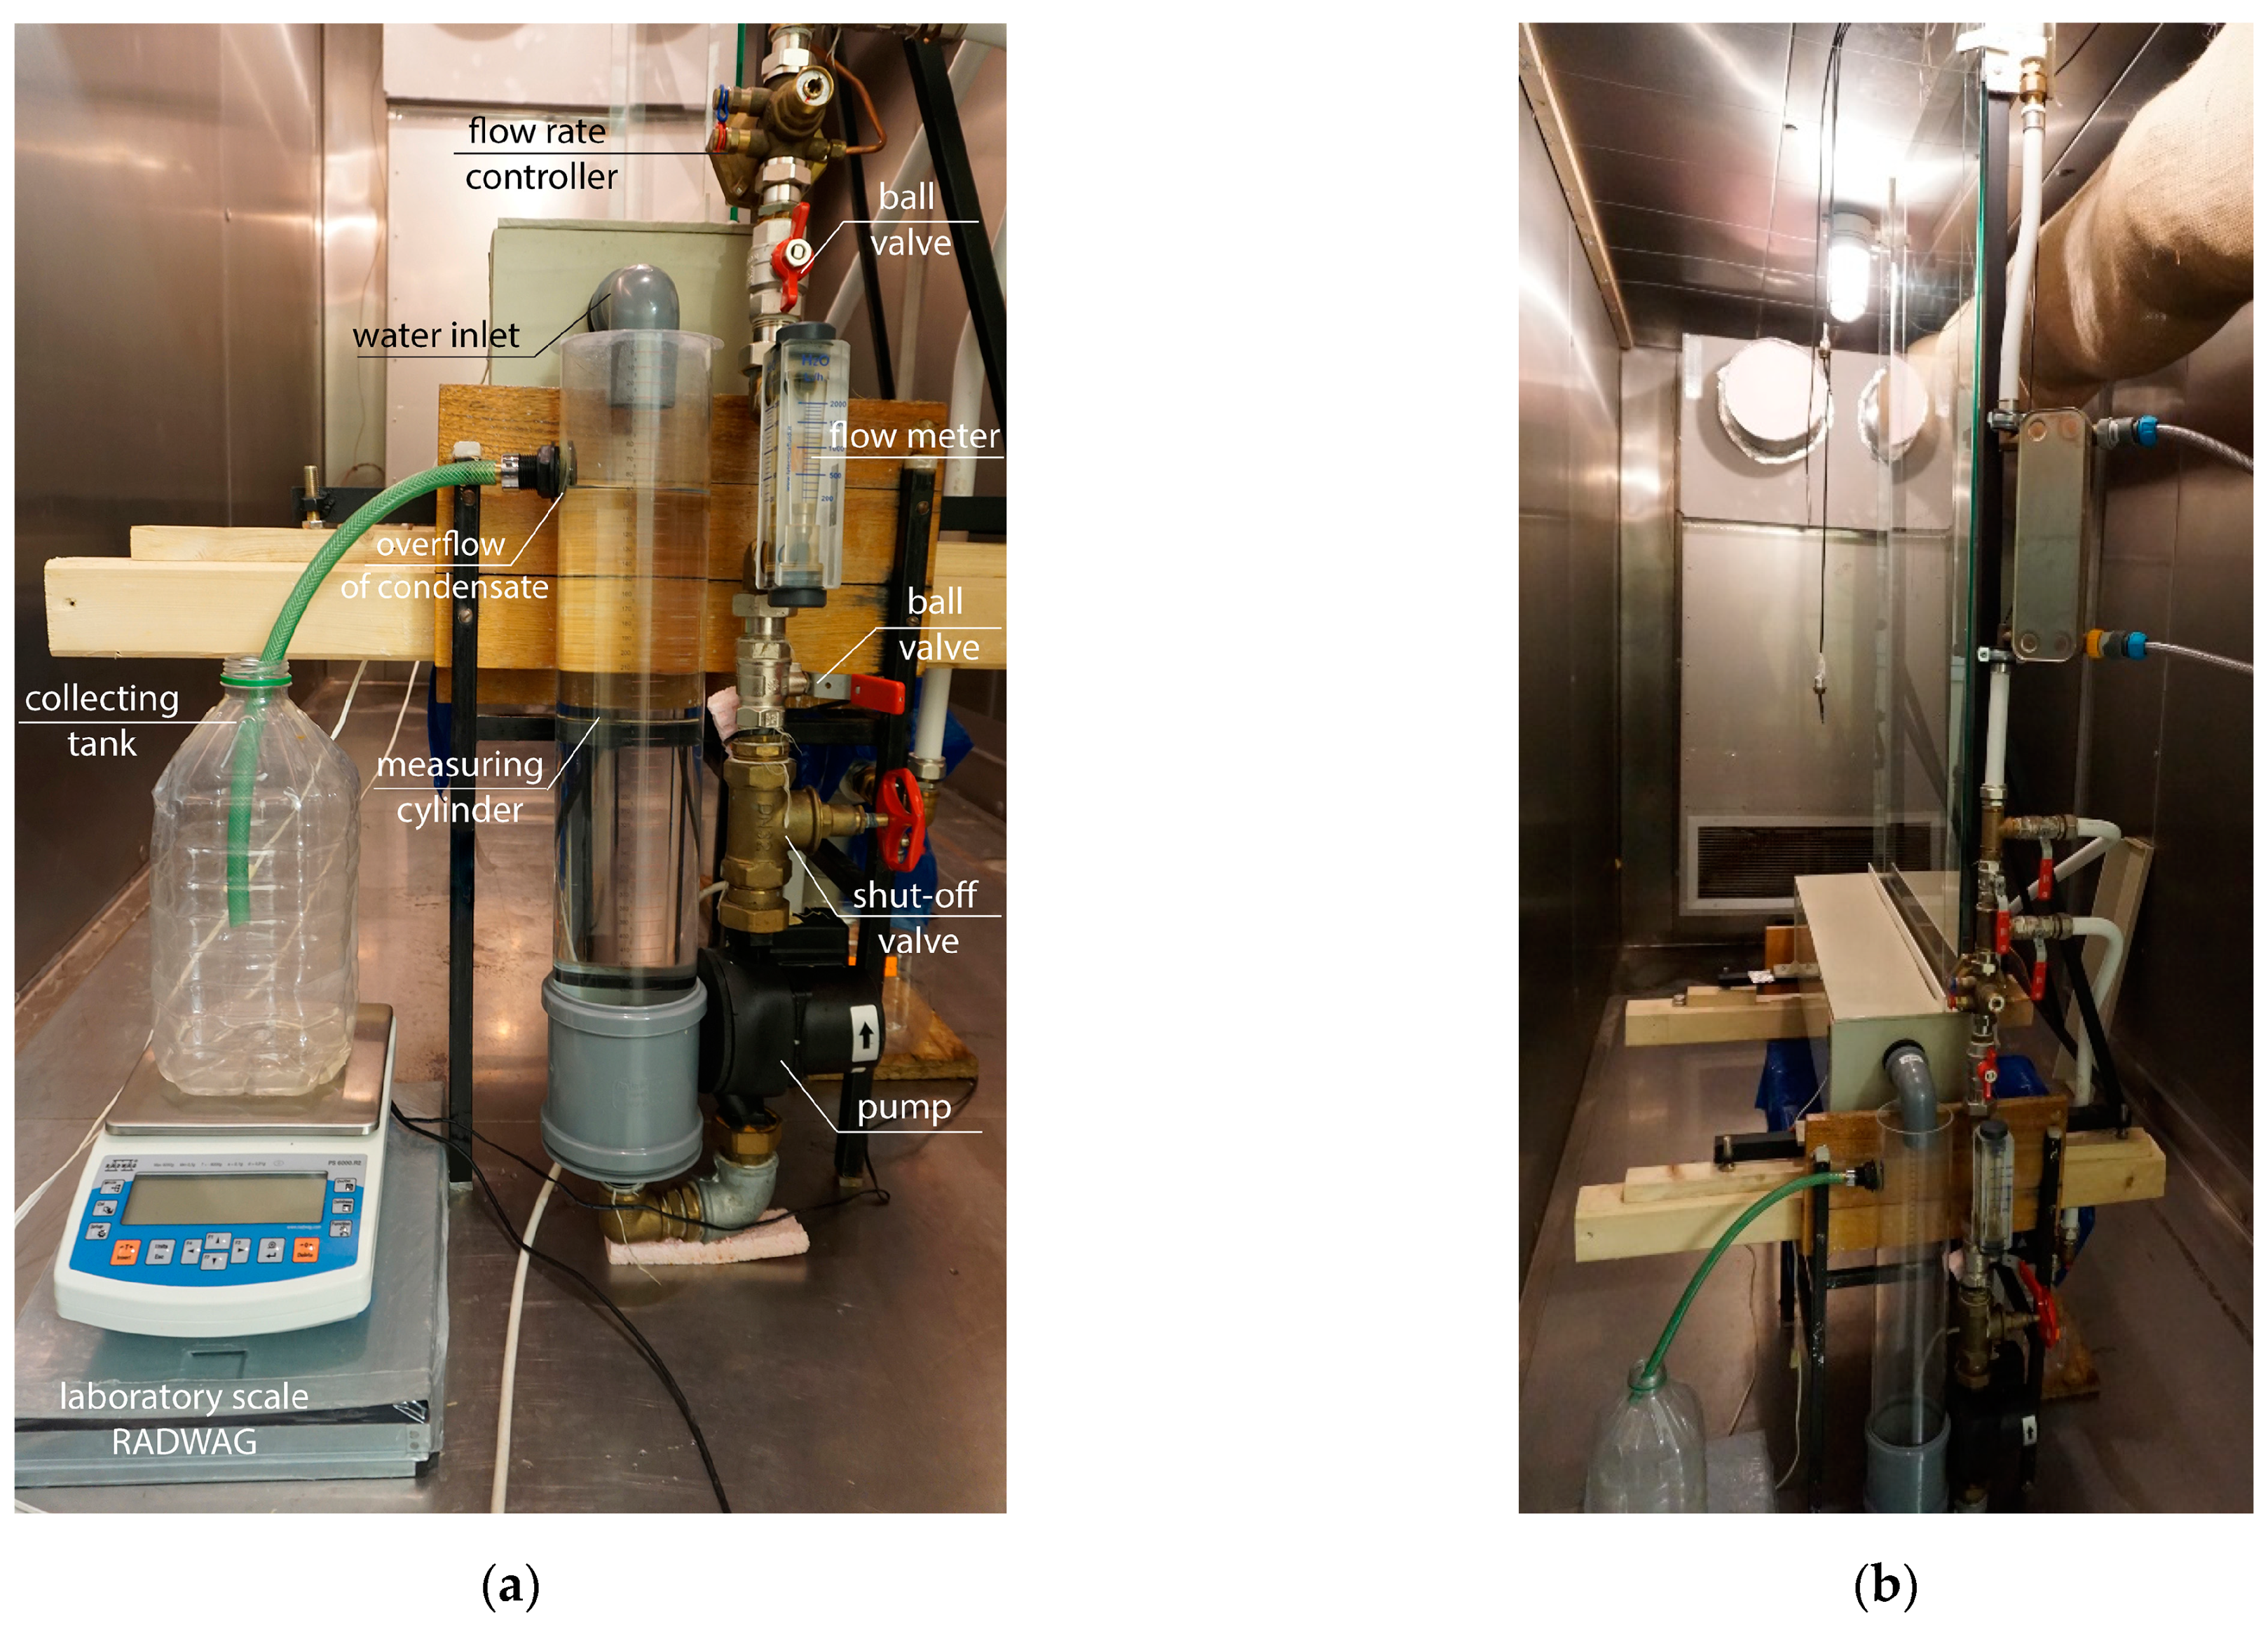
2.4.3. Measuring Systems
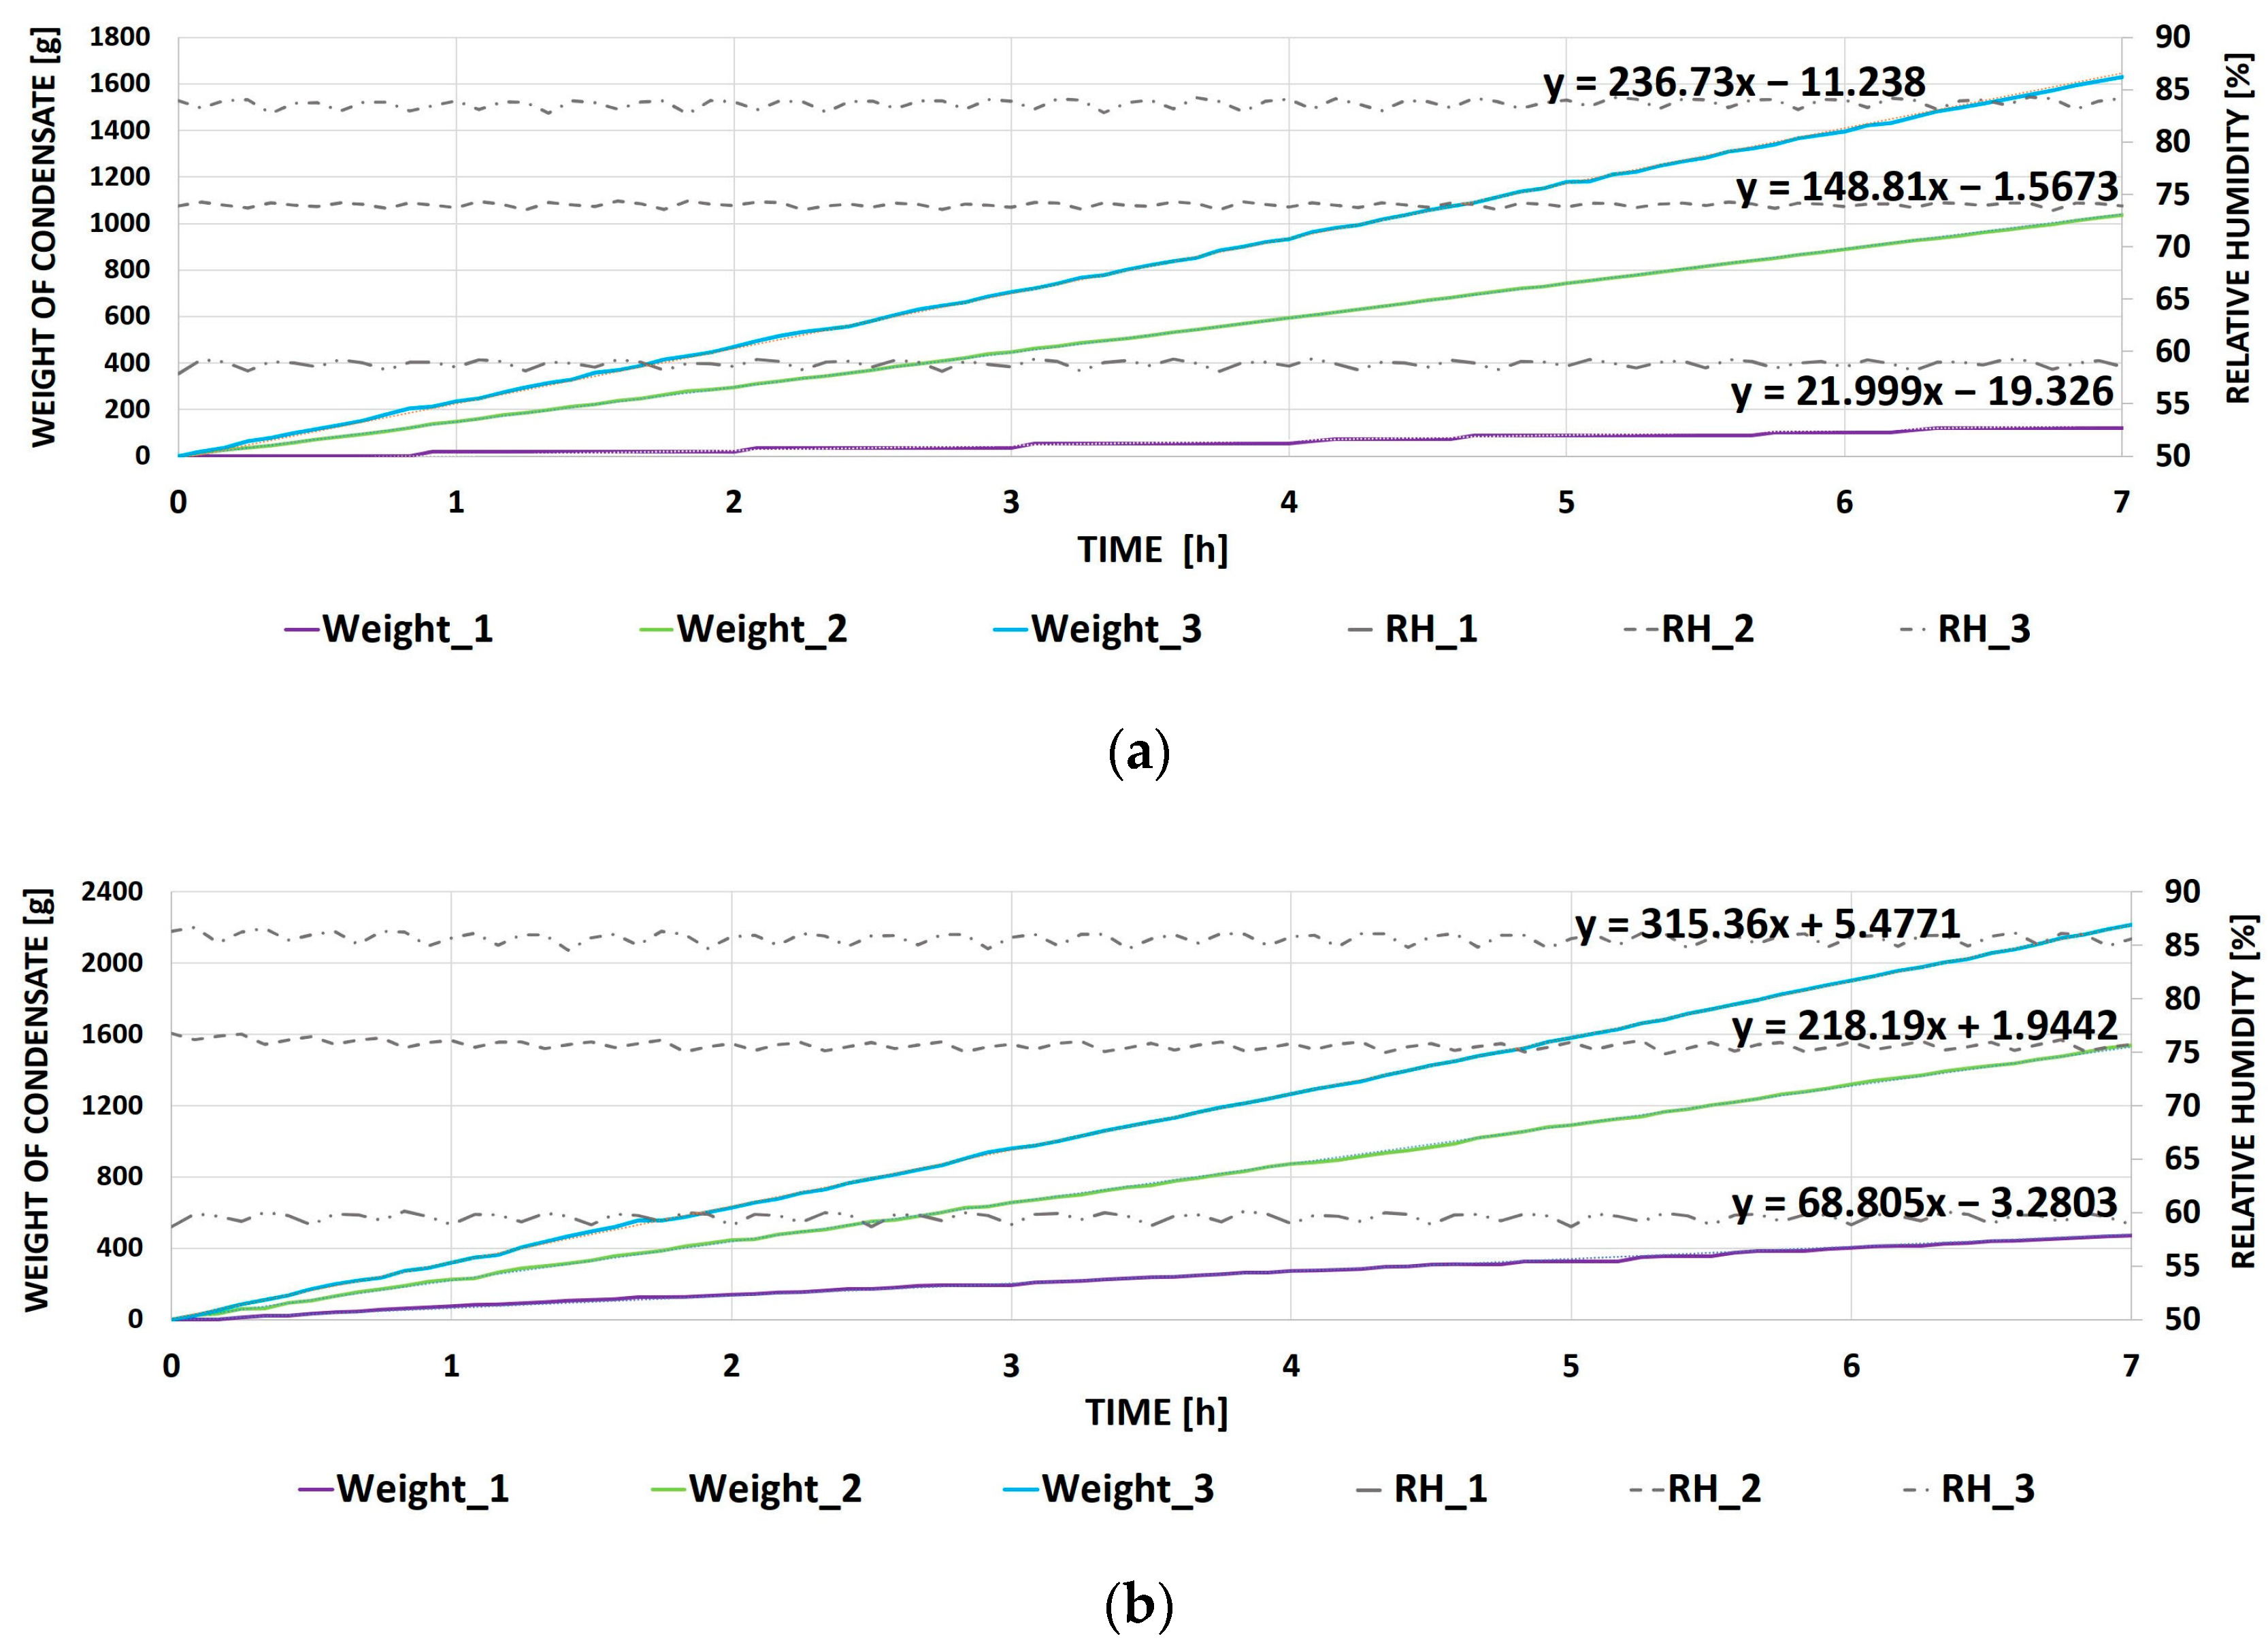
3. Results and Discussion
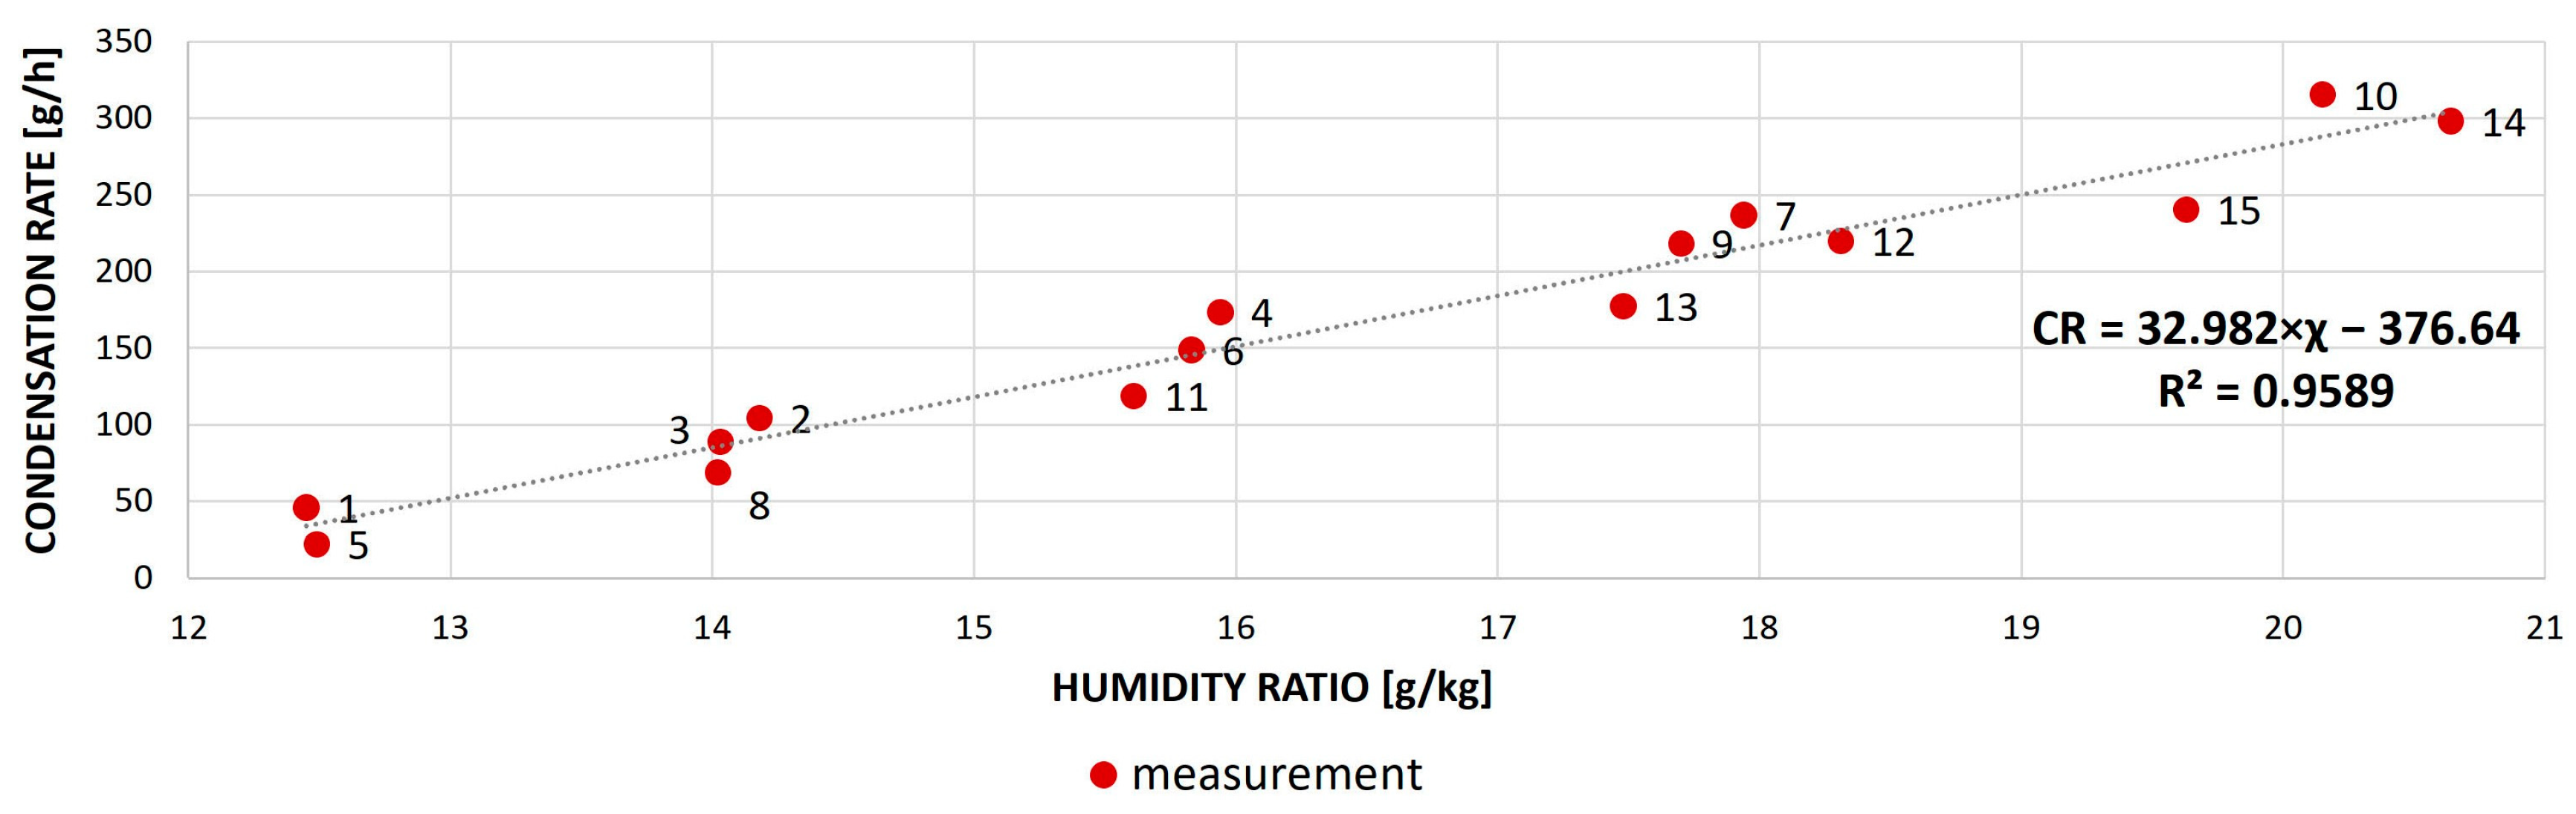
3.1. Analysis of Results Using Linear Dependence
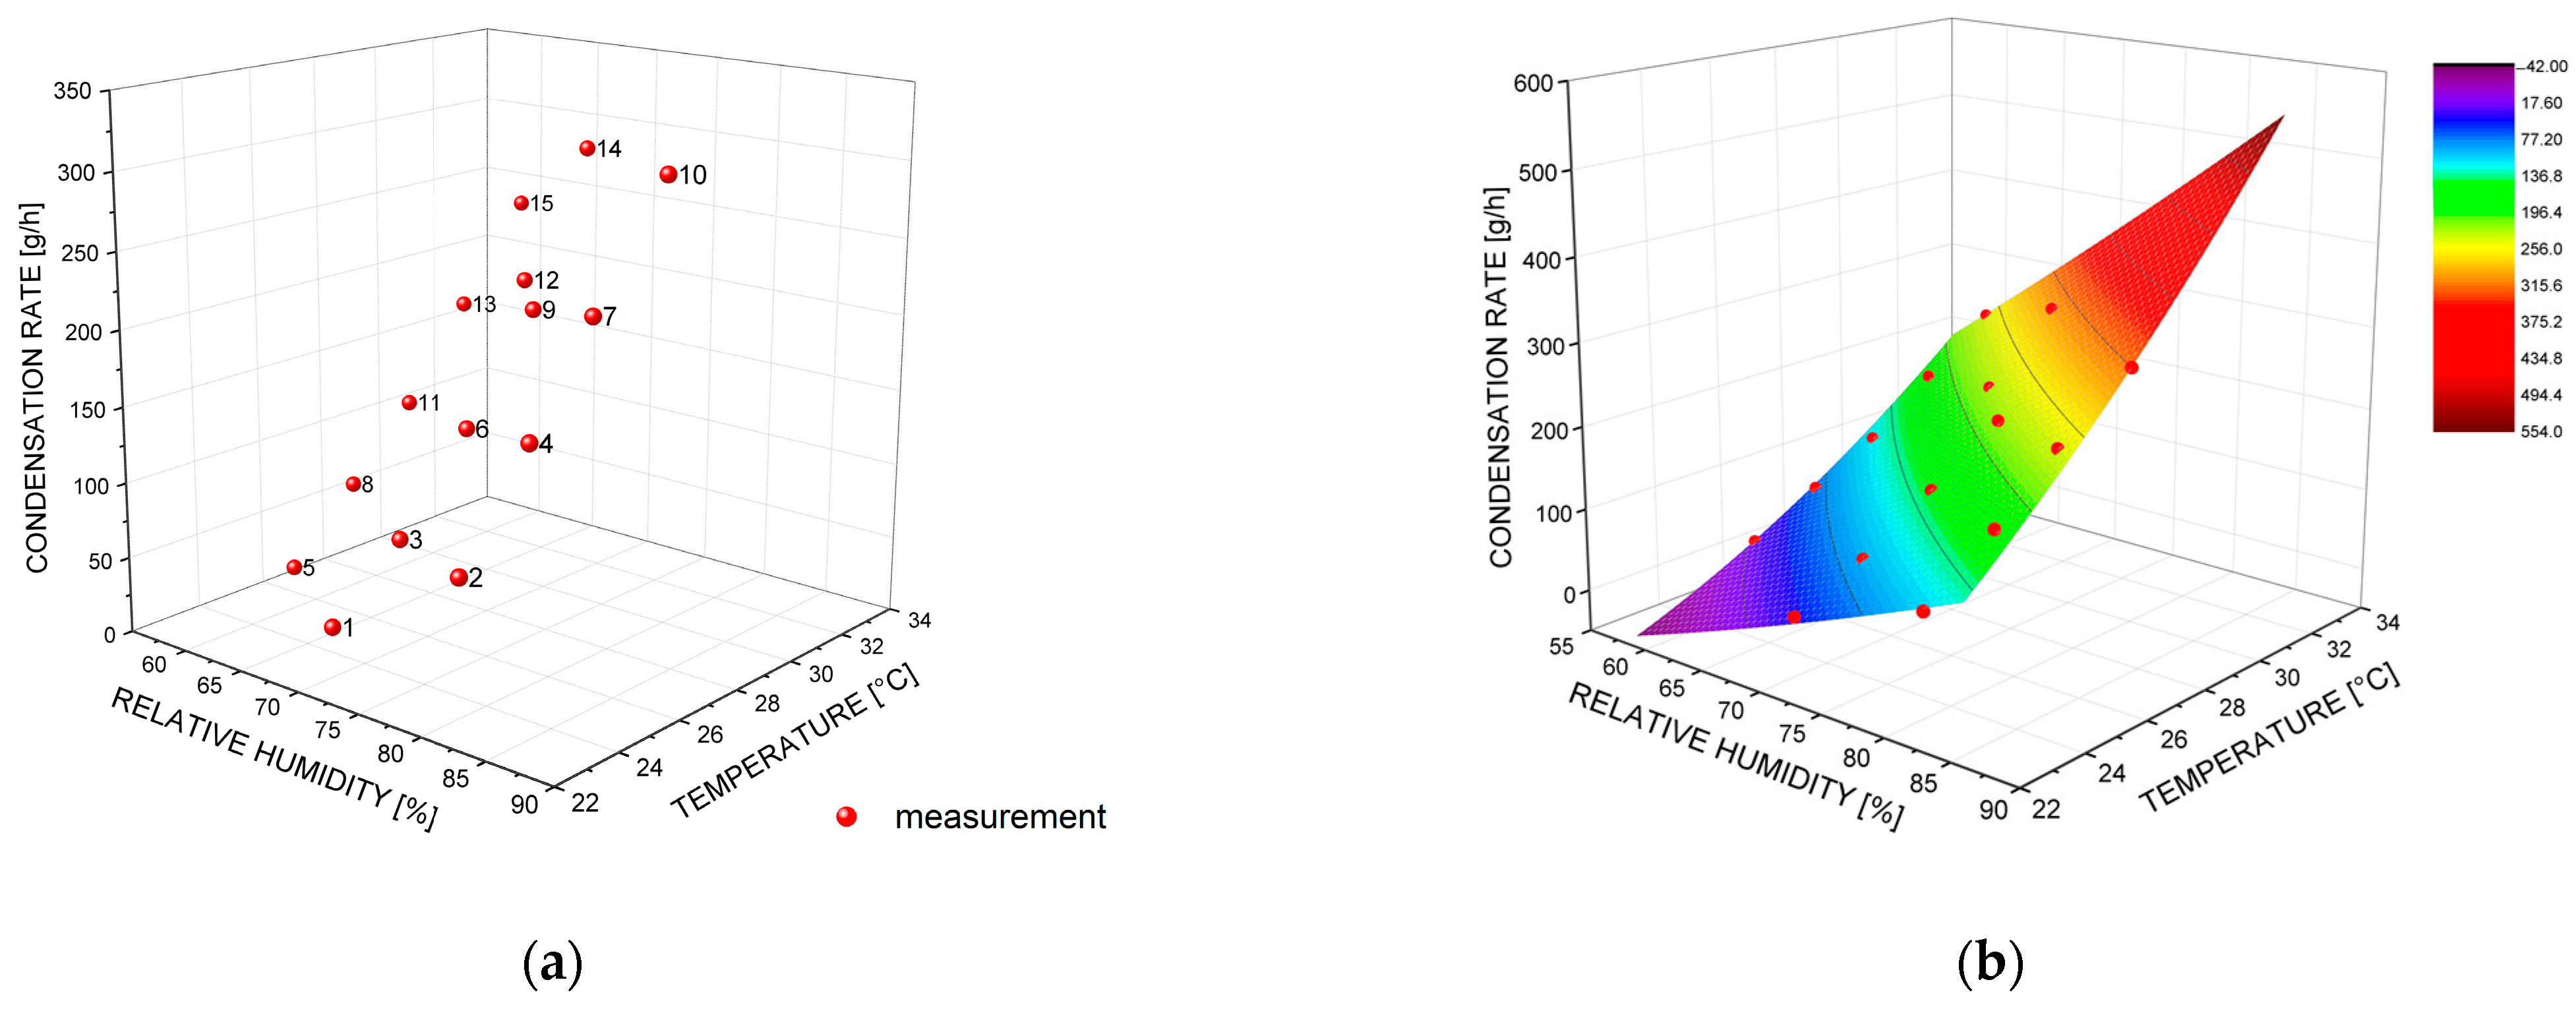
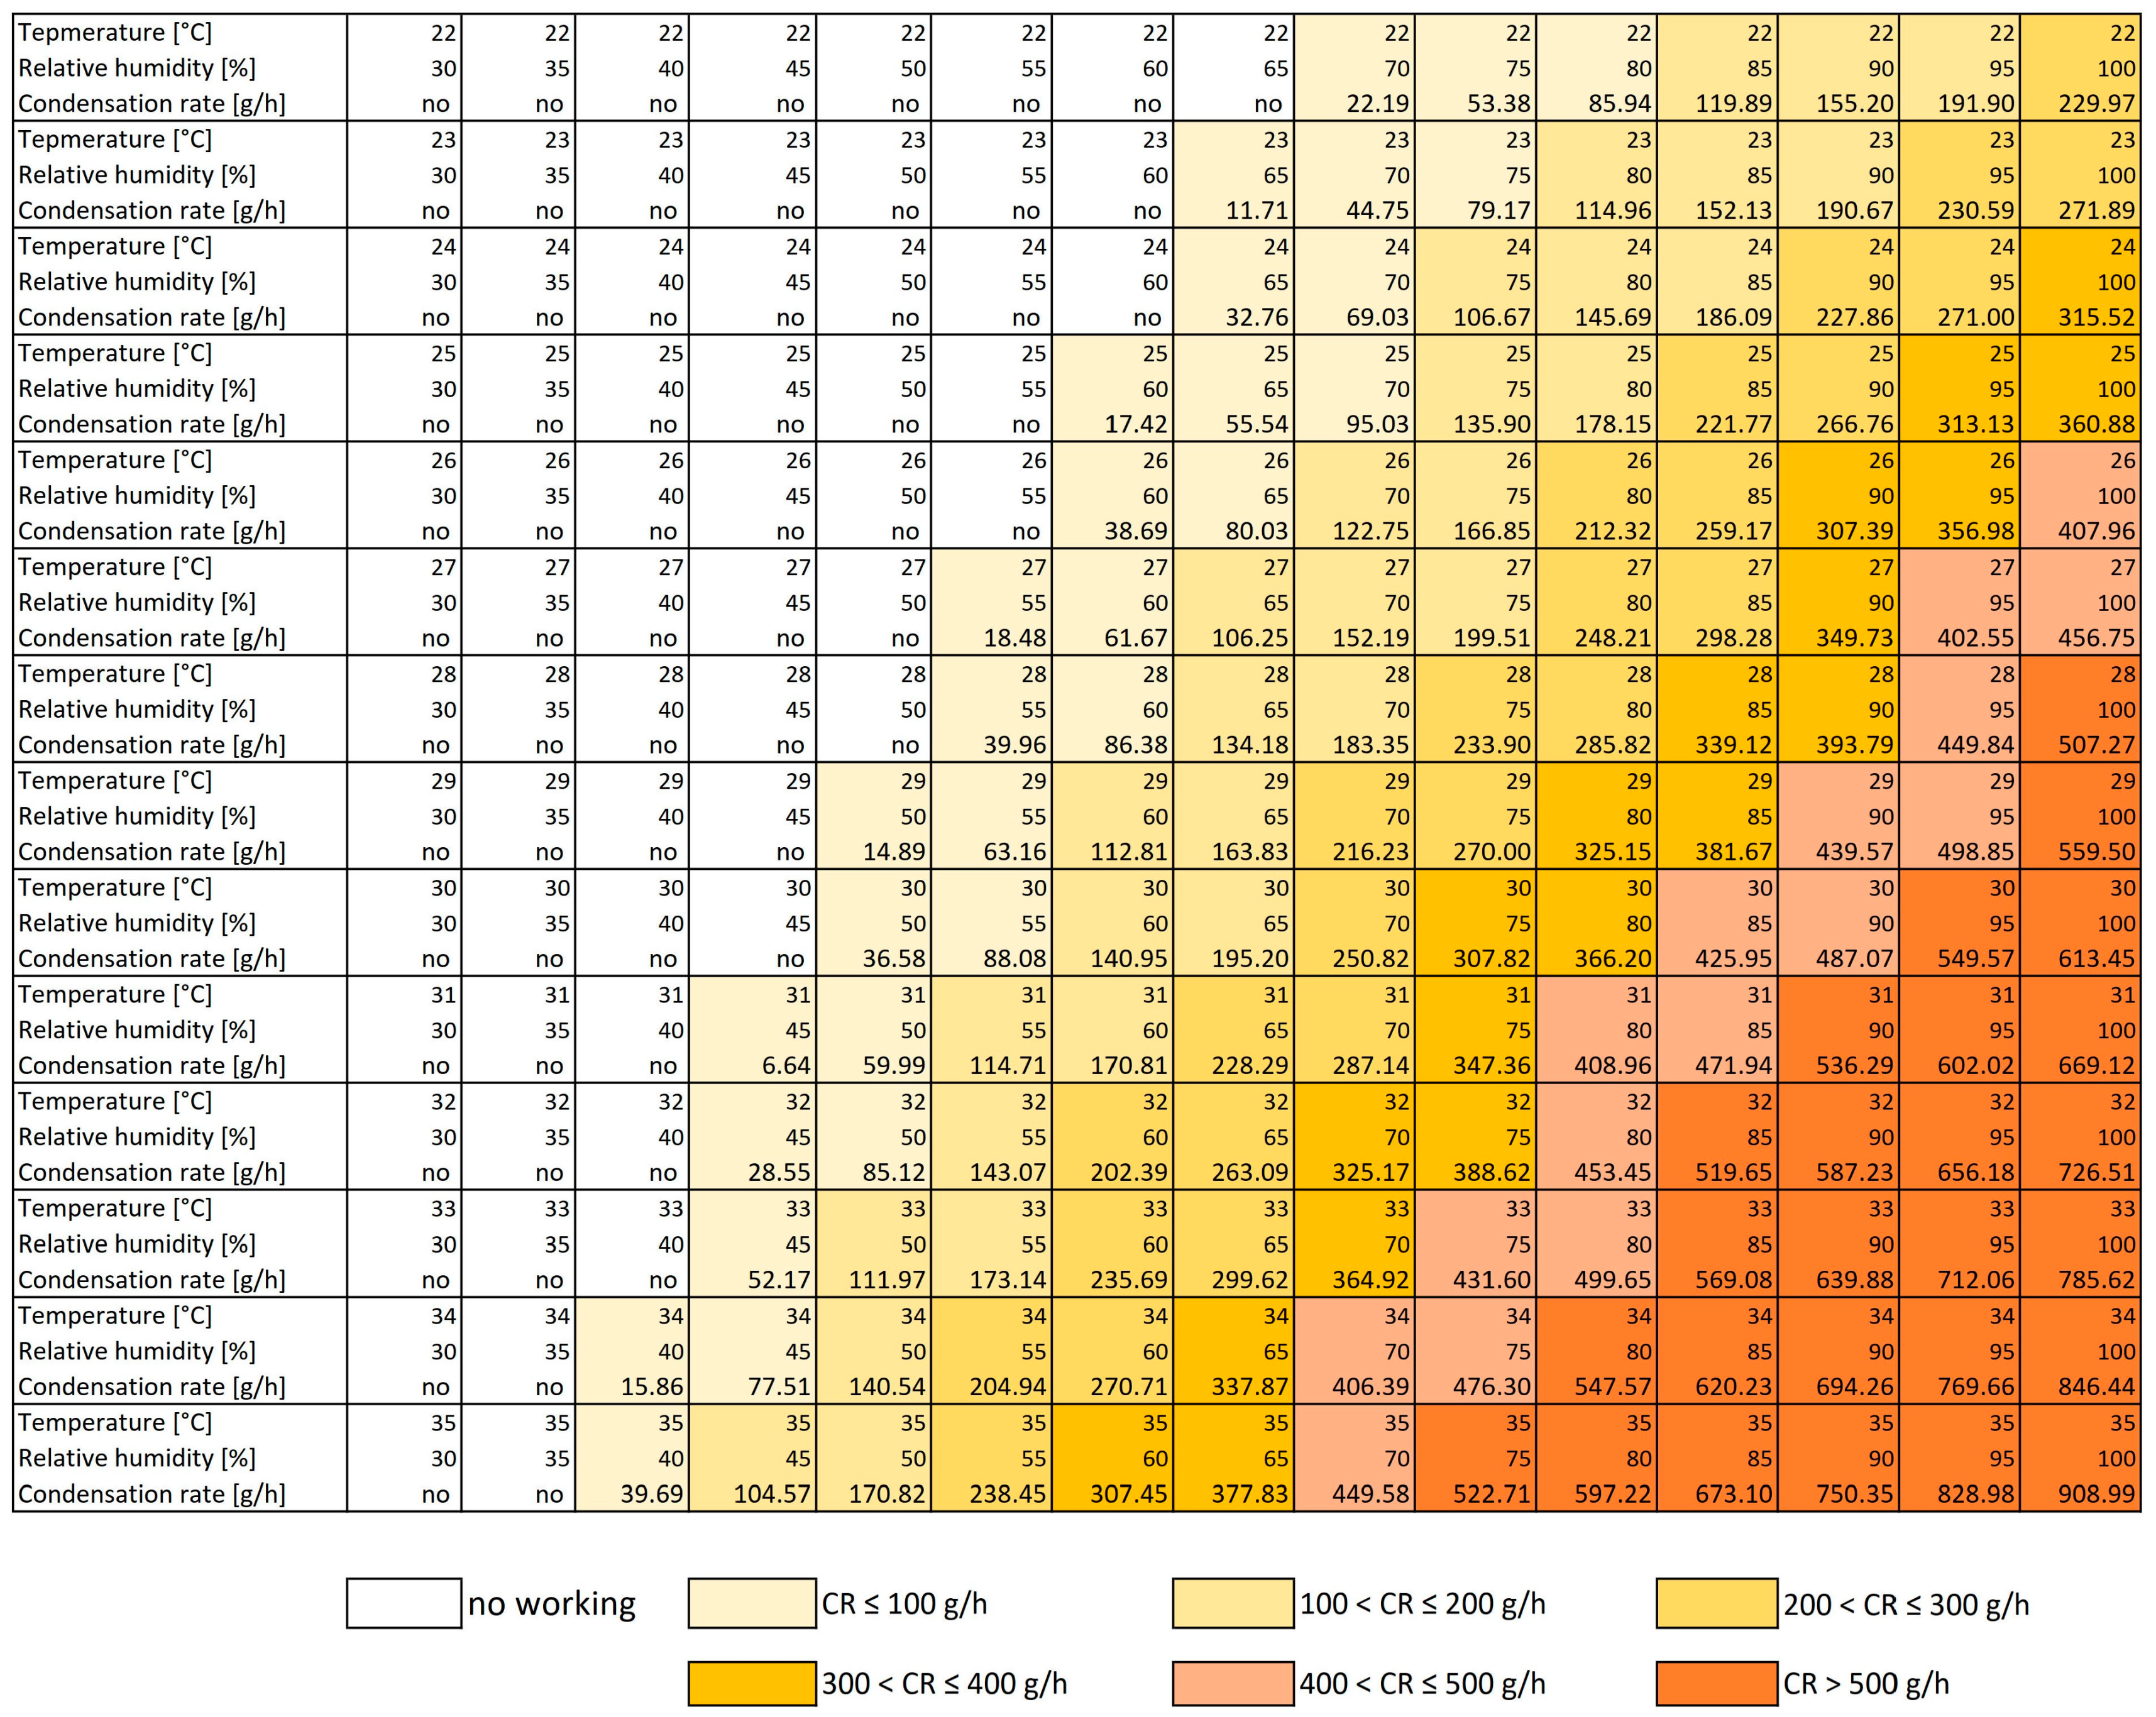
3.2. Analysis of Results Using Nonlinear Surface Fitting
4. Conclusions
- Testing in laboratory conditions in the climate chamber allowed the definition of water walls with controlled water temperature as a device with a certain level of performance. The measurement of increments of condensate using the laboratory scale ensured the accurate definition of changes in time.
- The results showed that dehumidification capacity is a dynamic process that strongly depends on the boundary conditions of the air.
- The water wall dehumidification capacity varied in the range of 21.99–315.36 g/h for the tested measurements. This represents a difference between the lowest and highest performance of 293.37 g/h.
- Equation (3) determined by nonlinear surface fitting shows a higher coefficient of determination (R2 = 0.99865) and a lower average percentage of deviation between measured and calculated values (2.33%) compared to Equation (2) generated by linear dependence (R2 = 0.9589; average percentage of deviation = 14.24%).
- The achieved results expand our knowledge regarding the use of water elements to adjust the parameters of indoor air and their ability to connect with convectional air treatment systems with the aim to reduce energy consumption.
Author Contributions
Funding
Institutional Review Board Statement
Informed Consent Statement
Data Availability Statement
Acknowledgments
Conflicts of Interest
References
- Wu, T.; Lei, C. A review of research and development on water wall for building applications. Energy Build. 2016, 112, 198–208. [Google Scholar] [CrossRef]
- Wu, T.; Lei, C. Thermal modelling and experimental validation of a semi-transparent water wall system for Sydney climate. Sol. Energy 2016, 136, 533–546. [Google Scholar] [CrossRef]
- Santamaria, M.B.; Gonzalo, F.A.; Pinette, D.; Lauret Aguirregabiria, B.; Hernandez Ramos, J.A. Industrialization and Thermal Performance of a New Unitized Water Flow Glazing Façade. Sustainability 2020, 12, 7564. [Google Scholar] [CrossRef]
- Wang, Y.; Liew, J.Y.R.; Lee, S.C. A novel multi-functional water façade system for energy saving and blast resisting. Mater. Des. 2016, 106, 98–111. [Google Scholar] [CrossRef]
- Rathnayake, U.; Lau, D.; Chow, C.L. Review on Energy and Fire Performance of Water Wall Systems as a Green Building Façade. Sustainability 2020, 12, 8713. [Google Scholar] [CrossRef]
- Wilson, E.O. Biophilia: The Human Bond with Other Species; Harvard University Press: Cambridge, UK, 1984. [Google Scholar]
- Kellert, S.R.; Heerwagen, J.; Mador, M. Biophilic Design: The Theory, Science and Practice of Bringing Buildings to Life; John Wiley & Sons: Hoboken, NJ, USA, 2011. [Google Scholar]
- Browning, W.; Ryan, C.; Clancy, J. 14 Patterns of Biophilic Design; Terrapin Bright Green, LLC: New York, NY, USA, 2014; Available online: http://www.terrapinbrightgreen.com/wp-content/uploads/2014/09/14-Patterns-of-Biophilic-Design-Terrapin-2014p.pdf (accessed on 19 April 2021).
- Charoenkit, S.; Yiemwattana, S. Living walls and their contribution to improved thermal comfort and carbon emission reduction: A review. Build. Environ. 2016, 105, 82–94. [Google Scholar] [CrossRef]
- Wang, C.; Er, S.-S.; Abdul-Rahman, H. Indoor vertical greenery system in urban tropics. Indoor Built Environ. 2016, 25, 340–356. [Google Scholar] [CrossRef]
- Franco, A.; Fernández-Cañero, R.; Pérez-Urrestarazu, L.; Valera, D.L. Wind tunnel analysis of artificial substrates used in active living walls for indoor environment conditioning in Mediterranean buildings. Build. Environ. 2012, 51, 370–378. [Google Scholar] [CrossRef]
- Gunawardena, K.; Steemers, K. Living walls in indoor environments. Build. Environ. 2019, 148, 478–487. [Google Scholar] [CrossRef]
- Moya, A.T.; van den Dobbelsteen, A.; Ottele, M.; Bluyssen, M.P. A review of green systems within the indoor environment. Indoor Built Environ. 2019, 28, 298–309. [Google Scholar] [CrossRef]
- Pérez-Urrestarazu, L.; Fernández-Cañero, R.; Franco, A.; Egea, G. Influence of an active living wall on indoor temperature and humidity conditions. Ecol. Eng. 2016, 90, 120–124. [Google Scholar] [CrossRef]
- Tudiwer, D.; Korjenic, A. The effect of an indoor living wall system on humidity, mould spores and CO2-concentration. Energy Build. 2017, 1461, 73–86. [Google Scholar] [CrossRef]
- Poórová, Z.; Turcovská, A.; Kapalo, P.; Vranayová, Z. The Effect of Green Walls on Humidity, Air Temperature, Co2 and Well-Being of People. Environ. Sci. Proc. 2020, 2, 2056. [Google Scholar] [CrossRef]
- Horr, A.Y.; Arif, M.; Kaushik, A.; Mazroei, A.; Katafygiotou, M.; Elsarrag, E. Occupant productivity and office indoor environment quality: A review of the literature. Build. Environ. 2016, 105, 369–389. [Google Scholar] [CrossRef]
- Lin, F.G. Human Responses to Water Elements in Interior Environments: A Culture and Gender Comparison. The Handbook of Interior Design: Chapter; John Wiley & Sons, Ltd.: Hoboken, NJ, USA, 2015; pp. 293–309. [Google Scholar] [CrossRef]
- Alvarsson, J.J.; Wien, S.; Nilsson, M.E. Stress recovery during exposure to nature sound and environmental noise. Int. J. Environ. Res. Public Health 2010, 7, 1036–1046. [Google Scholar] [CrossRef]
- Yang, W.; Moon, J.H.; Kim, M.-J. Perceptual assessment of indoor water sounds over environmental noise through windows. Appl. Acoust. 2018, 135, 60–69. [Google Scholar] [CrossRef]
- Chen, W.; Liu, S.; Lin, J. Analysis on the passive evaporative cooling wall constructed of porous ceramic pipes with water sucking ability. Energy Build. 2015, 86, 541–549. [Google Scholar] [CrossRef]
- Moustafa, M.A.; Aripin, S. CFD evaluation of the pottery water wall in a hot arid climate of Luxor, Egypt. J. Green Build. 2014, 9, 175–189. [Google Scholar] [CrossRef]
- Tewari, P.; Mathur, S.; Mathur, J. Thermal performance prediction of office buildings using direct evaporative cooling systems in the composite climate of India. Build. Environ. 2019, 157, 64–78. [Google Scholar] [CrossRef]
- Moosavi, L.; Mahyuddin, N.; Ghafar, N. Atrium cooling performance in a low energy office building in the Tropics, a field study. Build. Environ. 2015, 94, 384–394. [Google Scholar] [CrossRef]
- Yin, Y.L.; Wang, R.Z.; Zhai, X.Q.; Ishugah, T.F. Experimental investigation on the heat transfer performance and water condensation phenomenon of radiant cooling panels. Build. Environ. 2014, 71, 15–23. [Google Scholar] [CrossRef]
- Le Dréau, J.; Heiselberg, P. Sensitivity analysis of the thermal performance of radiant and convective terminals for cooling buildings. Energy Build. 2014, 82, 482–491. [Google Scholar] [CrossRef]
- Haupt, T.E.; Heffernan, T.R.; Kazmierczak, J.J.; Nehls-Lowe, H.; Rheineck, B.; Powell, C.; Leonhardt, K.K.; Chitnis, S.A.; Davis, P.J. An Outbreak of Legionnaires Disease Associated with a Decorative Water Wall Fountain in a Hospital. Infect. Control Hosp. Epidemiol. 2012, 33, 185–191. [Google Scholar] [CrossRef] [PubMed]
- Mitterer, C. Cooling and Dehumidifying Indoor Environments Using the Chilled Water Wall; IBP-FRAUNHOFER: Valley, Germany; Available online: https://www.ibp.fraunhofer.de/content/dam/ibp/en/documents/Information-material/Departments/Hygrothermics/Produktblaetter/IBP_255_PB_Klimabrunnen_neu_en_rz_web.pdf (accessed on 19 April 2021).
- Fang, Y.-M.; Lee, J.M.C.; Mitterer, C.; Kunzel, M.H. The performance of heat pump integrated with chilled water wall for air conditioning and domestic hot water. IOP Conf. Ser. Earth Environ. Sci. 2019, 294, 012032. [Google Scholar] [CrossRef]
- Oliveira, R.; Figueiredo, A.; Vicente, R.; Almeida, M.S.F.R. Impact of unoccupied flats on the thermal discomfort and energy demand: Case of a multi-residential building. Energy Build. 2020, 209, 109704. [Google Scholar] [CrossRef]
- Juras, P.; Durica, P.; Jandacka, J. Parametric Study: Impact of Selected Factors on the Energy Demand of a Family House. Iop Conf. Ser. Earth Environ. Sci. 2019, 290, 012096. [Google Scholar] [CrossRef]
- Dolnikova, E.; Katunsky, D.; Vertal, M.; Zozulak, M. Influence of Roof Windows Area Changes on the Classroom Indoor Climate in the Attic Space: A Case Study. Sustainability 2020, 12, 5046. [Google Scholar] [CrossRef]
- Qi, R.; Dong, C.; Zhang, L.-Z. A review of liquid desiccant air dehumidification: From system to material manipulations. Energy Build. 2020, 215, 109897. [Google Scholar] [CrossRef]
- Cellura, M.; Guarino, F.; Longo, S.; Tumminia, G. Climate change and the building sector: Modelling and energy implications to an office building in southern Europe. Energy Sustain. Dev. 2018, 45, 46–65. [Google Scholar] [CrossRef]
- Isaac, M.; van Vuuren, P.D. Modeling global residential sector energy demand for heating and air conditioning in the context of climate change. Energy Policy 2009, 37, 507–521. [Google Scholar] [CrossRef]
- Vertaľ, M.; Zozulák, M.; Vašková, A.; Korjenic, A. Hygrothermal initial condition for simulation process of green building construction. Energy Build. 2018, 167, 166–176. [Google Scholar] [CrossRef]
- Sosnowski, P.; Petronio, A.; Armenio, V. Numerical model for thin liquid film with evaporation and condensation on solid surfaces in systems with conjugated heat transfer. Int. J. Heat Mass Transf. 2013, 66, 382–395. [Google Scholar] [CrossRef]
- Kim, H.; Chen, L.; Lee, J. Characteristics of vertically falling liquid film affected by cross gas flow in a narrow flat channel. Nucl. Eng. Des. 2020, 357, 110393. [Google Scholar] [CrossRef]
- Åkesjö, A.; Gourdon, M.; Vamling, L.; Innings, F.; Sasic, S. Experimental and numerical study of heat transfer in a large-scale vertical falling film pilot unit. Int. J. Heat Mass Transf. 2018, 125, 53–65. [Google Scholar] [CrossRef]
- Lu, C.; Jiang, S.-Y.; Duan, R.-Q. Wave Characteristics of Falling Film on Inclination Plate at Moderate Reynolds Number. Sci. Technol. Nucl. Install. 2016, 2016, 1–7. [Google Scholar] [CrossRef]
- Bird, B.R.; Stewart, E.W.; Lightfoot, N.E. Transport Phenomena, 2nd ed.; John Wiley and Sons: New York, NY, USA, 2007. [Google Scholar]
- Zhou, D.W.; Gambaryan-Roisman, T.; Stephan, P. Measurement of water falling film thickness to flat plate using confocal chromatic sensoring technique. Exp. Therm. Fluid Sci. 2009, 33, 273–283. [Google Scholar] [CrossRef]
- Nasr, A.; Al-Ghamdi, S.A. Numerical study of evaporation of falling liquid film on one of two vertical plates covered with a thin porous layer by free convection. Int. J. Therm. Sci. 2017, 112, 335–344. [Google Scholar] [CrossRef]
- Gonda, A.; Lancereau, P.; Bandelier, P.; Luo, L.; Fan, Y.; Benezech, S. Water falling film evaporation on a corrugated plate. Int. J. Therm. Sci. 2014, 81, 29–37. [Google Scholar] [CrossRef]
- Čákyová, K.; Vranay, F. Utility Model Number 8710: Water Wall Collection Container with Overflow Edge (Zberná Nádoba Vodnej Steny s Prepadovou Hranou); Industrial Property Office of the Slovak Republic: Banská Bystrica, Slovak, 2019. Available online: https://wbr.indprop.gov.sk/WebRegistre/UzitkovyVzor/Detail/50129-2017 (accessed on 19 April 2021).
- Han, J.; Guo, H. Development of a method for condensation rate measurement on flat surfaces. Inf. Process. Agric. 2018, 5, 490–497. [Google Scholar] [CrossRef]
- Čákyová, K.; Vranay, F.; Kušnír, M. Impact of flow rate to water film thickness of water wall. In Advances and Trends in Engieneering Sciences and Technologies III; CRC Press: London, UK, 2019; pp. 337–342. [Google Scholar] [CrossRef]
- ASHRAE. Thermal comfort. In Ashrae Handbook Fundamentals; American Society of Heating, Refrigerating and Air-Conditioning Engineering, Inc.: Atlanta, GA, USA, 2001. [Google Scholar]
- Jianbo, C.; Xue, X.; Minglu, Q.; Xing, H.; Youli, K. Experimental analysis on dehumidification performance of an indoor passive falling film liquid desiccant moisture receptacle. Energy Build. 2016, 125, 161–170. [Google Scholar] [CrossRef]
- Ge, F.; Wang, C. Exergy analysis of dehumidification systems: A comparison between the condensing dehumidification and the desiccant wheel dehumidification. Energy Convers. Manag. 2020, 224, 113343. [Google Scholar] [CrossRef]


| Parameter | Device | Range | Deviation | |
|---|---|---|---|---|
| Water | temperature | NTC sensor FN 0001 K | 0 to 70 °C | ±0.2 K |
| Air | humidity | FHAD 46-C0 | 10 to 90% RH | ±2.0% RH at nominal temperature (+23 °C) |
| temperature | 5 to 60 °C | typical ±0.2 K (maximum ±0.4 K) | ||
| Measurement | |||||||||||||||
|---|---|---|---|---|---|---|---|---|---|---|---|---|---|---|---|
| 1 | 2 | 3 | 4 | 5 | 6 | 7 | 8 | 9 | 10 | 11 | 12 | 13 | 14 | 15 | |
| Temperature (°C) | 22.2 ± 0.1 | 22.1 ± 0.1 | 24.0 ± 0.1 | 23.8 ± 0.1 | 25.7 ± 0.1 | 25.8 ± 0.1 | 25.7 ± 0.2 | 27.5 ± 0.1 | 27.2 ± 0.1 | 27.3 ± 0.2 | 28.9 ± 0.2 | 28.9 ± 0.1 | 30.7 ± 0.1 | 30.8 ± 0.1 | 32.5 ± 0.1 |
| Max Temperature (°C) | 22.4 | 22.4 | 24.2 | 24.0 | 26.0 | 26.0 | 26.1 | 27.7 | 27.5 | 27.7 | 29.3 | 29.3 | 31.0 | 31.1 | 32.8 |
| Min Temperature (°C) | 21.9 | 22.0 | 23.9 | 23.6 | 24.6 | 25.6 | 25.3 | 27.2 | 26.9 | 26.7 | 28.5 | 28.6 | 30.5 | 30.4 | 32.0 |
| Relative humidity (%) | 72.3 ± 1.4 | 82.7 ± 1.0 | 73.1 ± 1.4 | 83.7 ± 1.0 | 58.9 ± 1.4 | 74.0 ± 1.2 | 83.8 ± 1.3 | 59.5 ± 1.4 | 75.7 ± 1.0 | 85.6 ± 0.6 | 60.8 ± 0.9 | 70.9 ± 0.9 | 61.1 ± 1.0 | 71.6 ± 0.9 | 61.9 ± 0.9 |
| Max Relative humidity (%) | 75.1 | 84.5 | 75.5 | 85.5 | 62.7 | 76.2 | 86.3 | 62.1 | 78.0 | 87.1 | 62.5 | 72.7 | 63.0 | 73.5 | 64.5 |
| Min Relative humidity (%) | 70.2 | 80.2 | 71.0 | 81.3 | 56.8 | 72.4 | 81.5 | 57.3 | 73.6 | 84.1 | 59.2 | 69.4 | 59.6 | 69.9 | 60.4 |
| Dew point temperature (°C) | 17.02 | 19.04 | 18.88 | 20.89 | 17.07 | 20.78 | 22.78 | 18.86 | 22.56 | 24.65 | 20.56 | 23.1 | 22.36 | 25.04 | 24.23 |
| Water temperature_upper (°C) | 13.6 ± 0.02 | 14.0 ± 0.01 | 13.7 ± 0.02 | 14.0 ± 0.02 | 13.9 ± 0.02 | 13.9 ± 0.05 | 14.0 ± 0.02 | 13.8 ± 0.02 | 14.2 ± 0.01 | 14.3 ± 0.01 | 14.1 ± 0.01 | 14.2 ± 0.03 | 14.2 ± 0.01 | 14.3 ± 0.01 | 14.3 ± 0.01 |
| Water temperature_down (°C) | 14.1 ± 0.03 | 14.4 ± 0.01 | 14.4 ± 0.06 | 14.6 ± 0.02 | 14.6 ± 0.03 | 14.6 ± 0.03 | 14.8 ± 0.02 | 14.4 ± 0.01 | 15.0 ± 0.02 | 15.2 ± 0.02 | 14.8 ± 0.02 | 15.1 ± 0.04 | 15.1 ± 0.02 | 15.4 ± 0.02 | 15.3 ± 0.02 |
| Duration of experiment (h) | 15.0 | 15.0 | 12.0 | 15.0 | 12.0 | 12.0 | 14.0 | 12.0 | 7.0 | 7.0 | 15.0 | 14.0 | 15.0 | 7.0 | 7.0 |
| Condensation rate (g/h) | 46.02 | 104.29 | 88.95 | 173.42 | 21.99 | 148.81 | 236.73 | 68.81 | 218.19 | 315.36 | 118.62 | 219.92 | 177.4 | 298.17 | 240.4 |
| Air Temperature (°C) | Relative Humidity (%) | Condensation Rate (g/h) | Increscent (-) | |
|---|---|---|---|---|
| First group of measurements | 25.7 | 58.9 | 21.99 | reference value |
| 74.0 | 148.81 | 6.8 times higher than reference value | ||
| 83.8 | 236.73 | 10.8 times higher than reference value | ||
| Second group of measurements | 27.3 | 59.5 | 68.81 | reference value |
| 75.7 | 218.19 | 3.2 times higher than reference value | ||
| 85.6 | 315.36 | 4.6 times higher than reference value |
| Measurement | |||||||||||||||
|---|---|---|---|---|---|---|---|---|---|---|---|---|---|---|---|
| 1 | 2 | 3 | 4 | 5 | 6 | 7 | 8 | 9 | 10 | 11 | 12 | 13 | 14 | 15 | |
| Temperature (°C) | 22.2 | 22.1 | 24.0 | 23.8 | 25.7 | 25.8 | 25.73 | 27.5 | 27.2 | 27.3 | 28.9 | 28.9 | 30.7 | 30.8 | 32.5 |
| Relative humidity (%) | 72.3 | 82.7 | 73.1 | 83.7 | 58.9 | 74.0 | 83.8 | 59.5 | 75.7 | 85.6 | 60.8 | 70.9 | 61.1 | 71.6 | 61.9 |
| Humidity ratio (g/kg) | 12.45 | 14.18 | 14.03 | 15.94 | 12.49 | 15.83 | 17.94 | 14.02 | 17.7 | 20.15 | 15.61 | 18.31 | 17.48 | 20.64 | 19.63 |
| Measurement: CR (g/h) | 46.02 | 104.29 | 88.95 | 173.42 | 21.99 | 148.81 | 236.73 | 68.81 | 218.19 | 315.36 | 118.62 | 219.92 | 177.4 | 298.17 | 240.4 |
| Equation: CR (g/h) | 33.99 | 91.04 | 86.10 | 149.09 | 35.31 | 145.47 | 215.06 | 85.77 | 207.14 | 287.95 | 138.21 | 227.26 | 199.89 | 304.11 | 270.80 |
| Absolute difference | 12.04 | 13.25 | 2.85 | 24.33 | 13.32 | 3.34 | 21.67 | 16.96 | 11.05 | 27.41 | 19.59 | 7.34 | 22.49 | 5.94 | 30.40 |
| Percent deviation (%) | 26.16 | 12.70 | 3.20 | 14.03 | 60.55 | 2.25 | 9.16 | 24.65 | 5.06 | 8.69 | 16.51 | 3.34 | 12.67 | 1.99 | 12.64 |
| Measurement | |||||||||||||||
|---|---|---|---|---|---|---|---|---|---|---|---|---|---|---|---|
| 1 | 2 | 3 | 4 | 5 | 6 | 7 | 8 | 9 | 10 | 11 | 12 | 13 | 14 | 15 | |
| Temperature (°C) | 22.2 | 22.1 | 24.0 | 23.8 | 25.7 | 25.8 | 25.7 | 27.6 | 27.2 | 27.3 | 28.9 | 28.9 | 30.7 | 30.8 | 32.5 |
| Relative humidity (%) | 72.3 | 82.7 | 73.1 | 83.7 | 58.9 | 74.0 | 83.8 | 59.5 | 75.7 | 85.6 | 60.8 | 70.9 | 61.1 | 71.6 | 61.9 |
| Measurement: CR (g/h) | 46.02 | 104.29 | 88.95 | 173.42 | 21.99 | 148.81 | 236.73 | 68.81 | 218.19 | 315.36 | 118.62 | 219.92 | 177.40 | 298.17 | 240.40 |
| Equation: CR (g/h) | 42.07 | 107.88 | 92.19 | 169.27 | 23.52 | 150.71 | 237.63 | 68.35 | 214.15 | 315.90 | 118.08 | 222.98 | 174.84 | 297.67 | 241.88 |
| Absolute difference | 3.95 | 3.59 | 3.24 | 4.15 | 1.53 | 1.90 | 0.90 | 0.45 | 4.04 | 0.54 | 0.54 | 3.06 | 2.56 | 0.50 | 1.48 |
| Percent deviation (%) | 8.58 | 3.44 | 3.64 | 2.39 | 6.97 | 1.27 | 0.38 | 0.66 | 1.85 | 0.17 | 0.46 | 1.39 | 1.44 | 0.17 | 0.62 |
Publisher’s Note: MDPI stays neutral with regard to jurisdictional claims in published maps and institutional affiliations. |
© 2021 by the authors. Licensee MDPI, Basel, Switzerland. This article is an open access article distributed under the terms and conditions of the Creative Commons Attribution (CC BY) license (https://creativecommons.org/licenses/by/4.0/).
Share and Cite
Cakyova, K.; Vranay, F.; Vertal, M.; Vranayova, Z. Determination of Dehumidification Capacity of Water Wall with Controlled Water Temperature: Experimental Verification under Laboratory Conditions. Sustainability 2021, 13, 5684. https://doi.org/10.3390/su13105684
Cakyova K, Vranay F, Vertal M, Vranayova Z. Determination of Dehumidification Capacity of Water Wall with Controlled Water Temperature: Experimental Verification under Laboratory Conditions. Sustainability. 2021; 13(10):5684. https://doi.org/10.3390/su13105684
Chicago/Turabian StyleCakyova, Katarina, Frantisek Vranay, Marian Vertal, and Zuzana Vranayova. 2021. "Determination of Dehumidification Capacity of Water Wall with Controlled Water Temperature: Experimental Verification under Laboratory Conditions" Sustainability 13, no. 10: 5684. https://doi.org/10.3390/su13105684
APA StyleCakyova, K., Vranay, F., Vertal, M., & Vranayova, Z. (2021). Determination of Dehumidification Capacity of Water Wall with Controlled Water Temperature: Experimental Verification under Laboratory Conditions. Sustainability, 13(10), 5684. https://doi.org/10.3390/su13105684