1. Introduction
In the recent era of worsening unethical capitalism and increasing uncertainty, the importance of corporate social responsibility (CSR) has been emphasized [
1,
2]. CSR is closely related to long-term sustainability of firms, which is generally measured by firm values or long-term market returns [
2]. For Singaporean firms, Loh et al. [
3] report that sustainability is positively related to a firm’s market value. Firms can lower their financial risk or enhance their sustainability, by increasing their market values with a competitive brand strategy strengthened through CSR activities. Likewise, CSR has a positive function in improving the reputation and brand image, thereby leading to better financial performance [
3].
Many firms have recognized that engaging in CSR activities is crucial to achieve a sustainable market performance and growth [
1,
2]. It should be noted that firms’ efforts to survive and prosper for a long time in a non–friendly environment are reflected in their market value [
2]. Thus, it is more or less rational to expect that CSR will have a positive effect on firm value in the long run by satisfying a variety of stakeholders, such as employees, customers, lenders, governments, etc. or by reducing asymmetric information between firms and stakeholders [
3]. Nevertheless, the results of empirical studies are not consistent with such expectations [
2,
4].
Firms’ efforts to improve the external environment positively for long-term sustainability may not be optimal although their benefits may dominate corresponding costs [
1,
2,
5]. Furthermore, the positive investors’ responses are not guaranteed in the environment with information asymmetry between insiders and outsiders [
1,
2,
6].
In Korea, the Korea Corporate Governance Service (KCGS) evaluates firms’ environmental, social and governance (ESG) efforts each year. Moreover, the Korea Exchange (KRX) develops the environmentally responsible investment index, called SRI–Eco, and singles out good firms. Apart from these institutional attentions, however, the relationship between ESG and firm value is academically unclear. As environmental management does not always produce positive outcomes, firms have difficulty determining the suitable level of participation in this management. Furthermore, there is a possibility of aggravating information asymmetry or conflicts of interest between firms or stakeholders [
1,
7].
ESG, however, a more expansive and formally measured concept than CSR in Korea, can provide a manager with incentives to enjoy private benefits, such as personal reputation, and thus lead to overinvestment [
7,
8]. Bird, Hall, Monente and Reggiani [
9] report that firms with low book-to-market ratios or low price–earnings ratios in the previous fiscal year are not able to actively participate in ESG, which suggests that the current level of ESG activities may be based on their past financial performances or liquidity levels. ESG activities also distort market participants’ information on firms.
Unlike developed countries such as US and UK, the agency problems between controlling shareholders and minority shareholders are more severe in Korea with a relatively weak corporate governance system for minority shareholders [
6]. In this regard, investigating the impact of ESG activities on long-term sustainability of firms based on investors’ responses could have relevant implications in the research area, since it is desirable for firms to improve their business environment by making efforts to obtain positive ESG rating and thus such responses from the stock market or other capital markets. According to McWilliams and Siegel [
10], ESG activities appear to promote interests of outside stakeholders even when they are required by law.
In line with the emergence of ESG activities for sustainable development for firms’ survival, the 2006 Principles of Responsible Investment established the concept of investment principles incorporating even some nonfinancial factors that include ESG-related activities. The amount of investments in ESG announced by the Global Sustainable Investment Alliance (GSIA) was US $33.7 trillion in 2017, an increase from US $22.9 trillion in 2016 and US $18.3 trillion in 2014.
This study uses ESG ratings from KCGS. The ESG ratings, developed to consider three factors in investment decision-making from the UN principle for Responsible Investment, have been assigned to the KOSPI-listed firms. The institution quantitatively assesses firms’ ESG activities that might lead to sustainable growth in the long-term from a sustainable management perspective. We specifically investigate the effects of the level and changes in environmental, social and governance (ESG) ratings, developed to represent a firm’s long-term sustainability, on the stock market returns of KOSPI–listed firms in Korea over the period 2011–2018. Among previous studies on ESG ratings, there is no study that connects short-term and long-term abnormal returns. Second, this study uses risk-adjusted market returns using CAPM (Capital Asset Pricing Model), the three-factor model of Fama and French, and the four-factor model of Carhart, rather than Tobin Q to measure investor responses used in prior studies like Kim et al. [
2]. Third, this study, by investigating the association between each element of ESG evaluations and abnormal returns, diagnoses the investors’ responses to the ESG ratings using long-term abnormal returns for each one-year period up to five years after the disclosure of ESG rating, applying event study methodology, whereas extant literature mostly focus on short-term effects. Finally, this study investigates the effects of changes in each index (E, S and G separately) of ESG ratings for new, upward and downward categories in addition to changes in overall ESG ratings. Thus, we examine how abnormal returns change over time in overall ratings and each category of ratings and different types of changes in such ratings. The remainder of this paper is organized as follows. In the subsequent sections, we study the extant literature and describe our hypotheses and corresponding empirical models used, followed by empirical results from
t tests for short-term abnormal returns and fixed effects panel regressions for long-term annual abnormal returns for five years. Finally, we conclude the paper.
3. Hypothesis
According to prior studies, ESG is positively linked to long-term growth and survival of firms. Hence, the government, agencies and firms are actively building and pursuing CSR activities. Many researchers analyze the impact of mandatorily provided ESG information on firm values. In particular, Mervelskemper and Streit [
41], Miralles-Quirós et al. [
26], Miralles-Quirós et al. [
27], Kim et al. [
2] adopt and evaluate the valuation model proposed by Ohlson [
43], and researchers [
2,
27,
28] analyze their effect on Tobin Q, the most common measure of firm values.
Most studies suggest that negative responses to CSR activities on firm values can lead to negative excess returns, and vice versa. Lins, Servaes and Tamayo [
44] argue that CSR activities serve as a means of insurance to prevent a decline in firm value during the global financial crisis period. Buchanan et al. [
45] proclaim the conflict resolution hypothesis to be more critical during the crisis, in which CSR activities are separated from the overinvestment hypothesis. They test their hypothesis based on the effects of CSR activities on stock returns.
Similarly, this study examines whether statistical differences exist in abnormal returns for firms with ESG ratings (hereafter, ESG firms) and those without ESG ratings (hereafter, non-ESG firms). Moreover, it investigates how the levels or changes of the ESG ratings affect their long-term excess returns. This study also investigates the short- and long-term effects of changes in ESG ratings, since CSR activities are used as long-term insurance contracts during a plausible crisis in the future [
44].
Although some studies [
11,
12,
28] do not argue or support positive impacts of CSR ratings on corporate value, most studies report the positive effects of CSR on firm values. We accept tentatively the positive role of CSR activities in the short-term and the long-term growth or sustainability of the firm, as demonstrated in the majority of empirical analyses [
25,
26,
27,
28,
41,
42], and establish the following hypotheses 1, 1–1, 2 and 2–1.
Hypothesis 1 (H1). ESG firms have higher short-term abnormal returns than non-ESG firms.
Hypothesis 1–1 (H1–1). ESG firms have higher long-term abnormal returns than non-ESG firms.
Hypothesis 2 (H2). The higher overall ESG ratings, the higher short-term abnormal returns.
Hypothesis 2–1(H2–1). The higher overall ESG ratings, the higher long-term abnormal returns.
Following prior studies like Kim et al. [
2], this study also analyzes the effects of ESG ratings separately in E, S and G, and additionally analyzes the effects of changes in overall ESG ratings and separately in each category of E, S and G. Without prior studies in this topic with respect to the changes in ESG rating, we establish 3, 3–1, 4, 4–1, 5 and 5–1 as follows.
Hypothesis 3 (H3). Firms with new ESG ratings have higher short-term abnormal returns than those without.
Hypothesis 3–1 (H3–1). Firms with new ESG ratings have higher long-term abnormal returns than those without.
Hypothesis 4 (H4). Firms with upward ESG ratings have higher short-term abnormal returns than others.
Hypothesis 4–1 (H4–1). Firms with upward ESG ratings have higher long-term abnormal returns than others.
Hypothesis 5 (H5). Firms with downward ESG ratings have lower short-term abnormal returns than others.
Hypothesis 5–1 (H5–1). Firms with downward ESG ratings have lower long-term abnormal returns than others.
4. Empirical Models and Variables
To examine the relationship between ESG activities and their long-term stock returns, our study uses ESG dummy variable (ESG_Firm_D) to distinguish ESG and non-ESG firms. We also used ESG_New, ESG_Up and ESG_Down variables to study the effects of changes in ESG ratings. The rate of abnormal returns (AR), the dependent variable, is measured using the risk–adjusted return of CAPM (CAPM) [
46,
47] or Sharpe–Lintner model, three–factor model of Fama and French (FF) [
48], and a four–factor model of Carhart (Carhart) [
49]. Specifically, Equation (1) estimates the monthly rate of return based on the CAPM or Sharpe–Lintner model, presented by Sharpe [
46] and Lintner [
47]. Each stock has its own market risk, and therefore, its yield is determined each period. Therefore, their market performance should be measured after controlling for their corresponding risks. In this study, the monthly yield on the securities market is used as a proxy for the market returns, and the 91 days of CD–floating rate available from the Bank of Korea’s economic statistics system is used as a risk–free rate. The abnormal returns are measured as follows (Equation (1)):
where
is the excess returns in month
t for firm
i, and
is the risk–free returns in month
t.
is the constant and
is the market beta for firm
i.
is the market excess returns in month
t.
Meanwhile, the CAPM [
46,
47] has the disadvantage of being too simple. Therefore, the firms estimate AR using the three-factor model of Fama and French [
48] that reflects the size and value factors. “Small minus big (SMB)”and “high minus low (HML)” are classified as S (small), M (medium) and B (big), and H (high), M (medium) and L (low) based on their relative standing (30%, 40% and 30%, respectively) in their sizes and value ratios measured as book values to their corresponding market values, or shortly called book to market ratios, respectively. Thus, six portfolios (SL for small and low, SM for small and medium, SH for small and high, SL for small and low, SM for small and medium, SH for small and high, BL for big and low, BM for big and medium, and BH for big and high) of these combined measures were used to measure SMB, the sensitivity of which is presented in Equation (2) as
Portfolio returns on scale factor (SMB)
Four portfolios (SH for small and high, BH for big and high, SL for small and low, and BL for big and low) of combined value measures are used to measure HML, the sensitivity of which is presented in Equation (2) as .
- 2.
Portfolio returns on book value factor (HML)
where
and
are scale factor market beta and value factor market beta, respectively, for firm
i. Finally, Equation (3) shows Carhart’s four-factor model [
49] that reflects firms’ scale factor, value factor, and momentum factor in the CAPM. Firms at the top 30% are classified as winners, and those at the bottom 30% are classified as losers.
- 3.
Portfolio returns on momentum factor (UMD)
The market model measures abnormal returns using regression coefficients estimated by the ordinary least squares (OLS) method and uses Equations (1)–(3) to calculate AR at a point in time for the corresponding period: day, month and year. Therefore, daily, monthly and yearly returns are calculated and used for short-term disclosure effects, long-term effects after disclosure over years, and annualized holding period returns to match yearly accounting data.
Subsequent monthly abnormal returns are measured on an annual basis as a dependent variable for regression analyses, divided into periods for different analytical purposes, and matched with the periodical accounting data. The definitions and measurements of the variables are shown in
Table 1.
The equation of the study model using the ESG dummy (ESG_Firm_D) as an explanatory variable for verifying hypothesis 1 is shown in Equation (4), which is an analysis of the effect of ESG firms on abnormal returns compared with non–ESG firms. Equations (5) and (6) are then used to test hypotheses 2 and 3. The higher the ESG ratings, the higher the abnormal returns, and the greater the impact of the new ESG ratings on AR can be reviewed.
Equations (7) and (8) are introduced to test whether the stock market responds to the new introduction of ESG (ESG_New) and to study how their changes (ESG_Up, ESG_Down) affect the abnormal returns.
5. Empirical Results
5.1. Data
This study uses ESG rating data of KCGS, which measures CSR activities quantitatively as a key means of long-term sustainability of the non-financial firms, together with KIS–Value accounting data and DataGuide stock price data. We exclude firms without financial data during the period 2011–2018. The total number of firm–year observations of sample firms satisfying the above criteria is 5024.
Table 2 shows the samples’ summary statistics. The mean of the dependent variable monthly AR is −0.37% and the median is −2.5%. The explanatory variable of ESG ratings assigns grade A+ (4 points), grade A (3 points), grade B+ (2 points), grade B (1 point) and no grade (0 point).
The mean for annual risk-free returns (Rf) is 2.24%, and that for monthly market returns (Rm) is 0.68%, and their medians are 1.91% and 1.55%, respectively. The means of the dividend yield (Div_Yld) and the stock price volatility (Volatility) are 0.86% and 10.52%, with medians of 0.49% and 9.29%, respectively. The largest shareholders’ ownership (Largest_Sh) is 3.02% with a median of 2.68%, whereas the mean of the foreign shareholders’ ownership (Fgn_Sh) is 11.73% with a median of 4.83%. The debt ratio (Debt_R), fixed ratio (Fixed_R), return on assets (ROA), and the size of a firm (Ln_Asset) do not show a significant difference in their means and medians.
5.2. Mean Differences
Table 3 shows the mean differences between ESG and non–ESG firms. Results reveal that no difference occurs in the abnormal returns measured by using CAPM (
ARCAPM) between ESG and non–ESG firms. Also, the dividend yield (Div_Yield) does not differ. However, ESG firms appear to have greater stock price volatility (Volatility), foreign shareholders’ ownership (Fgn_Sh), fixed ratio (Fixed_R), and firm size (Ln_Asset) compared with non–ESG firms. For almost all variables, the significance is at the 1% level, which means that there is a difference between ESG and non–ESG firms.
5.3. Sample Classification
Table 4 shows the yearly distribution of ESG ratings. First, Panel A shows the status of the ESG ratings and ESG unrated firms, and Panel B indicates the dummy of the ESG ratings and “new”, “up”, “down”, and “fail” ESG ratings. On panel A, the ESG ratings are divided into A+, A, B+ and B, and non–ratings. In this table, ESG rating of A+ is 0.7%, A is 4.4%, B+ is 11%, and B is 73.9%, on average.
Panel B shows the new, up, down, and fail status of ESG ratings. The corresponding firms are coded 1, and otherwise 0. The total number of firms that has ESG ratings is 4525 (new ESG ratings 306, upward ESG ratings 1016, downward ESG rating 946, and fail ESG ratings 14). The new ESG firms are small in number, but firms with upward or downward ratings represent similar ratios.
5.4. Short-Term Analysis
We apply an event study methodology in examining the reactions of the stock markets to the ESG ratings news of the KCGS. The KCGS publishes ESG ratings once a year, with different disclosure days. For each day in the event window, we calculate daily abnormal returns and cumulative abnormal returns for every stock using CAPM Equation (1), where is the returns of stock i at day t, is the return of the KOSPI index, and and are the regression estimates from an OLS estimation applied during the estimation period (−250, −21).
Table 5 shows abnormal returns (AR) and cumulative abnormal returns (CAR) to ESG disclosure day for the 40-day event window for twenty days before and after. AR is negative from twenty days till three days continuously before the disclosure day. It also shows a significant positive abnormal return (AR) starting from two days till three days after the disclosure day.
It shows a significant positive cumulative abnormal return (CAR), starting from two days prior till nineteen days after the disclosure day. CAR is also negative from twenty days till two days continuously before the disclosure day. The results might imply that the firms suffer significantly lower abnormal returns before the ESG disclosure while they obtain significantly higher AR and CAR after the ESG disclosure day, the latter consistent with the result of Kim et al. [
2], who used Tobin Q for stock returns.
In terms of finance theory, the results support the strong–form market efficiency hypothesis (EMH) of Fama [
50] in the Korean stock market with respect to ESG rating disclosure, which states that the current stock price reflect all available information in a market, whether public or private, including rationally expected and insiders’ information. In other words, investors can enjoy excess returns by purchasing ESG stocks on average quite many days before the disclosure of ratings, regardless of their actual ratings. Maybe inside information with respect to new or higher rating is revealed to some investors quite early enough to purchase at a significanly lower price.
Figure 1 presents the results of
Table 5. Abnormal returns around the ESG rating disclosure in AR and CAR are negative before the disclosure day and change to be positive around the disclosure day and stay positive for many days afterwards, supporting the strong–form efficient market hypothesis (EMH) of Fama [
50] in the Korean stock market and the result of Kim et al. [
2].
ESG_All group changes to a significant positive AR two days before the disclosure from significant negative abnormal returns. It also indicates continuously significant positive ARs after the disclosure day. When the ESG ratings are divided into three groups, each group represents a distinctly different behavior. First, the ESG_New group shows a significant positive effect and then a non–significant return after the disclosure day. Second, ESG_Up group shows a significant positive AR and a distinct negative AR after disclosure day. ESG_New and ESG_Up’s decline in returns after the ESG disclosure day can be interpreted as the stock market’s negative perception of ESG rating.
In terms of finance theory, the results for ESG_New and ESG_Up groups support the strong–form EMH of Fama [
50] in the Korean stock market with the positive effects of such ESG rating disclosures, whose effects exist until the disclosure day for new ESG rating firms and until the two days after the disclosure day for higher ESG rating firms, and disappear afterwards showing statistically insignificant in CAR differences for the ESG_New group firms and turn significantly negative afterwards for the ESG_Up group firms. In general, the Korean stock market reacts efficiently to inside information regarding newly–rated ESG firms and higher ESG rating firms.
Finally, as the ESG_Down group approaches the disclosure day, non-significant abnormal returns change to significant positive ARs and then become insignificant again, which in turn show statistically significant negative ARs. These results indicate that ESG_Down also provides poor support even the semi-strong form market efficiency hypothesis (EMH) of Fama [
50] in the Korean stock market with the somewhat positive effects of such ESG rating disclosures for about three days after the disclosure day, which eventually becomes a significant negative AR many days later.
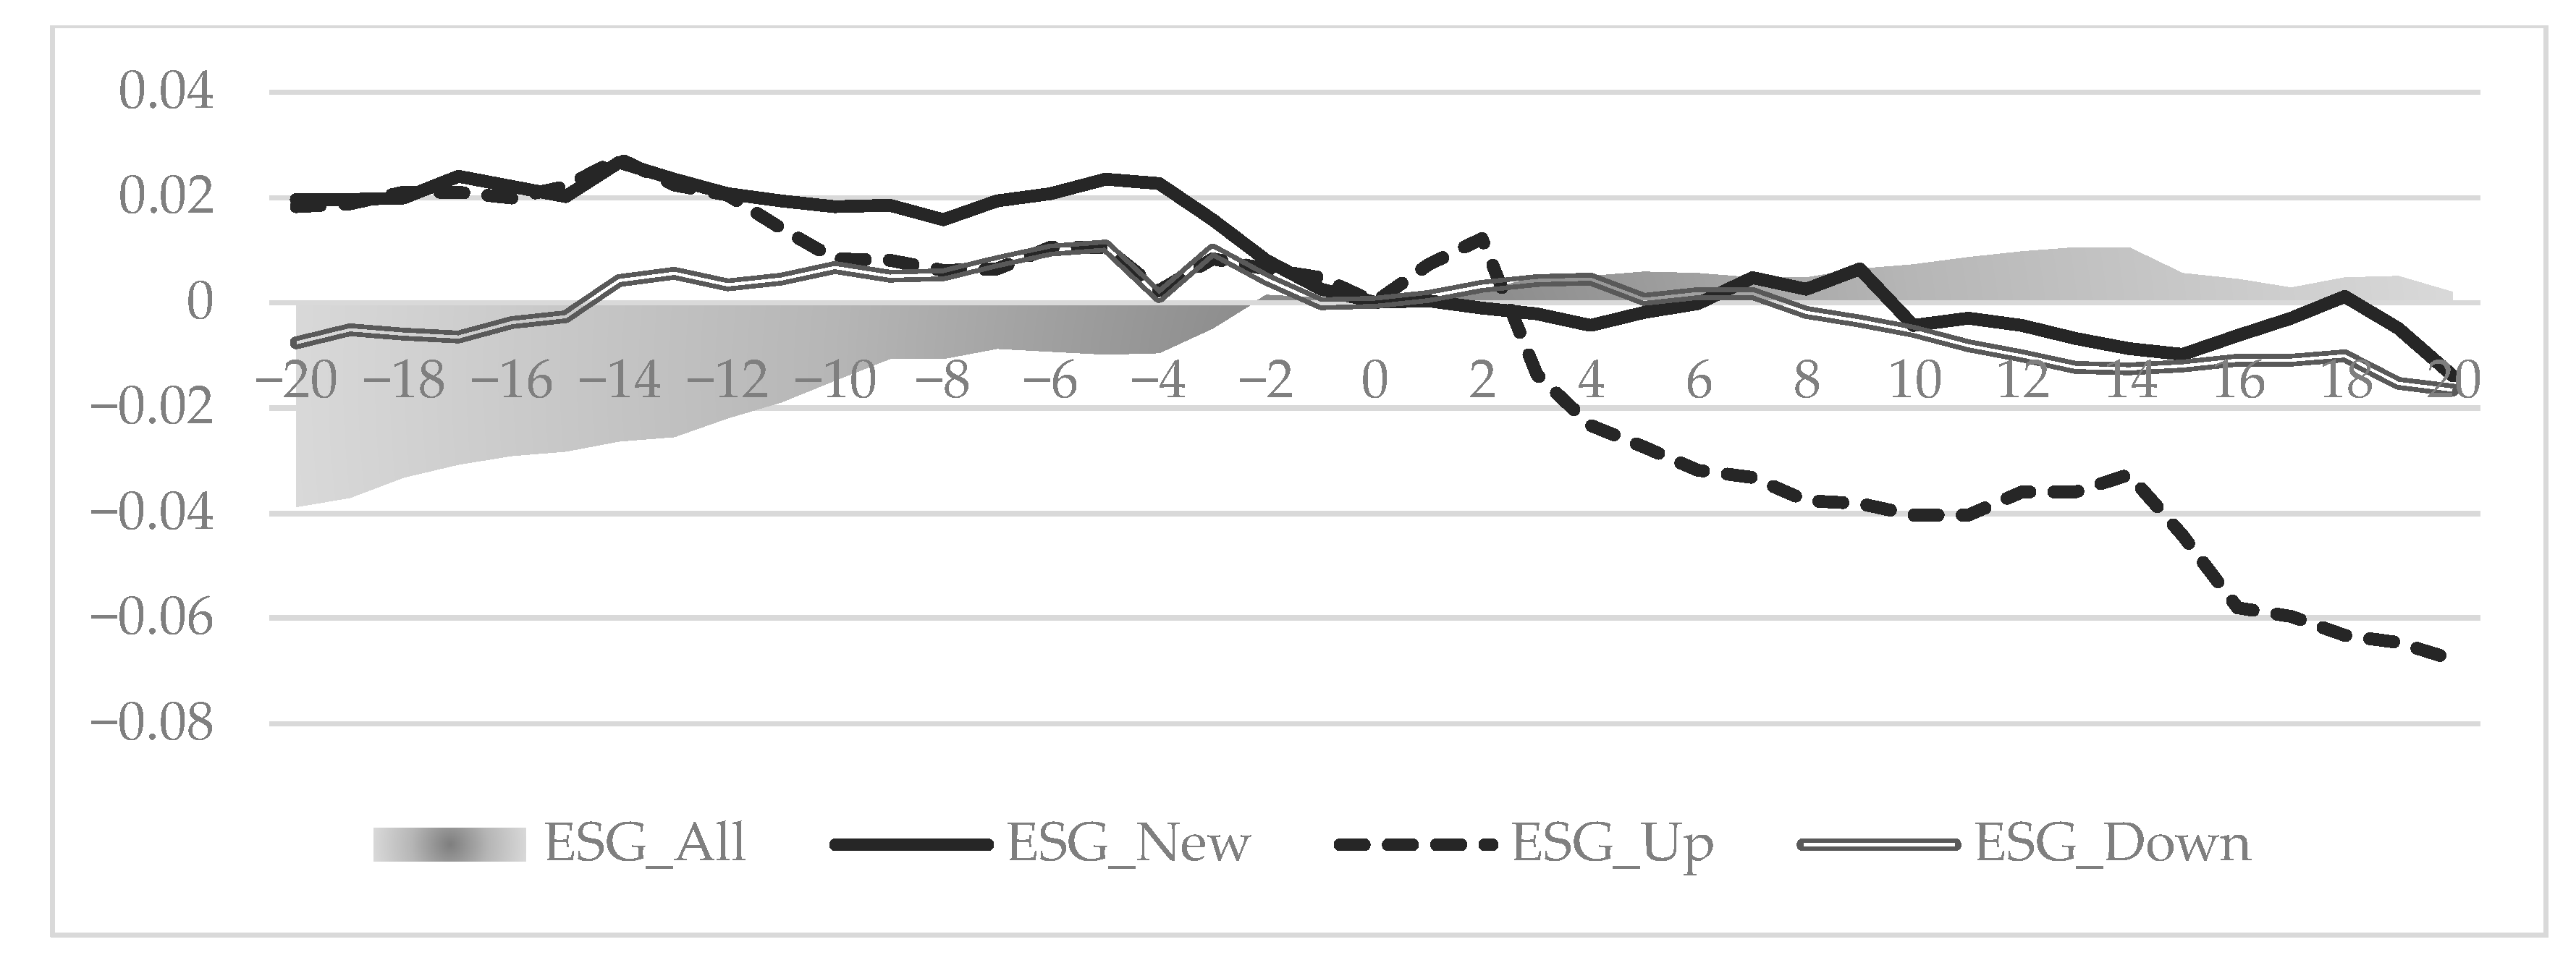
Figure 2 presents the results of
Table 6.
Table 6 presents the results of CARs around the ESG disclosure day by firm groups (ESGAll, ESG_New, ESG_Up and ESG_Down). The effects of ESG rating disclosure are different across different subgroups. The analysis of AR for twenty days before and after around the disclosure, as depicted in
Figure 2, reveals that the market reacts positively to ESG rating for all firms (ESG_All) starting from two days before the disclosure day. It seems quite weird for firms degraded in overall ESG rating whose market responses prior to the disclosure day are negative, but without any statistical significance. We can infer that investors are not quite sure of ESG ratings for firms until the disclosure day, with somewhat negative responses beforehand. However, even the lower rating also affects positively for a couple of days right after the disclosure day, an enigma in some senses. Investors’ responses right after the disclosure are against general belief. It might be because some severe uncertainty related to the ratings disappears and investors appreciate the firms’ underinvestment in ESG positively for a short period of time at least.
5.5. Regression Analysis
Table 7 presents the analysis results with respect to the impact of the ESG ratings on AR to test hypothesis 1 with an OLS model, a random effects panel model (REM), and a fixed effects panel model (FEM). In addition, the Lagrange multiplier test (LM test) and the Hausman test are conducted to assess each empirical model’s fitness, and a fixed effect model is adopted. The results of FEM show the fitness of the regression model evidenced by statistically significant
F values. Moreover, the variance inflation factor (VIF) value exists within the range of 1.02–1.68, quite low considering the general critical level of 10 or above.
The panel regression results show that the ESG ratings do not significantly affect the abnormal returns. In addition, no statistically significant results are shown when the analysis is performed by dividing the ESG ratings into A+, A, B+ and B. Control variables show significant positive effects at the 1% level of risk–free returns (Rf) and return on assets (ROA), whereas the market return (Rm) has significant negative effects at the 1% level. Hypothesis 1, which states that ESG firms have higher abnormal returns than non–ESG firms, is rejected.
These results indicate that the stock market reacts when a firm is newly ESG rated or when the disclosure occurs in which the ESG rating rises or falls. Therefore, we reject hypothesis 4 that the firms with higher ESG ratings have higher abnormal returns.
5.6. Long-Term Analysis
Next,
Table 8 presents the analysis to test hypotheses 2-1, 3-1, 4-1 and 5-1. First, the ESG variable to test hypothesis 2 does not have a significant effect on AR. Testing hypothesis 3 aims to answer whether firms with new ESG ratings have higher AR. The result from ESG_New group shows a positive effect on AR at the 5% level. The upward ESG ratings have a significant positive effect on AR at 1%. By contrast, the downward ESG ratings have a significant negative effect on AR at 5%. Finally, when all variables are analyzed at once in the model, ESG_New and ESG_UP show positive significance at the 10% and 1% level, respectively.
Table 9 shows the regression results concerning the impact of the ESG ratings on long-term AR measured by the capital asset pricing model (CAPM) or security market line (SML). To test the hypotheses, a regression analysis was performed once each for the effect of ESG_Firm_D, ESG, ESG_New, ESG_Up and ESG_Down on the long-term AR separately. Moreover, for legibility, only one dependent variable is introduced, and for the remaining part, the number of observations and
R2 are presented for the regression results of ESG_Firm_D (ESG firm dummy). The analysis shows that higher or new ESG ratings have a significant positive effect on AR of
t + 1. By contrast, the effects of ESG_Up and ESG_Down on the short-term AR are no longer statistically significant.
In addition, the ESG_New and the ESG_Up have a positive AR in the short term, and the effects turn negative in year 3 after such rating. The effect of lower ESG rating (ESG_Down) is the opposite. This result suggests that investors in the Korean stock market do not view CSR activities as a means of maintaining firm value higher than others over a long period. The changes in the coefficient signs over the period—positive in the year and a year after, no effects in the second year and negative in the third year and after—show the changes in the market sentiments of investors over years after the rating changes.
Table 10 compares the short-term and long-term impact of the ESG ratings on AR, calculated in accordance with model (2) of Fama and French and model (3) of Carhart. The empirical analyses show that only a statistically significant effect exists during the year (
t = 0), similar to the model (1) of CAPM. Moreover, ESG_Firm_D, ESG_New and ESG_Up exist a year later (
t = 1) and gradually change the coefficients, and the situation reverses three years later (
t = 3). Thus, changes in the ESG rating show similar results to those of CAPM in
Table 8.
6. Conclusions
This study uses ESG data of the Korea Corporate Governance Institute, which measures comprehensively and systematically CSR activities for their long-term sustainability and growth from a “sustainable management” perspective. It uses integrated data, both financial accounting data of KIS–Value and stock market data of DataGuide and investigates the effects of ESG ratings on abnormal returns by using 5,024 firm-level data between 2011 and 2018 in Korea. In particular, we examine how abnormal returns change over time in overall ratings and each category of ratings and different types of changes in overall ratings and in each of E, S and G subgroups. We test the conflict resolution hypothesis over the overinvestment hypothesis with respect to ESG activities, proclaim Buchanan et al. [
44], for the former to be more critical in a country like Korea with low quality governance for firms [
2], not only in the short-term AR and CAR, but also in the long-term AR. We expect positive AR for sustainable growth or higher likelihood of survival as demonstrated in the majority of empirical analyses [
25,
26,
27,
28,
41,
42], applying event study methodology for risk-adjusted market returns measured by CAPM, the three-factor model of Fama and French, and the four–factor model of Carhart, rather than Tobin Q as in Kim et al. [
2]. We applied
t test for the short-term AR and CAR and fixed effects panel regressions (FEM) for the long-term AR. The main findings are as follows.
First, the firms suffer significantly lower AR and CAR before the ESG rating disclosure while they enjoy higher AR and CAR after the ESG rating disclosure day, the latter consistent with the result of Kim et al. [
2] while the former supporting the strong–form market efficiency hypothesis (EMH) of Fama [
50] in the Korean stock market with respect to ESG rating disclosure.
Second, the newly rated or higher ESG group shows significantly a positive short-term AR until the disclosure day and then a negative AR after the disclosure day. However, the lower ESG rating group shows quite an opposite pattern, a non-significant AR before the disclosure day, a significant positive AR around the disclosure day, and then an insignificant AR again after the disclosure day. The results support the strong–form market efficiency hypothesis (EMH) of Fama [
50] in the Korean stock market with respect to ESG rating disclosure only in that investors behave in advance for the announcement, without considering their over- or under-reactions.
Third, overall ESG rating has no statistical effect on AR in the short-term (during the accounting period), but with a positive effect in one-year long-term AR. When separated into groups based on changes in rating, newly rated or higher ESG firms show a positive AR, and then turn negative in three years after such rating. However, decreases in ESG ratings show a negative AR during the year, which turn negative in three years after such rating, partially consistent with the results of the majority of empirical analyses [
25,
26,
27,
28,
41,
42], since the effects last for one-year after the disclosure day.
From the results, we can infer that the signaling effects of ESG ratings and their changes persist for at least one year from the disclosure day and disappear later in opposite directions in year 3. With different patterns in AR and thus CAR from many days before, and up to five years after the disclosure day, the results are more or less same across three different measurements of AR: Sharpe–Linter model, Fama–French three-factor model and Carhart four–factor model.
It seems that investors in Korea are not, in general, interested in long-term investments in ESG stocks, and that they would rather sell them right after they realize short-term gains after or in some days after the disclosure day. By holding them for longer term investments, they might suffer from poor stock market returns from year 3. The specific timing of gains or losses quite differ across different types of changes, both in overall ESG ratings and in each rating category of E, S and G subgroups.
While our results support for most cases those of prior studies with positive ARs in the short-term around the announcements and in the long-term for only one year, they contradict the earlier results basically in that investors might sell off their shares immediately when they can realize profits in AR from their ESG investments, making the best use of the disclosure timing, ratings, various patterns in rating changes, in overall rating and in each of E, S and G ratings.
Thus, we conclude that, based on ARs or CARs for ESG firms in Korea, the disclosure of ESG ratings and efforts to improve the ratings do not guarantee the long-term sustainability of ESG firms for a long period of time after the disclosure day. While this study is meaningful in that it analyzes the persistence and patterns of investors’ behaviors in response to ESG ratings and their changes over time in days and years, it also is limited in that our study applies those models like CAPM, Fama–French three-factor model and Carhart four–factor model in addition to multivariate fixed effects, which might not fully control for some other factors, not reflected in those in the models. We leave our limitations for future research.


