The Impact of Technological Processes on Odorant Emissions at Municipal Waste Biogas Plants


Abstract
1. Introduction
- photoionization sensors—PID;
- nondispersive infrared sensors—NDIR;
- electrochemical sensors—EC;
2. Materials and Methods
2.1. Characteristic of the Analysed Plant
2.2. Study Methodology
3. Results and Discussion
4. Conclusions
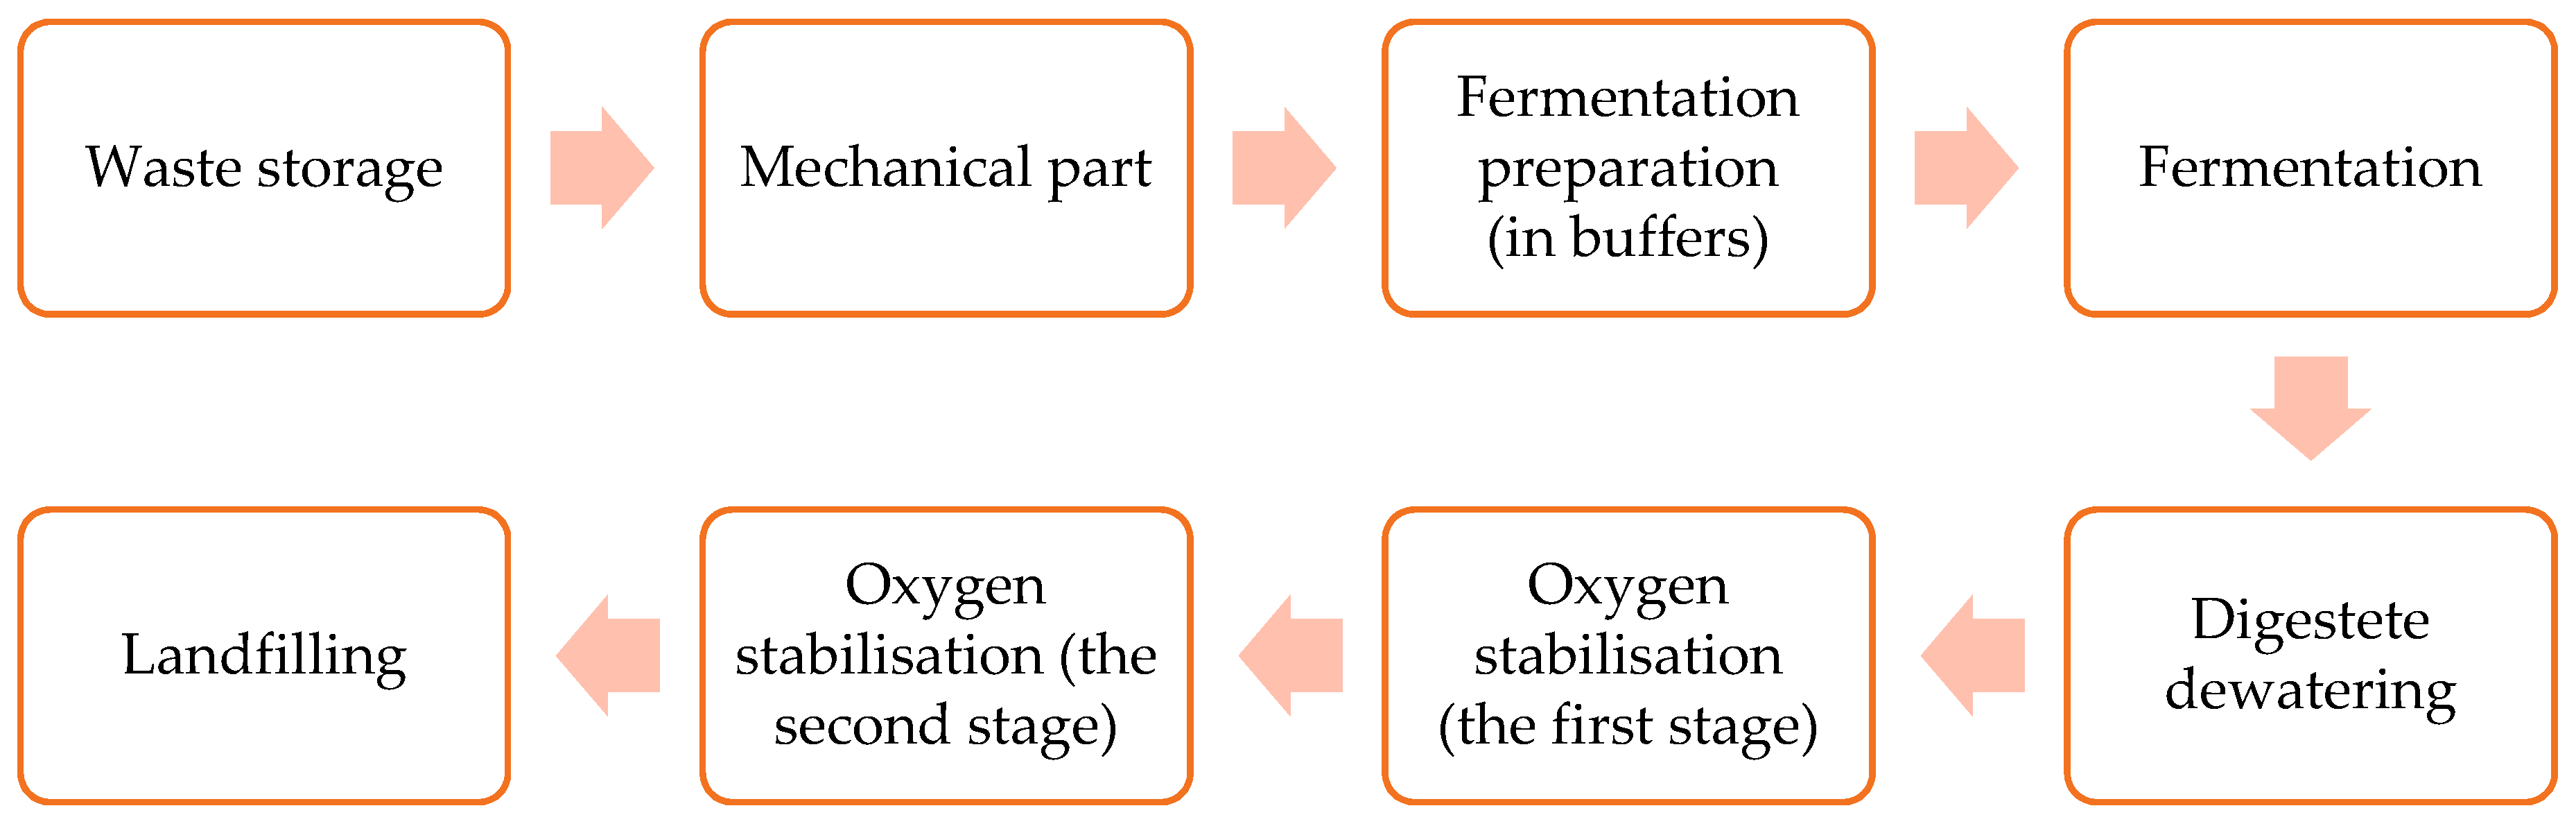
- Odorant sources can be divided into the following five categories related to technological processes conducted at analysed biogas plant: waste storage, preRDF storage, waste mechanical treatment and fermentation preparation, digestate dewatering, and oxygen stabilization.
- The biggest odorant concentrations accompany such unit operations as: storage of mixed municipal waste, digestate dewatering, digestate oxygen stabilization of the 1st-degree, and technological wastewater storage (both from digestate dewatering and its oxygen stabilization). The largest organized emissions are related to the evacuation of gases by means of roof ventilators.
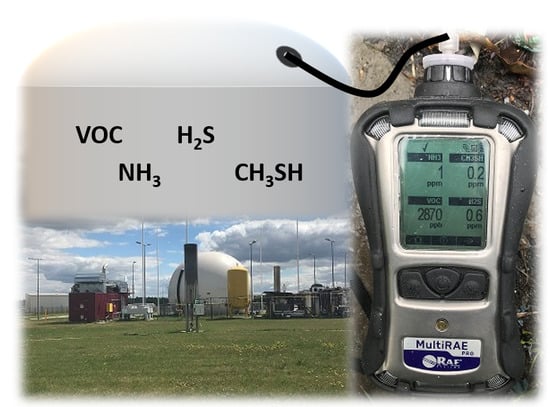
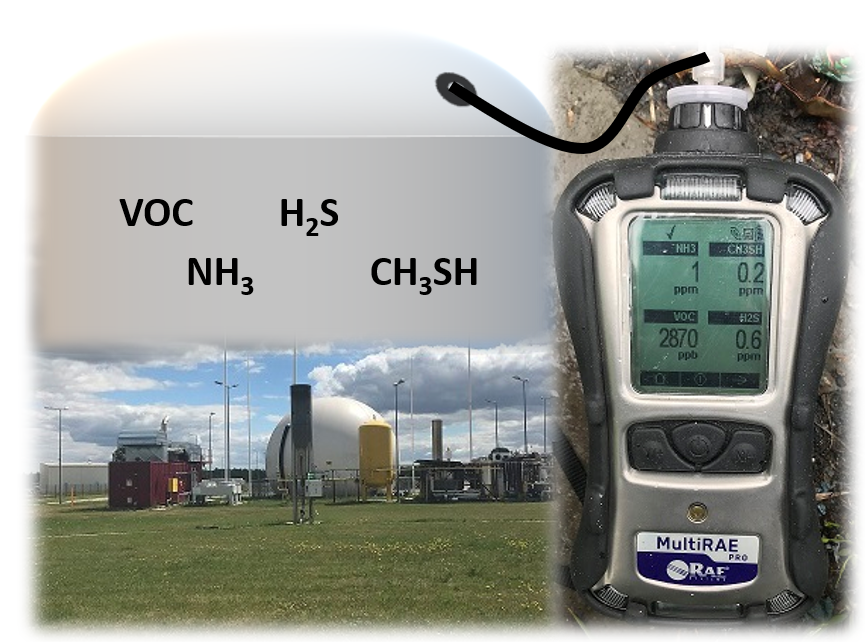
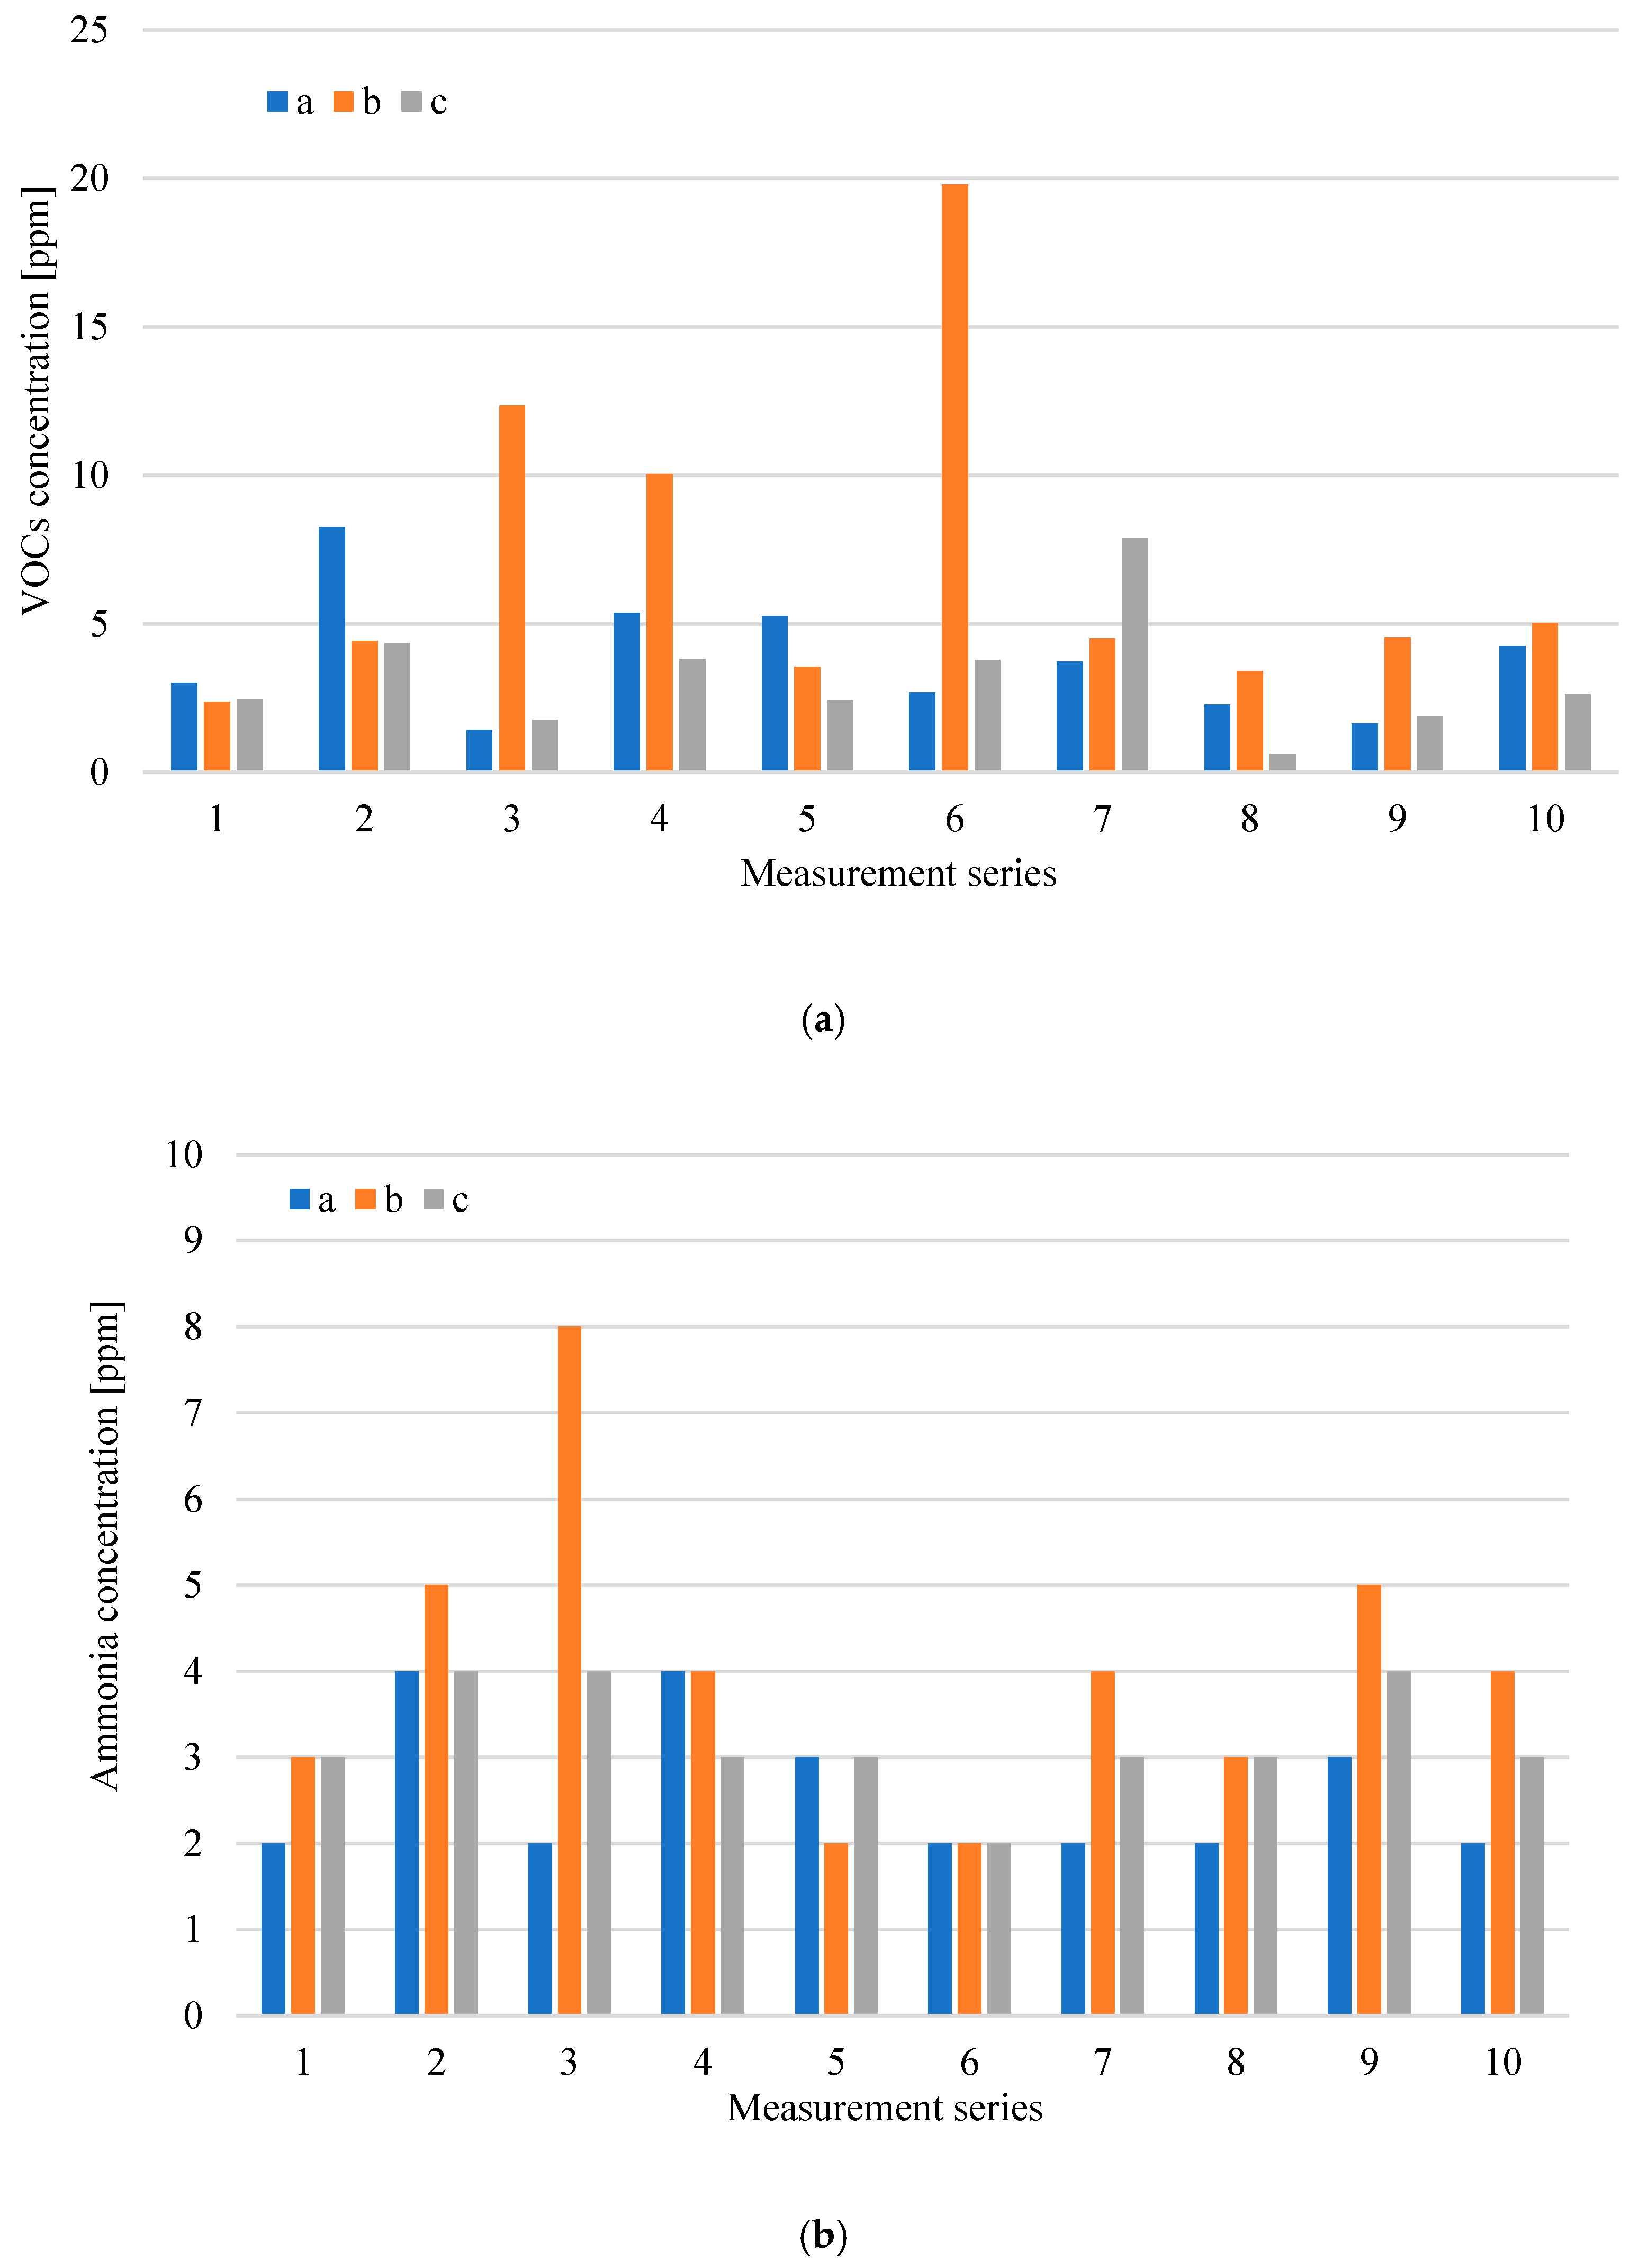
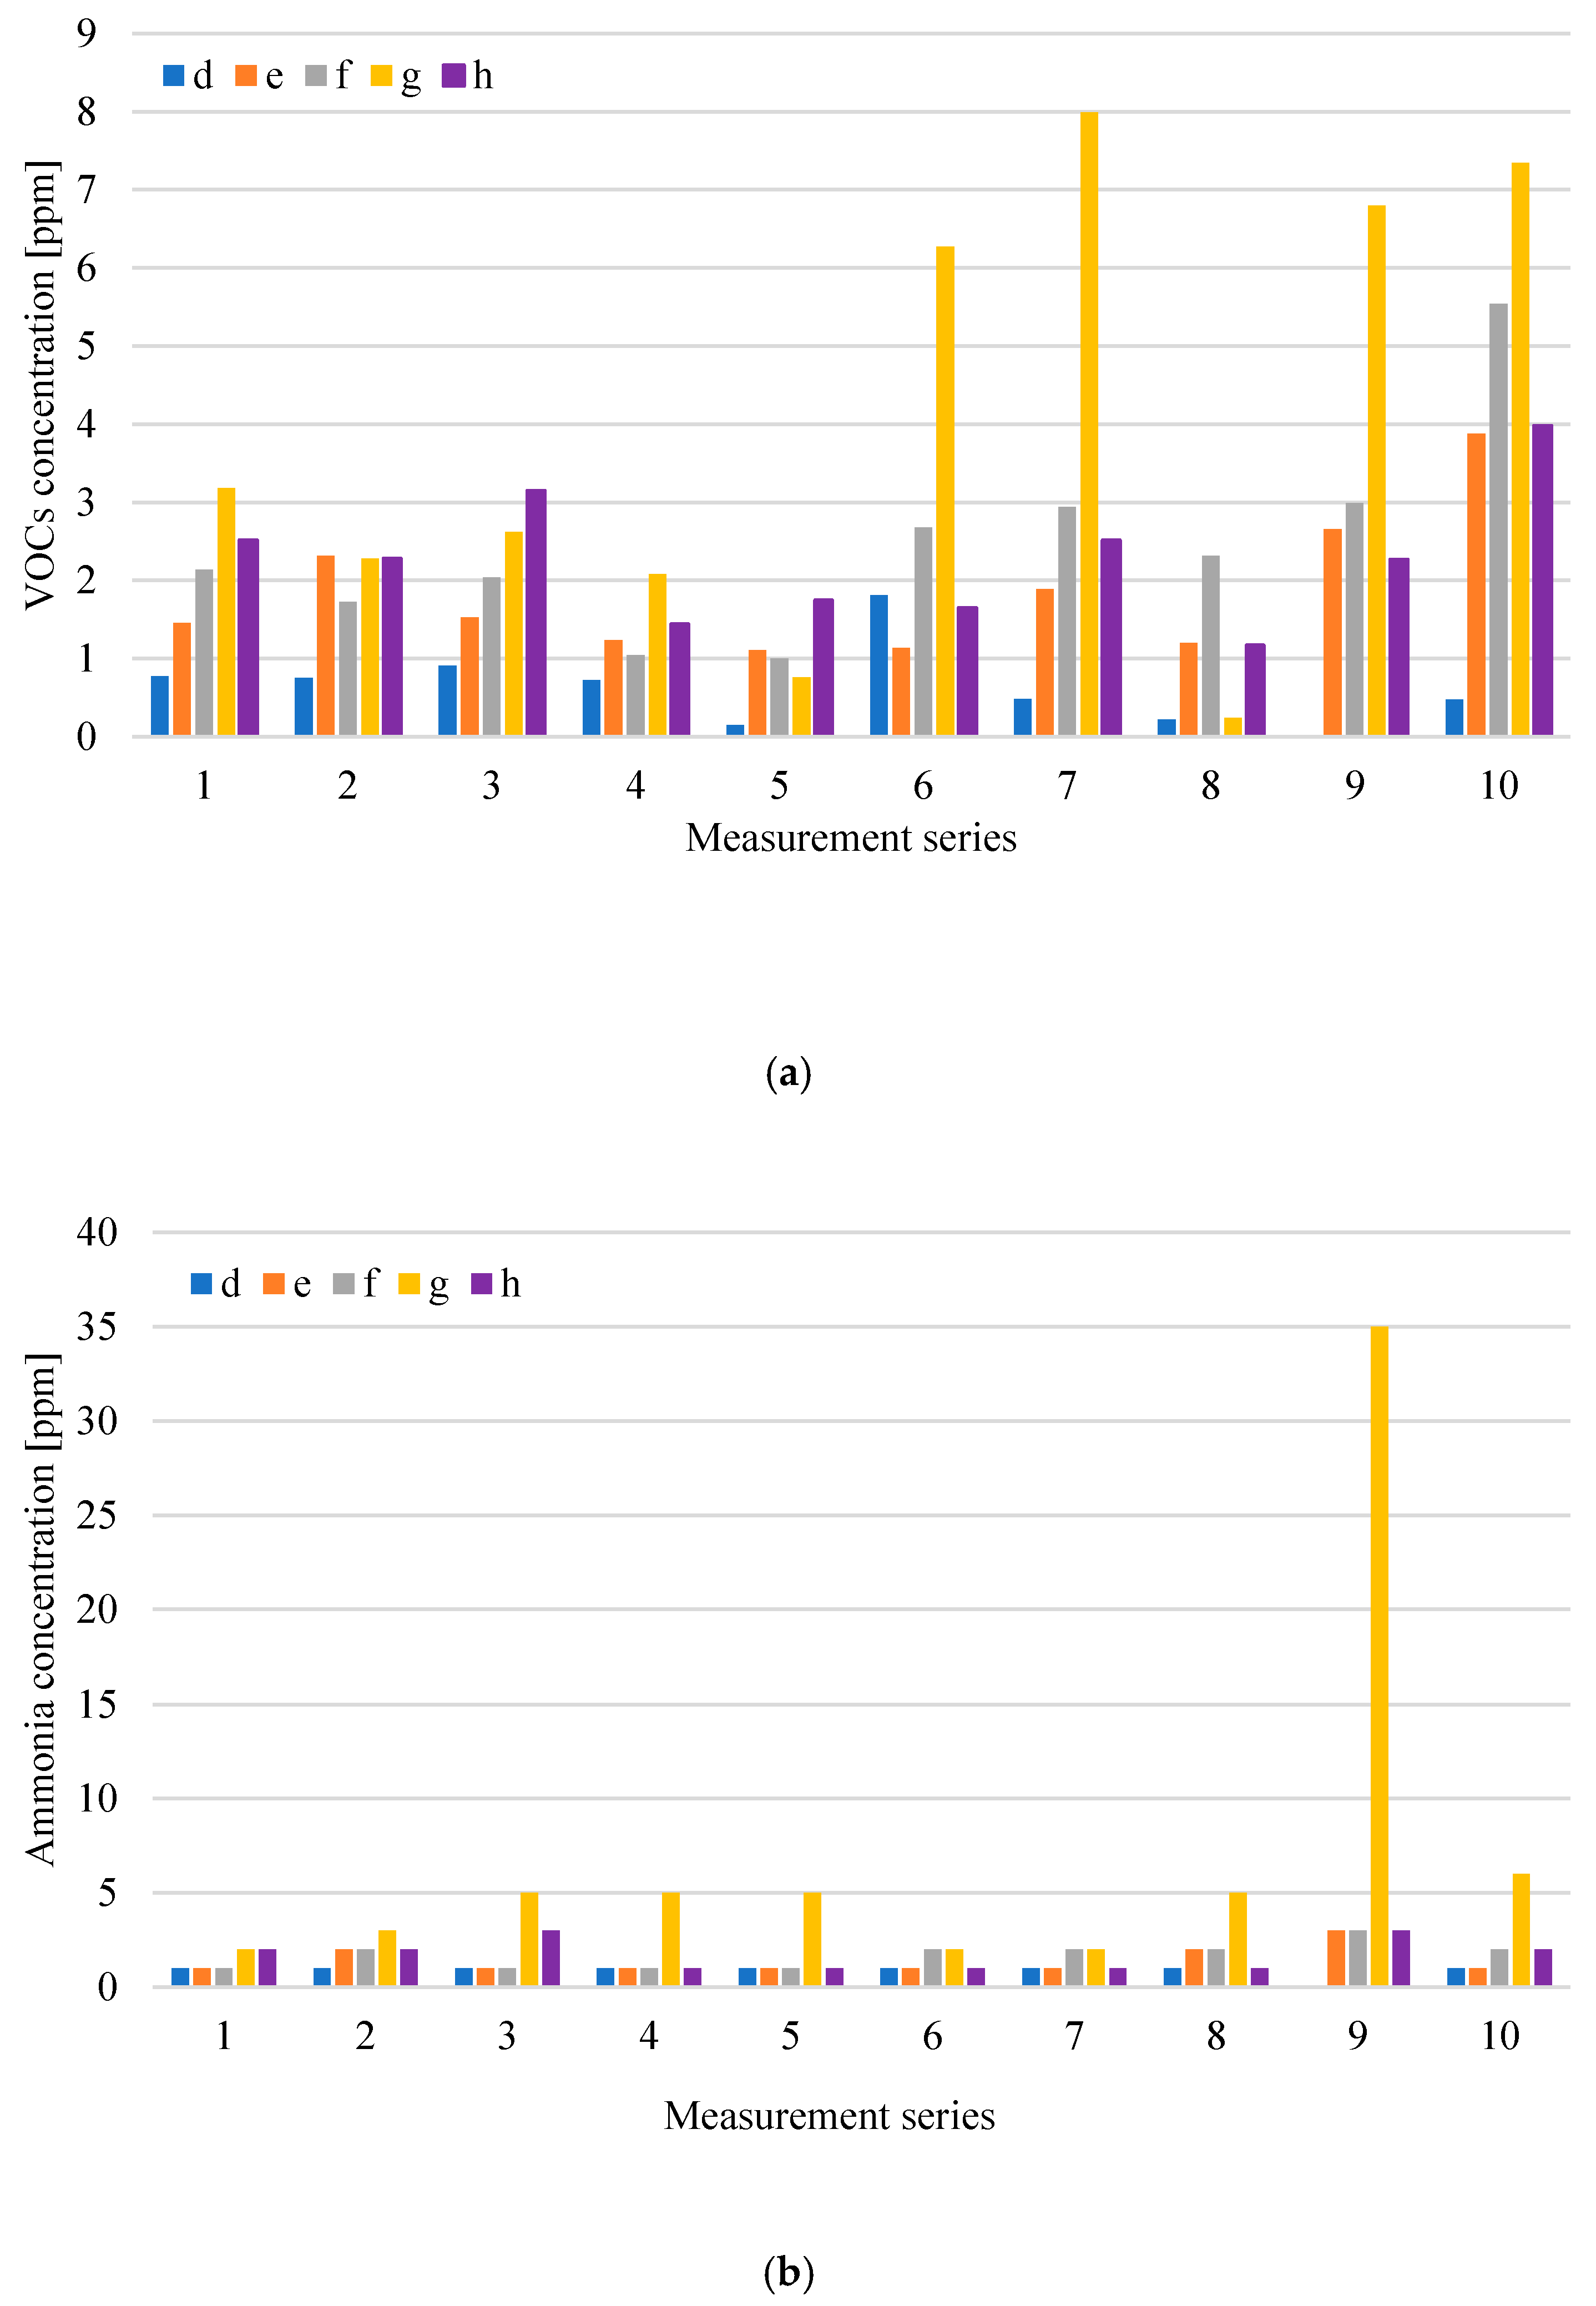
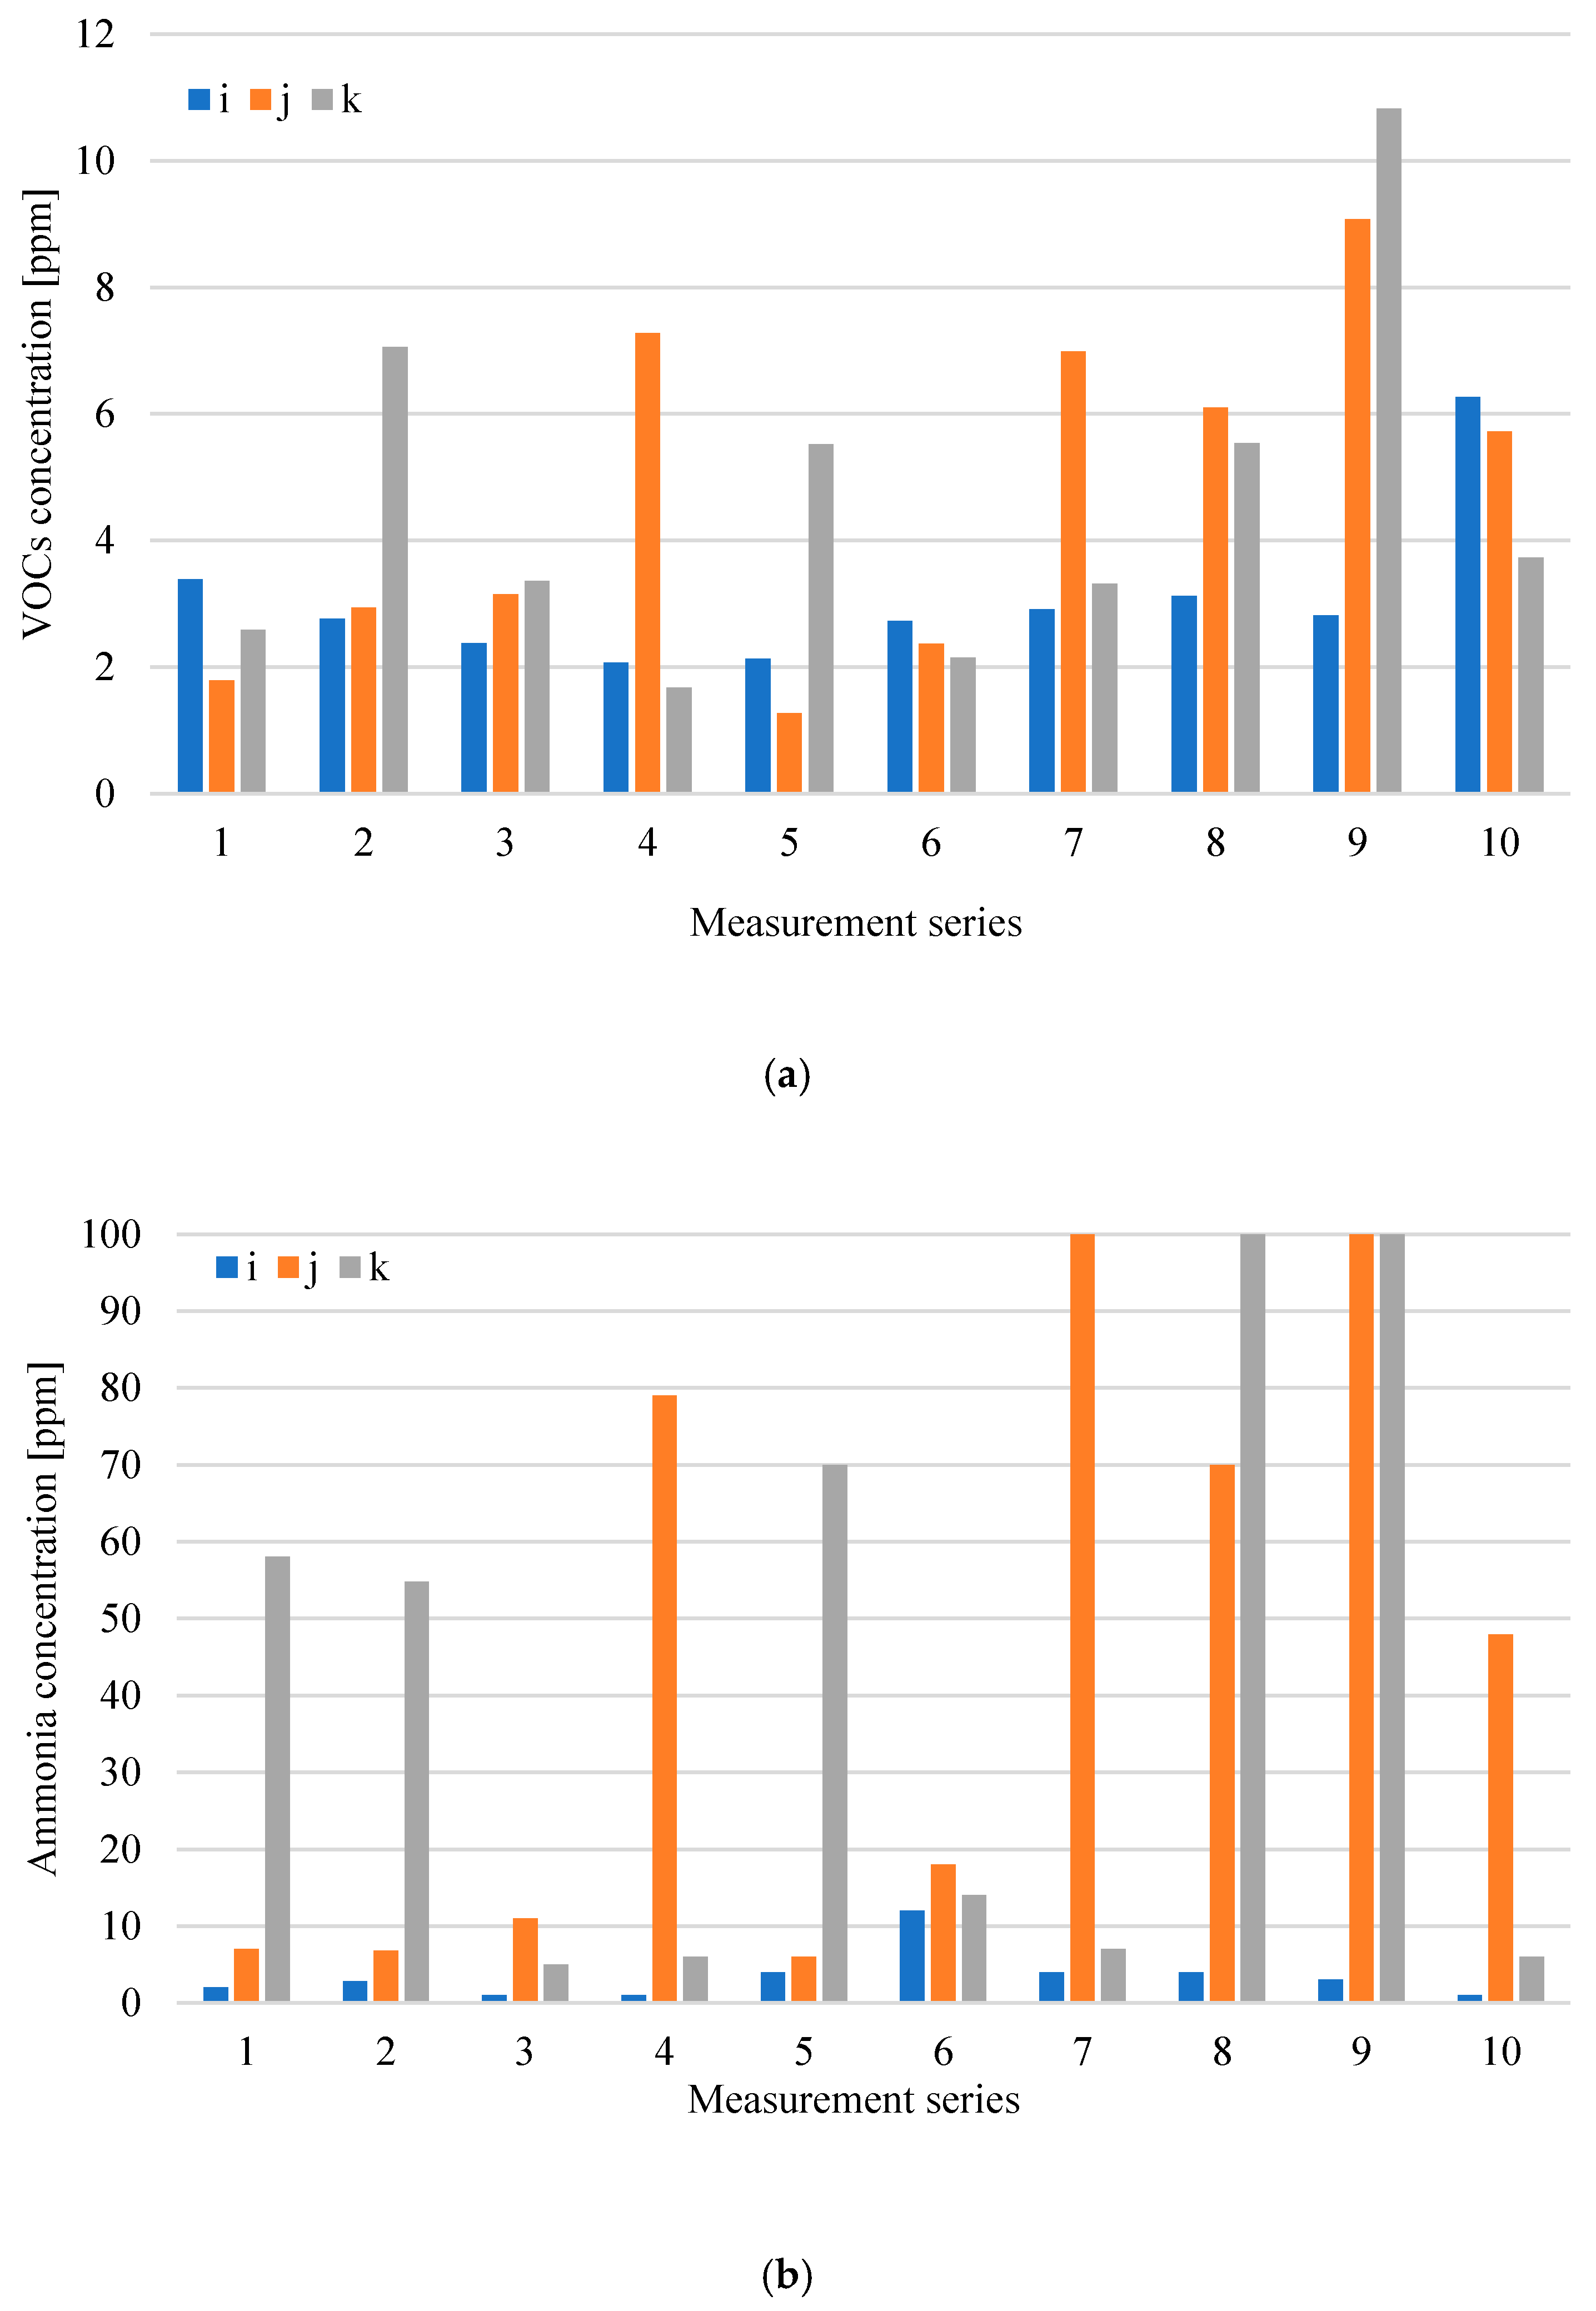
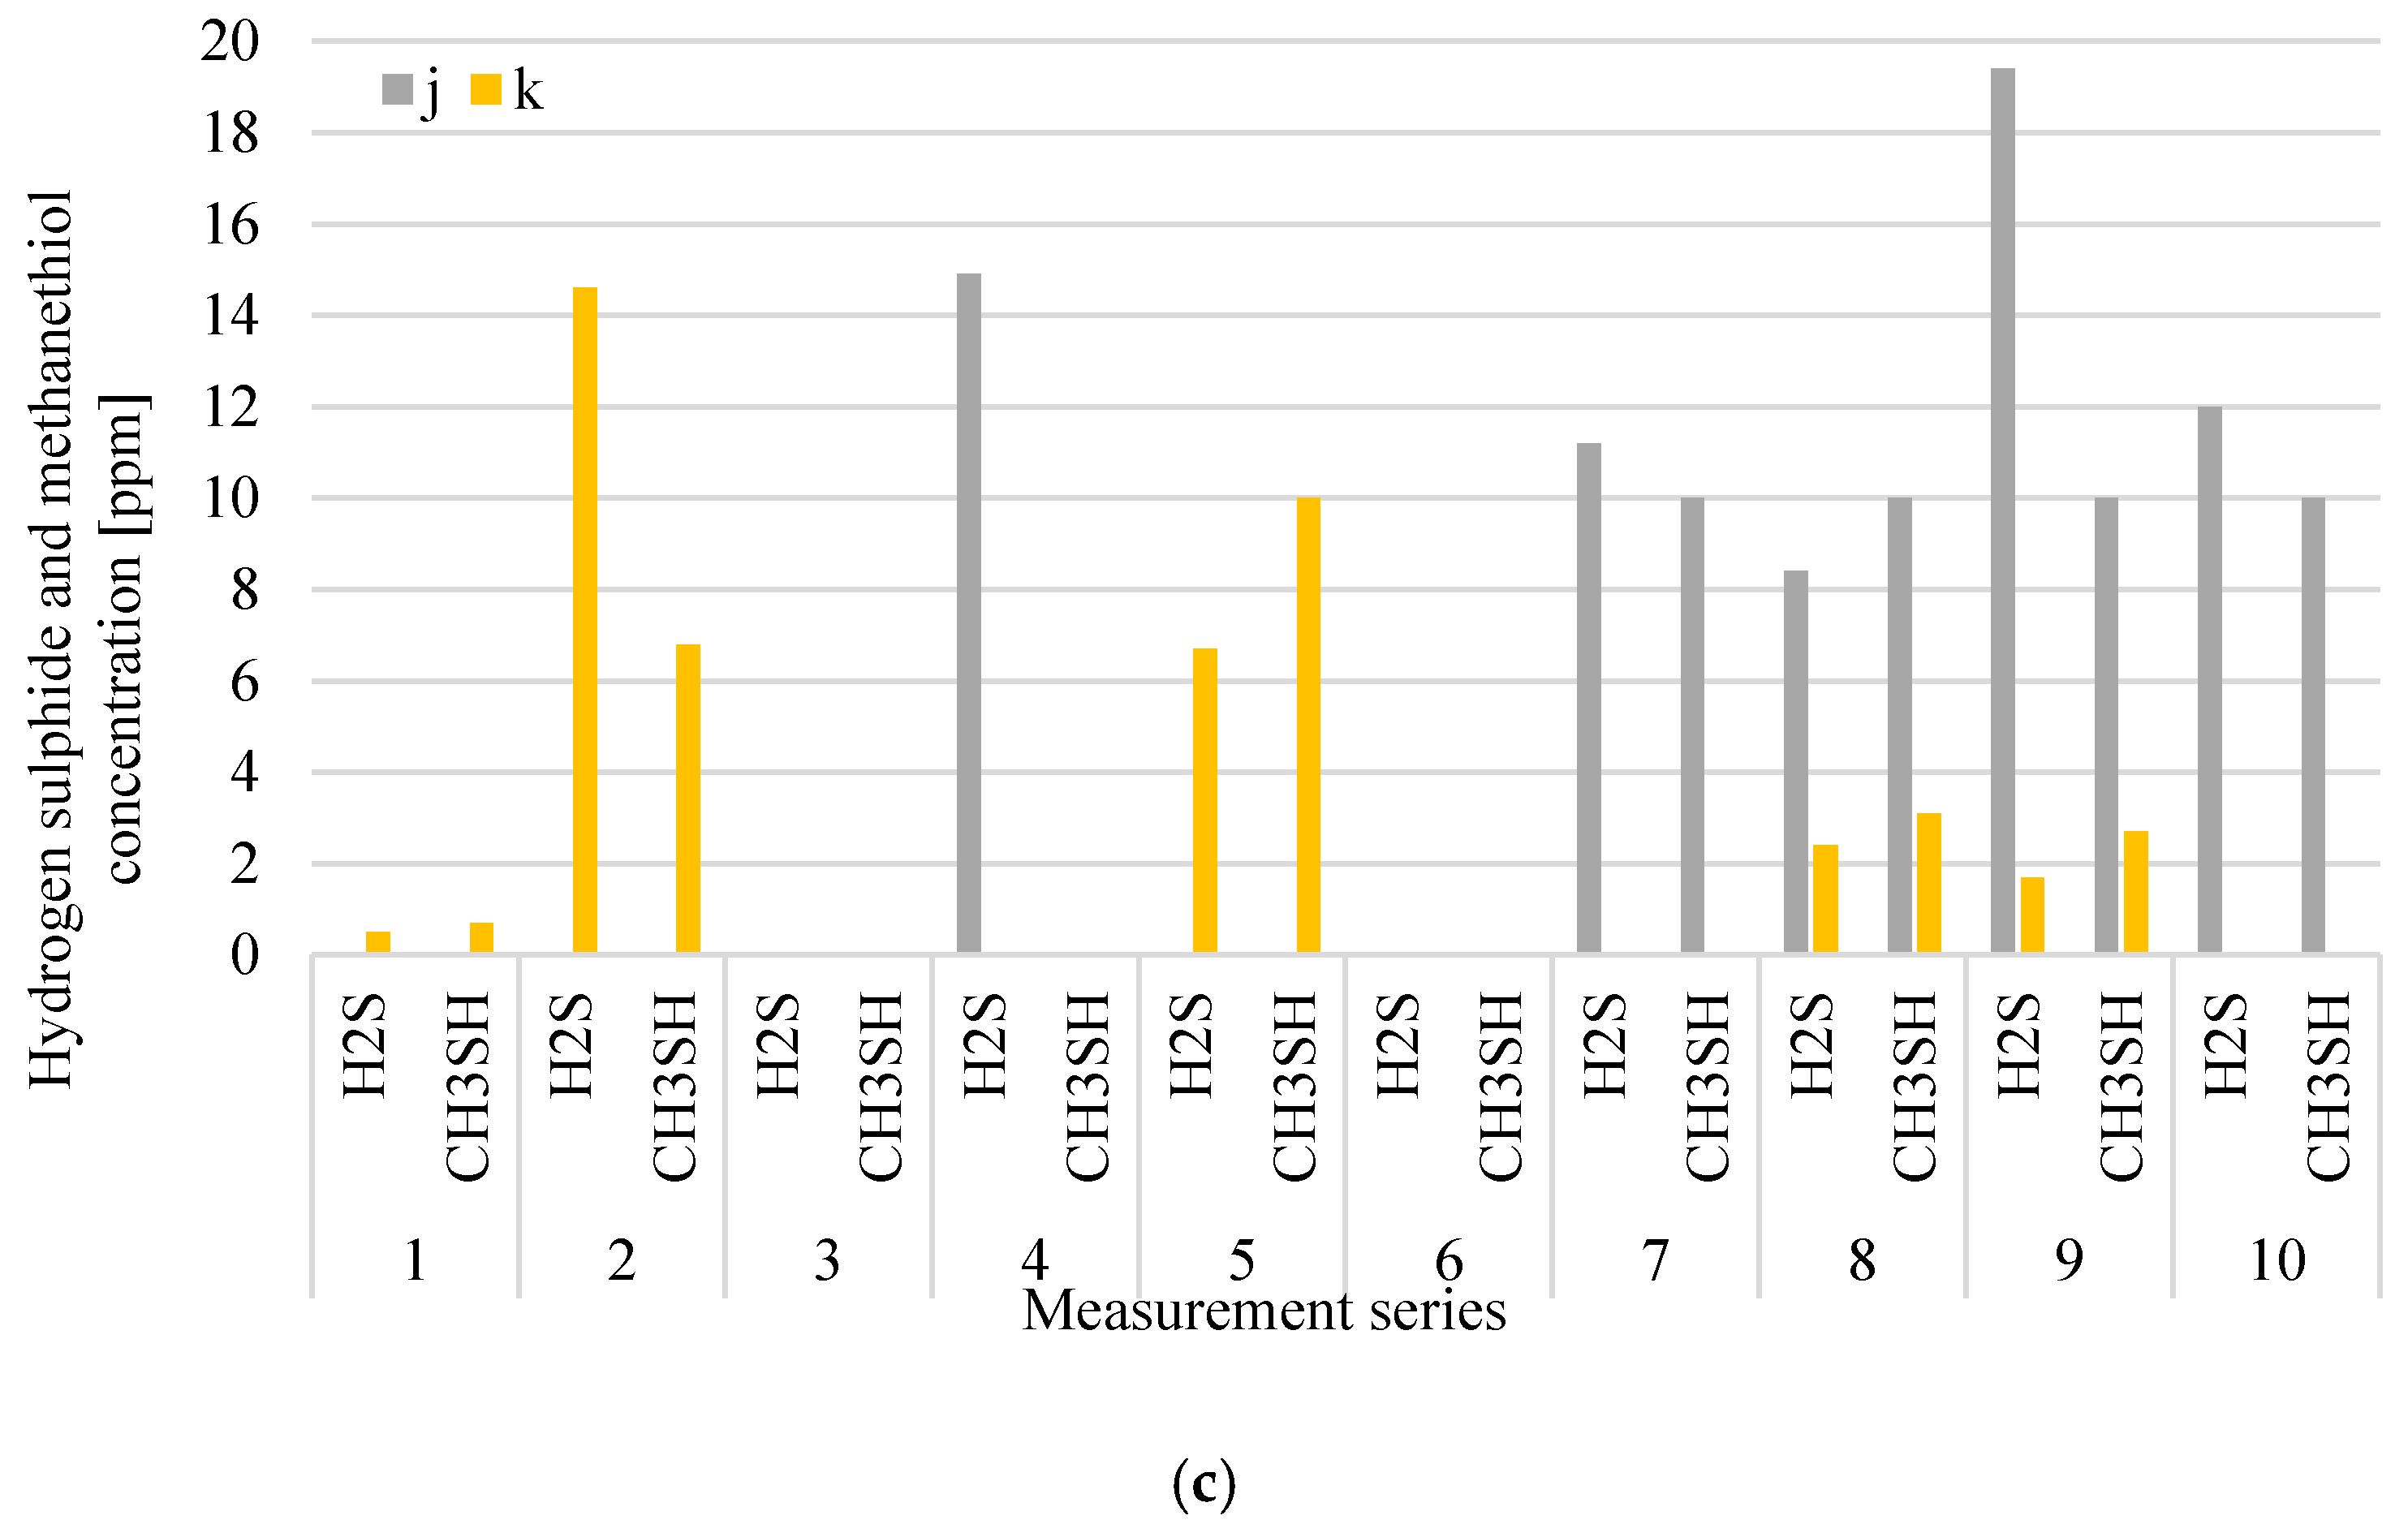
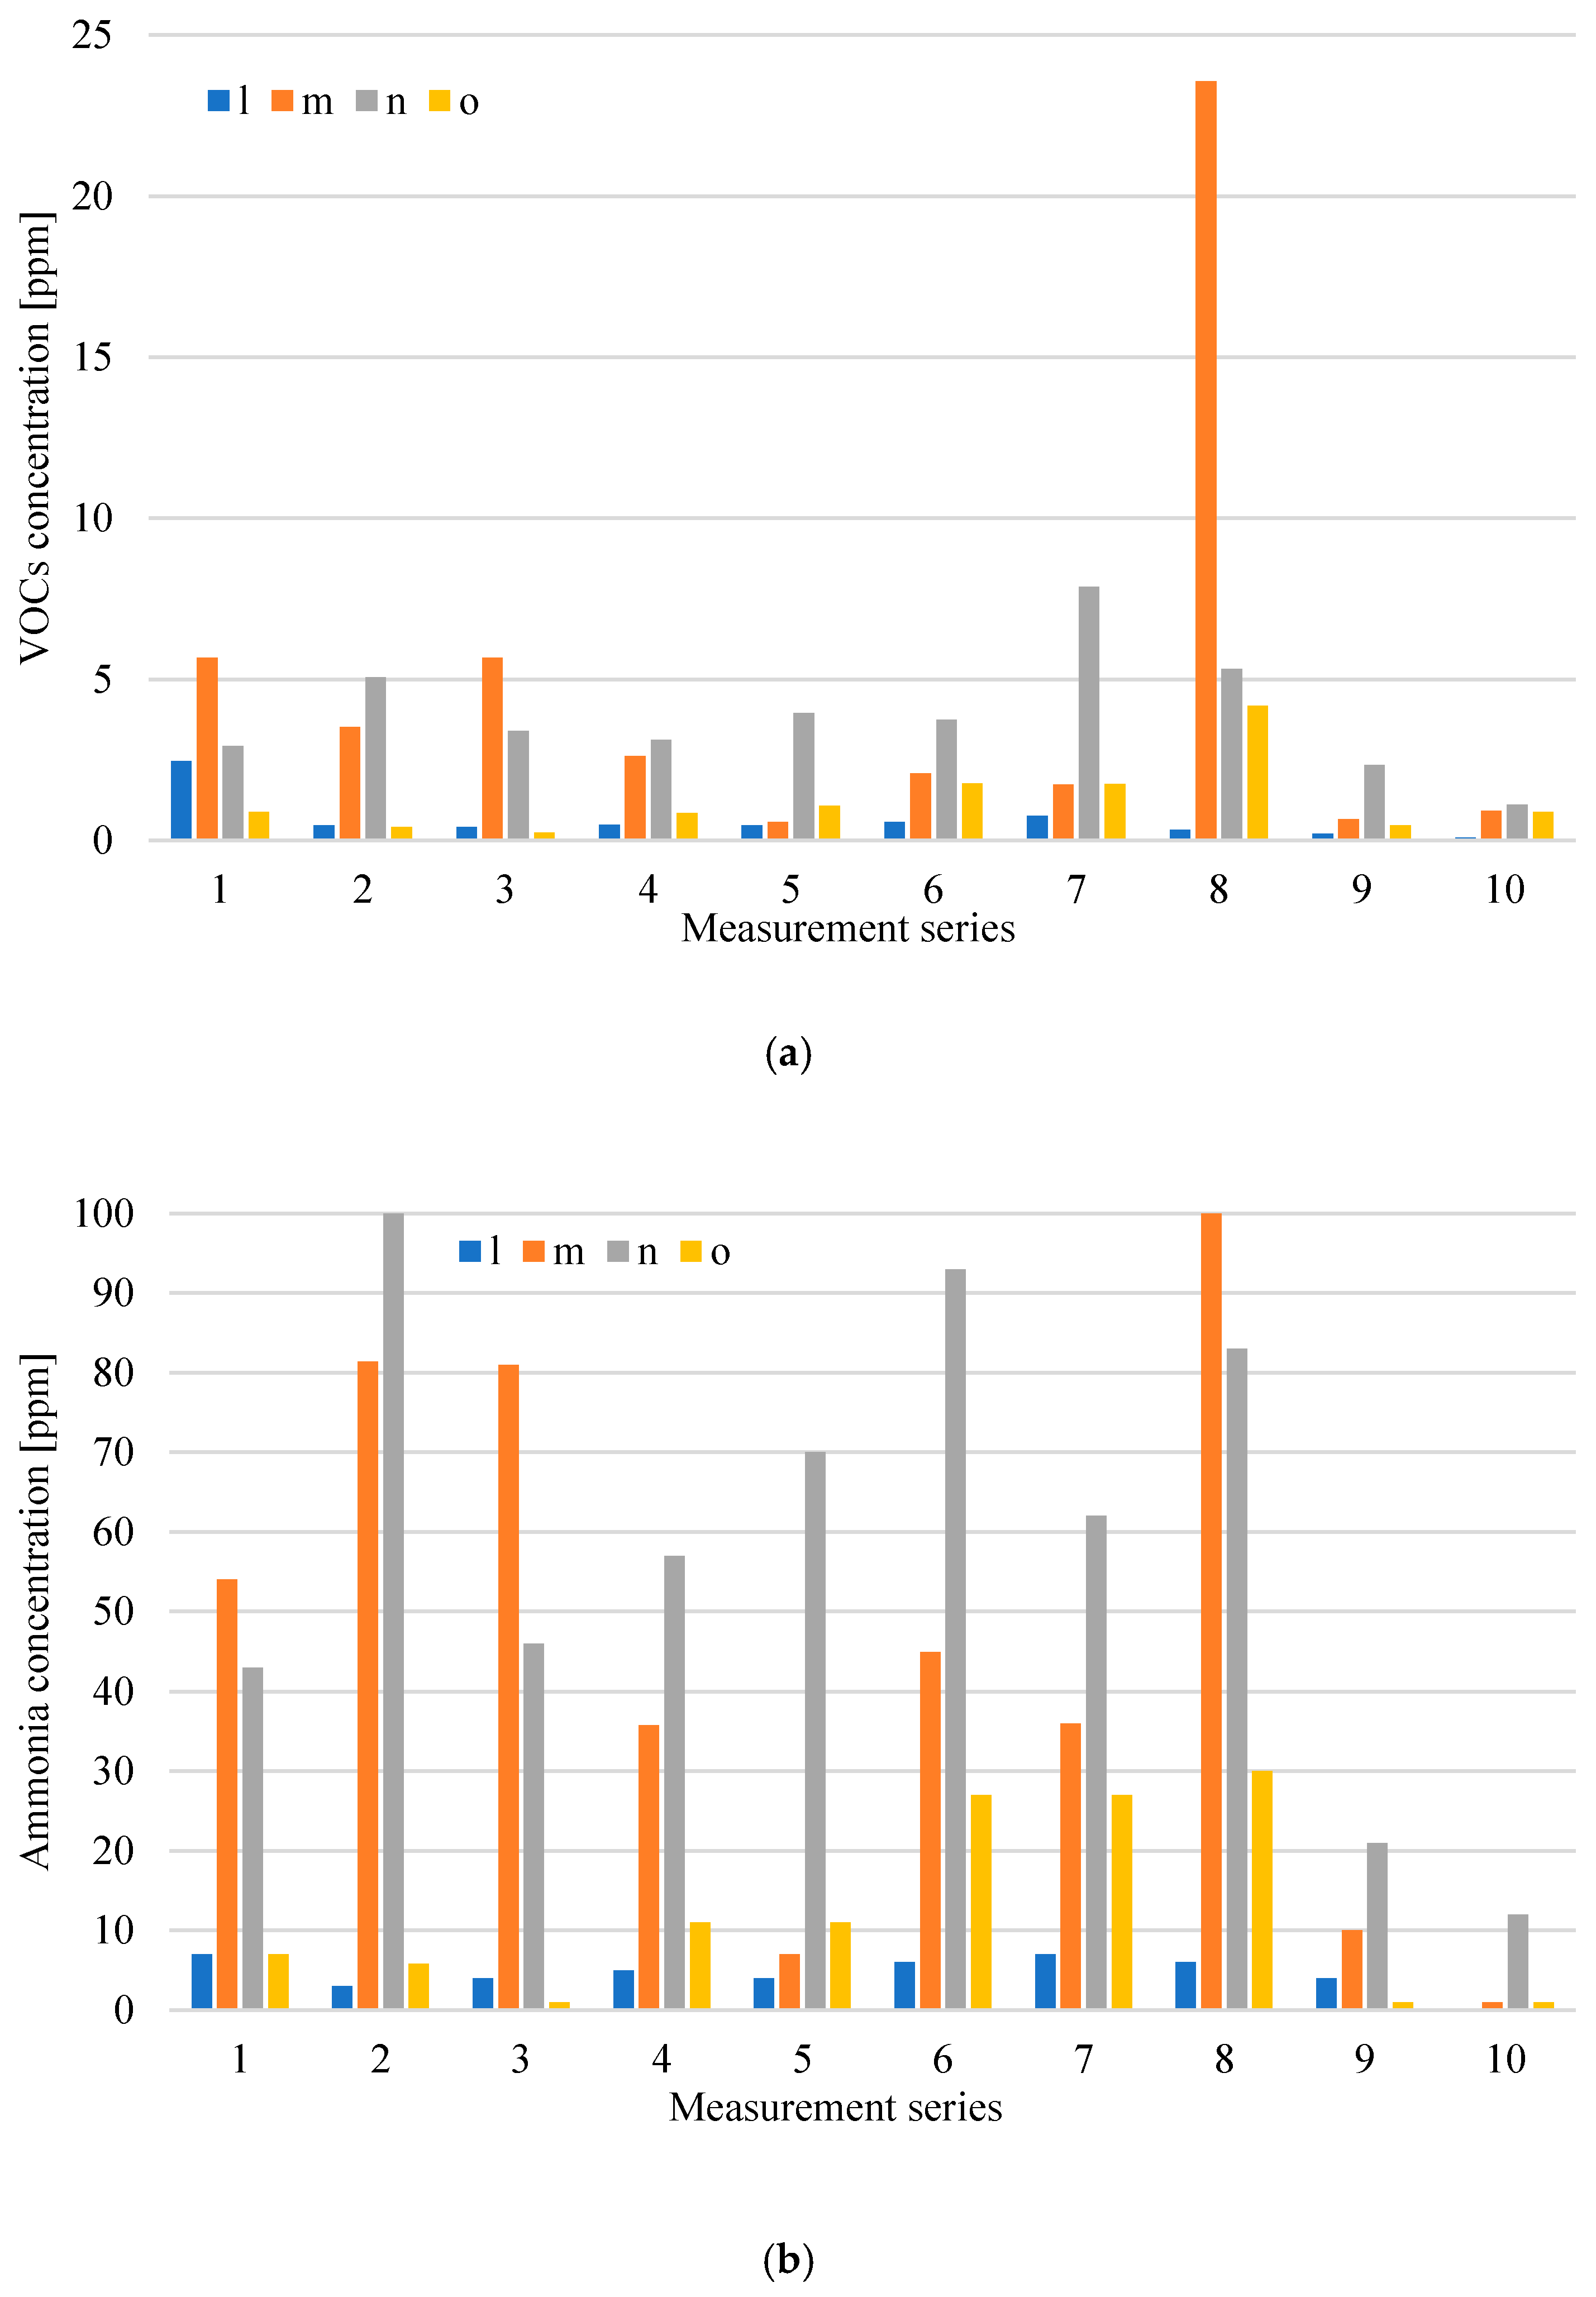
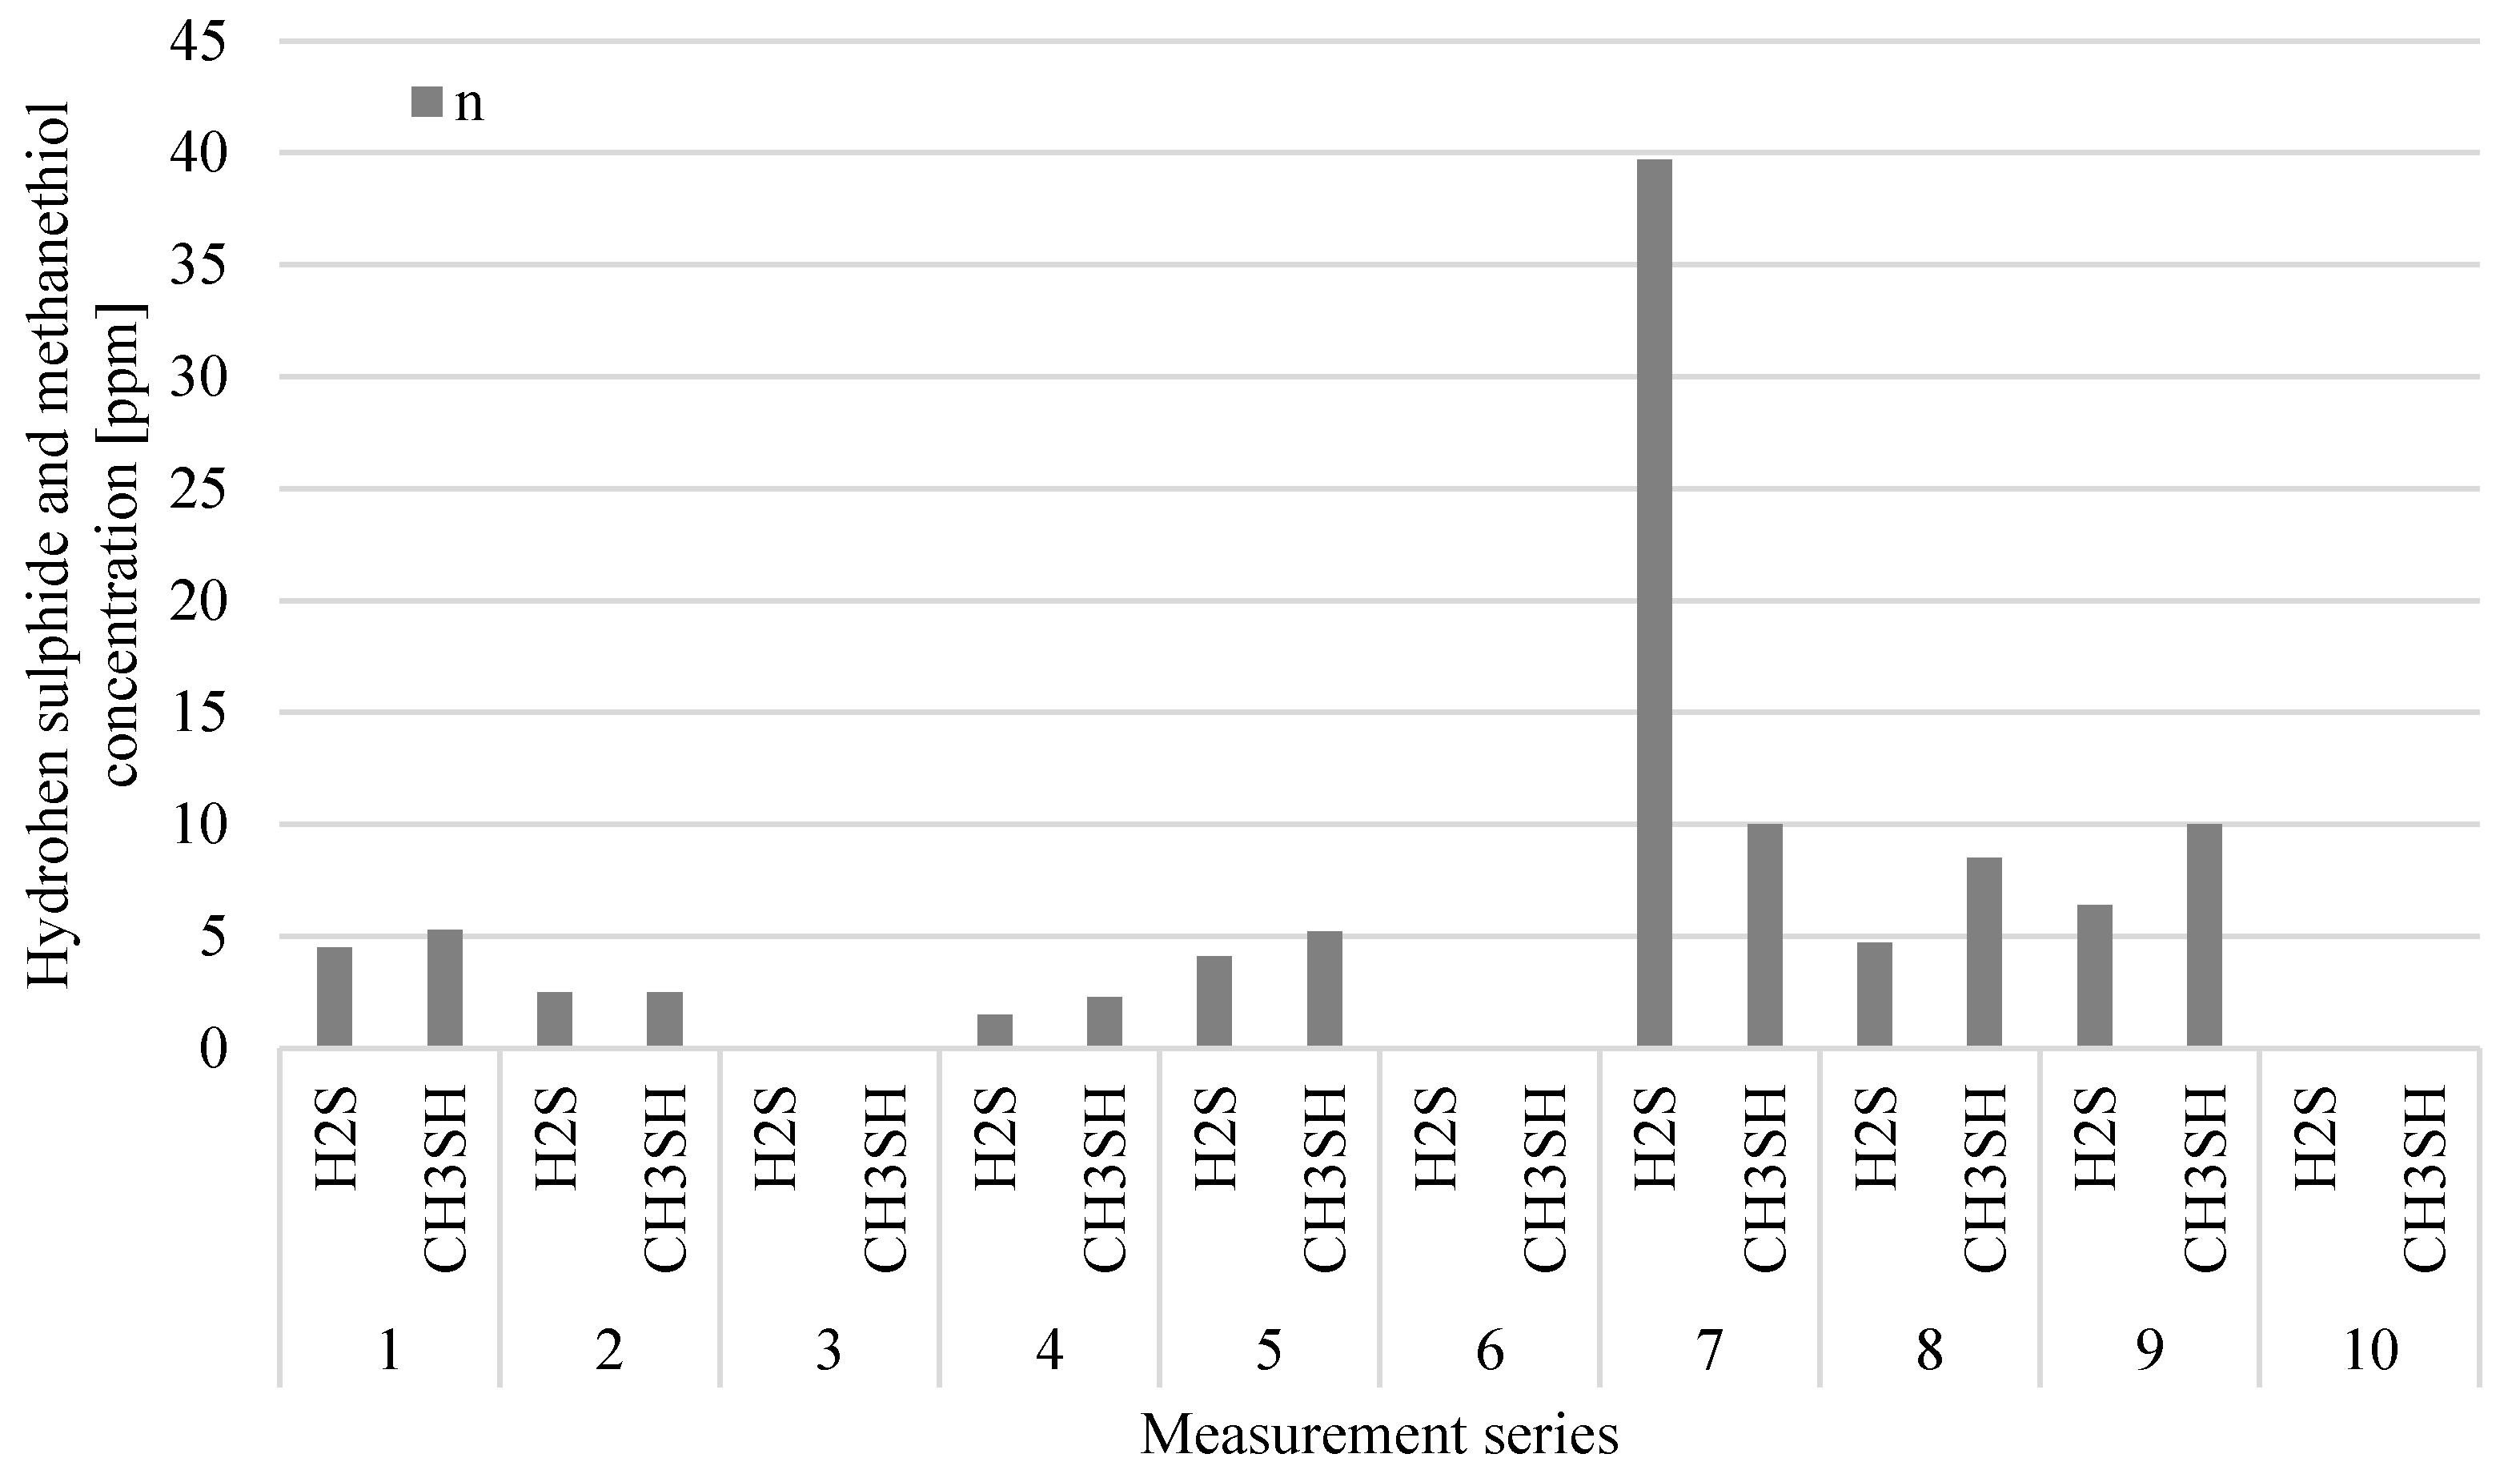
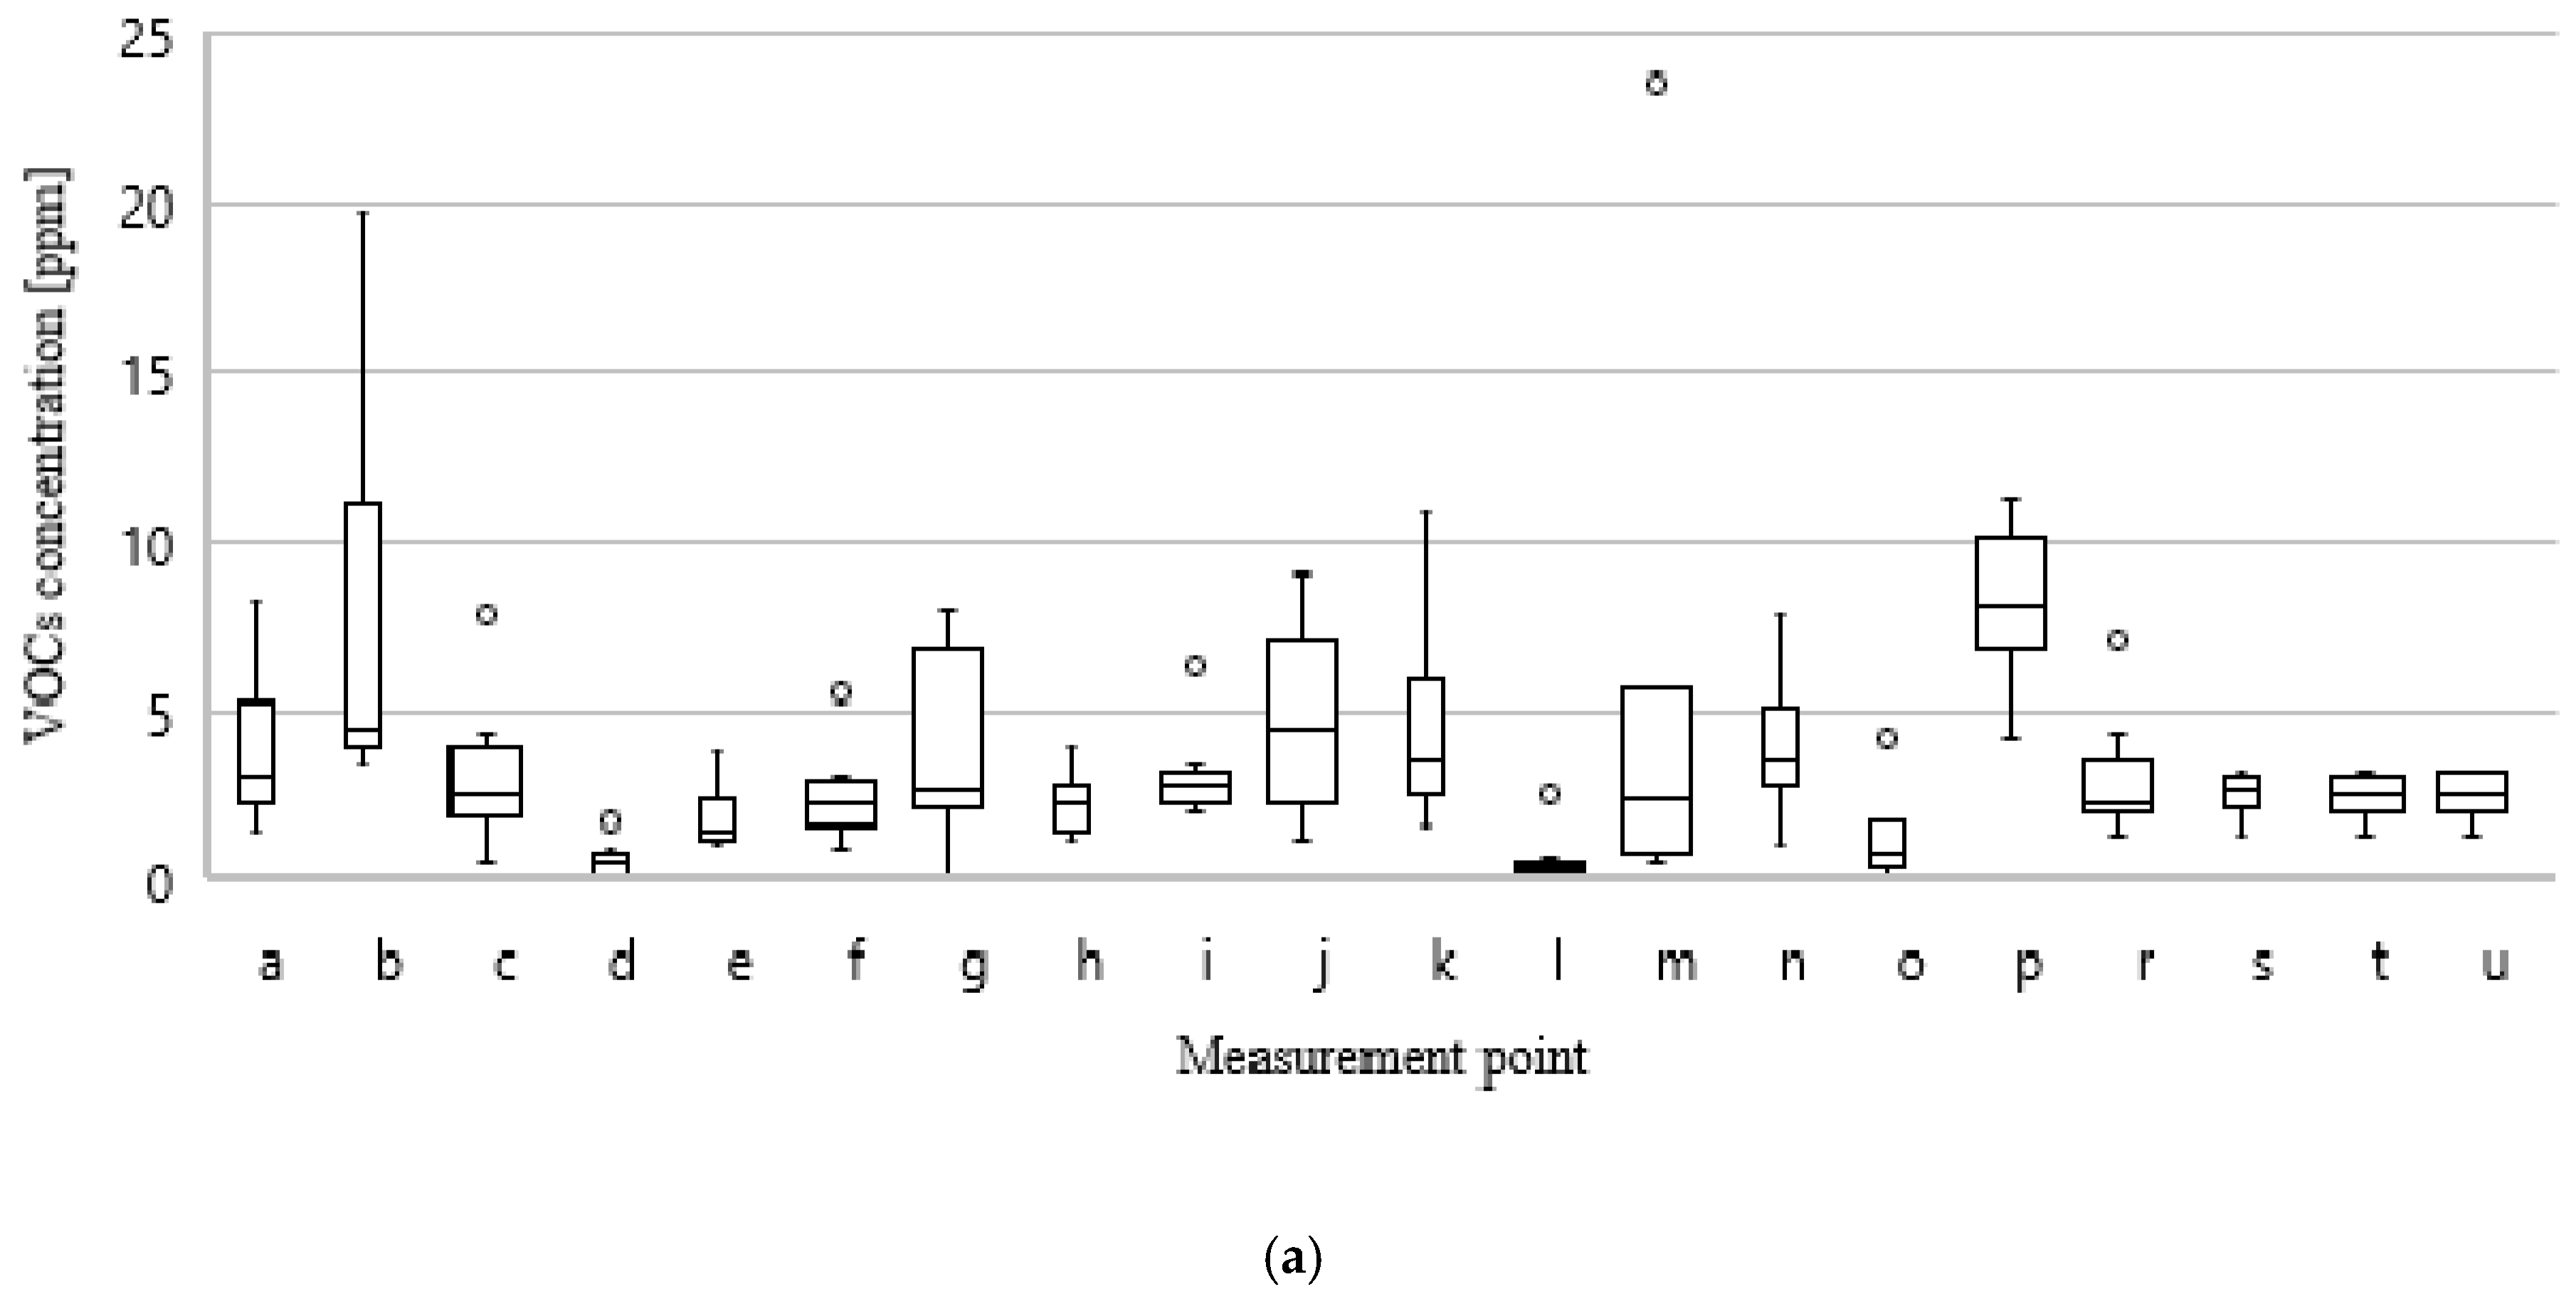
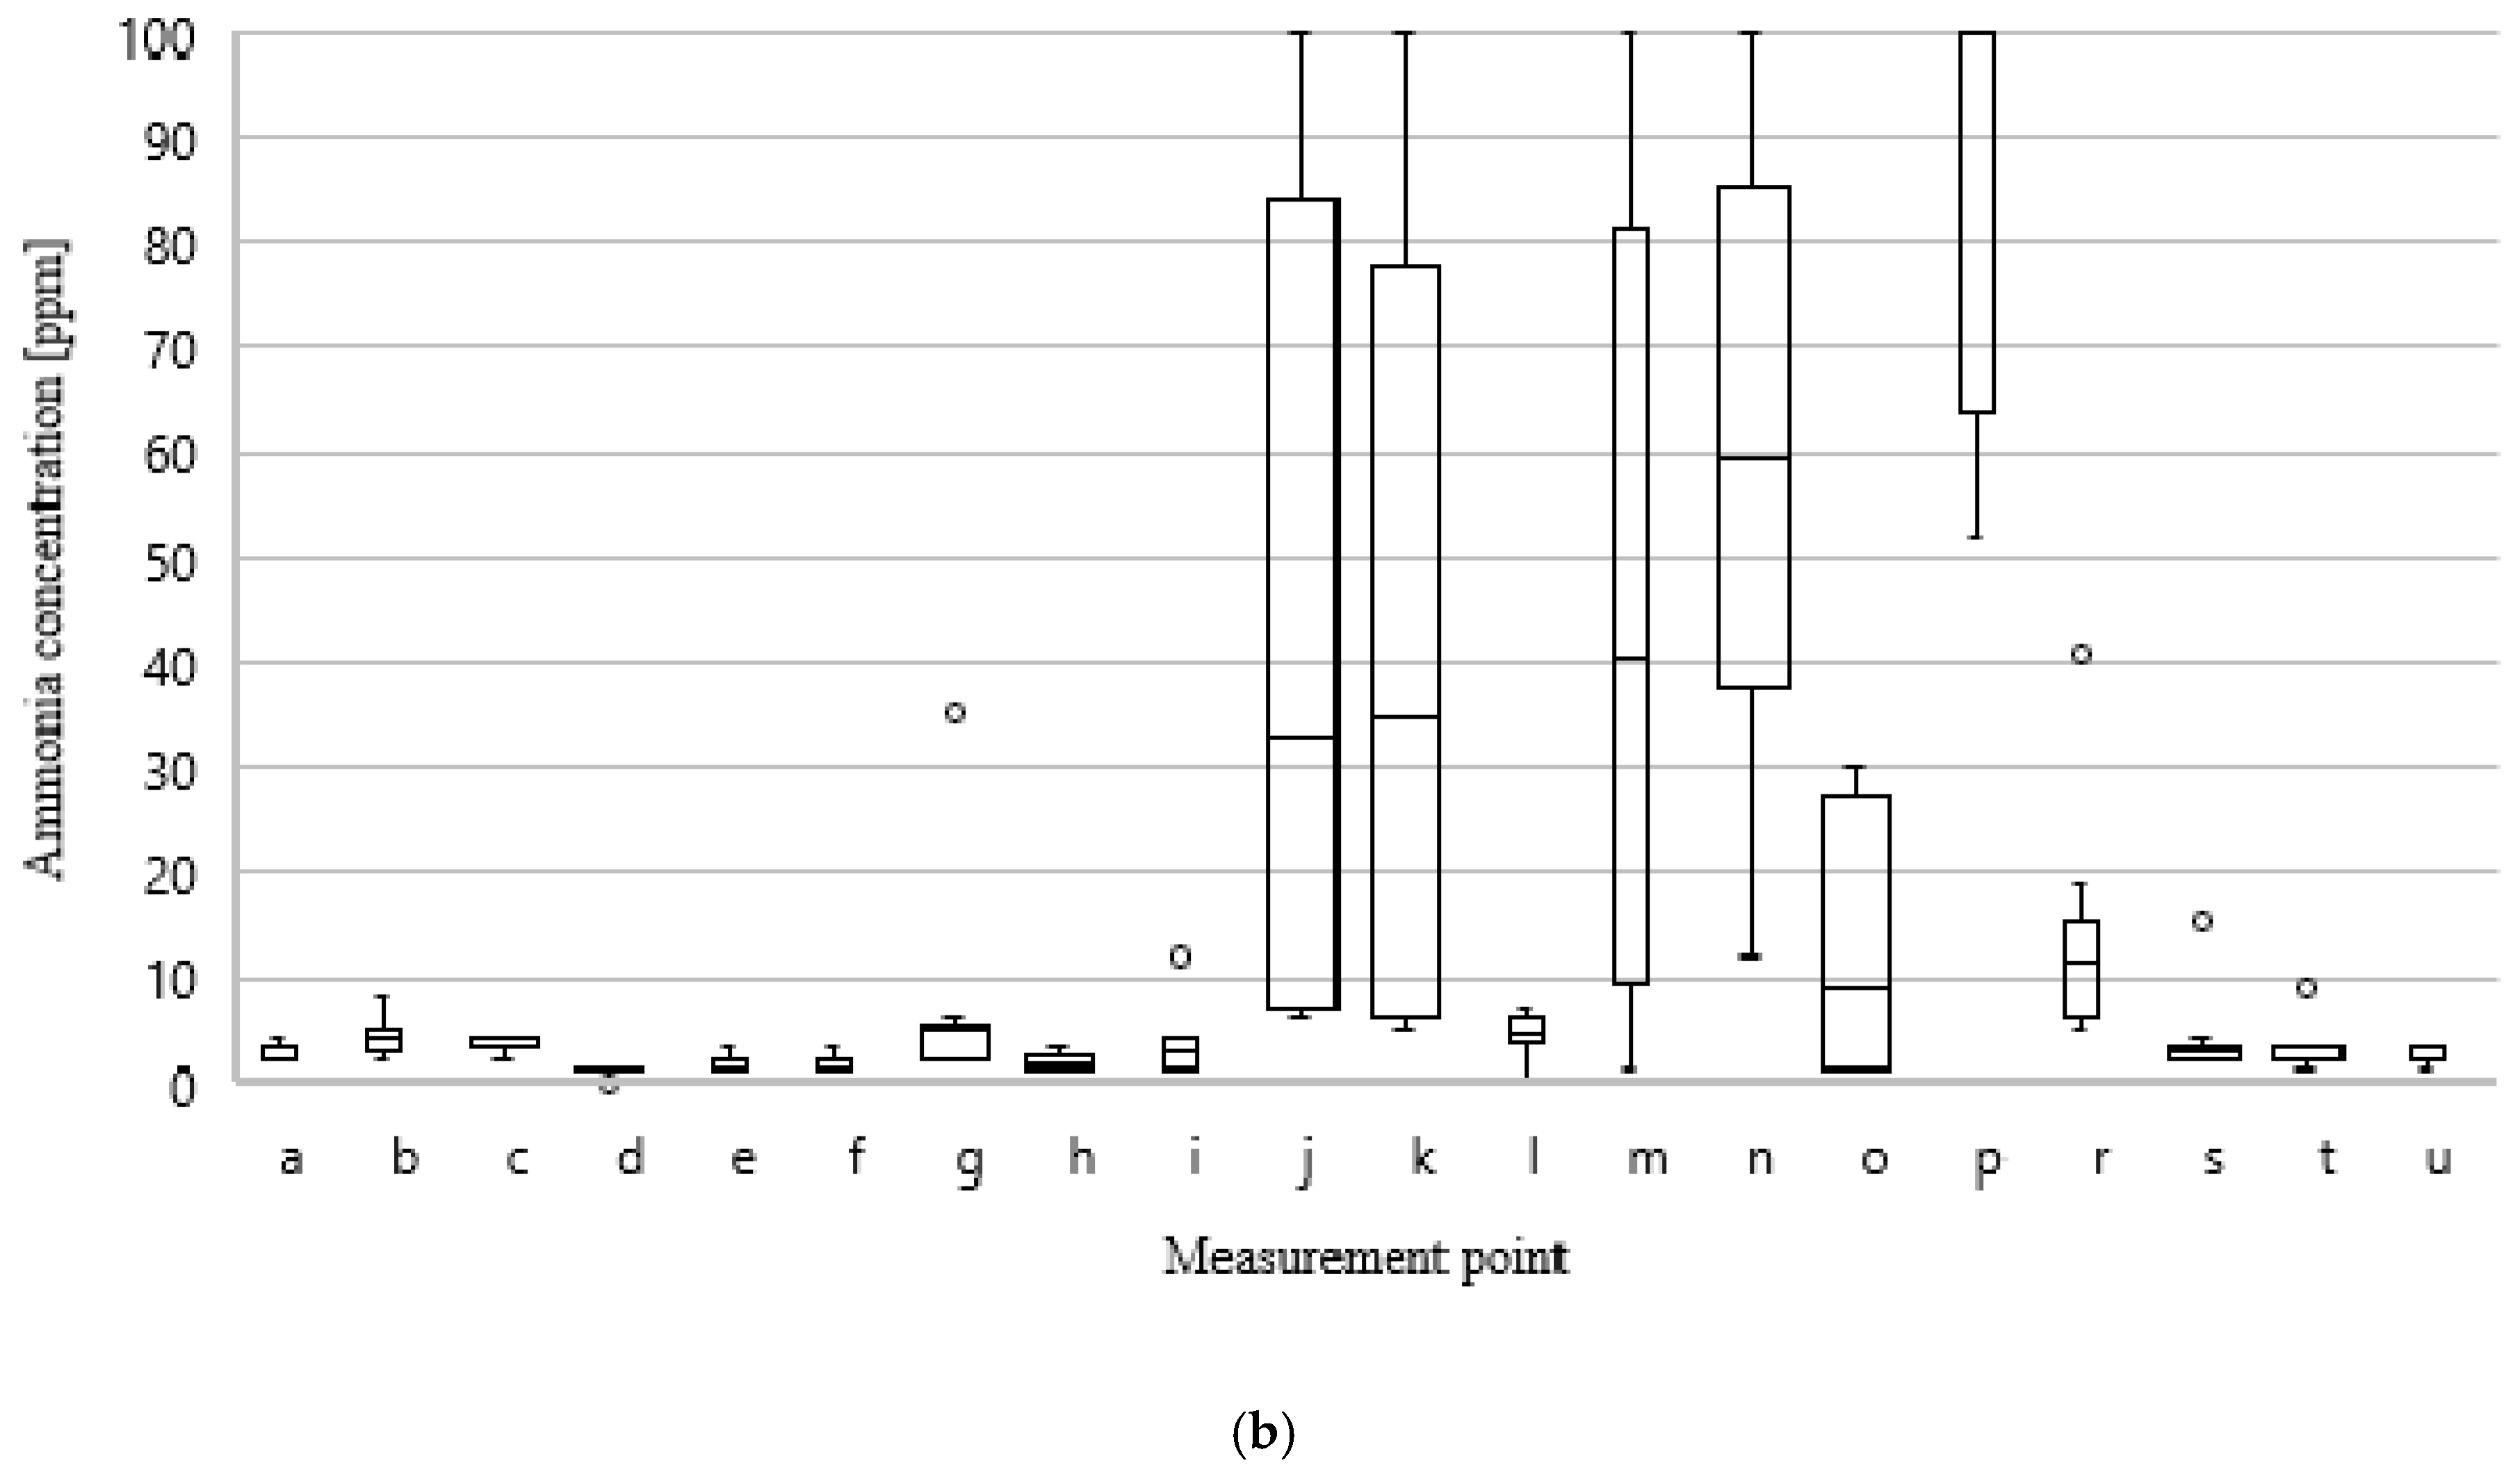
- The biggest VOCs concentrations are associated with mixed-waste storage (19.79 ppm) and aerobic stabilization of 1st-degree digestate (23.56 ppm). In turn, the highest NH3 concentrations accompany such technological processes as digestate dewatering (technological wastewater storage: 100 ppm) and 1st-stage oxygen digestate stabilization (100 ppm). The highest CH3SH concentrations also accompany the storage of mixed municipal waste, as well as digestate dewatering and 1st-stage oxygen stabilization (10 ppm). The biggest concentration of hydrogen sulphide is associated with the storage of wastewater from the digestate aerobic stabilization process (40 ppm), which indicates too long storage time and is the result of operational irregularities.
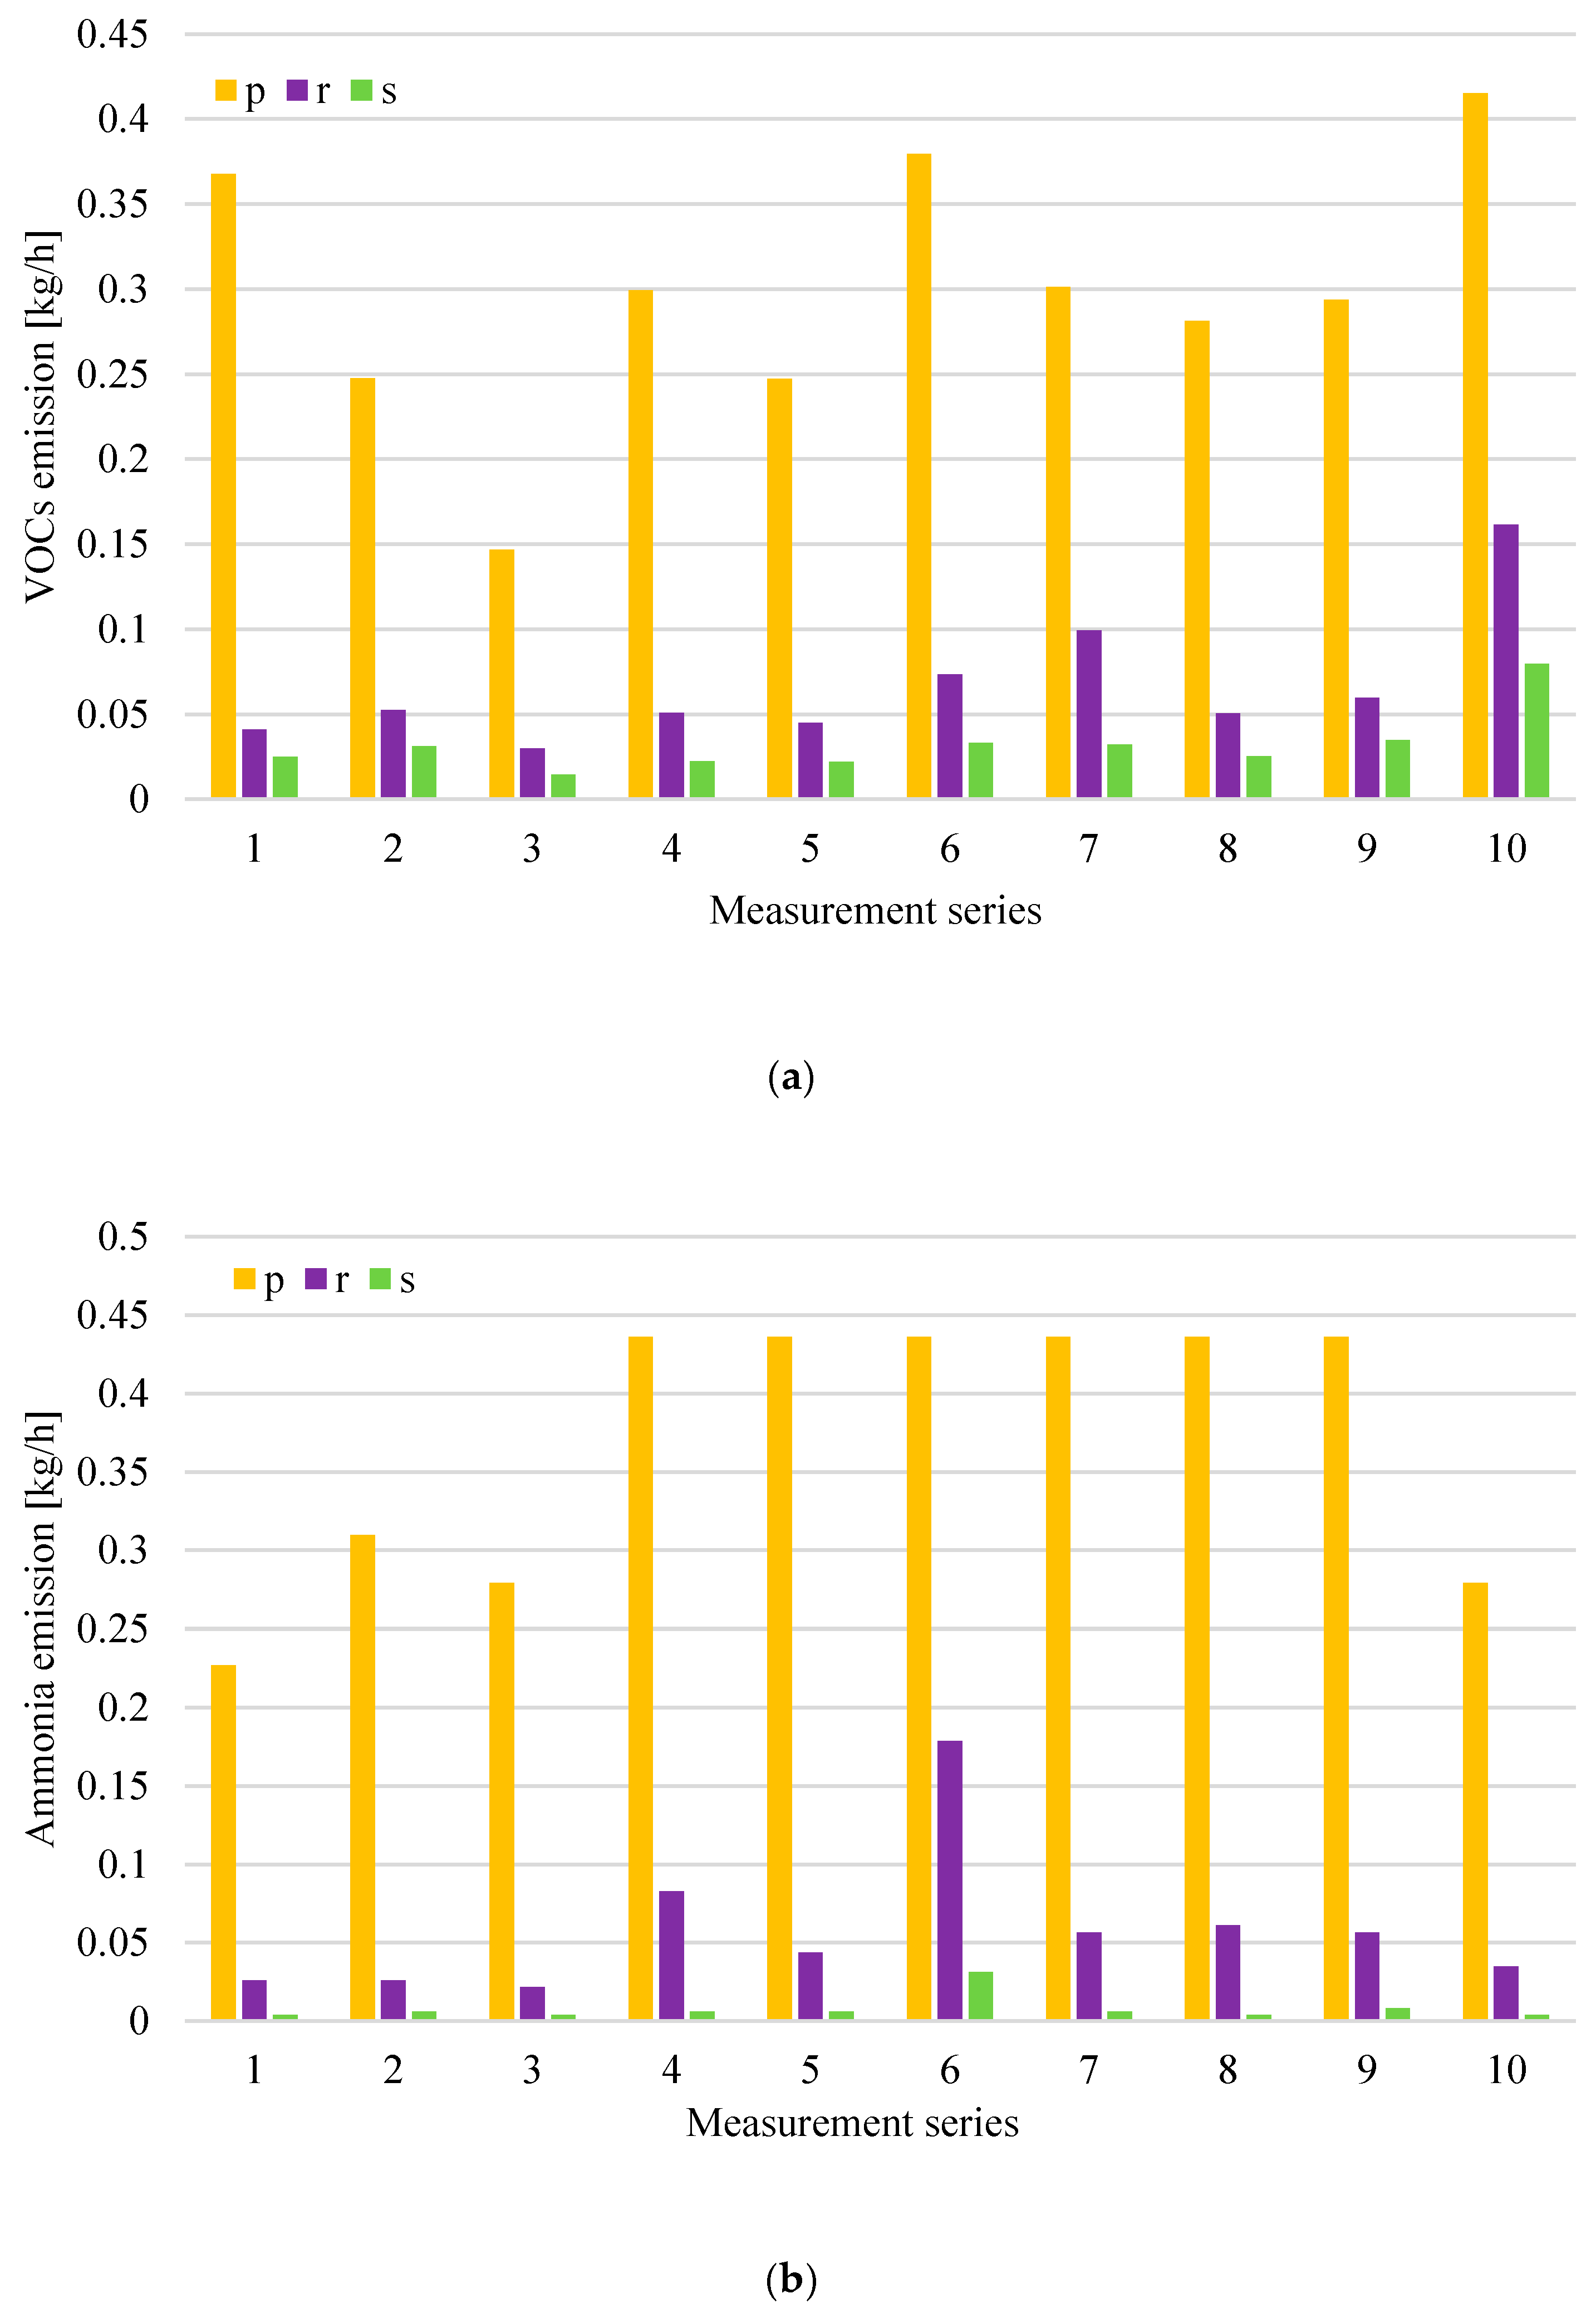
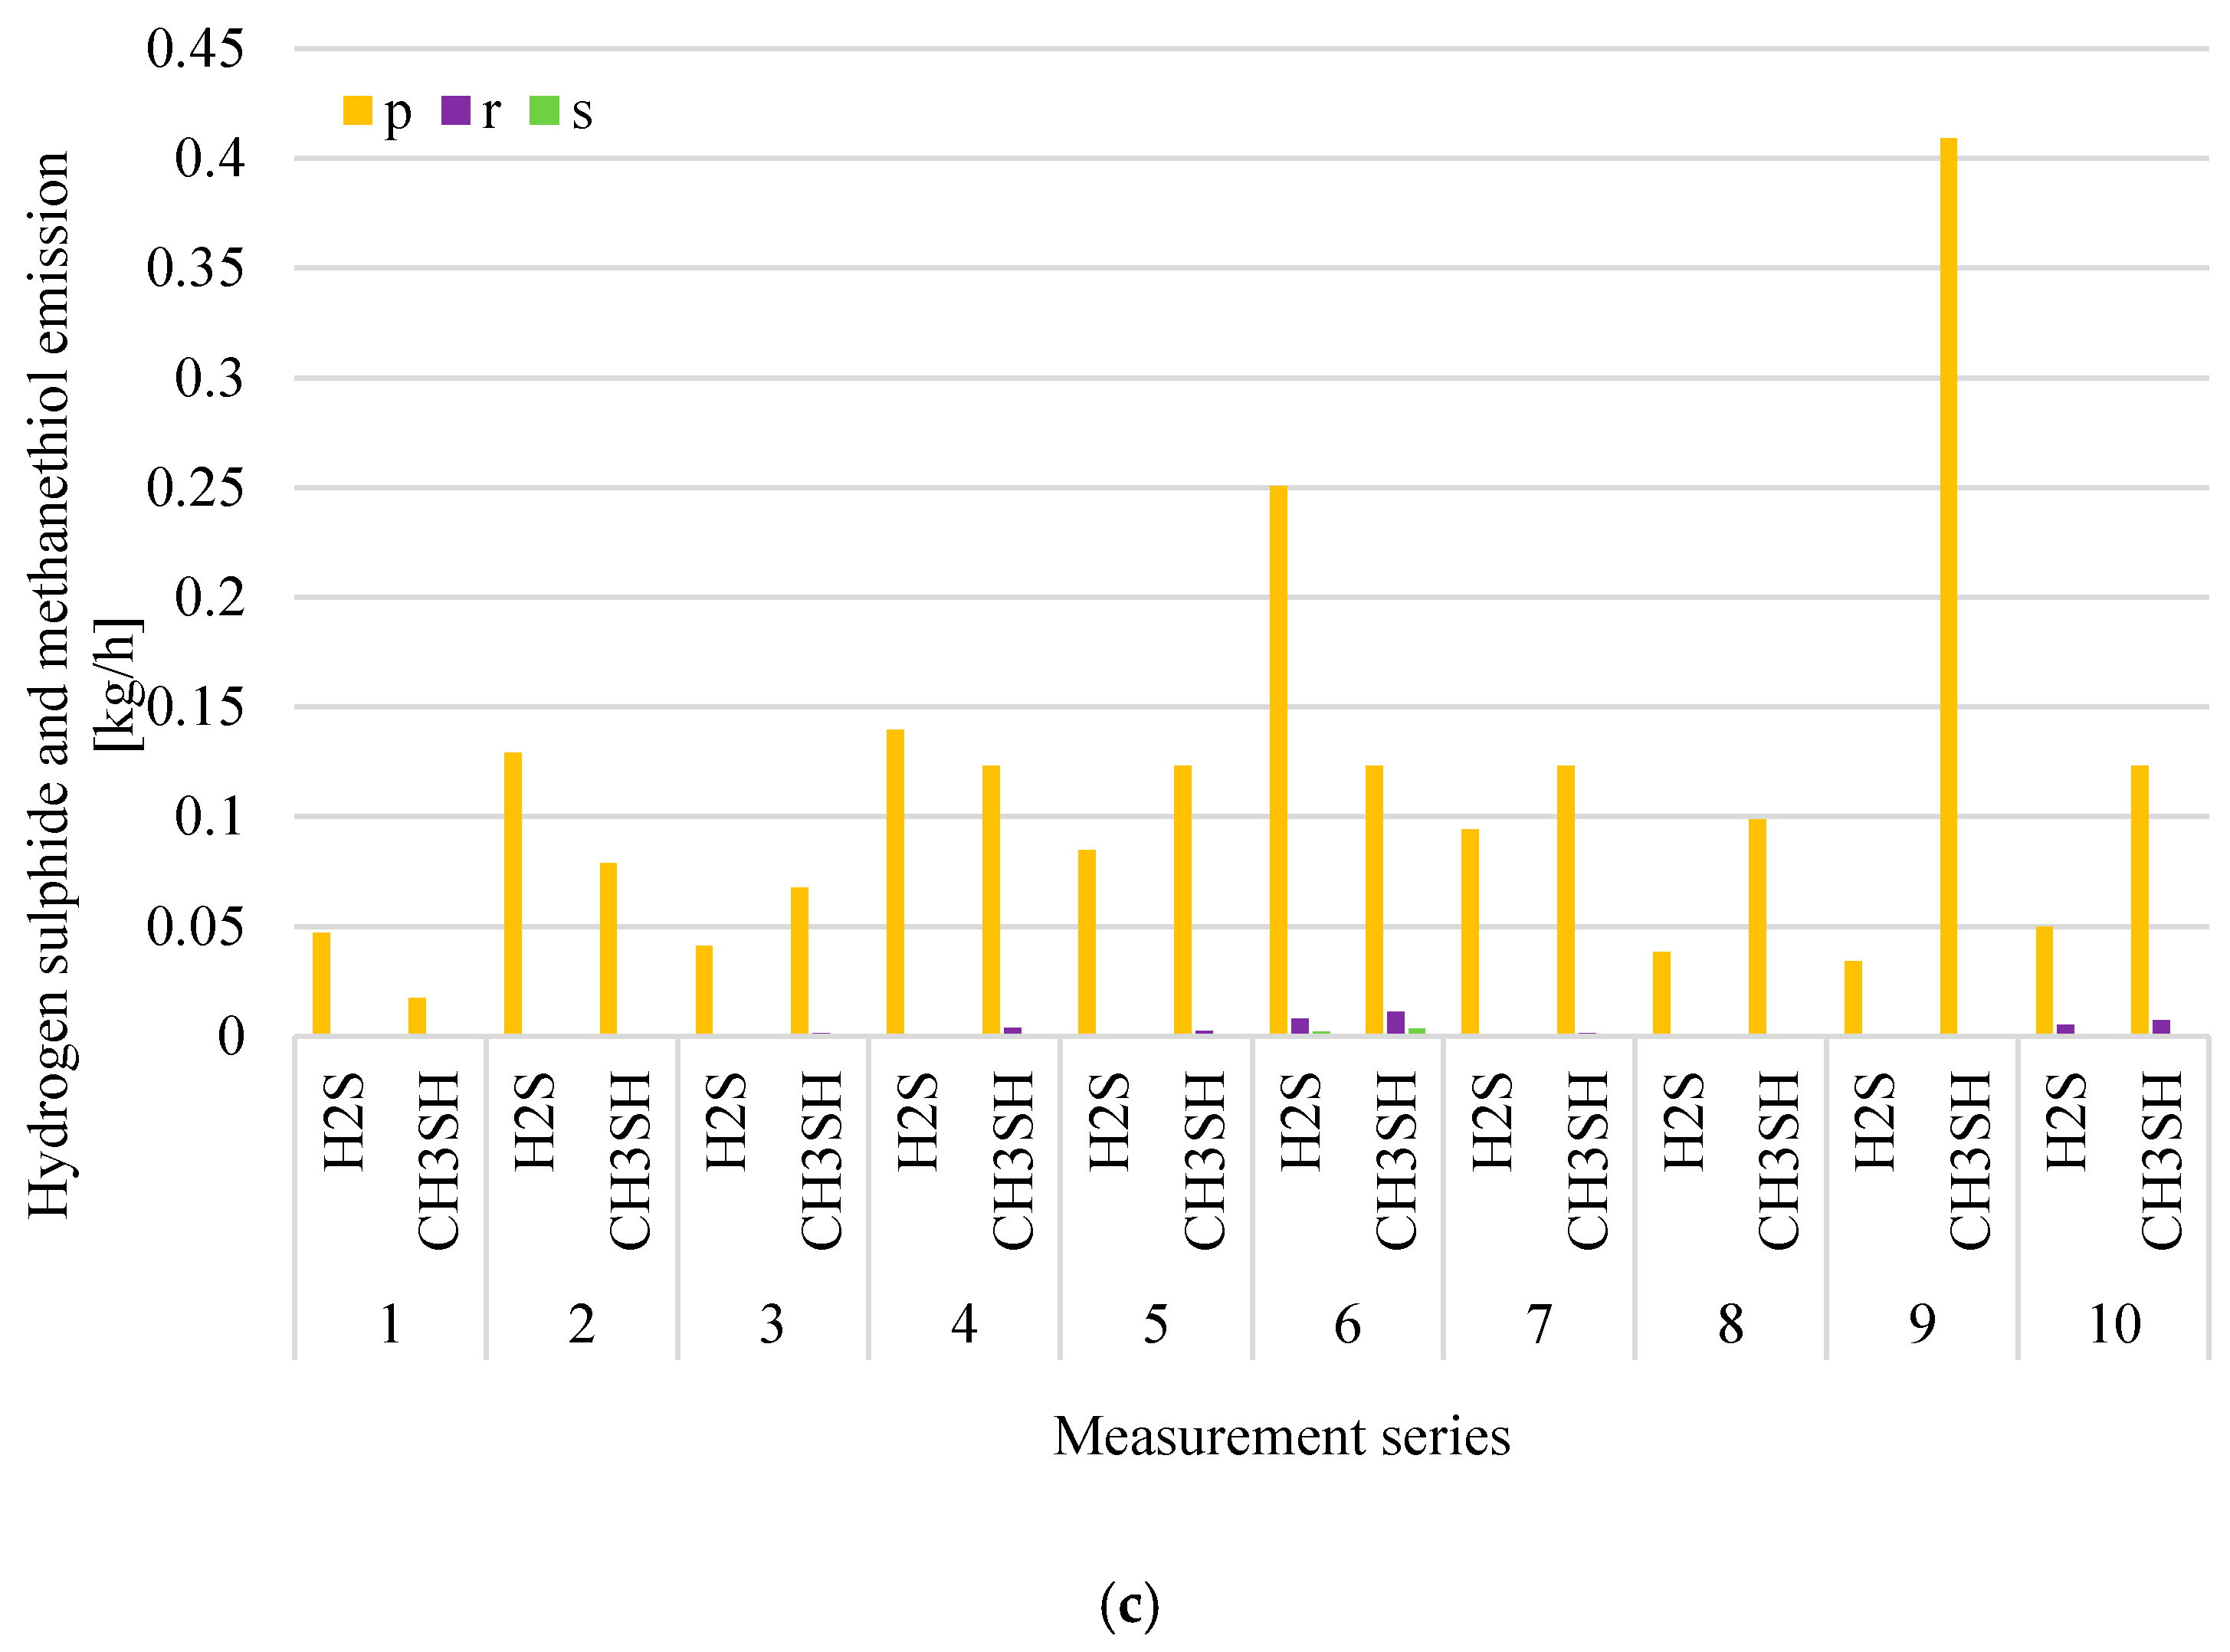
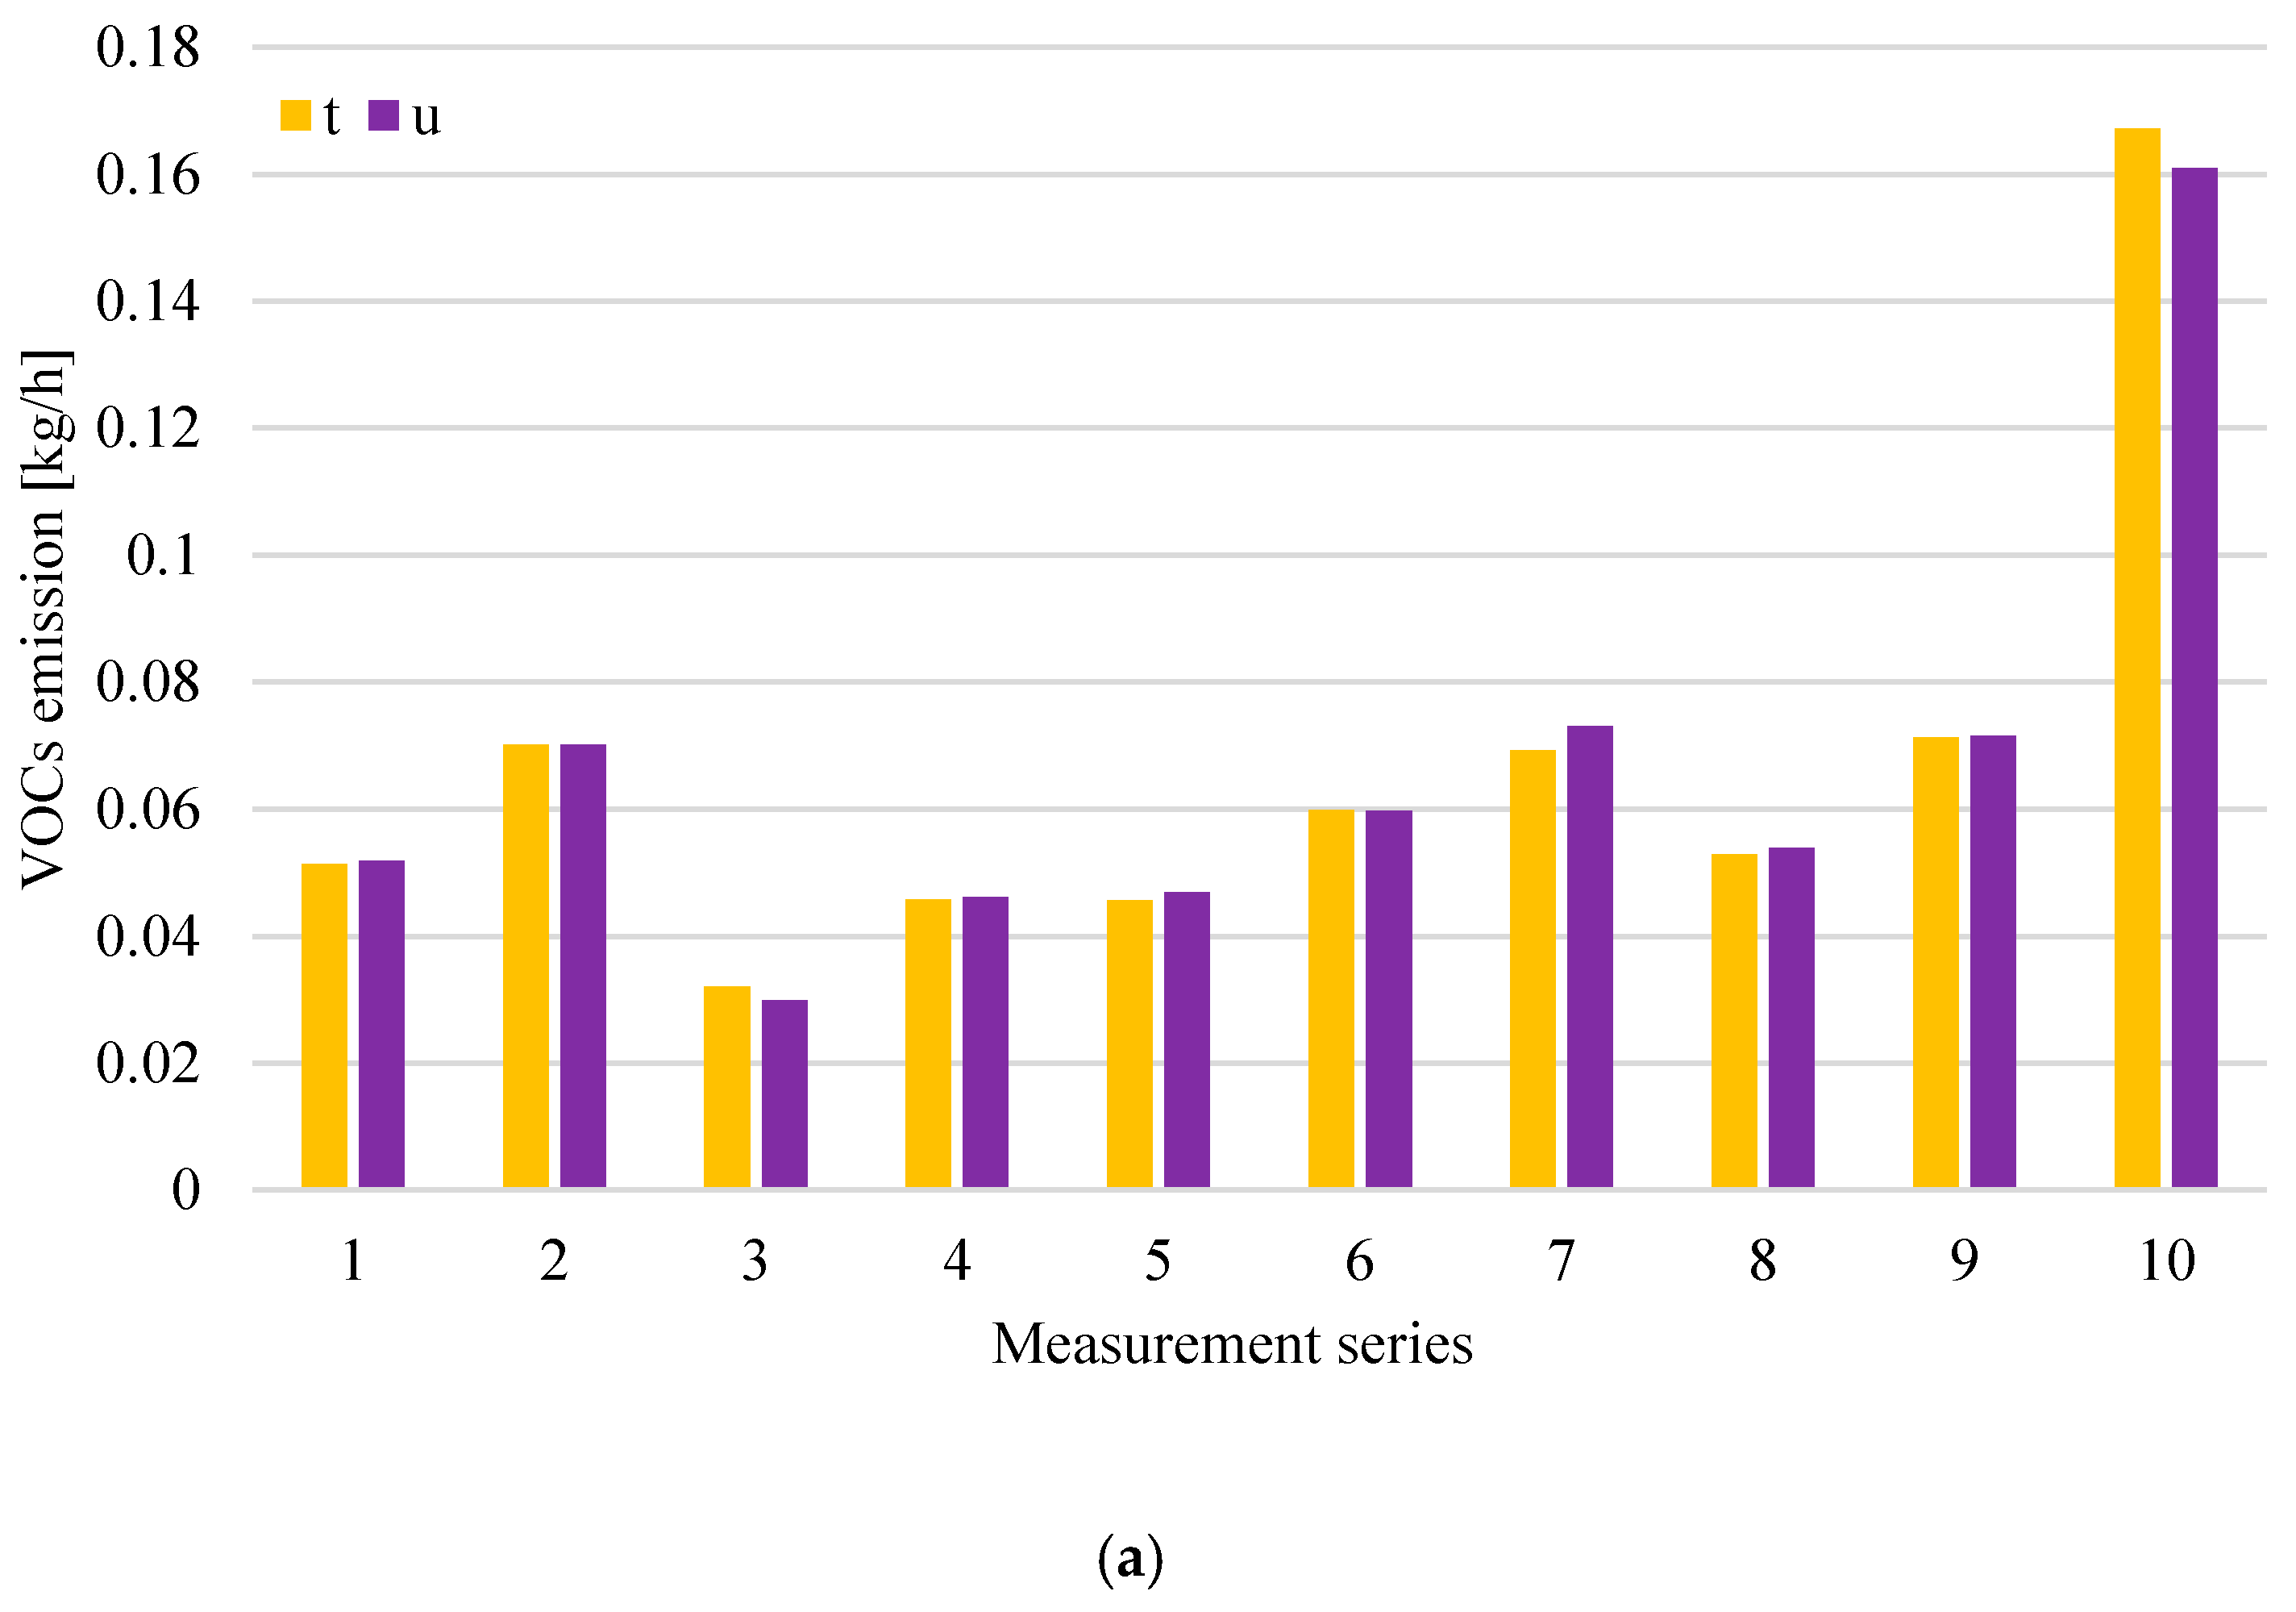
- The highest emissions of odorants tested—to 0.42 kg/h (VOCs), 0.44 kg/h (NH3), 0.41 kg/h (CH3SH), and to 0.25 kg/h (H2S)–are emissions from a roof ventilator which has its air intake located above the mixed-waste storage.
- The following factors affect the concentration of the odorants tested, and thus the volume of emissions:
- a municipal waste collection system in the service area (clearly higher odorant concentrations accompany storage and mechanical treatment of mixed municipal waste in relation to selectively collected waste);
- trouble-free and continuous work of the technological line in the waste processing plant (the sources of uncontrolled and increased odorant emissions are periodically occurring technological line failures);
- technological operations related to the unloading of transported waste and internal transport of waste in the processing plant (especially with loaders and conveyors);
- keeping equipment and storage places clean at the waste treatment plant;
- compliance with the technological regime and operational correctness.
- The largest differences in VOCs and NH3 concentrations occur at measurement points related to the storage of mixed waste and preRDF, with the collection of technological wastewater (both from digestate dewatering and its oxygen stabilization) and waste directed to the aerobic process. In this case, the type of waste processed and the type of technological and operational measures taken are of fundamental importance.
- The odour nuisance of waste management plants, including municipal waste biogas plants, should be minimised by adapting the processes carried out to the best available techniques BAT conclusions [43].
- The detector used during the research is a valuable tool enabling control of technological processes in such facilities.
- Further research should combine olfactometric and meteorological tests in addition to odorants.
Author Contributions
Funding
Conflicts of Interest
References
- Achinas, S.; Achinas, V.; Euverink, G.J.W. A Technological Overview of Biogas Production from Biowaste. Engineering 2017, 3, 299–307. [Google Scholar] [CrossRef]
- van Foreest, F. Perspectives for Biogas in Europe; Oxford Institute for Energy Studies: Oxfordshire, UK, 2012. [Google Scholar]
- Nishio, N.; Nakashimada, Y. Recent development of anaerobic digestion processes for energy recovery from wastes. J. Biosci. Bioeng. 2007, 103, 105–112. [Google Scholar] [CrossRef]
- Cossu, R.; Grossule, V.; Lavagnolo, M.C. Sustainable low-cost waste management: Learning from airlines. Multidiscip. J. Waste Resour. Residues 2019, 6. [Google Scholar] [CrossRef]
- Burlakovs, J.; Jani, Y.; Kriipsalu, M.; Vincevica-Gaile, Z.; Kaczala, F.; Celma, G.; Ozola, R.; Rozina, L.; Rudovica, V.; Hogland, M.; et al. On the way to ‘zero waste’ management: Recovery potential of elements, including rare earth elements, from fine fraction of waste. J. Clean. Prod. 2018, 186, 81–90. [Google Scholar] [CrossRef]
- Burlakovs, J.; Kriipsalu, M.; Porshnov, D.; Jani, Y.; Ozols, V.; Pehme, K.M.; Rudovica, V.; Grinfelde, I.; Pilecka, J.; Vincevica-Gaile, Z.; et al. Gateway of Landfilled Plastic Waste Towards Circular Economy in Europe. Separations 2019, 6, 25. [Google Scholar] [CrossRef]
- Raga, R.; Cossu, R.; Heerenklage, J.; Pivato, A.; Ritzkowski, M. Landfill aeration for emission control before and during landfill mining. Waste Manag. 2015, 46, 420–429. [Google Scholar] [CrossRef]
- Holm-Nielsen, J.B.; Oleskowicz-Popiel, P. Process control in biogas plants. In The Biogas Handbook; Woodhead Publishing: Sawston, UK, 2013; pp. 228–247. [Google Scholar] [CrossRef]
- Atelge, M.R.; Krisa, D.; Kumar, D.; Eskicioglu, C.; Nguyen, D.D.; Chang, S.W.; Atabani, A.E.; Al-Muhtaseb, A.H.; Unalan, S. Biogas Production from Organic Waste: Recent Progress and Perspectives. Waste Biomass Valorization 2020, 11, 1019–1040. [Google Scholar] [CrossRef]
- Orzi, V.; Scaglia, B.; Lonati, S.; Riva, C.; Boccasile, G.; Alborali, G.L.; Adani, F. The role of biological processes in reducing both odor impact and pathogen content during mesophilic anaerobic digestion. Sci. Total Environ. 2015, 526, 116–126. [Google Scholar] [CrossRef]
- Byliński, H.; Sobecki, A.; Gębicki, J. The Use of Artificial Neural Networks and Decision Trees to Predict the Degree of Odor Nuisance of Post-Digestion Sludge in the Sewage Treatment Plant Process. Sustainability 2019, 11, 4407. [Google Scholar] [CrossRef]
- Ighravwe, D.E.; Babatunde, D.E. Evaluation of landfill gas plant siting problem: A multi-criteria approach. Environ. Health Eng. Manag. J. 2019, 6, 1–10. [Google Scholar] [CrossRef]
- Wiśniewska, M.; Kulig, A.; Lelicińska-Serafin, K. Comparative analysis of preliminary identification and characteristic of odour sources in biogas plants processing municipal waste in Poland. SN Appl. Sci. 2019, 1, 550. [Google Scholar] [CrossRef]
- Wiśniewska, M.; Kulig, A.; Lelicińska-Serafin, K. Odour Emissions of Municipal Waste Biogas Plants—Impact of Technological Factors, Air Temperature and Humidity. Appl. Sci. 2020, 10, 1093. [Google Scholar] [CrossRef]
- Delgado-Rodríguez, M.; Ruiz-Montoya, M.; Giráldez, I.; López, R.; Madejón, E.; Díaz, M.J. Effect of aeration rate and moisture content on the emissions of selected VOCs during municipal solid waste composting. J. Mater. Cycles Waste Manag. 2012, 14, 371–378. [Google Scholar] [CrossRef]
- Szulczyński, B.; Gębicki, J. Currently Commercially Available Chemical Sensors Employed for Detection of Volatile Organic Compounds in Outdoor and Indoor Air. Environments 2017, 4, 21. [Google Scholar] [CrossRef]
- Zabiegała, B.; Partyka, M.; Zygmunt, B.; Namieśnik, J. Determination of volatile organic compounds in indoor air in the Gdansk area using permeation passive samplers. Indoor Built Environ. 2009, 18, 492–504. [Google Scholar] [CrossRef]
- European Commission. Council directive 1999/13/EC of 11 March 1999 on the limitation of emissions of volatile organic compounds due to the use of organic solvents in certain activities and installations. Offic. J. Eur. Commun. 1999, 85, 1–24. [Google Scholar]
- Font, X.; Artola, A.; Sánchez, A. Detection, Composition and Treatment of Volatile Organic Compounds from Waste Treatment Plants. Sensors 2011, 11, 4043–4059. [Google Scholar] [CrossRef]
- Capelli, L.; Sironi, S.; Del Rosso, R.; Céntola, P.; Rossi, A.; Austeri, C. Odour impact assessment in urban areas: Case study of the city of Terni. Procedia Environ. Sci. 2011, 4, 151–157. [Google Scholar] [CrossRef]
- De Feo, G.; De Gisi, S.; Williams, I.D. Public perception of odour and environmental pollution attributed to MSW treatment and disposal facilities: A case study. Waste Manag. 2013, 33, 974–987. [Google Scholar] [CrossRef]
- Kim, K.H.; Jo, S.H.; Song, H.C.; Pandey, S.K.; Song, H.N.; Oh, J.M.; Sunwoo, Y.; Choi, K.C. Diagnostic analysis of offensive odorants in a large municipal waste treatment plant in an urban area. Int. J. Environ. Sci. Technol. 2013, 10, 261–274. [Google Scholar] [CrossRef]
- Orzi, V.; Riva, C.; Scaglia, B.; D’Imporzano, G.; Tambone, F.; Adani, F. Anaerobic digestion coupled with digestate injection reduced odour emissions from soil during manure distribution. Sci. Total Environ. 2018, 621, 168–176. [Google Scholar] [CrossRef] [PubMed]
- Chang, H.; Zhao, Y.; Tan, H.; Liu, Y.; Lu, W. Parameter sensitivity to concentrations and transport distance of odorous compounds from solid waste facilities. Sci. Total Environ. 2019, 651, 2158–2165. [Google Scholar] [CrossRef]
- World Health Organization Publications. Air Quality Guidelines for Europe; European Series No. 91; World Health Organization: Copenhagen, Denmark, 2000. [Google Scholar]
- Bax, C.; Sironi, S.; Capelli, L. How Can Odors Be Measured? An Overview of Methods and Their Applications. Atmosphere 2020, 11, 92. [Google Scholar] [CrossRef]
- Rincón, C.A.; De Guardia, A.; Couvert, A.; Le Roux, S.; Soutrel, I.; Daumoin, M.; Benoist, J.C. Chemical and odor characterization of gas emissions released during composting of solid wastes and digestates. J. Environ. Manag. 2019, 233, 39–53. [Google Scholar] [CrossRef] [PubMed]
- Eitzer, B.D. Emissions of volatile organic chemicals from municipal solid waste composting facilities. Environ. Sci. Technol. 1995, 29, 896–902. [Google Scholar] [CrossRef] [PubMed]
- Delgado-Rodríguez, M.; Ruiz-Montoya, M.; Giraldez, I.; Cabeza, I.O.; López, R.; Díaz, M.J. Effect of control parameters on emitted volatile compounds in municipal solid waste and pine trimmings composting. J. Environ. Sci. Health Toxic/Hazard. Subst. Environ. Eng. 2010, 45, 855–862. [Google Scholar] [CrossRef]
- Brattoli, M.; de Gennaro, G.; de Pinto, V.; Loiotile, A.D.; Lovascio, S.; Penza, M. Odour Detection Methods: Olfactometry and Chemical Sensors. Sensors 2011, 11, 5290–5322. [Google Scholar] [CrossRef]
- Szulczyński, B.; Wasilewski, T.; Wojnowski, W.; Majchrzak, T.; Dymerski, T.; Namieśnik, J.; Gębicki, J. Different Ways to Apply a Measurement Instrument of E-Nose Type to Evaluate Ambient Air Quality with Respect to Odour Nuisance in a Vicinity of Municipal Processing Plants. Sensors 2017, 17, 2671. [Google Scholar] [CrossRef]
- Wiśniewska, M. Methods of Assessing Odour Emissions from Biogas Plants Processing Municipal Waste. J. Ecol. Eng. 2020, 21, 140–147. [Google Scholar] [CrossRef]
- Laor, Y.; Parker, D.; Pagé, T. Measurement, prediction, and monitoring of odors in the environment: A critical review. Rev. Chem. Eng. 2014, 30, 139–166. [Google Scholar] [CrossRef]
- Spinelle, L.; Gerboles, M.; Kok, G.; Persijn, S.; Sauerwald, T. Review of Portable and Low-Cost Sensors for the Ambient Air Monitoring of Benzene and Other Volatile Organic Compounds. Sensors 2017, 17, 1520. [Google Scholar] [CrossRef] [PubMed]
- Boeker, P. On “Electronic Nose” methodology. Sens. Actuators B Chem. 2014, 204, 2–17. [Google Scholar] [CrossRef]
- Rezende, G.C.; Le Calvé, S.; Brandner, J.J.; Newport, D. Micro photoionization detectors. Sens. Actuators B Chem. 2019, 287, 86–94. [Google Scholar] [CrossRef]
- Stetter, J.R.; Penrose, W.R. Understanding Chemical Sensors and Chemical Sensor Arrays (Electronic Noses): Past, Present, and Future. Sens. Update 2002, 10, 189–229. [Google Scholar] [CrossRef]
- Wilson, A.D. Review of Electronic-nose Technologies and Algorithms to Detect Hazardous Chemicals in the Environment. Procedia Technol. 2012, 1, 453–463. [Google Scholar] [CrossRef]
- Cao, Z.; Buttner, W.J.; Stetter, J.R. The properties and applications of amperometric gas sensors. Electroanalysis 1992, 4, 253–266. [Google Scholar] [CrossRef]
- Bontempelli, G.; Comisso, N.; Toniolo, R.; Schiavon, G. Electroanalytical sensors for nonconducting media based on electrodes supported on perfluorinated ion-exchange membranes. Electroanalysis 1997, 9, 433–443. [Google Scholar] [CrossRef]
- Wiśniewska, M.; Kulig, A.; Lelicińska-Serafin, K. Identification and preliminary characteristics of odour sources in biogas plants processing municipal waste. SHS Web of Conf. 2018, 57, 02016. [Google Scholar] [CrossRef]
- Jia, C.; Cao, K.; Valaulikar, R.; Xianqiang Fu, X.; Sorin, A.B. Variability of Total Volatile Organic Compounds (TVOC) in the Indoor Air of Retail Stores. Int. J. Environ. Res. Public Health 2019, 16, 4622. [Google Scholar] [CrossRef]
- EUR—Lex. Commission Implementing Decision (EU) 2018/1147 of 10 August 2018 establishing best available techniques (BAT) conclusions for waste treatment, under Directive 2010/75/EU of the European Parliament and of the Council. Available online: https://eur-lex.europa.eu/legal-content/EN/TXT/?toc=OJ:L:2018:208:TOC&uri=uriserv:OJ.L_.2018.208.01.0038.01.ENG (accessed on 17 August 2018).


| Sensory Methods | Sensor Methods | Analytical Methods |
|---|---|---|
| sensory evaluation method | electronic nose (e-nose) | gas chromatography (GC); |
| static olfactometry | gas chromatography coupled with mass spectrometry (GC–MS); | |
| dynamic olfactometry, | portable detectors | gas chromatography coupled with olfactometry (GC–O) |
| field olfactometry |
| Mark of Odour Source | Name of Odour Source | Name of the Measurement Point |
|---|---|---|
| a | waste storage plant | inside the hall-centre |
| b | mixed waste * | |
| c | selectively collected waste * | |
| d | mechanical treatment plant | in front of the hall entering |
| e | inside the hall—at 1.5 m | |
| f | inside the hall—at 4.0 m | |
| g | storage shelter | shredded preRDF fraction (pre refuse derived fuel) * |
| h | fermentation preparation plant | inside the hall-centre |
| i | digestate dewatering plant | inside the hall-centre |
| j | over the wastewater tank (after the press) | |
| k | over the wastewater tank (after the centrifuge) | |
| l | oxygen stabilisation plant (1. stage) | inside the hall |
| m | waste subjected to an oxygen stabilization process * | |
| n | the technological wastewater pumping station | over the wastewater tank |
| o | oxygen stabilisation shelter (2. stage) | waste subjected to an oxygen stabilization process * |
| p | roof ventilators from waste storage plant | ventilator 1—process gases captured from over-mixed waste |
| r | ventilator 2—process gases captured from the overhead conveyor transporting waste to the sorting plant | |
| s | ventilator 3—process gases captured from over selectively collected waste | |
| t | roof ventilators from digestate dewatering plant | ventilator 4-inside the hall |
| u | ventilator 5 |
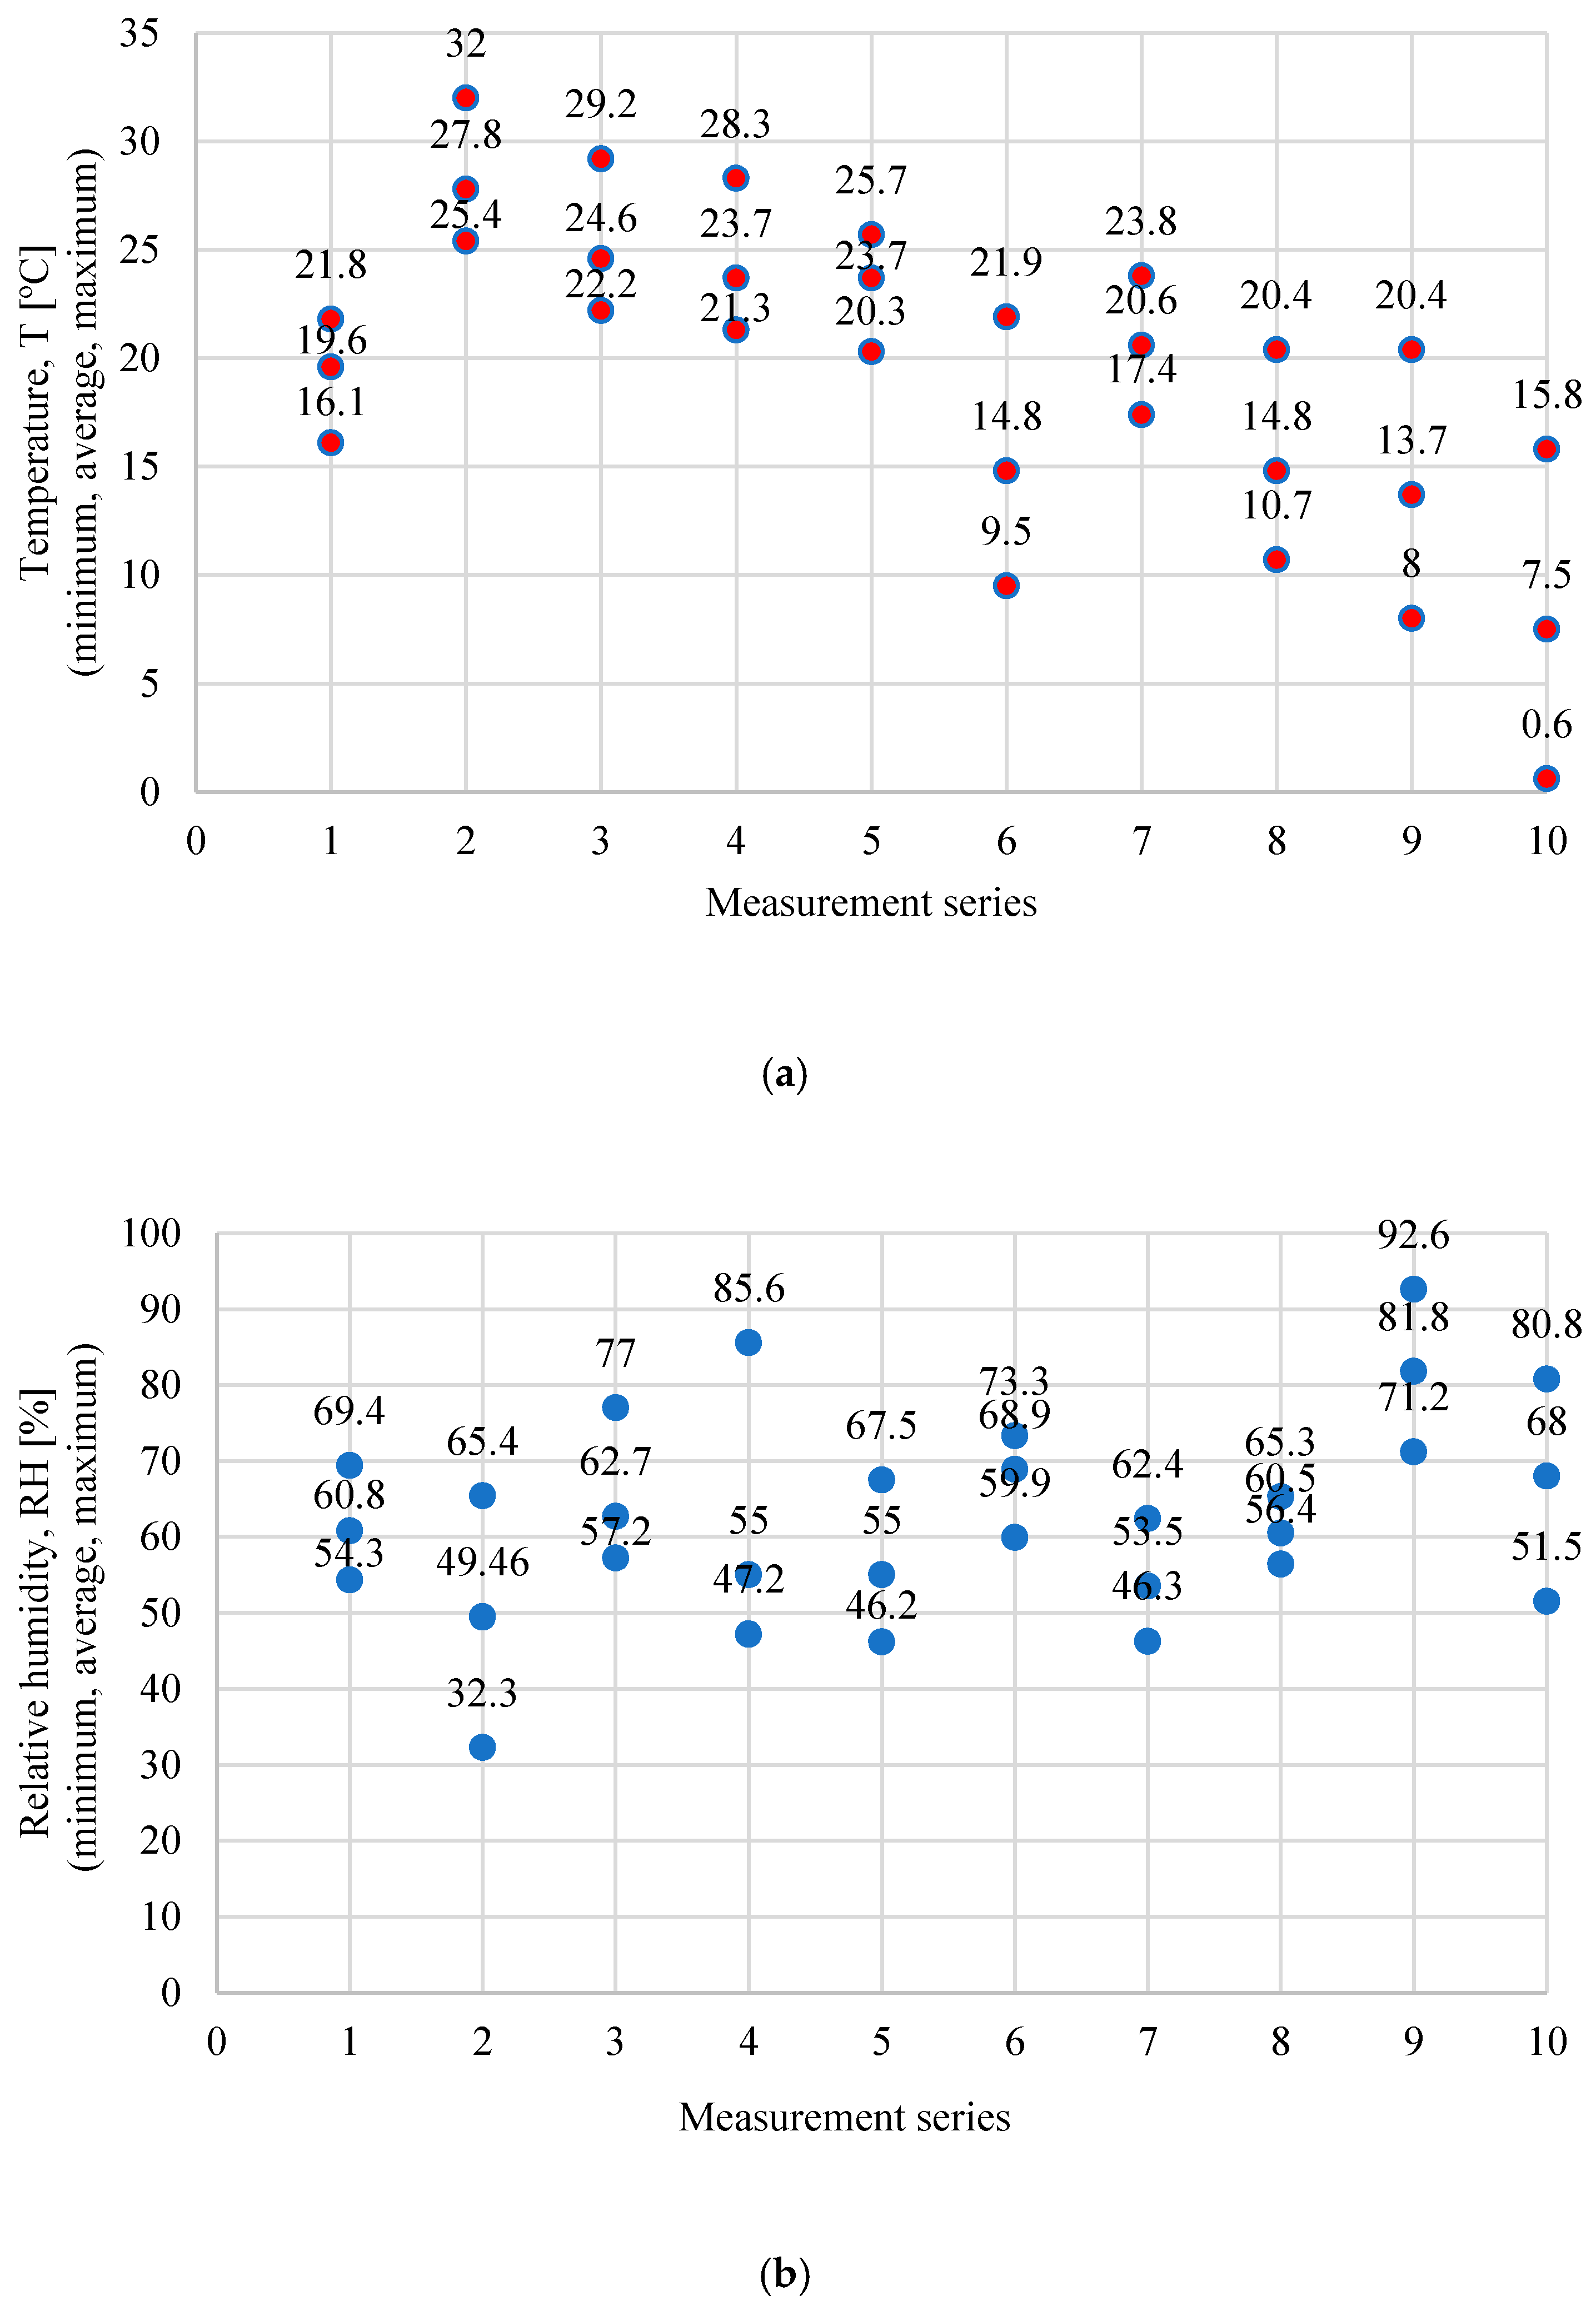
| Series | Date | Series | Date |
|---|---|---|---|
| 1 | 11 July 2019 | 6 | 03 October 2019 |
| 2 | 25 July 2019 | 7 | 17 October 2019 |
| 3 | 08 August 2019 | 8 | 07 November 2019 |
| 4 | 22 August 2019 | 9 | 21 November 2019 |
| 5 | 05 September 2019 | 10 | 30 December 2019 |
| Kind of Sensor | Type of Sensor | Resolution | Range | Accuracy | Average Flow Rate |
|---|---|---|---|---|---|
| ammonia (NH3) | Electrochemical (EC) | 1 ppm | 0–100 ppm | ±10% | 250 cm3/min |
| hydrogen sulphide (H2S) | 0.1 ppm | 0–100 ppm | |||
| methanethiol (CH3SH) | 0.1 ppm | 0–10 ppm | |||
| volatile organic compounds (VOCs) | Photoionzsation (PID) | 0.01 ppm | 0–100,000 ppm |
| Odorant | VOCs | NH3 | H2S | CH3SH |
|---|---|---|---|---|
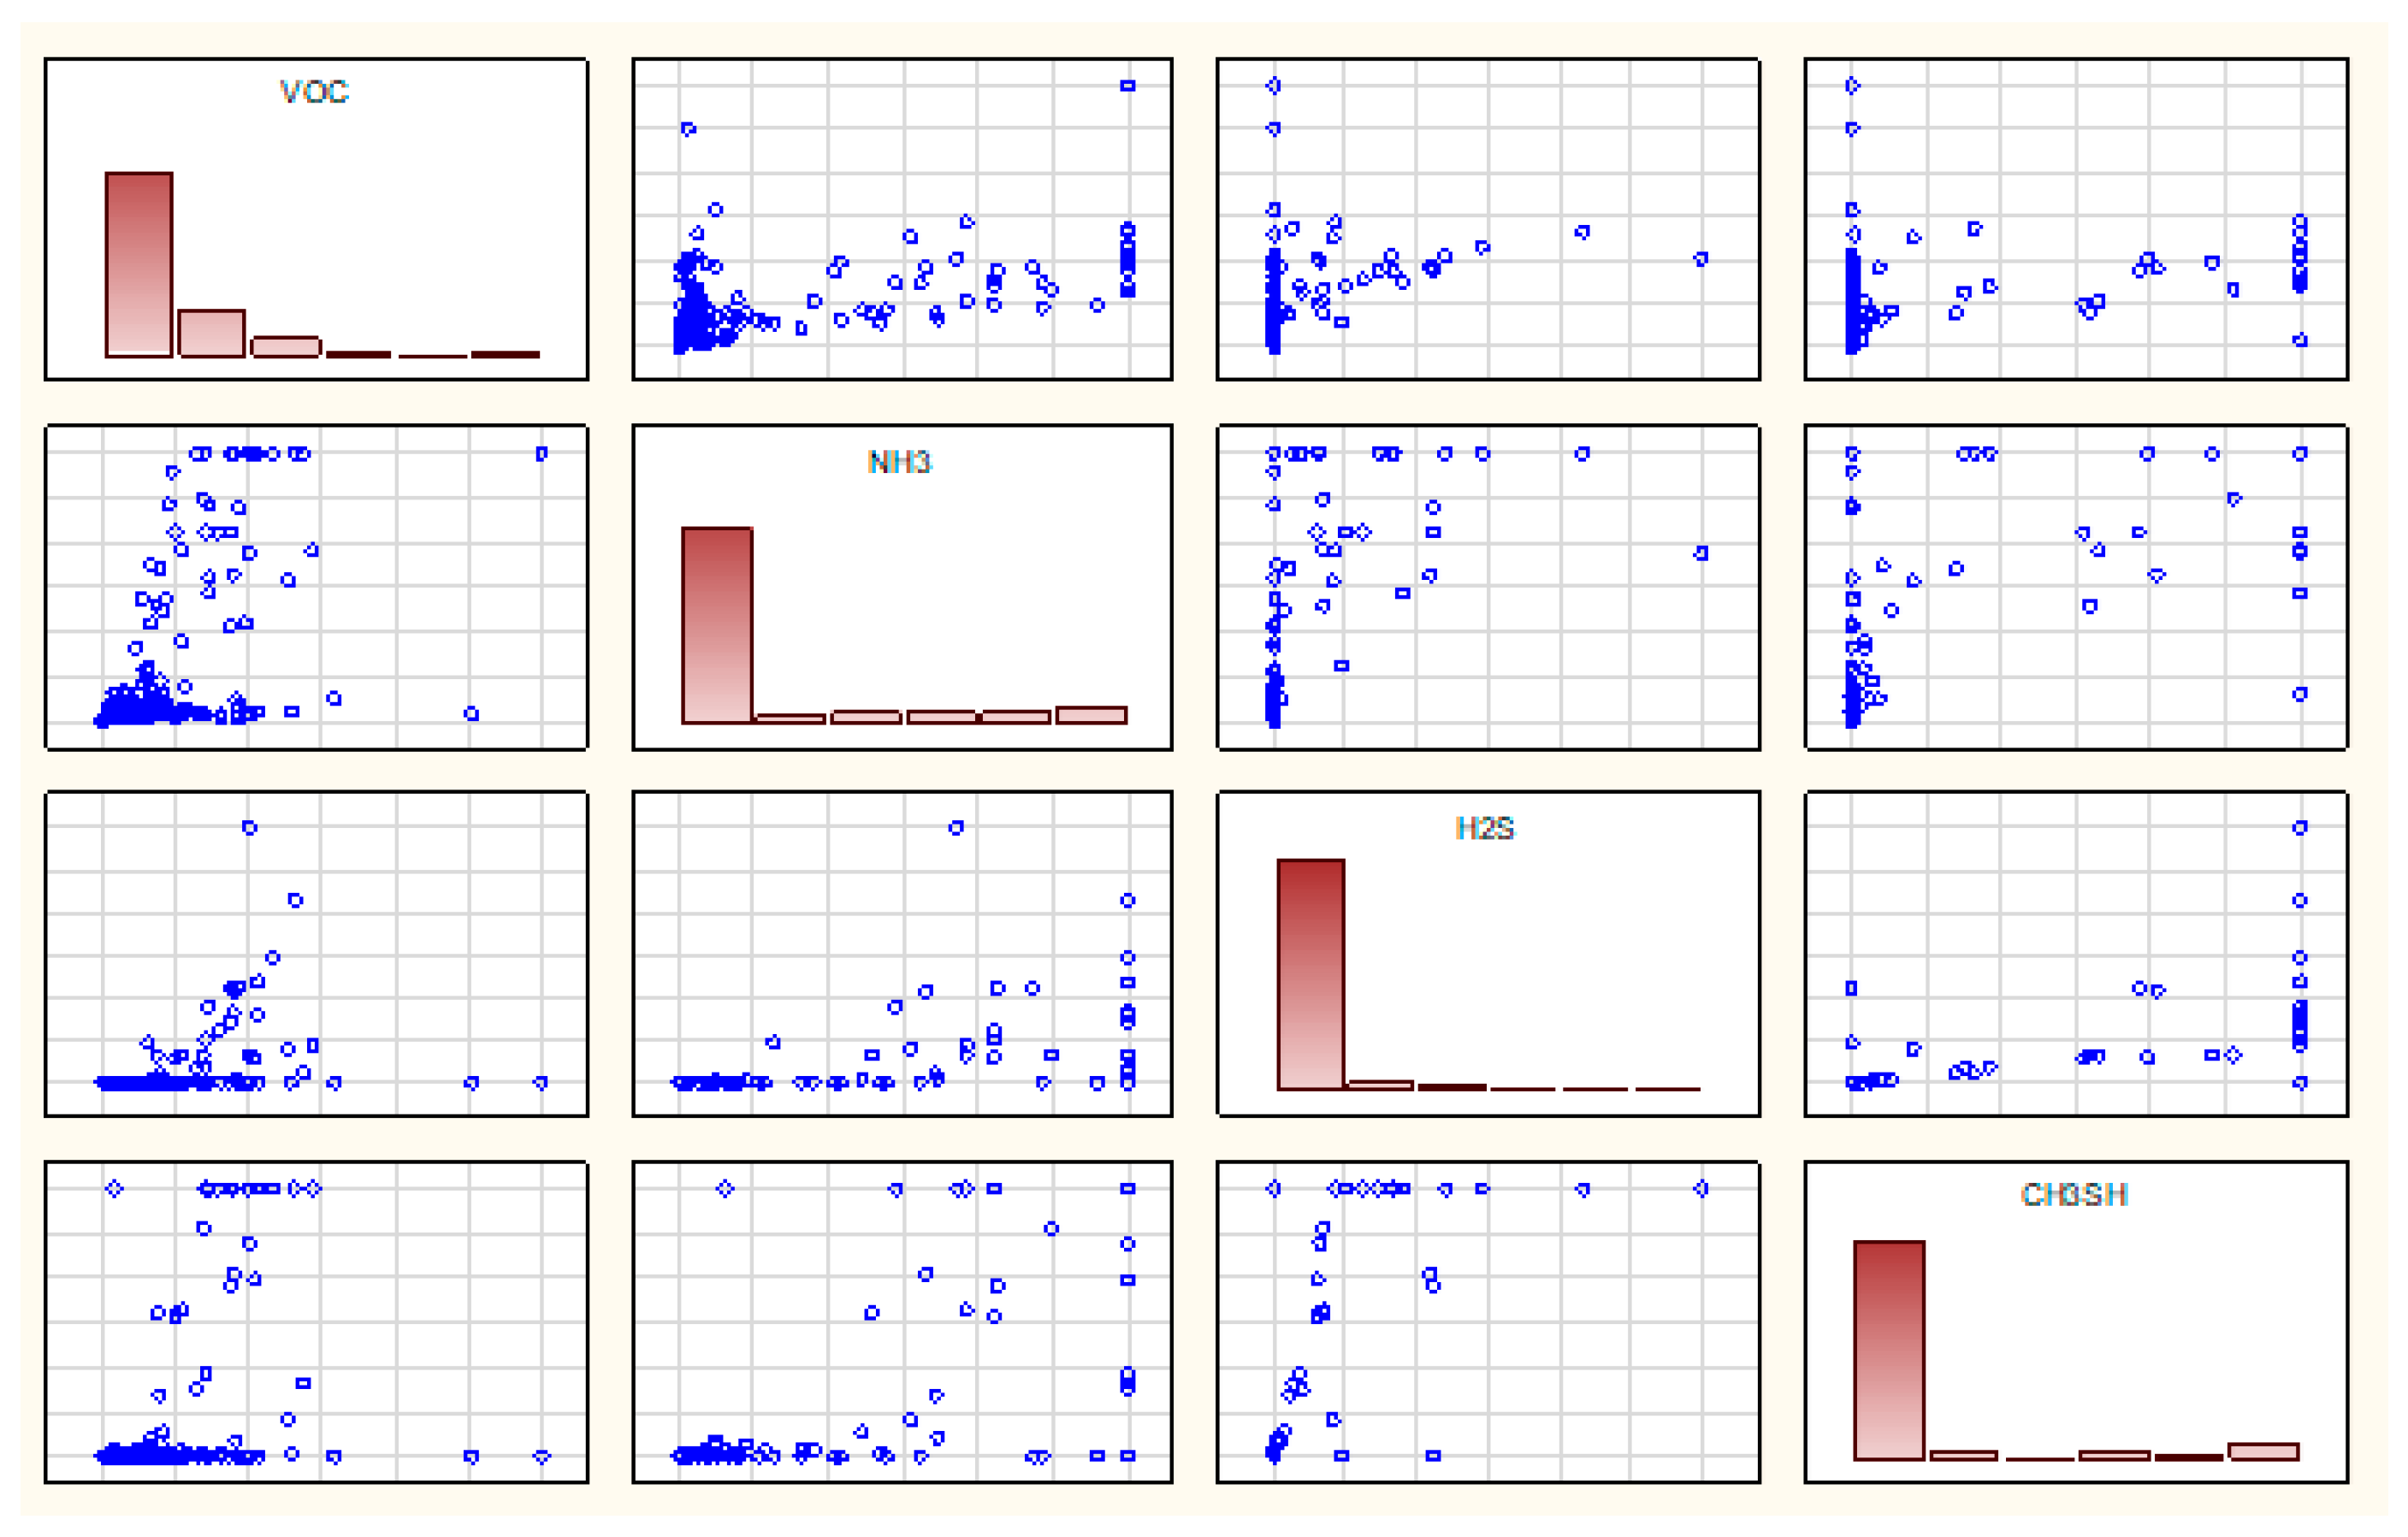
| VOCs | 1.00 | 0.54 | 0.34 | 0.39 |
| NH3 | 0.54 | 1.00 | 0.60 | 0.73 |
| H2S | 0.34 | 0.60 | 1.00 | 0.76 |
| CH3SH | 0.39 | 0.73 | 0.76 | 1.00 |
© 2020 by the authors. Licensee MDPI, Basel, Switzerland. This article is an open access article distributed under the terms and conditions of the Creative Commons Attribution (CC BY) license (http://creativecommons.org/licenses/by/4.0/).
Share and Cite
Wiśniewska, M.; Kulig, A.; Lelicińska-Serafin, K. The Impact of Technological Processes on Odorant Emissions at Municipal Waste Biogas Plants. Sustainability 2020, 12, 5457. https://doi.org/10.3390/su12135457
Wiśniewska M, Kulig A, Lelicińska-Serafin K. The Impact of Technological Processes on Odorant Emissions at Municipal Waste Biogas Plants. Sustainability. 2020; 12(13):5457. https://doi.org/10.3390/su12135457
Chicago/Turabian StyleWiśniewska, Marta, Andrzej Kulig, and Krystyna Lelicińska-Serafin. 2020. "The Impact of Technological Processes on Odorant Emissions at Municipal Waste Biogas Plants" Sustainability 12, no. 13: 5457. https://doi.org/10.3390/su12135457
APA StyleWiśniewska, M., Kulig, A., & Lelicińska-Serafin, K. (2020). The Impact of Technological Processes on Odorant Emissions at Municipal Waste Biogas Plants. Sustainability, 12(13), 5457. https://doi.org/10.3390/su12135457