Abstract
A core contemporary planning approach is the promotion of transit-oriented developments (TODs) and in recent times cities have committed substantial financial investment to encourage sustainable precincts around public transport. Evaluation of the success of TODs is key for continuing the planning efforts. A frequently applied framework for characterizing TODs draws on Bertolini’s Node-Place (N-P) model, enriched through application in various contexts. We offer here an extension to the N-P model, using a case study in a low-density city, Perth, Western Australia. A typology of railway stations is developed using 43 indicators and then linear models are applied to ascertain the association between patronage and station precinct features. The results show that various types of measures are required to increase public transport ridership for the four clusters that emerged from the analysis. Density alone does not lead to increased use of public transport; it must be associated with city-wide accessibility, as well as access/egress to and from the station.
1. Introduction
A core contemporary planning approach is the promotion of transit-oriented developments (TODs) and in recent times cities have committed substantial financial investment to encourage sustainable precincts around public transport hubs [1,2,3]. TODs are compact, mixed-use developments that facilitate walking, cycling and use of public transport through their urban design [4,5]. Consequently, they are seen as a pathway to environmental sustainability by conserving resources and energy, using better urban land, reducing vehicle-km travelled and shifting the balance towards more environmentally-friendly transport modes [6,7]. Despite clear aspirations and unceasing interventions over the past few decades, the success of TOD in Australia has been patchy [8,9]. This is because: (1) Transport and land-use have distinct rhythms of evolution; and (2) integration of train stations within the surroundings requires substantial land assembly, urban development and planning expertise.
Measuring the short-term benefits of TOD performance has mainly focused on increased patronage and active travel (AT), while reducing car use. A frequently applied framework for characterizing TODs draws on the Node-Place (N-P) model proposed by Bertolini (1999) [10] and enriched since through application in various contexts [11,12,13,14,15,16].
At its core, the model suggests that transport and land-use are shaping the development of the station precincts, with land-use (separation of activities) creating the need for mobility and transport. Conversely, the availability of transport services makes certain locations more accessible and affects location. The outcomes of this continuous bidirectional process depend on what features prevail at a certain stage: density, diversity, design of urban form (P) or the transport features (N). A harmonious balance optimal state was hypothesized, where N-P are relatively even/balanced and TOD objectives can be met [10,11,13]. This could be attained through responses of N or P to each other: When P dominates, the balance can be achieved by investing in/improving transit (e.g., increased frequency or demand-responsive access/egress solutions), limiting the place value (its land-use intensity and/or diversity), or a combination of both actions. When N dominates, land-use intensity towards more compact development and a high-quality pedestrian and cycling realm, where public space and green areas occupy a key role (as opposed to a wider regional catchment approach using transit services) is recommended. In practice, the actualization of this potential is challenging—especially in low-density cities—and it relies on a complex range of factors [17,18]. For example, N functionality can provide the social and environmental sustainability [19,20,21,22] required for city living, and transit access may address any social exclusion. Public transport also incentivizes new urban development in greenfield areas because new residents enjoy a level of access they would not have otherwise. Yet, if the catchment areas [21,22] are substantially larger than the widely accepted 800m buffer radius for TODs [22,23], reliance on Park and Ride (PnR) and feeder buses would (at least temporarily) detract from the place quality around the station.
We offer here an extension to the N-P model, using a case study in Perth, capital of Western Australia (WA), a low-density city with a current population over 2.1 million and expected to reach 3.5 million by 2050. As indicated, while the original model promotes synergies between the N-P functions and feedback relations between them, in many cases these are not feasible, primarily because of the time lag between land-use and transport projects. Thus, investment in developing station precincts as places or simply increasing density may not increase transport patronage. Built within the envelope of the draft ‘Perth and Peel @3.5 million and beyond’ land-use plan (P&P@3.5) [18], the results of this work enhance understanding of the different stages of development for TODs in Perth and informs pathways for the implementation of the urban plan for 2050. The project develops a typology of the stations and shows that various types of measures are required to increase patronage for the four clusters that emerged from the analysis.
2. Background and Motivation
TODs can take a variety of forms, depending on their features and location [8,9]. The project seeks to describe the functioning of station precincts in Perth and improve their role within the context of a more sustainable urban environment [19,20,22] envisaged for population and economic growth until 2050.
Relying solely on secondary data obtained from government departments in WA and Australian Bureau of Statistics (ABS) Census, this project combined multivariate data techniques to:
- Cluster analyze the 70 Perth rail stations using 43 various indicators covering three dimensions: Place, Transit/Node, and Background Traffic [17,18];
- Analyze the relationships between station boardings/patronage and key station and catchment characteristics via multiple regression models.
Node-Place-Background Traffic
The set of variables used in this research expands on the original N-P model [10,11,12,13], including a new dimension, Background Traffic (BT). This research also considers an increased number of indicators for describing the functions of the station precincts: For example [13] applied six criteria, Peek et al. (2006) [11] used 13 measures, Kamruzzaman et al. (2013) [9] described TODs using 16 measures, Bertolini (1999) [10] applied 21 indicators across eight criteria, and Vale et al. (2018) [16] adopts 18 indicators for application at a local scale. While we subscribe to the underlying idea that interactions and feedback relations exist between the N-P functions of a mass transport precinct (i.e., improving public transport in a station location creates favorable conditions for further urban intensification because of the higher accessibility, which leads to better places; in turn, the increased demand of activities in station precincts leads to growing demand for transport connections), in many cases, the time lag between land-use and transport projects creates tension between N-P. There are also cases when they have conflicting objectives, rather than complementary or synergistic (e.g., big box shopping centers). Moreover, the N function includes indicators with contrasting roles (e.g., provision of PnR increases ridership, but it is likely to reduce access by active transport and generates conflict with background road traffic not associated with PnR). Thus, to further our understanding of the interaction between N (transport services) and road traffic, a separate dimension was included, and a typology of train stations developed, based on three functions: N-P-BT. This is different from other interpretations and enrichments: Monajem and Ekram Nosratian (2015) [24] added spatial indices (closeness and betweenness) to both N-P for a study in Tehran; Irvin-Erickson and La Vigne (2015) [25] adapted N-P variables to assess criminogenic features of stations in Washington, DC; and Vale (2015) [26] as well as Vale et al. (2018) [16] focused on pedestrian-oriented design as the 3rd dimension when comparing rail stations in Lisbon.
3. Methods and Materials
In an attempt to summarize the indicators in three factors scores, factor analysis was applied separately for the N-P-BT functions. Although these dimensions are not fully reflective, the latent constructs provided indications of the dominant function of the station. Then, the project used a two-stage cluster analysis to classify the stations. First, an explorative clustering, providing a comprehensive portrayal of the potential solutions was applied, followed by a quick clustering, with the objective to further sharpen the solution. The explorative clustering consisted of using an agglomerative method (AGNES) and comparing various algorithms—single linkage, centroid, Ward—to check the stability of the solutions. An iterative process was undertaken, running clustering algorithms several times before selecting the solution. Four clusters were deemed as most appropriate and cluster seeds were then used in the second stage as centroids, to assign the stations to the more similar cluster. The clusters were then profiled to better understand their features. Finally, regression analysis was finally employed to assess the associations between patronage and the N-P-BT features of the stations.
Drawing on previous literature [2,26,27,28], we hypothesized that walkable station precincts, as well as stations with good access (either parking and/or significant feeder bus services) are likely to lead to higher ridership, whereas station precincts that are not walkable, have few bus services, and are highly dependent on car access (but with limited PnR), will have a reduced public transport volume. Multiple models were estimated considering boardings, alightings, daily patronage for weekday and weekends and weekly patronage. For brevity, here we present only boardings.
As indicated, the case study is focused on Perth, one of the most livable cities in the world (no. 14 in 2018, EIU 2018), but a low-density city, stretching about 170 km along the shore of the Indian Ocean. It has a rail network of more than 180km along five radial corridors, however, given its geographical extent, it is a car-reliant city.
Geographical Setting and Data
This project combined multiple data sources of information to generate a comprehensive typology of the station precincts based on the three functions (Census Data from ABS, land-use and transport data from Landgate and the WA Departments of Transport and Planning, Lands and Heritage, and SmartRider and patronage data from Public Transport Authority). Considering that the N and P functions have been considerably described and applied by many scholars, we focus here on the BT function.
For the P function—we applied both measures of density and diversity (residential, commercial, office, health, education and manufacturing, including natural and heritage elements), population and employment (by industry) within the precinct boundaries, socio-economic indicators (advantage, disadvantage, economic resources, education and occupation), and urban ‘aesthetics’ (landmarks, green space, walkability, etc.). Shannon’s Entropy (SE) was applied to evaluate LU diversity [2,12,29,30,31]. These scholars used entropy to assist in simulations of future LU and in relation to commute choice, physical activity, mixed land-use, or bicycle use. SE is derived as the sum of products between proportions and their logarithms, hence, if a spatial unit may be endowed with various j features, with relative proportions (‘abundances’) of p(j), SE highlights that a uniform probability distribution of the features has the maximum diversity. Conversely, if a single feature is dominating, the entropy is minimal (equal to 0).
For the N (transit) function—we used a set of measures of accessibility (both city-wide and to the station) predominantly by public transport and combinations of modes (multimodal), determined by both coverage and frequency of services. Opportunity measures (employment and number of workers who can access various locations across the metro area) were also incorporated, and finally the N function also considered the supply of PnR and bike facilities at the station.
To enable comparability between current situation (baseline) and future planning decisions (Perth @3.5M Transport Plan 2050), travel time data for N was mainly obtained from the strategic transport model developed and used in WA since the late 90s. N construct includes: (1) City-wide access by public transport (including in-vehicle time, access, and waiting time) vs. car, measured as opportunities (jobs, workers) that can be reached within 15, 30, 45, and 60 mins at AM peak; (2) access time to a station by various modes (car, feeder buses, walking and cycling); and (3) facilities that enable the use of transit (PnR bays, feeder bus transfers, cycling facilities). Depending on whether the station is a generator (origin of travel or facilitating transfer close to origin) or an attractor (destination or destination transfer), different facilities may be prevalent and/or required.
For the BT function—the following indicators were applied to measure the impact of the train station activity on the surrounding road network (Table 1), assuming that roads with higher value in the hierarchy will be affected much more than access roads and local distributors, where the separation between station and background (non-station) traffic is less critical. Hence, a station located at a freeway interchange, which has the potential to have the greatest adverse impact on the non-station road traffic, is given the highest score of 1, while a local distributor only 0.2.

Table 1.
Summary indicators ackground Traffic (BT) accounting for the interaction with the road traffic.
The impact of the feeder buses on the surrounding road traffic was assessed in a similar manner. Bus services can be provided either:
- ‘on-line’ (curb-side bus stops on the road(s) fronting the station. These have a relatively minor impact on traffic, especially if the bus bays are indented (i.e., widened road to allow buses to pull out of the through traffic lane to stop to set down/pick-up passengers); or
- ‘off-line’ (separate bus/rail interchange accessed from the frontage road. These facilities usually require traffic to be stopped to allow buses to access/egress and may require an additional traffic signal junction, thereby increasing the adverse impact on BT).
As expected, the ‘off-line’ scores are higher than the ‘on-line’ values. To assign a congestion score to each station, the main signalized intersection serving each station was identified and the highest main road leg’s volume-capacity ratio (‘vcr’) was extracted. Some stations were remote from a signalized intersection and the vcr of the main frontage road was used, calculated as follows:
where 3600 is a parameter indicating that volumes are for a two-hour peak period (7–9 a.m.).
Frontage road_vcr = AM road vol/(3600 × no. of lanes)
4. Results
4.1. Cluster Profile
Table 2 profiles the final cluster solution, accounting for all three functions N-P-BT of a sttion, whereas Figure 1 displays them graphically.
Table 2.
Profile station clusters (all three dimensions).
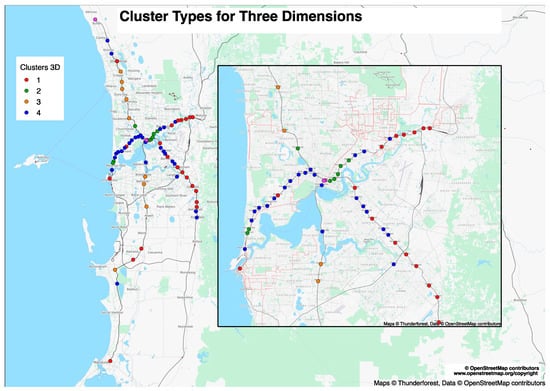
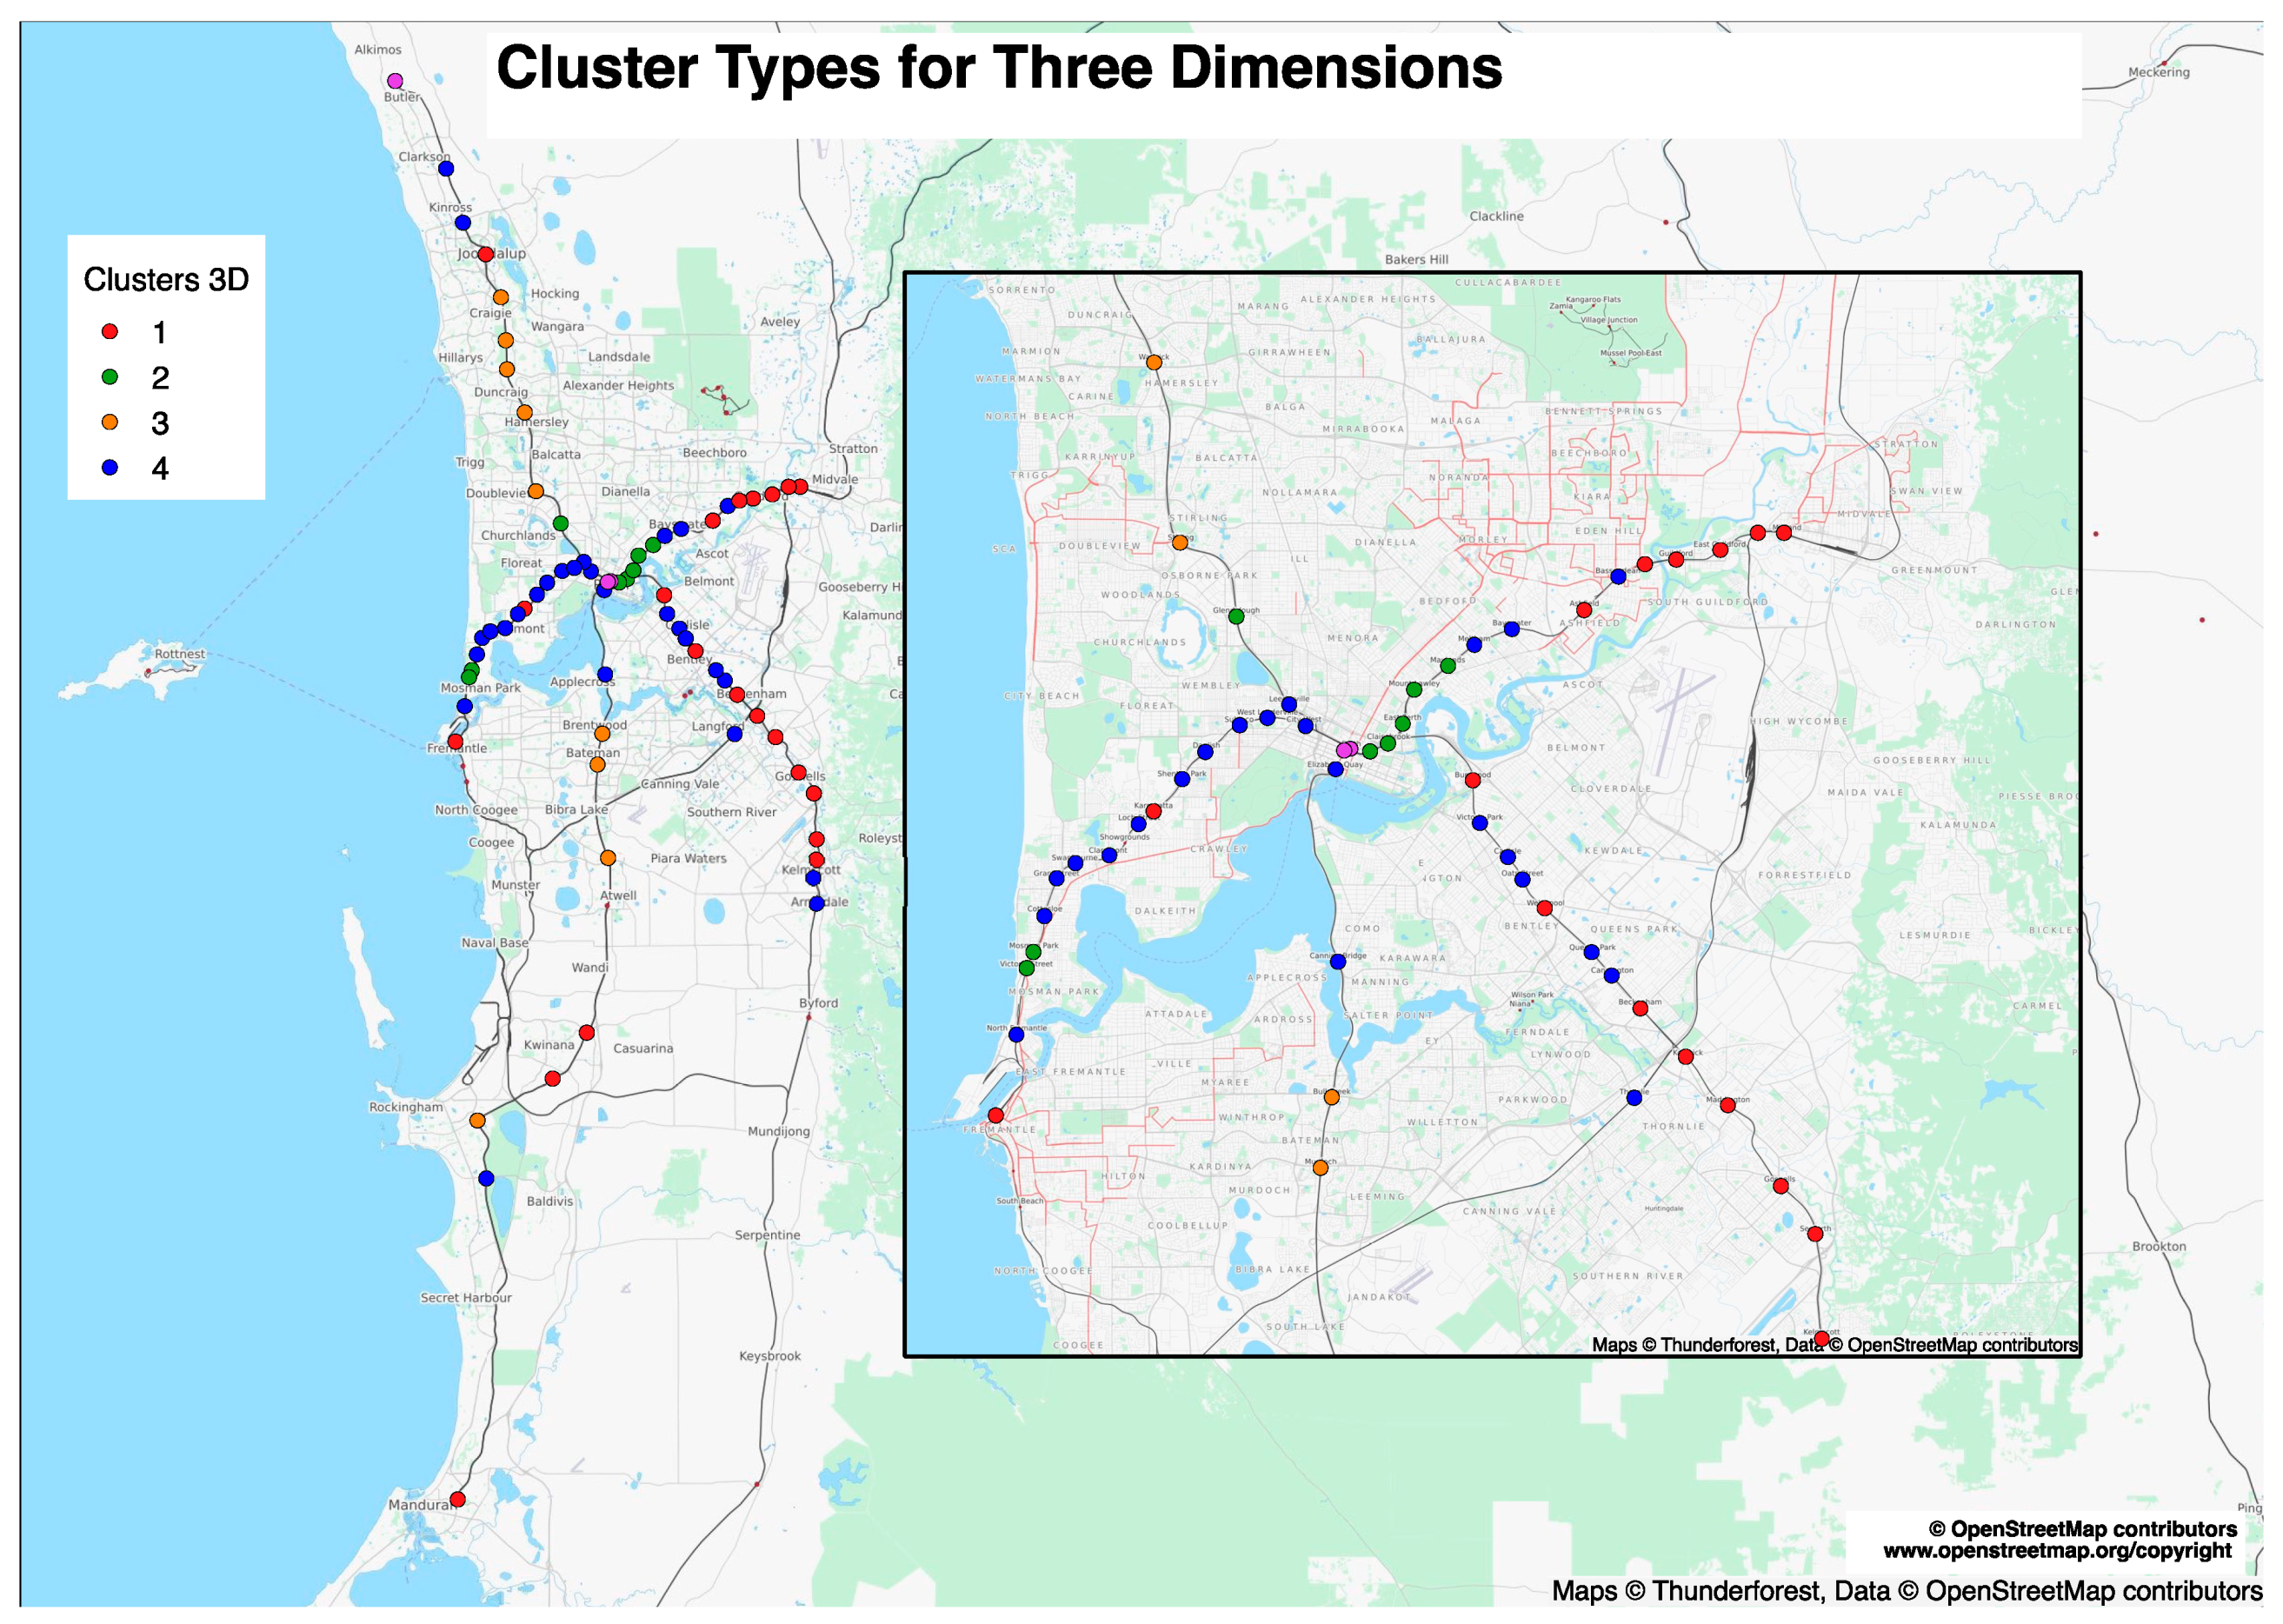
Figure 1.
Mapping of clusters based on the three dimensions.
A small number of stations show dominant P and N functions (clusters 2 and 3) and there are a substantial number of mixed function precincts (cluster 4). This is consistent with the findings by Kamruzzaman et al. (2013) [9] in Brisbane, who distinguished between residential TODs (mostly Places, 15%) and activity centers (10%) in terms of densities, diversity and transport mode. Also, most of the CCDs in Brisbane were classed at “potential for TOD” (46%) as they have good public transport connections/coverage and some mixed land-use. The remaining 29% did not qualify for TOD. This was also found in Perth with many stations having low N-P functions (cluster 1).
The MANOVA tests indicate significant differences across the four categories at 0.05 level. Unsurprisingly, the profile of the clusters highlights the highest patronage at stations with generous PnR supply and feeder buses, despite their low Place entropy. Walkability appears critical for heritage lines, with high P function, and distinguishes between clusters 1, 2, and 4. On the N-S lines walkability is reduced, due to larger catchment area and station spacing, and therefore it has little impact on the patronage. Notably, stations from cluster 3 have patronage about three times higher than the other clusters, due to their features and relatively good city-wide access.
Higher P performance stations (cluster 2) correspond to contra-flow stations, being both trip generators and attractors (many close to the CBD—Claisebrook, East Perth, Glendalough, Maylands, McIver, etc.). Stations in the other clusters, and particularly from cluster 3, exhibit high boarding-to-alighting ratios in the AM peak, making them primarily generator stations (Bull Creek, Cockburn Central, Murdoch, Rockingham, Stirling, Warwick, Whitfords, Edgewater, Greenwood) (Figure 1).
The AM and PM peak patronage values were further analyzed to identify Generators (origins) and Attractors (destinations), as they require distinct planning strategies. A station was classed as a Generator where ratios of boardings/alightings were substantially higher than 1 (above 3); conversely, where the ratio was under 0.8, the station was considered an Attractor. A considerable number of stations with ratios between 0.8 to 3 were classified as Mixed. Finally, a number of stations with very low patronage levels (< 100 boardings/alightings at peak times) were examined separately. It is also important to note that the split between Generators, Attractors, and Mixed is consistent with a classification using the population and employment density in the station precinct.
Again, there were significant differences (at 0.05 level) between these three categories, with Generators displaying the highest number of AM boardings and PM alightings, and Attractors presenting the highest patronage for weekdays and weekends. Mixed stations had the second highest patronage during a week.
4.2. Factor Analysis Results
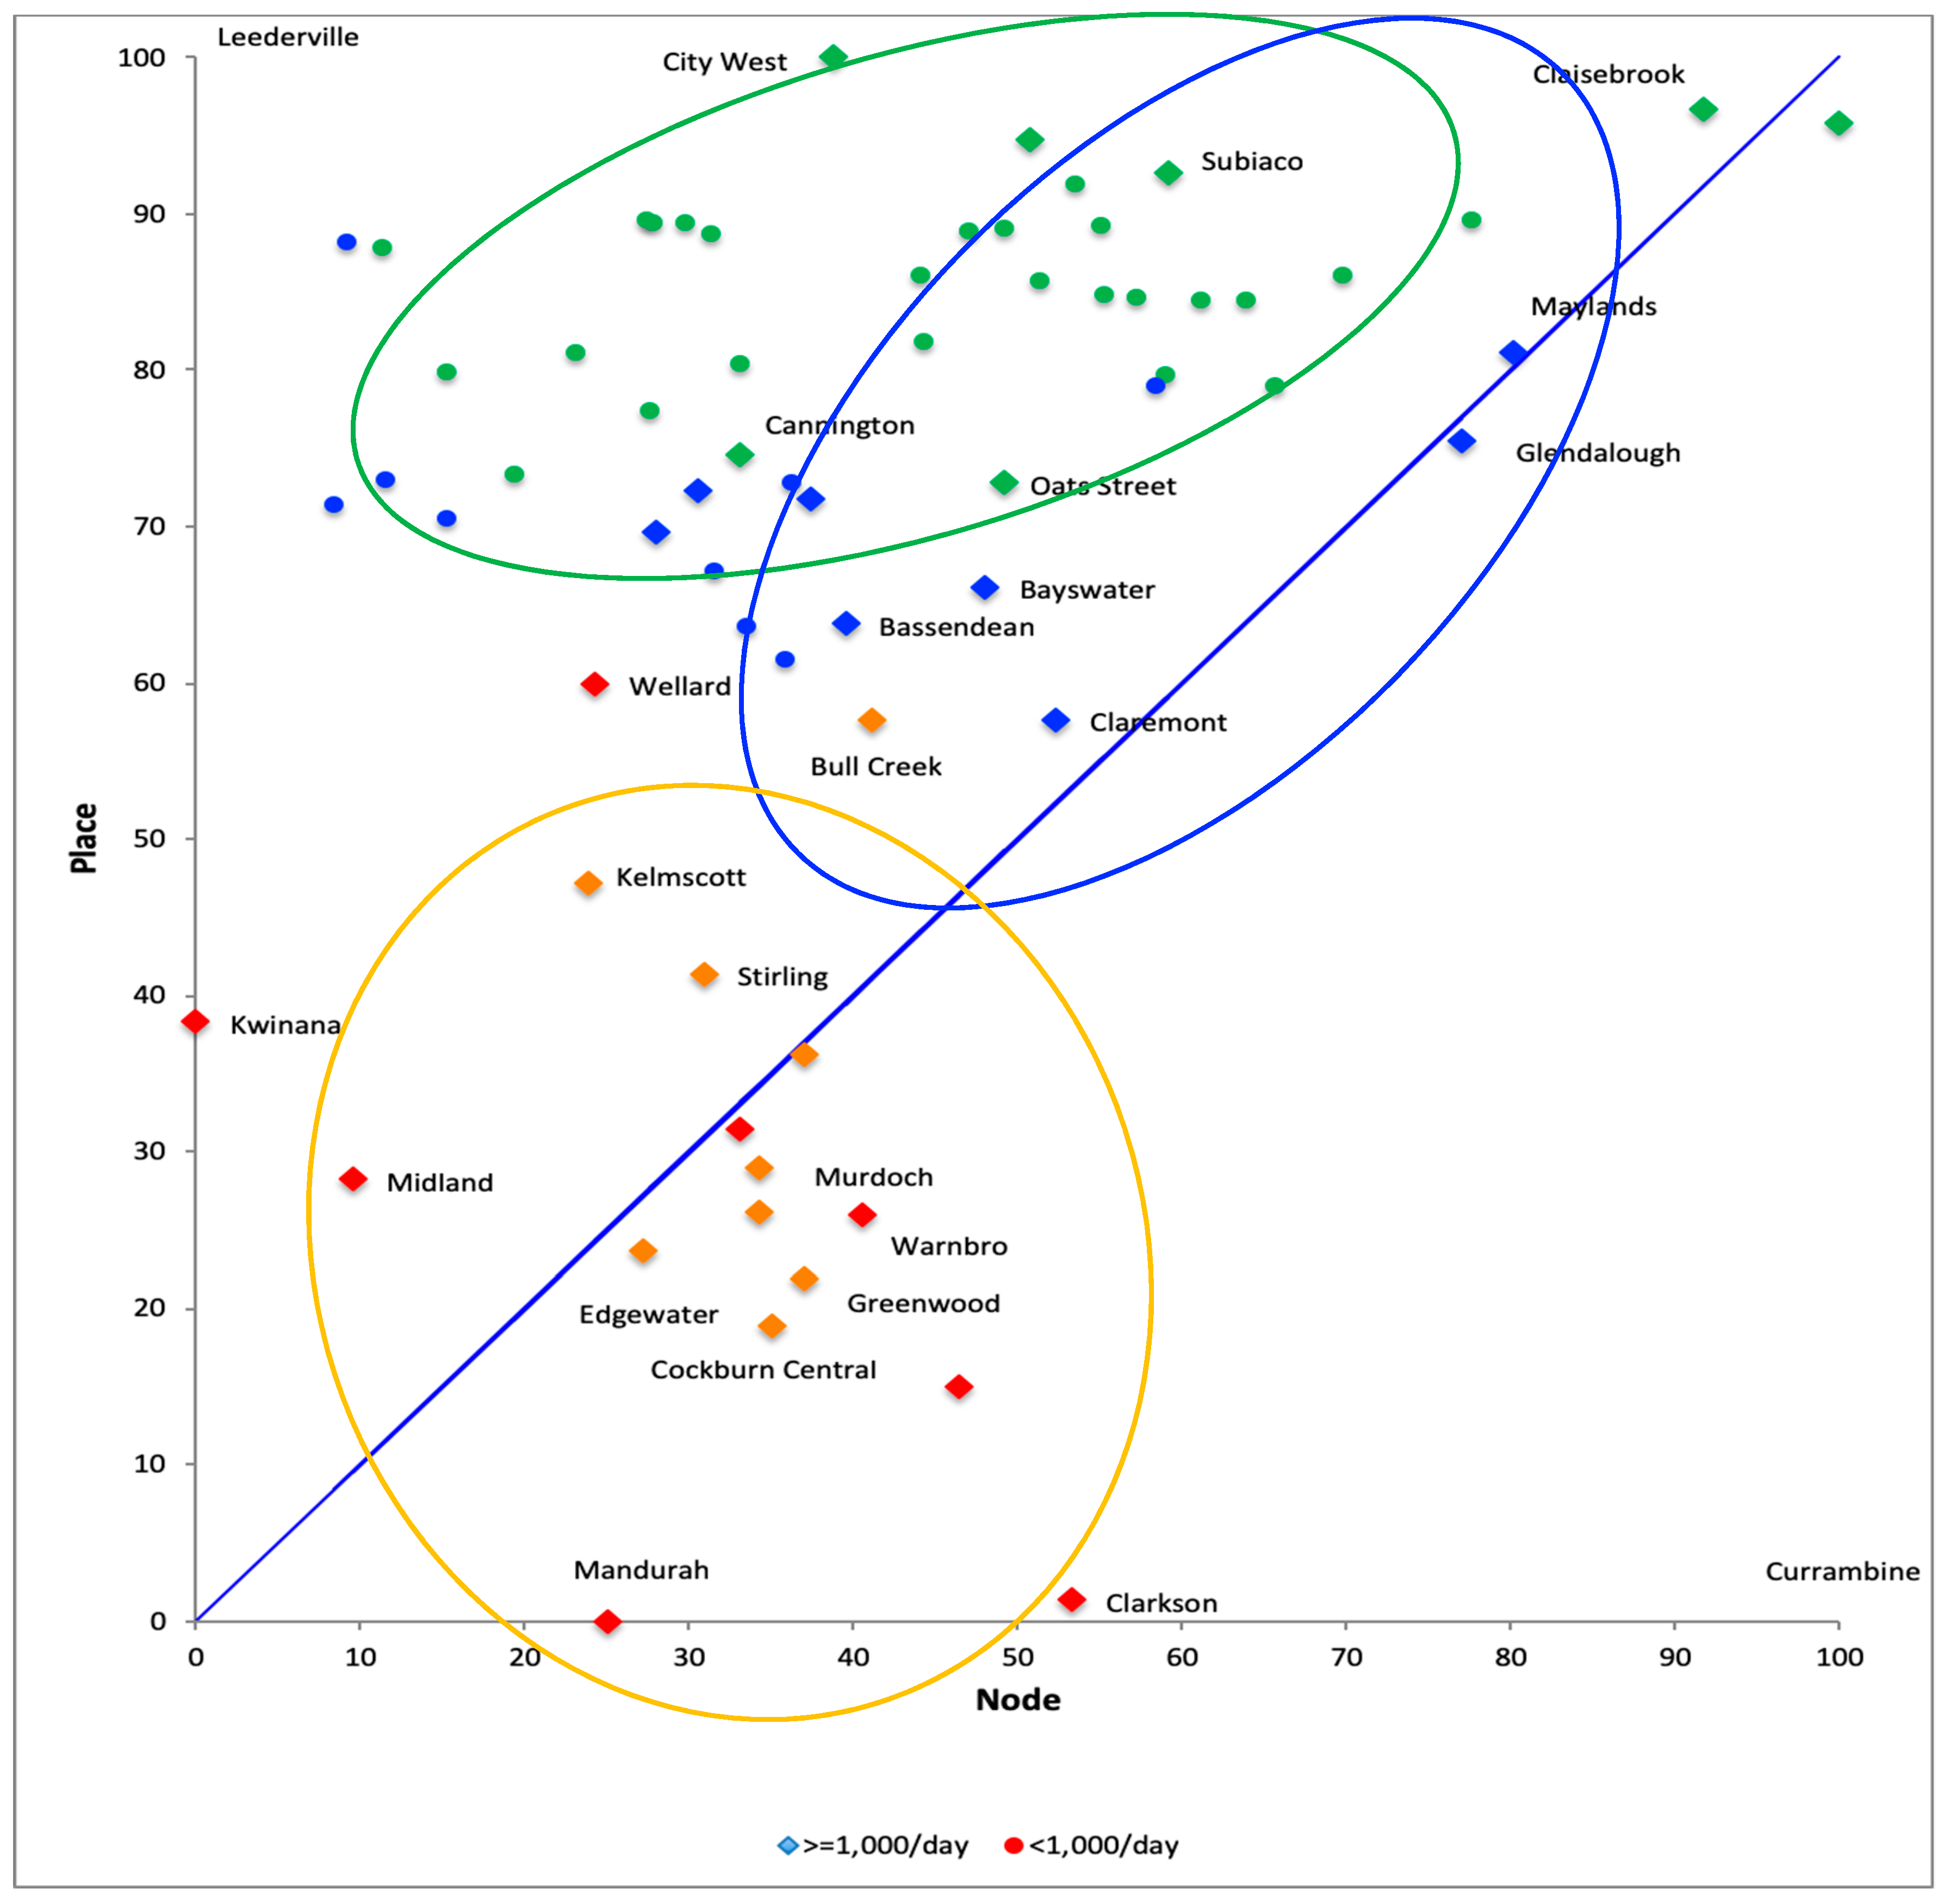
N and P uni-dimensional factor scores were calculated and the rail stations mapped on these two dimensions (Figure 2). The results indicate that whereas in Perth most stations with good P functions have low patronage (green dots at the top of the chart), there are several stations (closer to the diagonal and represented as blue diamonds) with patronage over 1,000 passengers per day. This group of stations may be further analyzed to assess the potential for other stations to increase their ridership. Figure 2 also shows a number of stations with limited P function, but higher N features (yellow ellipse at the bottom of the chart), which, with two exceptions (Kelmscott and Midland), are located on the N-S railway spine.
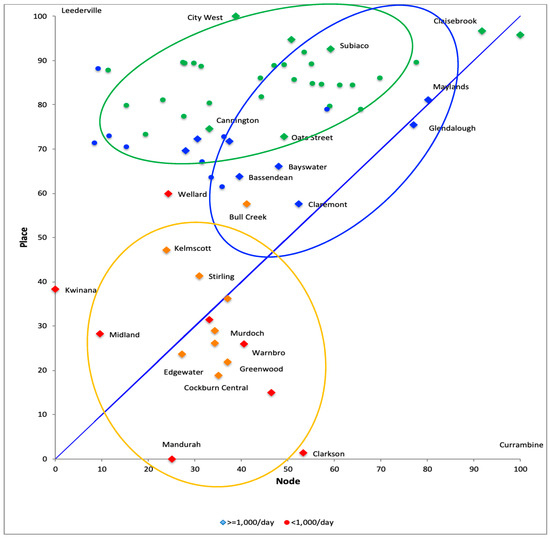
Figure 2.
N-P continuum. Note: One-dimensional P composite explained 42% of the variance in the Place items. N composite explained 67% of the variance in the Node indicators.
4.3. Regression Results
Multiple regression models quantified the associations between patronage (AM peak, full day weekday and weekend) and the vector of indicators for the N-P-BT functions of the station. Separate models were estimated with or without the cluster membership, hypothesizing a distinct impact for stations that are more P-oriented, compared to N-oriented station precincts, or where BT is critical. This is because of the limited sample size, which prevented us from using the cluster as a moderator in the models. Parsimonious models were sought, with a maximum of 8–10 explanatory variables, and bootstrapping (n = 300) was also applied to increase the robustness of the parameters. In order to enable model comparability, the same set of predictors was used across the models (here only a sample of models for boardings was presented). The results show that provision of PnR and feeder buses and accessibility are the strongest explanatory variables for patronage. Whereas access mode by PnR is relevant for AM boardings, congestion index and entropy were important predictors of AM alightings.
Any additional PnR bays will increase the AM patronage by 1.01 and any additional bus service by 3.067, everything else being equal. Whereas population density is not significant, the parameter estimates suggest that across the city increasing population density within the 1.6 km precincts by 1000 may increase the AM train boardings by 22. An interesting finding is the negative relation of walkability to train ridership, which suggests that in precincts with good walking and cycling access, AT may increase their market share by converting car-based travel into walking and cycling, rather than into patronage. After controlling for station function indicators, the cluster 3 variable is still marginally significant and shows an additional 428.11 AM boardings, ceteris paribus (cluster 4 was the reference category and the dummy variables for clusters 1 and 2 were not significant).
Nevertheless, these AM boarding values do not distinguish between various access modes, expected to create concentric rings around the station: First ring, active travel; the second ring, feeder buses (BnR); and beyond PnR and kiss-and-ride (KnR) access. Using the bus-to-train transfers from SmartRider data and assuming that journey-to-work (JTW) mode share applies to the AM peak boardings; train boardings were further split into BnR, access by active travel, and by car (PnR + KnR) (see Table 3).
Table 3.
AM boardings weekday (R2adj = 0.796).
The latter was regressed against the set of N-P-BT predictors, to identify any relevant additional relevant factors increasing AM boardings (Table 4). Population density, albeit non-significant, plays an essential part in generating train patronage; nonetheless, that may be outside of the 1.6km precinct (it generates an additional 29 AM boardings everything else kept constant), in which case PnR supply and feeder buses are key.
Table 4.
AM boardings from PnR and kiss-and-ride (KnR) (R2adj = 0.766).
The next set of regression models was estimated for Generator vs. Attractor stations and classes of stations based on their ‘balance’ on the N-P-BT continuum. When selecting only the Origin/Generator stations (Table 5), population density appears to have a more prominent role, yet, access to jobs and provision of PnR and bus services are the strongest drivers.
Table 5.
AM boardings generator (R2adj = 0.759) and Attractor stations (R2adj = 0.623).
This effect is diluted for Attractor/Destination stations, and even the sign is reversed, showing a negative association between population density and patronage at Attractor stations (Table 5). Again, compared to cluster 4, stations in cluster 3 have an additional 451 patrons at AM peak, whereas the other two cluster dummy variables are statistically non-significant (ceteris paribus).
When aggregating the train ridership by day and week, the explanatory power increases by almost 20% and all the predictors are statistically significant at 0.05 level. The weekend patronage (not shown here) is substantially associated with bus services, land-use mix and public transport access. Also, the weekly patronage is substantially reduced when congestion conditions increase.
5. Discussion
Based on cluster profiles and regression, there are several main actions that could be undertaken to achieve the key objective of increased patronage:
- densification by increasing population within the station catchment;
- increasing the number of jobs within the station catchment (developing activity centers);
- increasing accessibility of the generator stations by public transport by providing additional PnR; and
- improving access/egress facilities for the stations by adding new feeder bus routes, increasing service frequencies, or creating more flexible local transport solutions.
Actions 1 and 2 are expected to increase the total number of people travelling to and from the station precinct and therefore the station patronage.
However, from a TOD perspective, it would be preferable to add jobs to station precincts that are mainly residential and to add dwellings to those that have mainly employment/non-residential uses. This would create more balanced TOD, not only with higher in density, but also more diversity in land-use mix. While developing better TODs enables the creation of good activity centers and leads to higher quality amenity and livability (appropriate scale for pedestrians), they may not be associated with a substantial increase in transit ridership [5,7,10,11,12,13]. This is because in good TODs, the balance between workers and jobs within a station catchment means more trips can be satisfied internally—particularly by active transport [17,18,19,20,21,22]—with fewer trips required outside the precinct, and thus reduced train patronage.
If, on the other hand, population densification would occur in residential precincts (Generators) and employment concentration around station precincts that are primarily Attractors, i.e. increasing the land-use imbalance, this would likely result in more trips to/from the precincts and hence a greater potential for increased rail patronage. This ‘job-housing imbalance’ was highlighted in the meta-analysis by Ewing and Cervero (2010) [28] as having the highest elasticity of transit trips (p. 292). Nevertheless, it would result in lower levels of self-containment and self-sufficiency, and poorer land-use outcomes, amenity and TOD features.
Hence, a distinction must be made between the primary (livability, vibrancy, and sustainability and reduced car use [5,6,32]) and secondary benefits of TODs (increased patronage [5,27,28]), and the dilemma between balancing N and P [10]. Should planning seek to balance workers and jobs or look to maximize the potential for higher train patronage? The former would result in lower overall access costs for users and reducing the demand on the transport systems (thereby reducing infrastructure requirements and costs for the government), but with lower fare revenues. The challenge is therefore to increase the train mode share by offering services superior to car travel for trips external to the precincts, while aiming for a more balanced land-use mix within the station precinct.
Actions 3 and 4 complement the measures suggested above on the quality of door-to-door public transport services. The goal of increased access measures is to attract a higher proportion of existing travelers to transit (while 1 and 2 seek to increase the total demand with more people travelling, i.e., growing the market), which means a diversion from car travel. The increased access is likely to conduce to three potential outcomes:
- (a)
- Encouraging those currently driving all the way to transfer to the train, thus increasing patronage. This specifically relates to adding more PnR as it is currently full at most stations.
- (b)
- Diversion from other modes to PnR or to BnR, supported by a better ‘first mile-last mile’ transport solution. This would likely result in a modest increase in train patronage, but there are expected benefits for the individuals that change their access and egress mode.
- (c)
- By adding PnR bays at one station or changing feeder buses coverage and frequency, current users at adjacent stations may change their boarding station, again resulting in no increase in overall patronage. Thus, the benefits of actions 3 and 4 may be slightly offset by this change in access/egress mode, or change in boarding station, and the actual increase in train boardings may be lower than anticipated.
Findings from the cluster and regression analyses also call for definitional clarity in regard to TOD characteristics. Traditionally, TOD was seen as a planning tool to create urban villages of compact/smart design, with mixed land-use and maximum access to public transport, and appropriate scale for pedestrians. The presence of these “D” ingredients [1] creates the premise for vibrant, exciting, memorable places for people to live, work and interact. However, in low-density cities, these “islands of urban bliss” cannot support the high patronage required for mass transit. Therefore, adaptations of the criteria are needed. In geographical contexts like Perth, PnR is a backbone for successful TODs, as it encourages multi-modality (by choice, not captivity) and it should be seen as a transition phase until densities are built-up. Also, ‘first mile-last mile’ transport solutions should receive more attention, if the objective is to achieve a modal shift from car to public transport.
6. Conclusions
Based on the development and application of an enhanced Node-Place evaluation model to 70 train stations in Perth, WA, this paper shows that a more nuanced understanding of distinct station precinct characteristics and TOD development stages provide stronger evidence to inform policy pathways for the implementation of future urban plans. The contribution of this paper, through the inclusion of a new dimension, Background Traffic (BT), as well as expanding the number of indicators to account for the particular low density context of the case study area, significantly improves the ability of policy-makers to direct actions to specifically increase patronage and more generally to achieve enhanced TOD outcomes.
6.1. Policy Implications—Stations
In general, the findings suggest that future investments in land-use and transport infrastructure and services at stations should consider an increased mix of activities and possible separation of the road and transit functions (better BT value), so that the interference between them is reduced and impact of congestion diminished. Forecasted improvements in accessibility levels in Perth suggests that train patronage levels will increase at all stations, especially if supported by higher residential and employment densities.
More specifically, depending on the particular station typology, in many instances consistent with findings and policy recommendations of previous studies, it is concluded that:
- Node dominant stations may benefit more from densification, if aligned with greater city-wide access to employment opportunities. Many of these stations have a high ratio of train riders for commuting relative to the population, suggesting a higher propensity to use public transport. The importance of transit accessibility at a wider geographical scale (regional) was also confirmed by studies in the USA and Europe [12,33].
- Place dominant stations have in general low patronage and also low ratios of train use for commuting. Ridership could be increased through intensification only if combined with better PnR and bus services, implying larger catchments. Residential densification and mixed land-use only around train stations are unlikely to raise the patronage to the desired values, as these stations currently rely on active travel much more than train usage [28,29,30].
- Mixed N and P stations would also benefit from increased densities combined with PnR access. The negative and significant impact of walkability suggests that in lower density residential areas, increasing population densities, as well as locating jobs at stations accessible by active travel, has a good potential to increase ridership, walking and cycling, thus reducing reliance on cars and consequently diminishing the overall congestion costs [6,16,17,22,26,30]. Also, because most of these stations represent attractors (with a few exceptions) with very low proportions of train ridership relative to jobs, there is potential for redevelopment and increasing the employment densities in these areas.
6.2. Policy Implications—Achieving Balance?
Policy implications emerging from the analysis include:
- A distinction between primary and secondary benefits of balanced N-P-BT functions or TODs is necessary, as ridership is only one of the outcomes. Increasing population density may not be the main and unique planning strategy in low-density cities, with a view towards increasing ridership. As shown by evidence elsewhere in Australia and overseas [4,28,34], good Places (or TODs), as “assembled collections, alliances, liaisons” [35] (p. 2) between land use and transport, ensure co-functioning between home, work and other activities (social, recreation, etc., thus high entropy) and shorten distances between people and places, therefore relying on active transport. Thus, enhancing amenity and livability [36] and creating good activity centers (and thus good job accessibility for the precinct area residents) may not be translated into substantial increase in transit ridership.
- Unlike [10,33,37], we do not necessarily assume that a balance of N and P is required everywhere, nor desirable; but if a station functions as a strong N (Transit) without significant interference from the road traffic, over the long-term, a planning prerogative could be to increase its P function by more dense and diverse land-use. As the modelling results suggest, station precincts with good public transport access (particularly compared to a car) could deliver maximum value for patronage.
- Coming back to ‘unbalanced’ stations, PnR is often thought as a temporary provision to generate transit patronage, until the time when the market is ready to deliver TODs; then car access will be replaced by feeder buses, flexible ‘first mile-last mile’ solutions, walking and cycling. This implies that current stations with good PnR provision could potentially be converted to better Places in the future. Obviously, if the current form and function of the precinct corresponds to a high level of Place, that could be transformed in a better N/Transit precinct with the right investment program (improved station and city-wide access) and assuming such investment would represent value for money.
- Our analysis also highlighted interesting corridor patterns, with unique structures to each rail line, which suggest strategies at this level, rather than individual station precincts.
6.3. Limitations
As with any research, there are a number of limitations, which should be considered when applying these findings or adopting further work directions:
- The analysis of the role of stations in the whole transport network system and across the metro area is recommended, given that densification and changes in P and N are not limited to the immediate surroundings of the station precincts.
- Most of the analysis was undertaken at the station precinct level (800 m and 1.6km buffers) using current conditions, thus not exploring the potential catchment areas. The parameters of the regression models would change if the analysis expanded beyond 1.6km, because the densities differ within the station precinct.
The limited sample size has not allowed for a multi-level analysis (i.e., using clusters as moderators), therefore further work on larger networks (and/or including activity centers) is warranted.
Author Contributions
Conceptualization, D.O. and S.B.; methodology, D.O. and B.S.; software, S.M. and T.R.; formal analysis, D.O. and G.M.; investigation, B.S. and Y.S.; resources, C.P.; data curation, G.M., S.M., and T.R.; writing—original draft preparation, D.O.; writing—review and editing, C.P. and S.B.; visualization, S.M. and T.R.; supervision, S.B.; project administration, D.O.; funding acquisition, S.B.
Funding
This research was funded by the Planning and Transport Research Centre number PATREC 2017_1.
Conflicts of Interest
The authors declare no conflict of interest. The funders had no role in the design of the study; in the collection, analyses, or interpretation of data; in the writing of the manuscript, or in the decision to publish the results.
References
- Cervero, R.; Kockelman, K. Travel Demand and the 3Ds: Density, Diversity and Design. Transp. Res. D 1997, 2, 199–219. [Google Scholar] [CrossRef]
- Cervero, R.; Sarmiento, O.L.; Jacoby, E.; Gomez, L.F.; Neiman, A. Influences of built environments on walking and cycling: Lessons from Bogota. Int. J. Sustain. Transp. 2009, 3, 203–226. [Google Scholar] [CrossRef]
- Chatman, D.G. Does TOD Need the T? J. Am. Plan. Assoc. 2013, 79, 17–31. [Google Scholar] [CrossRef]
- Cervero, R. Built environments and mode choice: Toward a normative framework. Transp. Res. D 2002, 7, 265–284. [Google Scholar] [CrossRef]
- Curtis, C.; Renne, J.L.; Bertolini, L. Transit Oriented Development: Making It Happen; Ashgate Publishing Ltd.: Farnham, UK, 2009. [Google Scholar]
- Attard, M.; Shiftan, Y. Sustainable Urban Transport–An Introduction. In Sustainable Urban Transport; Attard, M., Shiftan, Y., Eds.; Emerald Group Publishing Limited: Bingley, UK, 2015; pp. 14–24. [Google Scholar]
- Nahlik, M.J.; Chester, M.V. Transit-oriented smart growth can reduce life-cycle environmental impacts and household costs in Los Angeles. Transp. Pol. 2014, 35, 21–30. [Google Scholar] [CrossRef]
- Curtis, C. The evolution of the TOD model for low-density cities: A case study of Perth. Plan. Pract. Res. 2008, 23, 285–302. [Google Scholar] [CrossRef]
- Kamruzzaman, M.; Baker, D.C.; Washington, S.; Turrell, G. Advance transit oriented development typology: Case study in Brisbane, Australia. J. Transp. Geogr. 2013, 34, 54–70. [Google Scholar] [CrossRef]
- Bertolini, L. Spatial Development Patterns and Public Transport: The Application of an Analytical Model in The Netherlands. Plan. Pract. Res. 1999, 14, 199–210. [Google Scholar] [CrossRef]
- Peek, G.-J.; Bertolini, L.; De Jonge, H. Gaining insight in the development potential of station areas: A decade of node-place modelling in The Netherlands. Plan. Pract. Res. 2006, 21, 443–462. [Google Scholar] [CrossRef]
- Singh, Y.J.; Lukman, A.; He, P.; Flacke, J.; Zuidgeest, M.; van Maarseveen, M. Measuring TOD over a region using GIS based multiple criteria assessment tools. SPACE SPA J. Plan. Archit. 2015, 19, 1–22. [Google Scholar]
- Chorus, P.; Bertolini, L. An application of the node-place model to explore the spatial development dynamics of station areas in Tokyo. J. Transp. Land Use 2011, 4, 45–58. [Google Scholar]
- Chen, X.; Lin, L. The node-place analysis on the “hubtropolis” urban form: The case of Shanghai Hongqiao air-rail hub. Habitat Int. 2015, 49, 445–453. [Google Scholar] [CrossRef]
- Lyu, G.; Bertolini, L.; Pfeffer, K. Developing a TOD typology for Beijing metro station areas. J. Transp. Geogr. 2016, 55, 40–50. [Google Scholar] [CrossRef]
- Vale, D.S.; Viana, C.M.; Pereira, M. The extended node-place model at the local scale: Evaluating the integration of land use and transport for Lisbon’s subway network. J. Transp. Geogr. 2018, 69, 282–293. [Google Scholar] [CrossRef]
- Babb, C.; Falconer, R.; Olaru, D.; Duckworth-Smith, A.; Isted, R. Transport and Land Use Functions of Four Rail Station Configurations in Perth. In Planning Boomtown and Beyond; Bierman, S., Olaru, D., Paül, D.V., Eds.; UWA Publishing: Perth, WA, Australia, 2016; pp. 424–445. [Google Scholar]
- Falconer, R.; Babb, C.; Olaru, D. Cities as Systems: Node and Place Conflict across a Rail Transit Network. In Planning Boomtown and Beyond; Biermann, S., Olaru, D., Paül, V., Eds.; UWA Publishing: Perth, WA, Australia, 2016; pp. 446–475. [Google Scholar]
- Venigalla, M.; Dixit, S.; Pulugurtha, S. A methodology to derive land use specific auto-trip emission footprints from household travel survey data. Urban Plan. Transp. Res. 2018, 6, 111–128. [Google Scholar] [CrossRef]
- Jabareen, Y.R. Sustainable Urban Forms: Their Typologies, Models, and concepts. J. Plan. Educ. Res. 2006, 26, 38–52. [Google Scholar] [CrossRef]
- Guerra, E.; Cervero, R.; Tischler, D. Half-Mile Circle. Does it Best Represent Train Station Catchments. Transp. Res. Rec. 2014, 2276, 101–109. [Google Scholar] [CrossRef]
- Center for Transit-Oriented Development (CTOD) Capturing the Value of Transit. Available online: http://ctod.org/portal/node/2177 (accessed on 28 November 2018).
- Department of Transport. Perth Transport Plan for 3.5 Million People and Beyond; DOT: Perth, WA, Australia, 2016. Available online: https://www.transport.wa.gov.au/projects/perth-and-peel-3-5million-transport-network.asp (accessed on 28 November 2018).
- Monajem, S.; Ekram Nosratian, F. The evaluation of the spatial integration of station areas via the node place model; an application to subway station areas in Tehran. Transp. Res. D 2015, 40, 14–27. [Google Scholar] [CrossRef]
- Irvin-Erickson, Y.; La Vigne, N. A spatio-temporal analysis of crime at Washington, DC metro rail: Stations crime-generating and crime-attracting characteristics as transportation nodes and places. Crime Sci. 2015, 4, 14. [Google Scholar] [CrossRef]
- Vale, D.S. Transit-oriented development, integration of land use and transport, and pedestrian accessibility: Combining node-place model with pedestrian shed ratio to evaluate and classify station areas in Lisbon. J. Transp. Geogr. 2015, 45, 70–80. [Google Scholar] [CrossRef]
- Cervero, R.; Duncan, M. Which Reduces Vehicle Travel More: Jobs-Housing Balance or Retail-Housing Mixing? J. Am. Plan. Assoc. 2006, 72, 475–490. [Google Scholar] [CrossRef]
- Ewing, R.; Cervero, R. Travel and the Built Environment. J. Am. Plan. Assoc. 2010, 76, 265–294. [Google Scholar] [CrossRef]
- Ritsema van Eck, J.; Koomen, E. Characterising urban concentration and land-use diversity in simulations of future land use. Ann. Reg. Sci. 2008, 42, 123–140. [Google Scholar] [CrossRef]
- Zhao, P. The impact of the built environment on bicycle commuting: Evidence from Beijing. Urban Stud. 2014, 51, 1019–1037. [Google Scholar] [CrossRef]
- Chatman, D.G. Deconstructing development density: Quality, quantity and price effects on household non-work travel. Transp. Res. A 2008, 42, 1009–1031. [Google Scholar] [CrossRef]
- Loo, B.P.; du Verle, F. Transit-oriented development in future cities: Towards a two-level sustainable mobility strategy. Int. J. Urban. Sci. 2017, 21, 54–67. [Google Scholar] [CrossRef]
- Reusser, D.E.; Loukopoulos, P.; Stauffacher, M.; Scholz, R.W. Classifying railway stations for sustainable transitions–balancing node and place functions. J. Transp. Geogr. 2008, 16, 191–202. [Google Scholar] [CrossRef]
- Searle, G.; Darchen, S.; Huston, S. Positive and Negative Factors for Transit Oriented Development: Case Studies from Brisbane, Melbourne and Sydney. Urban Policy Res. 2014, 32, 437–457. [Google Scholar] [CrossRef]
- Dovey, K.; Woodcock, I. Intensifying Melbourne. Transit-Oriented Urban Design for Resilient Urban Futures; Melbourne School of Design: Melbourne, Australia, 2014; Available online: https://msd.unimelb.edu.au/__data/assets/pdf_file/0007/2595616/Intensifying-Melbourne-2014_180dpi.pdf (accessed on 28 November 2018).
- The Economist Intelligence Unit (EIU). Global Liveability Index. Available online: http://www.eiu.com/topic/liveability (accessed on 28 November 2018).
- Dittmar, H.; Poticha, S. Defining transit-oriented development: The new regional building block. In The New Transit Town: Best Practices in Transit-Oriented Development; Dittmar, H., Ohland, G., Eds.; Island Press: Washington, WA, USA, 2012; pp. 19–40. [Google Scholar]
© 2019 by the authors. Licensee MDPI, Basel, Switzerland. This article is an open access article distributed under the terms and conditions of the Creative Commons Attribution (CC BY) license (http://creativecommons.org/licenses/by/4.0/).