Article

Beneficial Cecal Microbiome Modulation in Turkeys Exposed to Probiotics and Vaccine After Multidrug-Resistant Salmonella Heidelberg Challenge

by
Dhananjai Muringattu Prabhakaran
1,
Anup Kollanoor Johny
1,*,
Divek V. T. Nair
1,
Shijinaraj Manjankattil
1,
Timothy J. Johnson
2,
Sally Noll
1 and
Kent M. Reed
2
1
Department of Animal Science, University of Minnesota, Saint Paul, MN 55108, USA
2
Department of Veterinary and Biomedical Sciences, University of Minnesota, Saint Paul, MN 55108, USA
*
Author to whom correspondence should be addressed.
Microbiol. Res. 2025, 16(7), 136; https://doi.org/10.3390/microbiolres16070136
Submission received: 24 April 2025 / Revised: 29 May 2025 / Accepted: 30 May 2025 / Published: 25 June 2025

Abstract

Salmonella Heidelberg (SH) is a major serotype of foodborne Salmonella associated with turkeys. Understanding the effect of antibiotic alternatives (AAs) on the cecal microbiome of turkeys challenged with Salmonella could inform the development of microbiome-based strategies on farms. This study examined the effects of multiple AAs, such as probiotics, Lactobacillus and Propionibacterium, and a Salmonella Typhimurium vaccine, on the turkey cecal microbiome exposed to multidrug-resistant (MDR) SH. Microbial DNA was extracted from the cecal contents of 12-week-old commercial turkeys grown in five treatments for shotgun metagenomic sequencing and analysis: NC—Negative Control; PC—Salmonella Control; LAB—Lactobacillus treatment; PF—P. freudenreichii treatment; and VAC—vaccine treatment. Except for the NC, turkeys were challenged with MDR SH (108 CFU/turkey) on the 11th week. Differential abundance tests at the species level found that all AA treatments resulted in an increased abundance of multiple lactic acid-producing bacteria in the cecum compared to PC. In addition, multiple metabolic pathways were differentially abundant in AA treatments compared to PC. This study highlights the importance of AA strategies producing an increased abundance of lactic acid bacteria and critical metabolic pathways, indicating the potential of AAs to improve the gut health of turkeys during the Salmonella challenge.

1. Introduction

Microorganisms in the gut play an essential role in the host’s overall health [1]. Compared to mammals, the poultry gut contains fewer diverse microbes; one reason for that could be the rapid flow of food with a shorter food retention [2]. Nevertheless, food passes relatively slowly in the ceca of poultry, making it an ideal spot for microbes to grow and survive, including those with beneficial effects on the host [3]. In addition to being the primary site of fermentation, the cecum is also the site of Salmonella colonization in poultry [4]. Thus, the cecum is ideal for studying the microbiome of Salmonella-challenged poultry. Even though molecular techniques have identified more than 600 species of bacteria from cecal samples, many remain unclassified [5].
It is evident that some poultry gut microbiota help to reduce the pathogenicity of infectious microorganisms by inhibiting their colonization and producing short-chain fatty acids (SCFAs) and other metabolites [6,7]. Besides these beneficial effects, the microbiota can also be a source of pathogens with zoonotic potential [8,9]. Cecal microbiota dysbiosis often results from bacterial infection in poultry. Providing the day-old chick with probiotics could aid in making the gut resistant to pathogen colonization [10]. In addition to competition among the cecal microbiota and pathogenic bacteria for attachment, the production of bacteriocins, hydrogen peroxide, and SCFAs also benefits the host in producing resistance against enteric pathogens [11]. SCFAs such as lactic, propionic, acetic, and butyric acids are the primary energy substrates and help resist colonization by pathogens like Salmonella [12,13]. SCFAs are produced predominantly by anaerobes, both spore-forming and non-spore-forming bacteria of the typical gut habitat [10]. Probiotic supplementation with lactic acid bacteria, Bifidobacterium, Enterococcus, Bacilli, and Propionibacterium could help synthesize these SCFAs, thereby improving host growth and immunity [10,14].
The use of non-host-derived (dairy-origin) Propionibacterium freudenreichii and host-derived (turkey ileum-origin) Lactobacillus species is a relatively recent addition to combat Salmonella in turkeys. The antibacterial potential of these two probiotics against Salmonella serotypes prevalent in US turkey production has been previously reported by our group [15,16,17]. However, a comparison of these interventions with a USDA-approved Salmonella vaccine in turkey production has not been conducted in a single study. The use of more advanced metagenomic sequencing methods to decipher the mechanisms of microbiome modulation has also not been explored.
Administration of the Salmonella vaccine is a critical way to keep poultry safe from Salmonella infection. The three major types of Salmonella vaccines available are killed, live-attenuated, and subunit vaccines [18]. Most vaccines are produced from two serotypes: S. Enteritidis and S. Typhimurium (ST) [19]. Even though the ST vaccine’s aim is primarily to protect poultry against the ST serotype, cross-protection against other serotypes in turkeys has been reported [16,20,21]. The number of human infections due to ST and SH has decreased over the past two decades, and this decline is attributed to ST vaccination, indicating cross-species protection [20]. The cross-protection of ST against SH could occur because both are members of the same serogroup O:4 [22]. Additionally, the span of this vaccine has been extended to include some protection against S. Reading, S. Agona, and S. Saintpaul in turkeys [16].
The gastrointestinal microbiota could be a source of antibiotic resistance genes (ARGs) [23] due to birds interacting with their environment, including feed, water, and litter. Previous studies conducted with human, chicken, and swine gut samples have revealed the presence of genes conferring resistance to at least 20 antibiotics [23]. It is also reported that ARGs can be transferred from animal food sources such as poultry, pork, and beef to humans [24]. Studies have found that tetracycline-resistant genes are the prominent antibiotic class of resistomes detected from poultry cecal samples [25]. Multiple sources of ARGs persist in the farm environment and could accumulate in the turkey gut [26,27]. ARGs come with a fitness cost for the bacteria, potentially reducing the capacity to thrive in a non-antibiotic environment [28]. In this context, AA treatments could help reduce the abundance of ARG-carrying bacteria in the turkey cecum.
We hypothesized that AA treatments could improve gut health in adult turkeys challenged with SH by modulating the microbial composition and metagenomic functional potential, and reducing the abundance of resistance genes. The objectives of this study were to determine the effect of AA interventions (Lactobacillus probiotic, Propionibacterium probiotic, and ST vaccination) on (i) cecal microbiome and microbial association networks, (ii) metagenomic functional profiling, and (iii) ARGs in 12-week-old turkeys exposed to an MDR SH challenge through shotgun metagenomic sequencing and analysis.

2. Materials and Methods

2.1. Bacterial Strains and Culture Conditions

2.1.1. Probiotic Bacteria

The de Man Rogosa Sharpe broth (MRS; catalog no. NCM0079B, Neogen culture media, Lasing, MI, USA) was used to grow Propionibacterium probiotic [(Propionibacterium freudenreichii subsp. freudenreichii B3523 (PF; P. freudenreichii)] [16,29], and Lactobacillus probiotic [LAB; an equal concentration combination of turkey ileum-derived Ligilactobacillus salivarius UMNPBX2 (L. salivarius) and Lactobacillus sp. UMNPBX19] [15,16,17]. Following three consecutive subcultures, the probiotics were grown separately in 1 L of MRS broth. Following centrifugation for 15 min at 3600 rpm and 4 °C (Allegra X-14R, Beckman Coulter, South Kraemer Boulevard, CA, USA), the sedimented pellet was washed twice and resuspended in 1L of phosphate-buffered saline (PBS; pH 7.1) and added to drinking water of the poults at a rate of 107 CFU/mL in LAB and PF treatments from the day of hatching. Bacterial enumeration was performed by plating 100 µL of dilutions on MRS plates and incubating the plates at 37 °C for 24 h [16,17].

2.1.2. Salmonella enterica subsp. enterica Serovar Heidelberg (SH)

An MDR SH strain from the 2011 ground turkey outbreak [14,17] was used in this study. Briefly, 100 µL of the bacterial culture from a −80 °C frozen stock was grown at 37 °C for 24 h aerobically in 100 mL trypticase soy broth (TSB; catalog# NCM0004A, Neogen culture media, Lansing, MI, USA). The culture was grown for three 24 h growth cycles. The culture was centrifuged at 3600 rpm and 4 °C for 15 min. (Allegra X-14R, Beckman Coulter, South Kraemer Boulevard, CA, USA). The culture sediment was washed twice in PBS. The strain was made resistant to 50 μg/mL nalidixic acid (NA; CAS. no. 3374-05-8, Alfa Aesar, Haverhill, MA, USA) to avoid any inherent Salmonella in the turkey gut [16]. Ten-fold serial dilution and plating of samples were performed on xylose lysine deoxycholate agar plates (XLD; catalog# NCM0027B, Neogen culture media, Lansing, MI, USA) and were used for assessing SH growth after 24 h of incubation at 37 °C [30,31]. Each bird in every treatment, except NC, received 108 CFU SH via crop gavage, and Negative Control (NC) birds received PBS as a mock challenge.

2.2. Experimental Design

Day-old poults were grown in the University of Minnesota’s Poultry Teaching and Research Facility (PTRF) for 11 weeks, then moved to isolator rooms in the Research Animal Resources (RAR) isolation units at the University of Minnesota, Saint Paul campus. The birds were provided with adequate light, heat, and floor space, as recommended for their age. Salmonella-free ad libitum isocaloric feed and water were supplied per recommendations [32]. Day-old poults were randomly distributed into five treatments: Negative control (NC; poults without P. freudenreichii, Lactobacillus, vaccine or SH challenge), Salmonella (positive) control (PC; poults challenged with SH), and three antibiotic alternative (AA) treatments: (1) the PF treatment (poults supplemented with P. freudenreichii, and challenged with SH), (2) the LAB treatment (poults supplemented with Lactobacillus and challenged with SH) and (3) the VAC treatment [poults vaccinated with a commercial S. Typhimurium vaccine (AviPro® Megan® Egg, Elanco Animal Health, Greenfield, IN, USA) and challenged with SH]. Each treatment had eight birds split into two pens (a total of 10 pens; N = 40). This split was performed to accommodate a maximum of four 11-week-old turkeys in a Biosafety Level (BSL) 2 isolator for the Institutional Animal Care and Use Committee (IACUC)- and Institutional Biosafety Committee (IBC)-regulated challenge study (average body weight = 8–9 kg/turkey). This sample size was sufficient to determine a meaningful difference of 2 log10 CFU/g of SH between PC and any AA treatment with an α = 0.01, SD = 0.25, and power of 99% (PROC POWER—SAS 9.4). The birds in the PF treatment were provided with 107 CFU/mL of P. freudenreichii, and birds in the LAB treatment were supplied with 107 CFU/mL of Lactobacillus on alternate days through drinking water (5 gallons) for 11 weeks. At 11 weeks of age, PC, PF, LAB, and VAC were challenged with SH (108 CFU/bird) using the crop gavage method. After the challenge, P. freudenreichii and Lactobacillus were supplemented in the respective treatments daily for 7 days. After 7 days of challenge, all (12-week-old) turkeys were euthanized. Cecal samples were collected into sterile 50 mL centrifuge tubes and used for DNA extraction (8 turkeys × 5 treatments = 40 cecal samples). The collected samples were stored at −20 °C until DNA extraction.

2.3. DNA Extraction, Library Preparation, and Sequencing

DNA extraction from the cecal content samples was performed using the DNeasy PowerSoil kit (Qiagen, Valencia, CA, USA) following the manufacturer’s instructions. The quality of the extracted DNA was checked using an IMPLEN nanophotometer. DNA samples with a 260/280 absorption ratio between 1.8 and 2.1 were sent to the University of Minnesota Genomic Center (UMGC) for library preparation and sequencing. Libraries were prepared using the NexteraXT library kit (Illumina Inc., San Diego, CA, USA), and shotgun metagenomic sequencing was performed on a single lane of the Illumina NovaSeq S4 2×150-bp platform.

2.4. Bioinformatics and Data Analysis

The quality of the resulting paired-end raw sequences was measured with FastQC (version 0.11.7). Sequences were then trimmed to remove low-quality (QC score < 20) reads and adapter sequences using Trim Galore version 0.6.10 [33]. After quality check, the filtered reads were aligned to the host genome (Meleagris gallopavo) obtained from Ensembl (release 109) [34] to remove host genomic DNA using --pipeline option rm_host within AMR++ v3 [35]. Filtered reads were then aligned to the MEGARes database v3.00 [35] (--pipeline resistome) for resistome analysis, and to the Kraken2 standard database [36] (--pipeline Kraken) for taxonomic analysis, respectively, using AMR++ v3. HUMAnN 2.0 [37] pipeline was used for microbial functional profiling to determine the abundance of microbial pathways. Further downstream analysis was performed in R version 4.3.1. (R core team, 2023). The phyloseq package [38] in R was the primary package for downstream data analysis and taxonomic and resistome analyses. Operational Taxonomic Units (OTUs) and resistome counts not present in at least four samples (10% of total samples) were filtered out to remove sparsely present OTUs and resistance genes. NetCoMi 1.1.0 was used to construct, analyze, and compare the microbial association network between treatments [39].
Since we were interested in the interaction of bacterial members of cecal microbiota from the microbial composition analysis, OTUs from the non-bacterial kingdom were removed. α diversity indices such as richness (number of observed OTUs) and the Shannon diversity index at the OTU level were measured using the package vegan [40], and statistical analysis was performed using a pairwise Wilcoxon test. The centered log-ratio (clr) method was used to normalize and enhance the interpretability of the β diversity using the microbiome package [41]. Principal component analysis (PCA) was used for β diversity visualization. Statistical significance in β diversity among the treatments was analyzed using permutational multivariate analysis of variance (PERMANOVA) implemented in the adonis2 function from the vegan package with 1000 permutations [42]. For pairwise comparison, pairwise.adonis function (pairwise PERMANOVA test) was employed with the Benjamini–Hochberg (BH) correction for multiple tests. The relative abundance of microbiota at the phylum and genus taxonomic levels was explored. The relative abundance of resistance genes at various levels, including type, class, mechanism, and group, was analyzed for the resistome study. OTUs and resistome counts with an abundance of less than 0.001 were filtered out to focus on more abundant OTUs and ARGs. All plots were constructed using the ggplot2 package [43] in R, and the statistical significance was tested at p < 0.05. ANCOM-BC2 [44] was used to find differentially abundant species and resistome in other treatments compared to PC. The phyloseq object (consisting of OTU/ARG count data, sample data, and taxonomic/resistome data) was the input for ANCOM-BC2, with assay_name set to counts, tax_level set to species, and treatment as the fix_formula. The minimum prevalence of species in each sample was set to 5%. The Dunnett’s test with PC as the reference was used to find differentially abundant species and resistome in treatments compared to PC. Mixed directional false discovery rate (mdFDR) with family-wise error control method set to Holm and a bootstrap value of 100 was considered in Dunnett’s test to control for the false discovery rate [44]. Species were considered differentially abundant at q-value < 0.01.
The phyloseq object was used as the input file in NetCoMi for microbial network analysis. The phyloseq object was first split based on the five treatments. The network was constructed between the PC and the other four treatments, focusing on the top fifty high-frequency taxa using the CClasso association measure [45]. The CClasso method considers the compositional nature of microbiome data and reduces spurious correlation results [39]. For network analysis, the output file from network construction was used. Each node in the network represents a species. The eigenvector centrality determined the node size in the network. Edges with a thickness of less than 0.1 were removed from the final network. Edge thickness indicates the strength of the association, with green color positive and red color negative estimated association. Here, the fast greedy modularity optimization was used as the clustering method, and eigenvector centrality was employed to determine the hub taxa from the nodes. Eigenvector centrality measures the connectedness of taxa (nodes) that are connected to other highly connected taxa [46]. Finding the hub taxa by eigenvector centrality helps to find important taxa that are connected to other well-connected taxa in the association network. Nodes above the 95th empirical quantile of centrality were chosen as hubs. Node color was based on the clustering of nodes. The network association plot represented the top 20 nodes with the highest eigenvector values to reduce crowdedness and improve readability. The output from network analysis was used as input for comparison and statistical analysis of the network association between the treatments (with a permutation of 1000 and adaptive BH for multiple testing corrections). Global network metrics such as positive edge percentage, edge density, and natural connectivity were compared between PC and the other four treatments.
The normalized unstratified pathway abundance output file containing the relative abundance count from HUMAnN2 was used as the input file for MaAsLin2 [47] package to determine differentially abundant microbial pathways in other treatments compared to PC. For the statistical analysis, the relative abundance count was the dependent variable, and the treatments were the independent variable. A negative binomial method with BH correction was used with PC as the reference (significance selected at q-value < 0.05).

3. Results

3.1. DNA Sequence Read Quality

Metagenomic sequencing produced 2.5 billion paired-end reads, with a mean sequence depth of 64.5 million reads per sample. The mean base quality score of the paired-end reads (R1-forward and R2-reverse) was above 30, suggestive of a high-quality sequence suitable for further downstream analysis [48].

3.2. Evaluation of Changes in Cecal Microbial Taxonomic Abundance and Diversity Indices, Network Association, and Microbial Functional Profiling

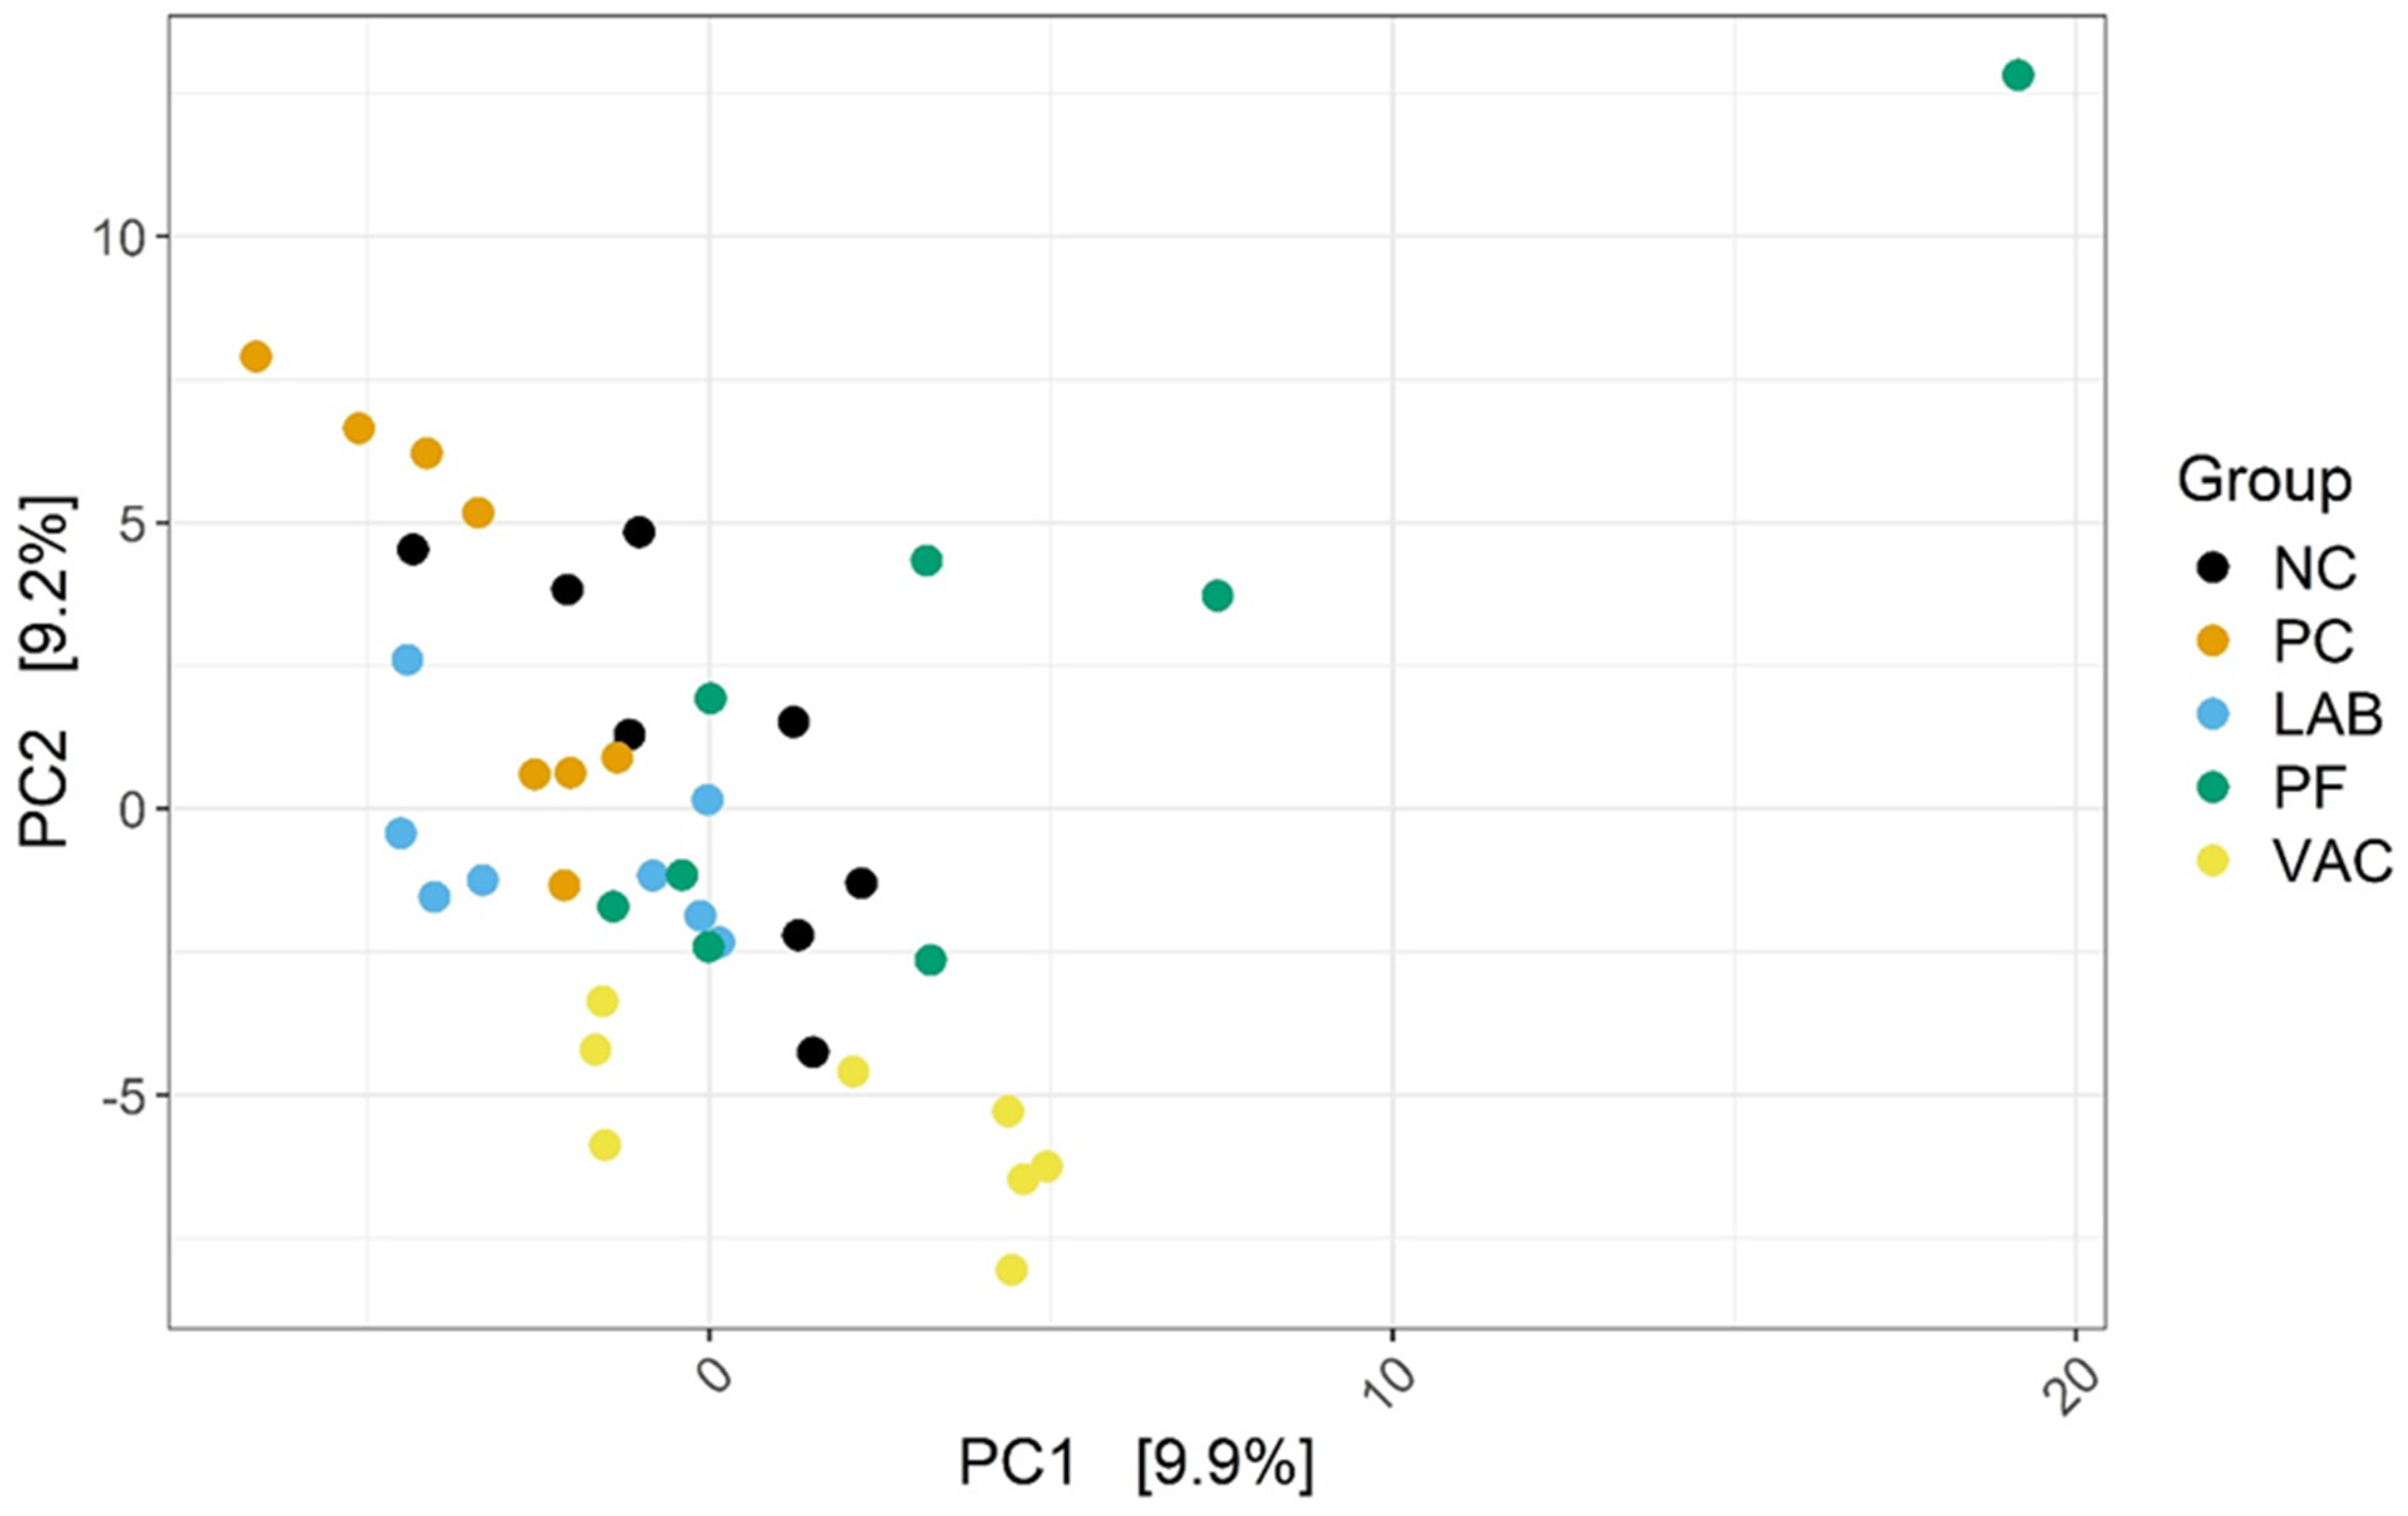
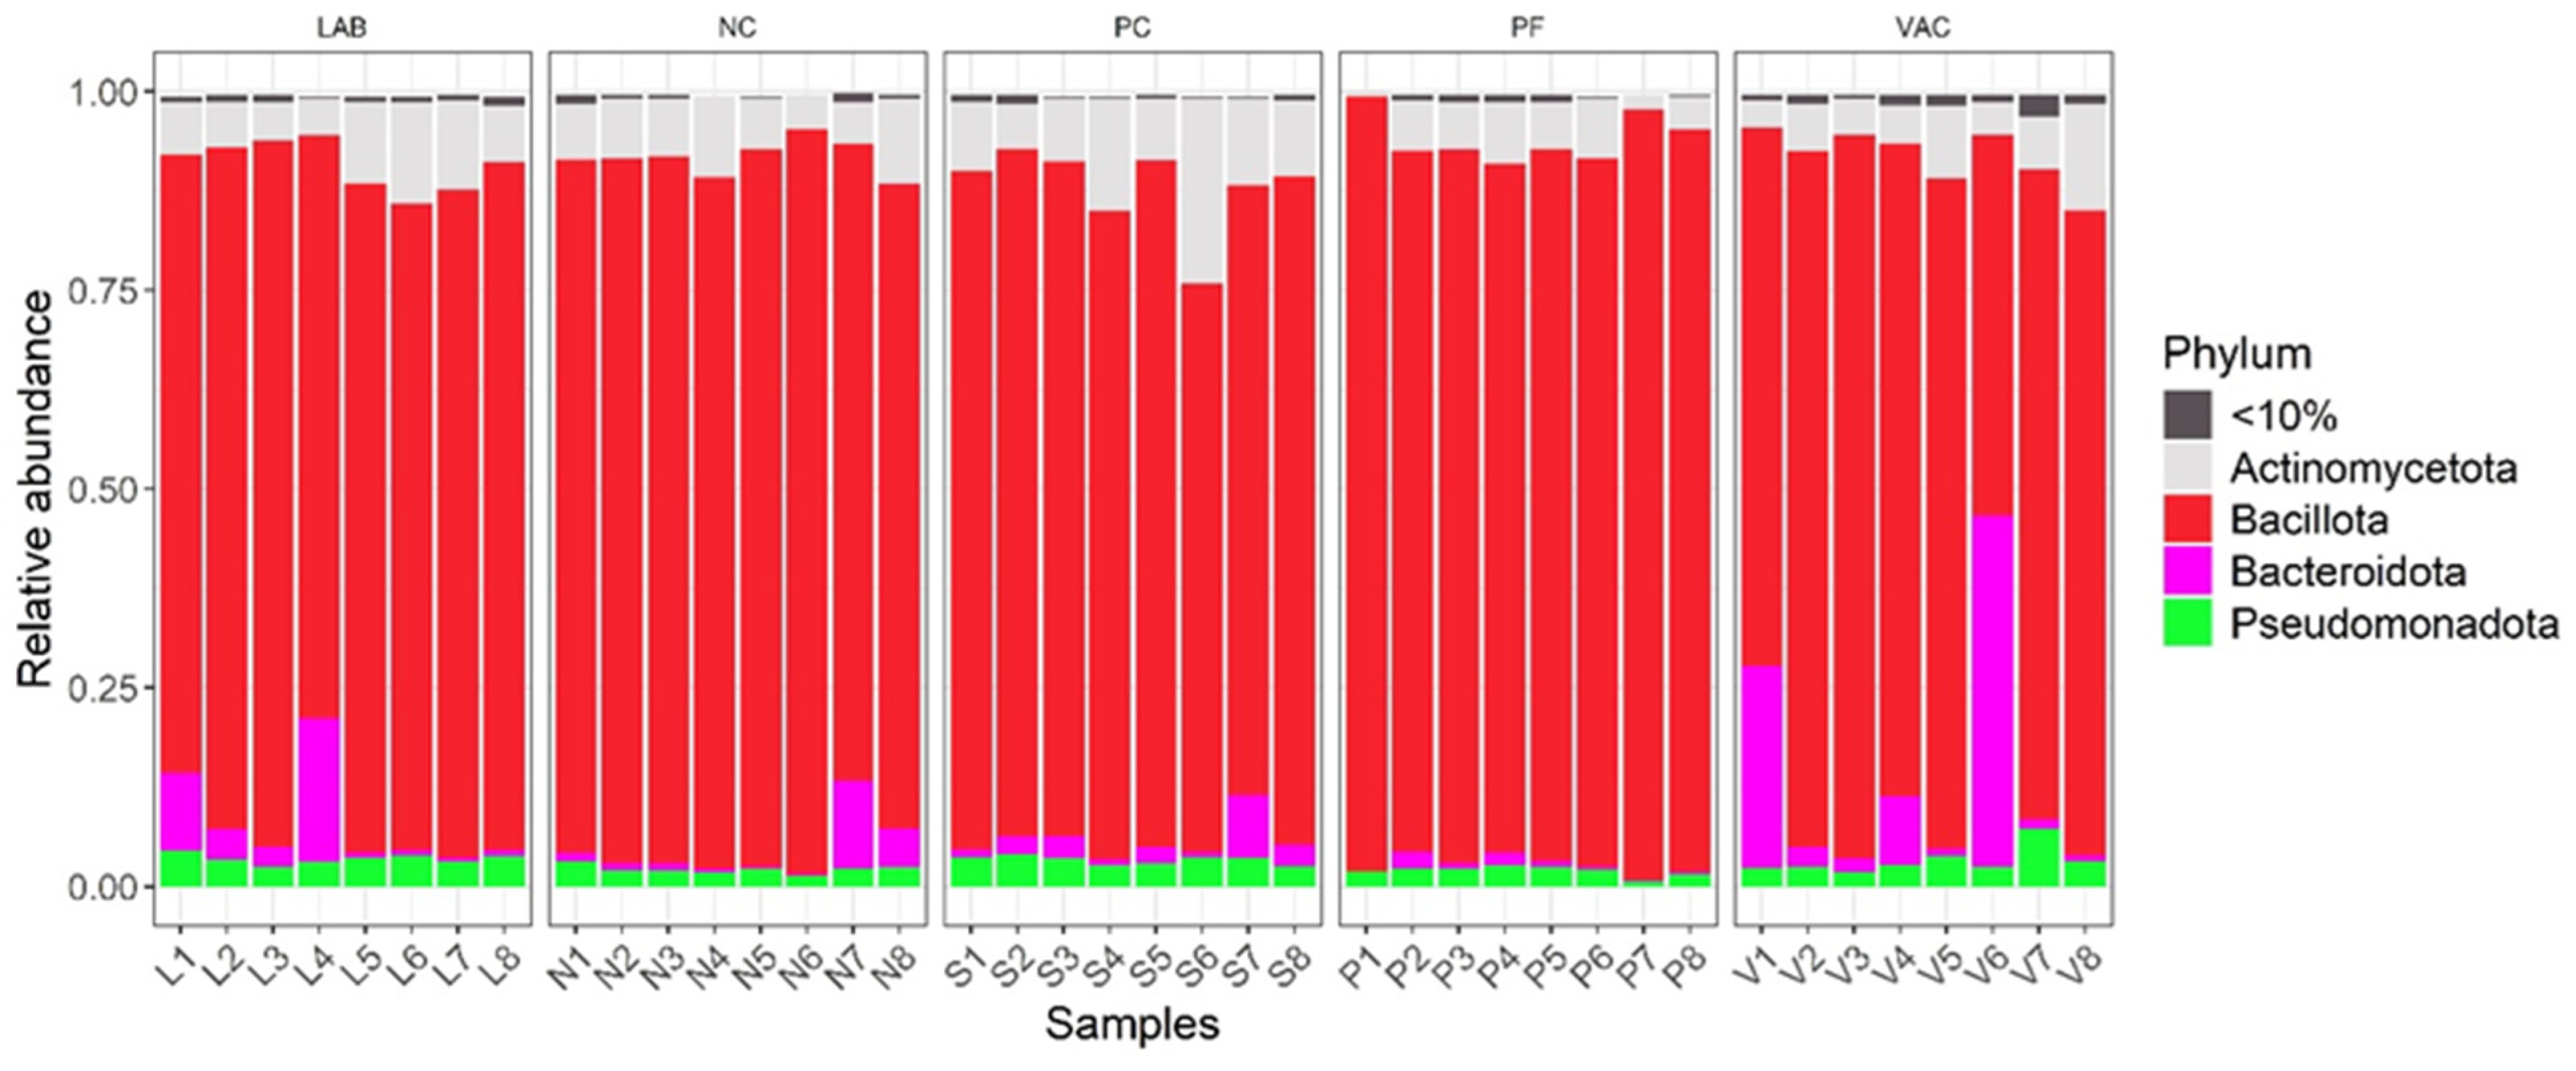
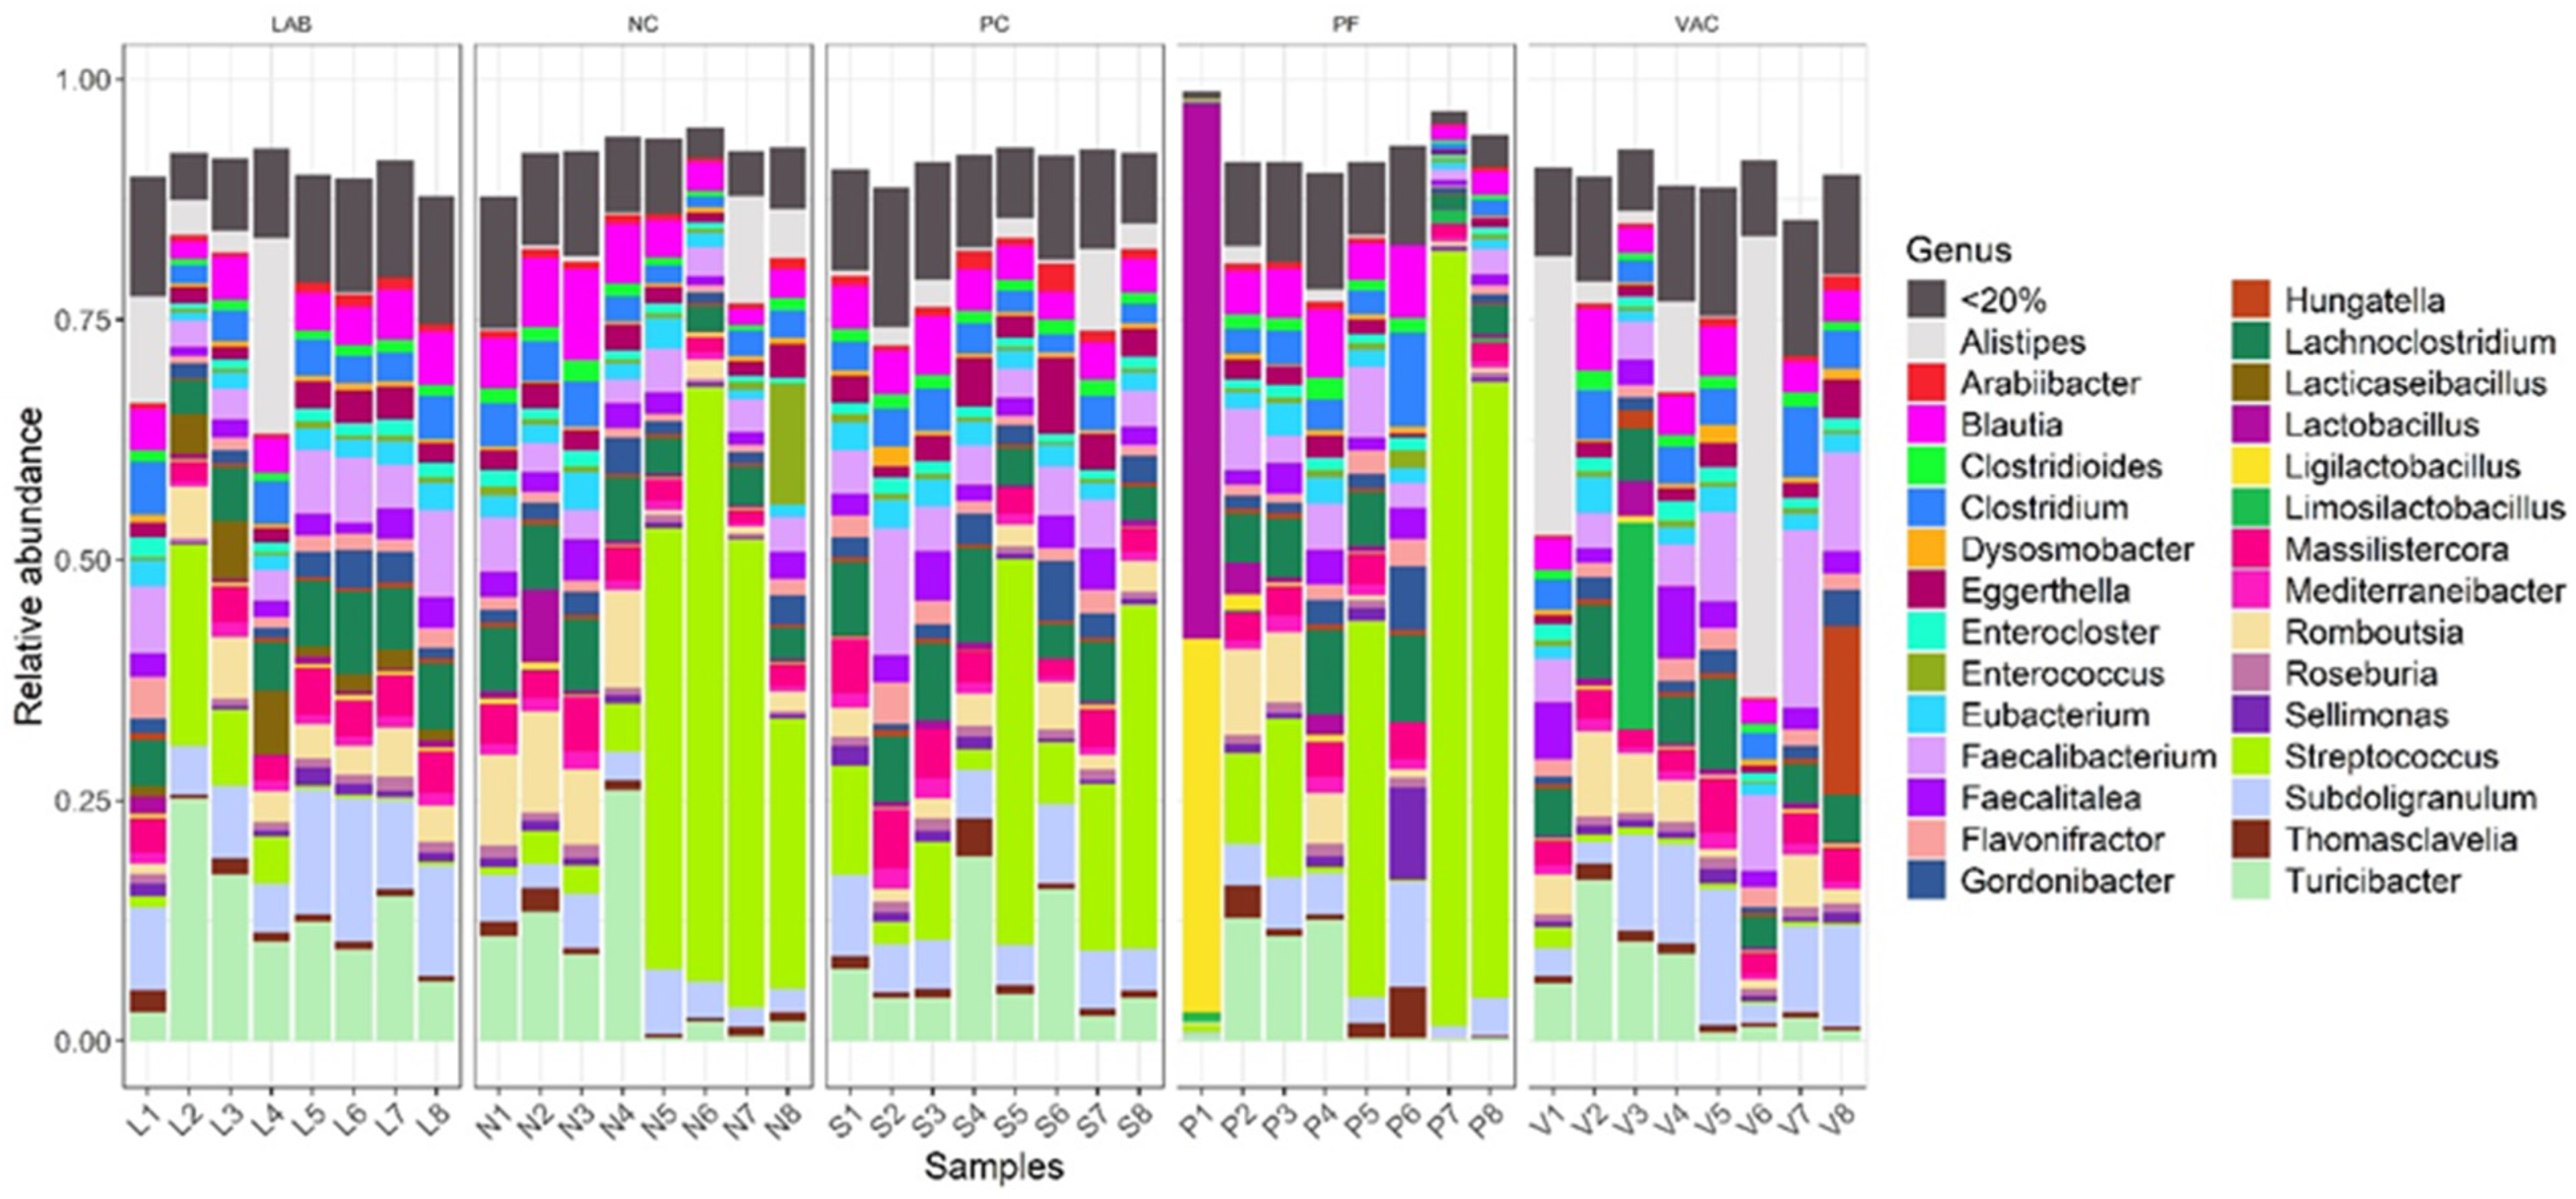
3.2.1. Taxonomic Diversity Measurement

A total of 12,576 OTUs were present across the samples. Filtering the sparsely present OTUs resulted in 10,431 OTUs, and selecting OTUs from the bacterial kingdom resulted in 9585 OTUs. There was no significant difference in microbiota richness or Shannon diversity among treatments (Figure S1A and S1B, respectively, p > 0.05). PERMANOVA analysis found that the treatments significantly impacted β diversity (p < 0.001, R2 = 19.21%) with a significant difference detected between NC and PC (NC-PC; p.adj = 0.015; Figure 1, Table S1). β diversity of PC also differed significantly from the three AA treatments (p.adj = 0.001; Figure 1, Table S1).
In the taxonomic composition, the most abundant phyla were Bacillota (Figure 2) (formerly phylum Firmicutes) [49], followed by Actinomycetota, Bacteriodota, and Pseudomonadota (formerly phylum Proteobacteria) [49].
The phylum Bacillota was the predominant phylum in all the treatments (NC: 87.14%, PC: 82.13%, LAB: 82.71%, PF: 91.37%, VAC: 77.91%) (Figure 2, Table S2). To better understand the change in the microbial composition among the treatments, we further analyzed the data at the genus level (Figure 3, Table S3).
The five most abundant genera in NC were Streptococcus (24.59%), Turicibacter (8.03%), Romboutsia (5.39%), Lachnoclostridium (5.13%), and Blautia (4.95%). In PC, Streptococcus (15.67%), Turicibacter (7.91%), Lachnoclostridium (6.18%), Subdoligranulum (5.80%), and Feacalibacterium (5.41%) were most abundant. The PF also had Streptococcus (26.42%) as the dominant genus, followed by Lactobacillus (8.92%), Ligilactobacillus (6.99%), Lachnoclostridium (4.93%), and Turicibacter (4.75%). In VAC, Limosilactobacillus (21.55%) was the most abundant genus followed by Alistipes (12.92%), Feacalibacterium (7.78%), Subdoligranulum (7.62%), and Turicibacter (5.99%). The LAB group had Turicibacter (12.35%) as the most abundant genus, followed by Subdoligranulum (9.40%), Alistipes (7.46%), Lachnoclostridium (5.94%), and Feacalibacterium (5.93%).
From the differential abundance test using ANCOM-BC2, we found 10 species differentially abundant in NC compared to PC. The abundance of three species was reduced, and seven species were increased in NC. The list of species can be found in Table S4. In LAB, 125 species were differentially abundant compared to PC (Table S5). In PF, there were 21 (Table S6), and in VAC, there were 260 species (Table S7) differentially abundant compared to PC. Seven species were differentially abundant in all three AA treatments: LAB, PF, and VAC compared to PC (Table 1). The abundance of Limosilactobacillus gastricus, Lactobacillus sp. ESL0681, Weissella hellenica, Pediococcus acidilactici, Liquorilactobacillus mali were increased, and the abundance of Massilia forsythiae and Tsuneonella dongtanensis was reduced in all three AA treatments compared to PC (Table 1).
In addition to this, the differential abundance of some of the lactic acid-producing bacteria increased in both LAB and VAC compared to PC. Those included Lacticaseibacillus rhamnosus, Ligilactobacillus saerimneri, Limosilactobacillus frumenti, and Lactobacillus gasseri. Leuconostoc mesenteroides, Lactobacillus jensenii, and Lacticaseibacillus paracasei. The full list of lactic acid-producing bacteria found differentially abundant in LAB and VAC is in Table S8.

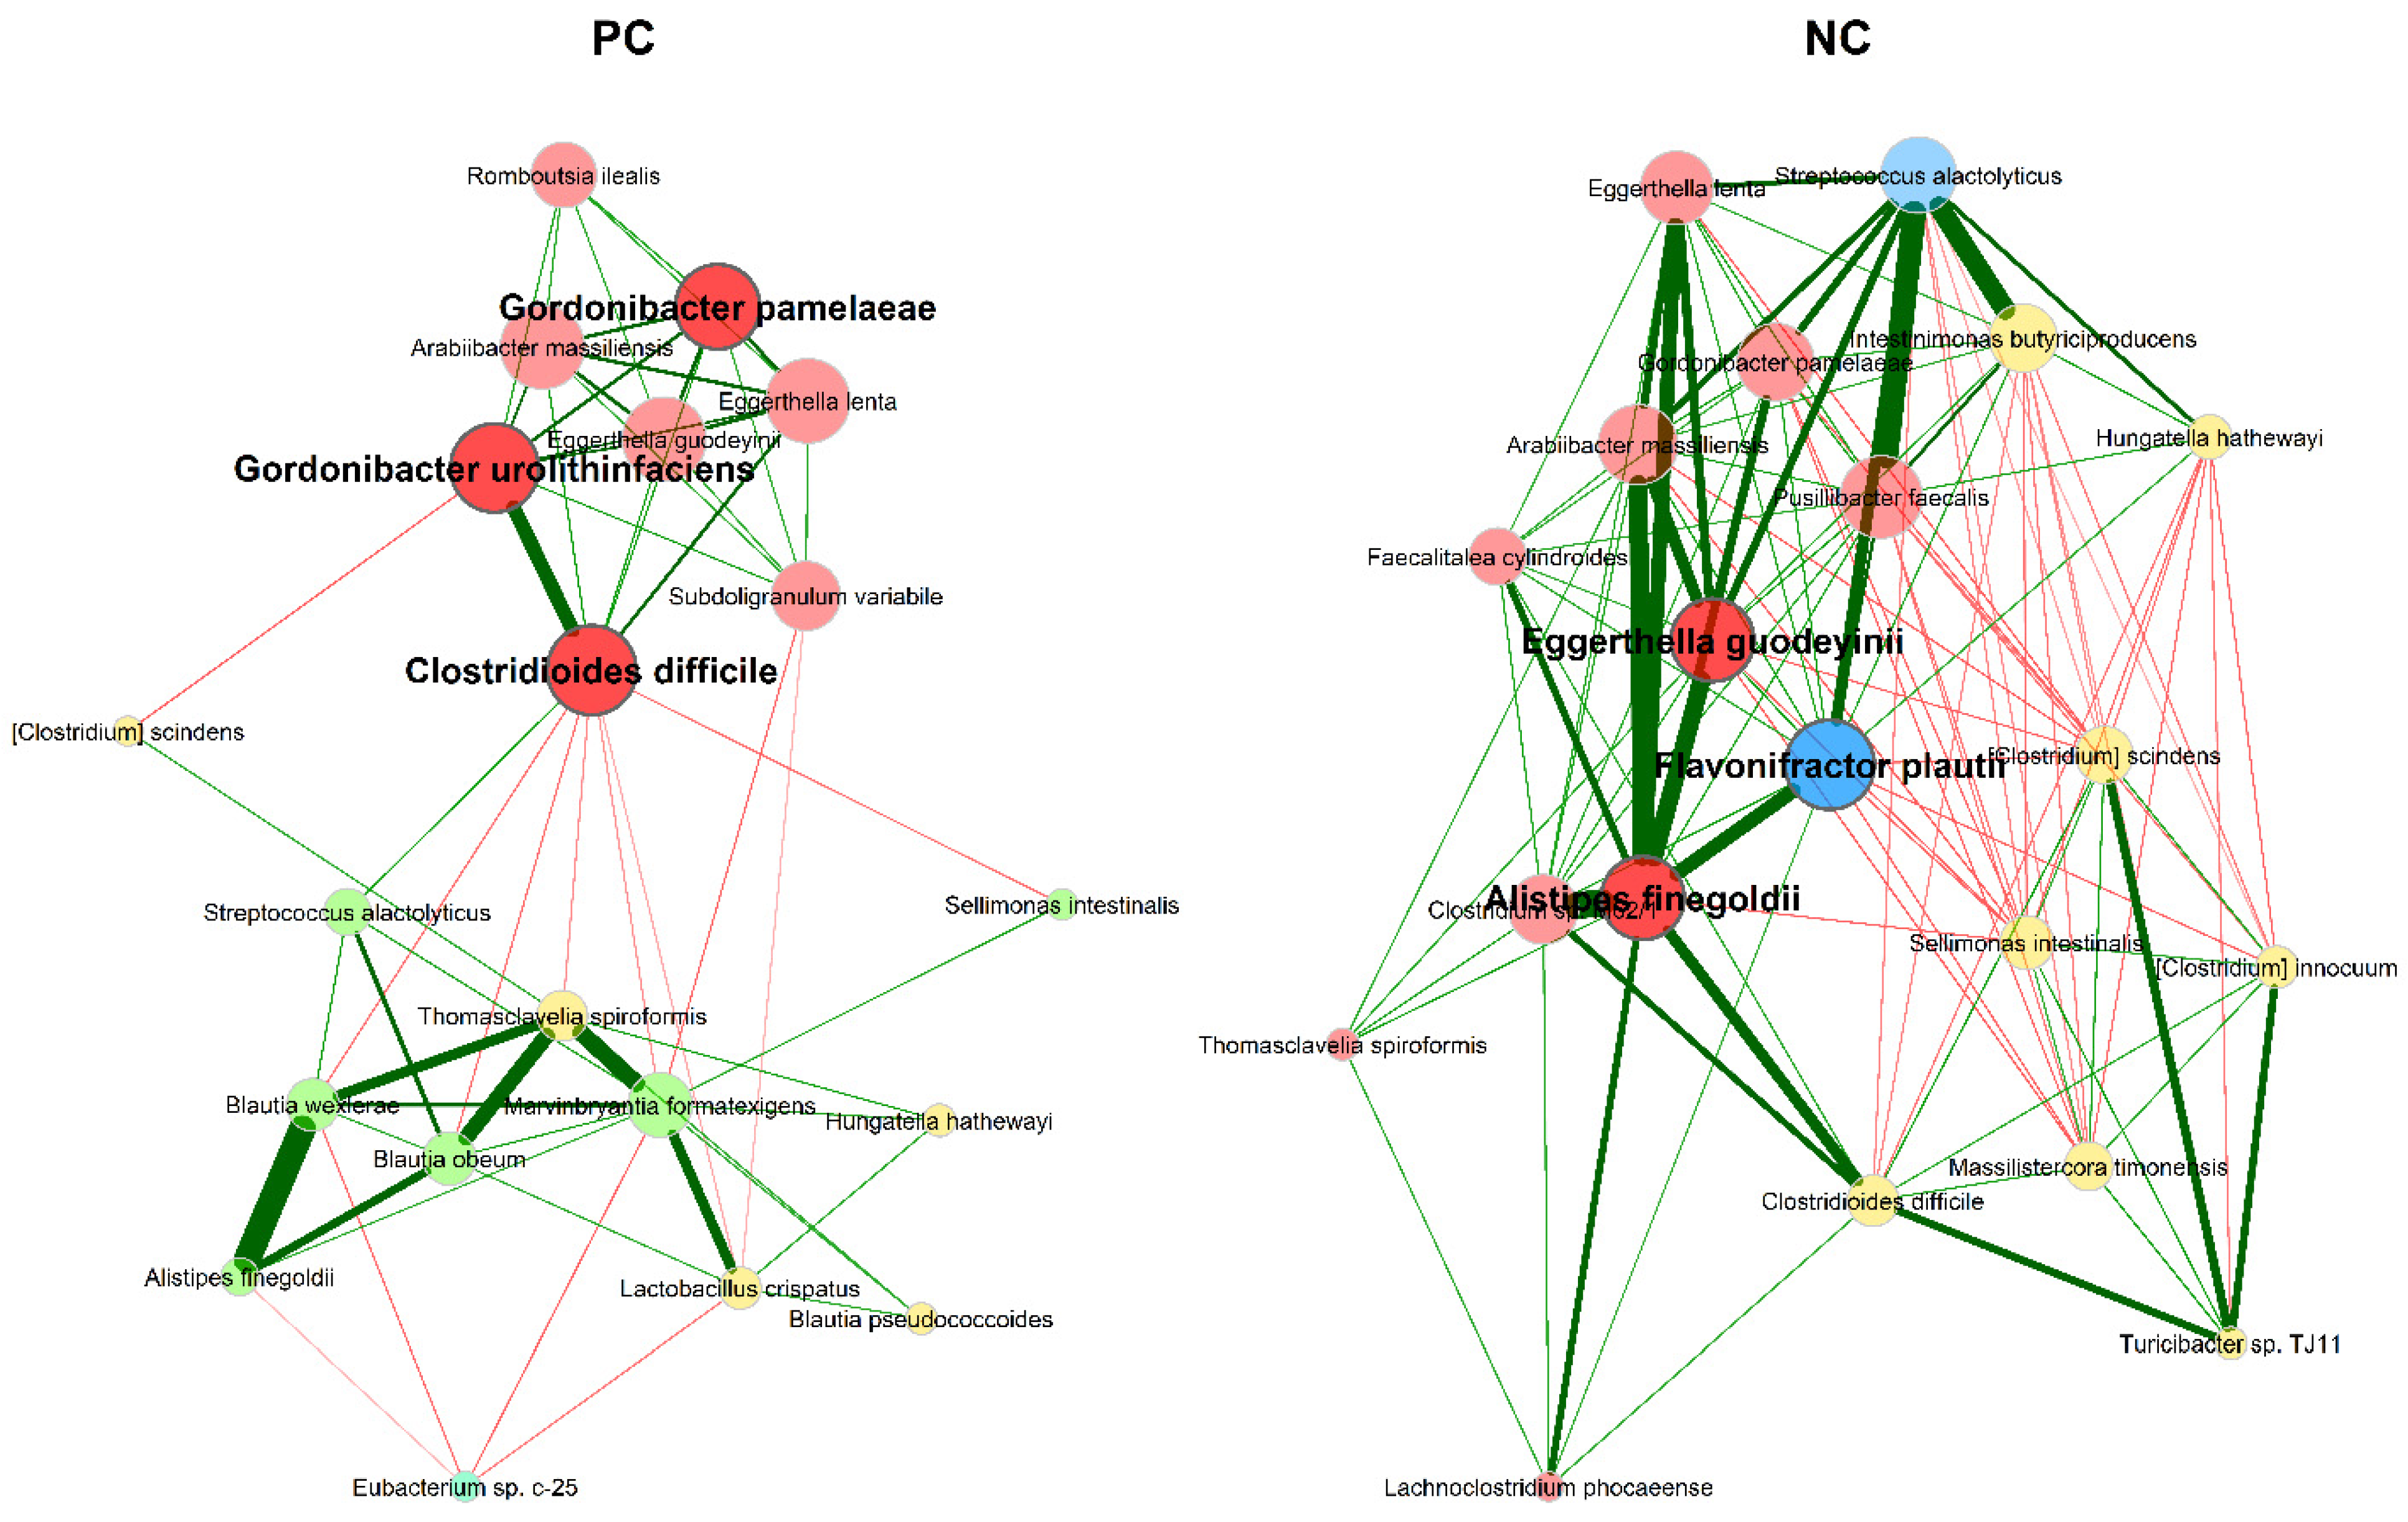
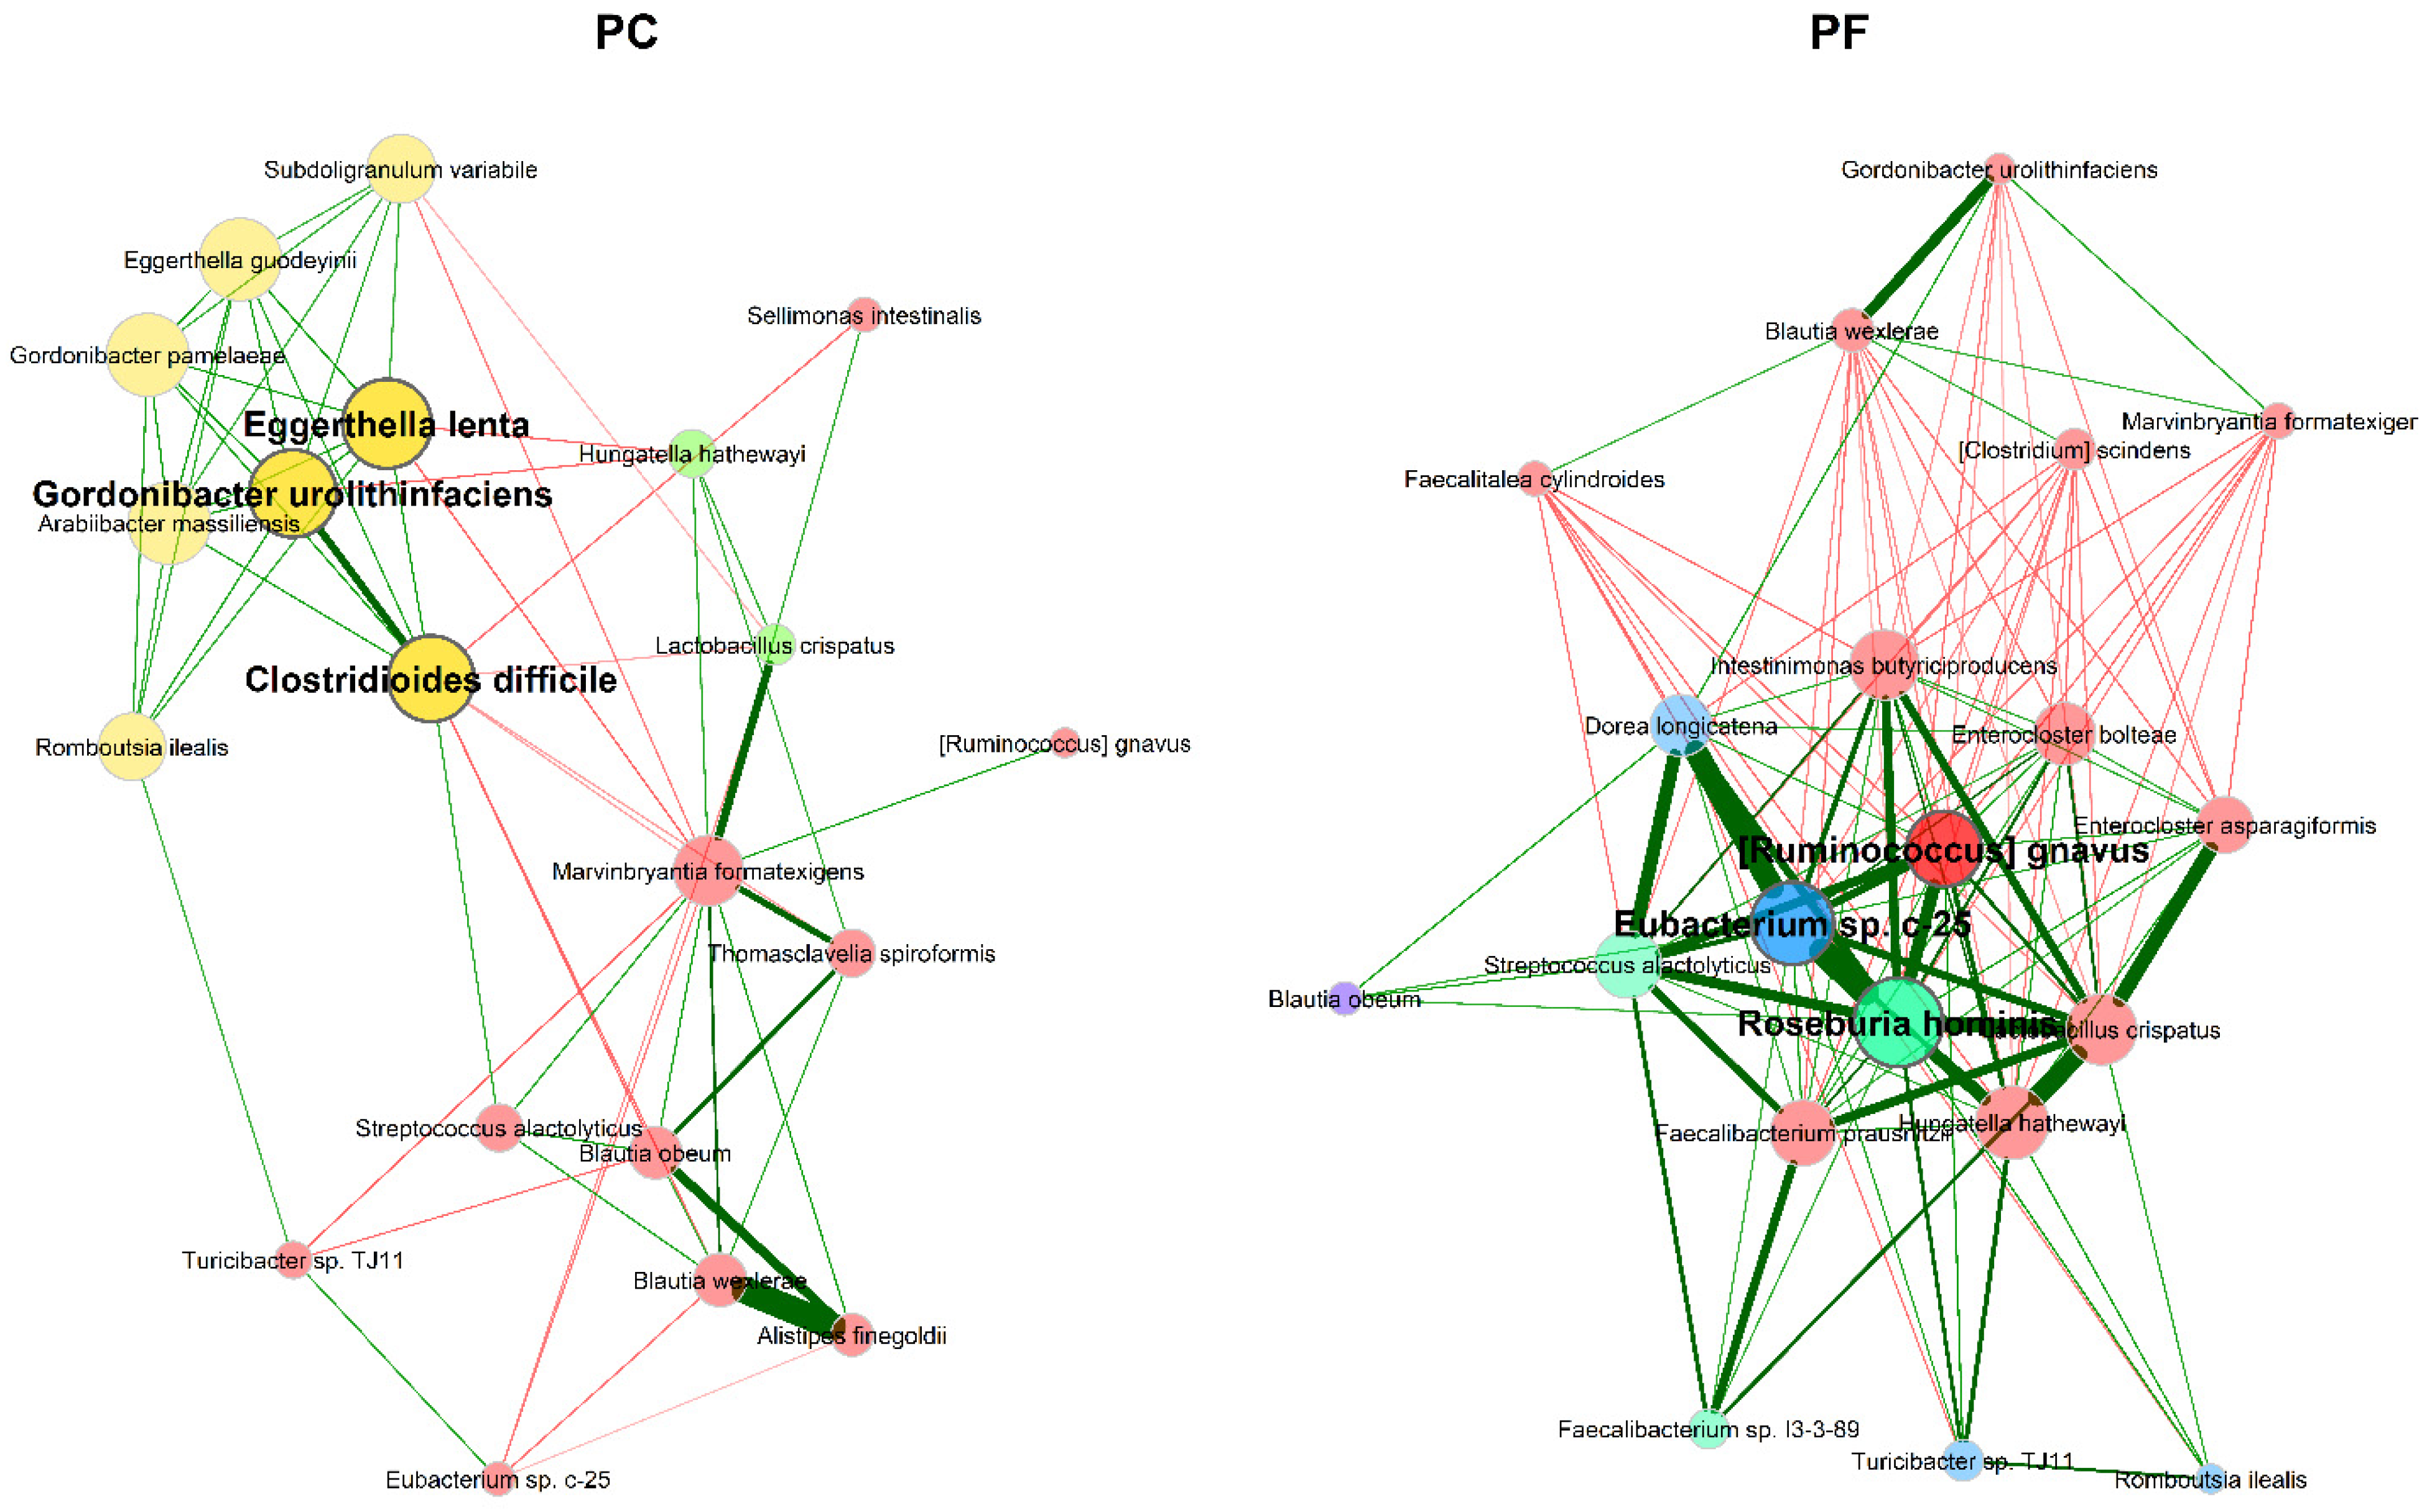
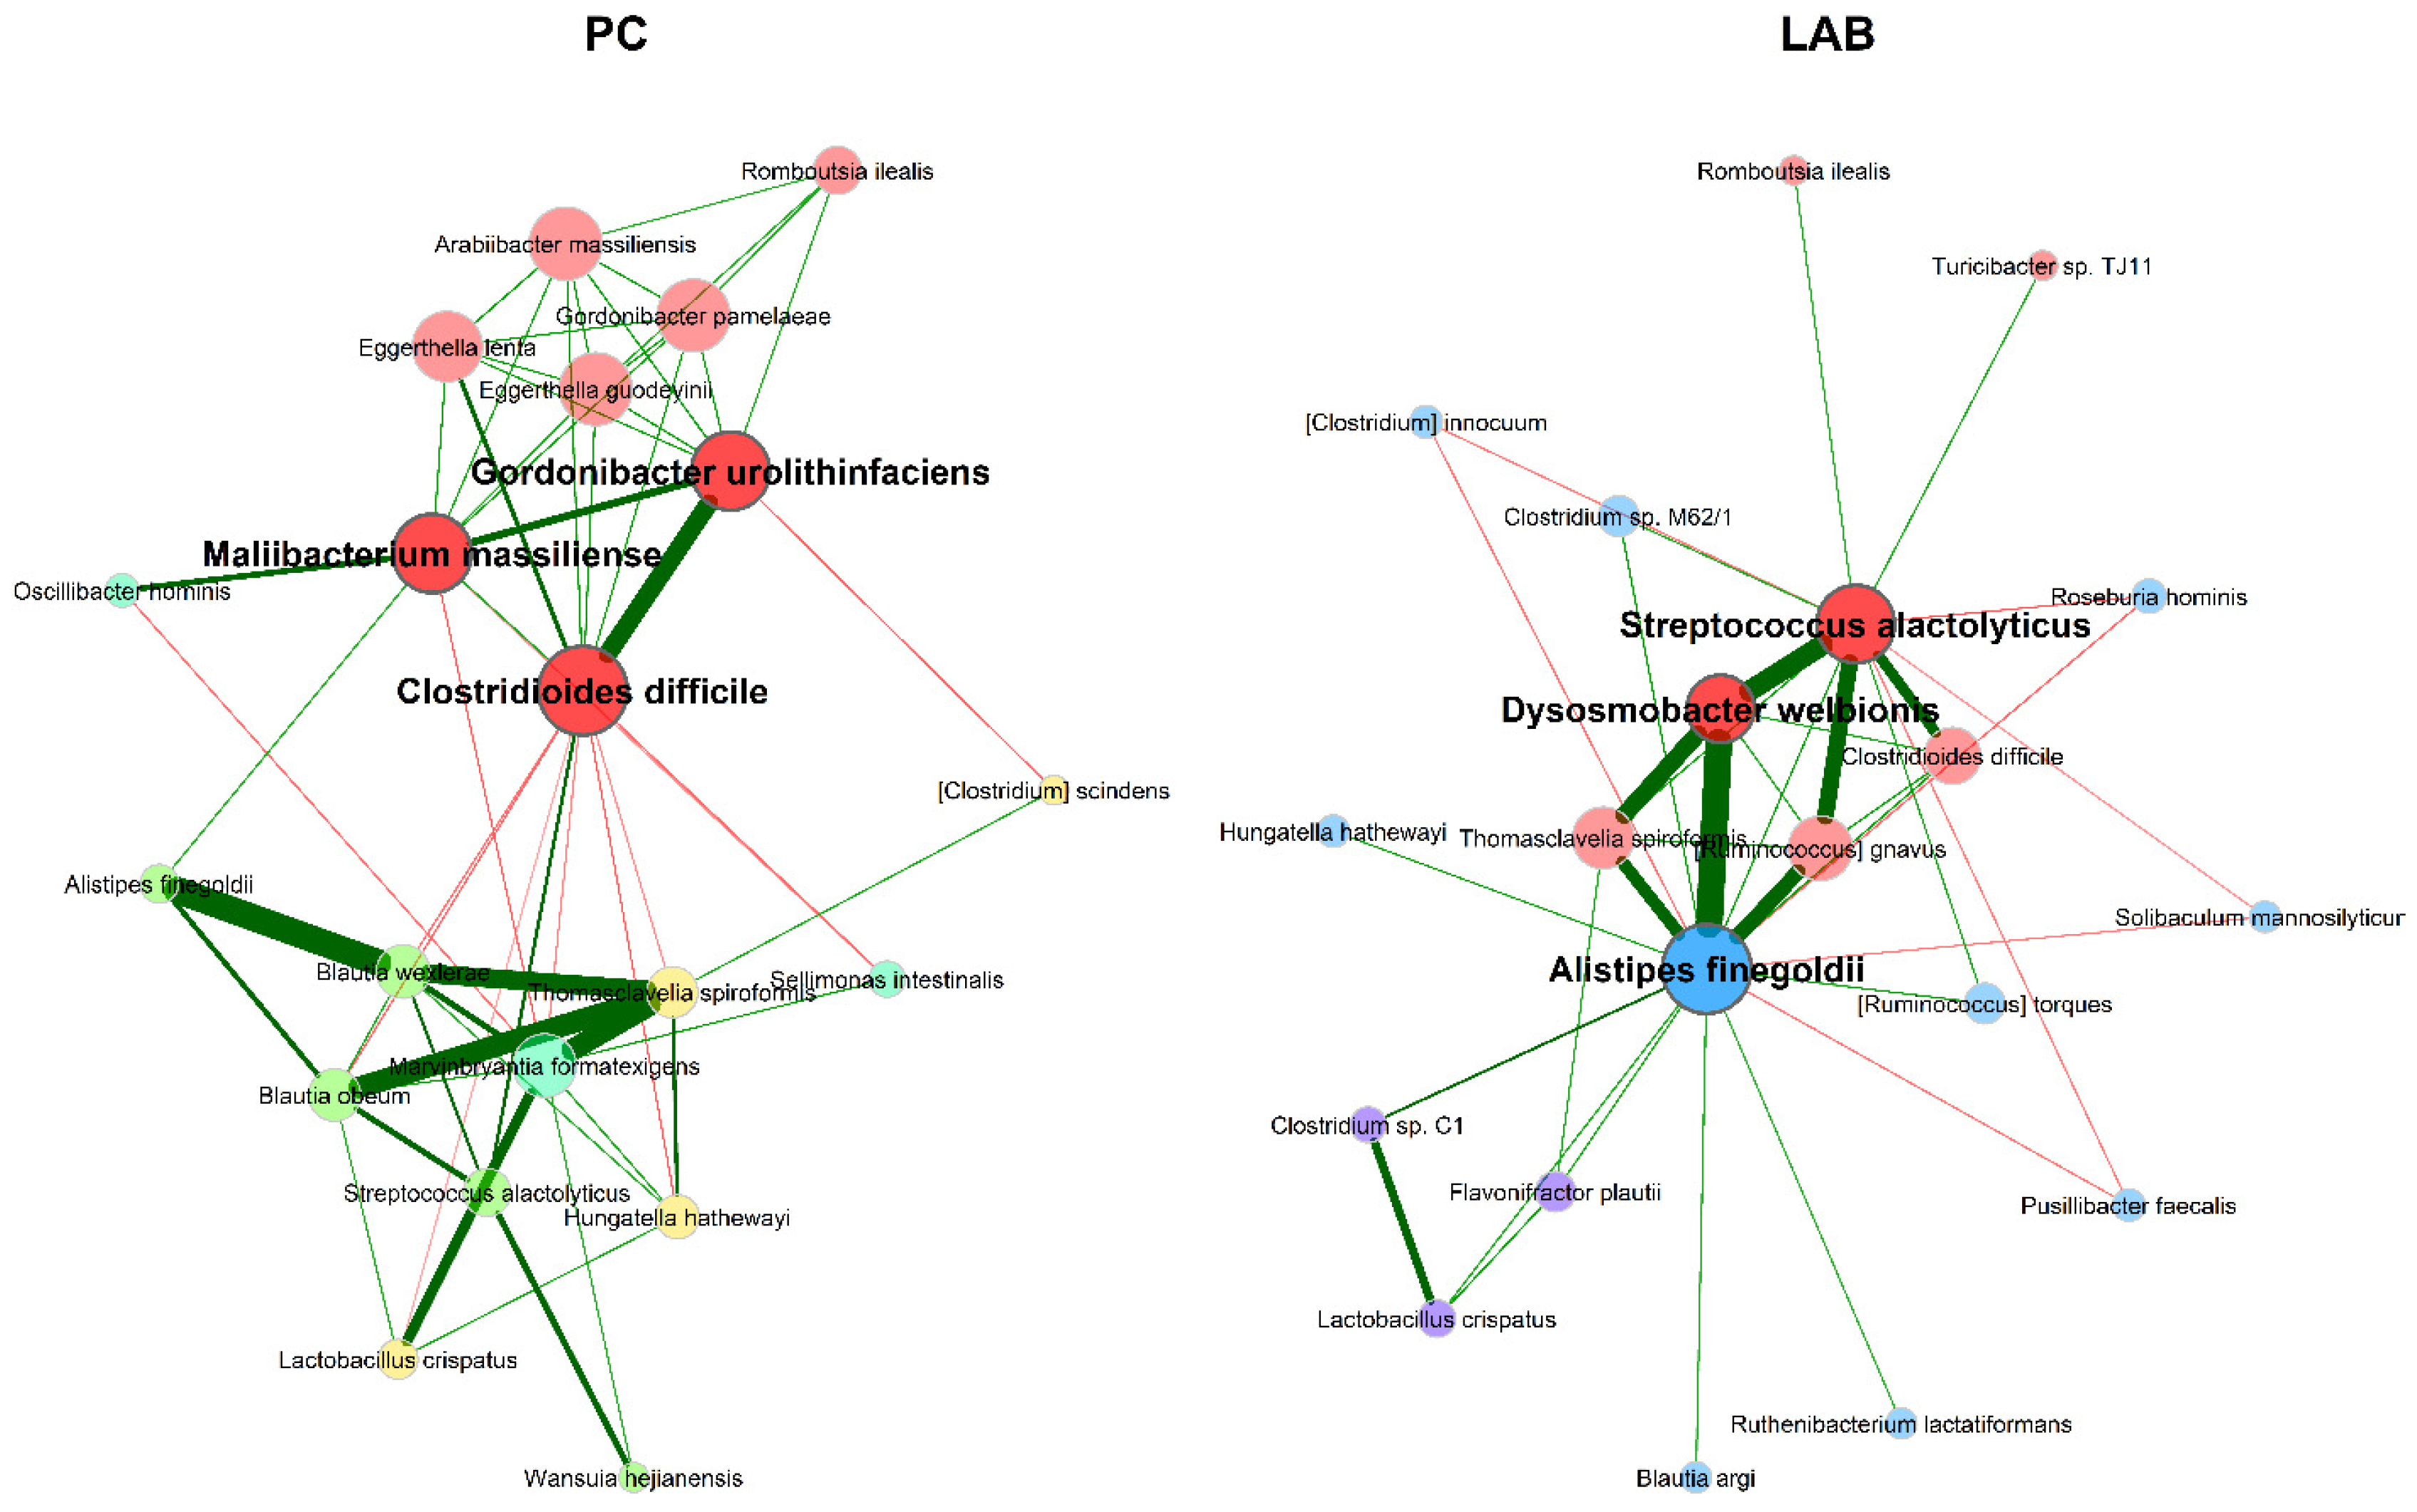
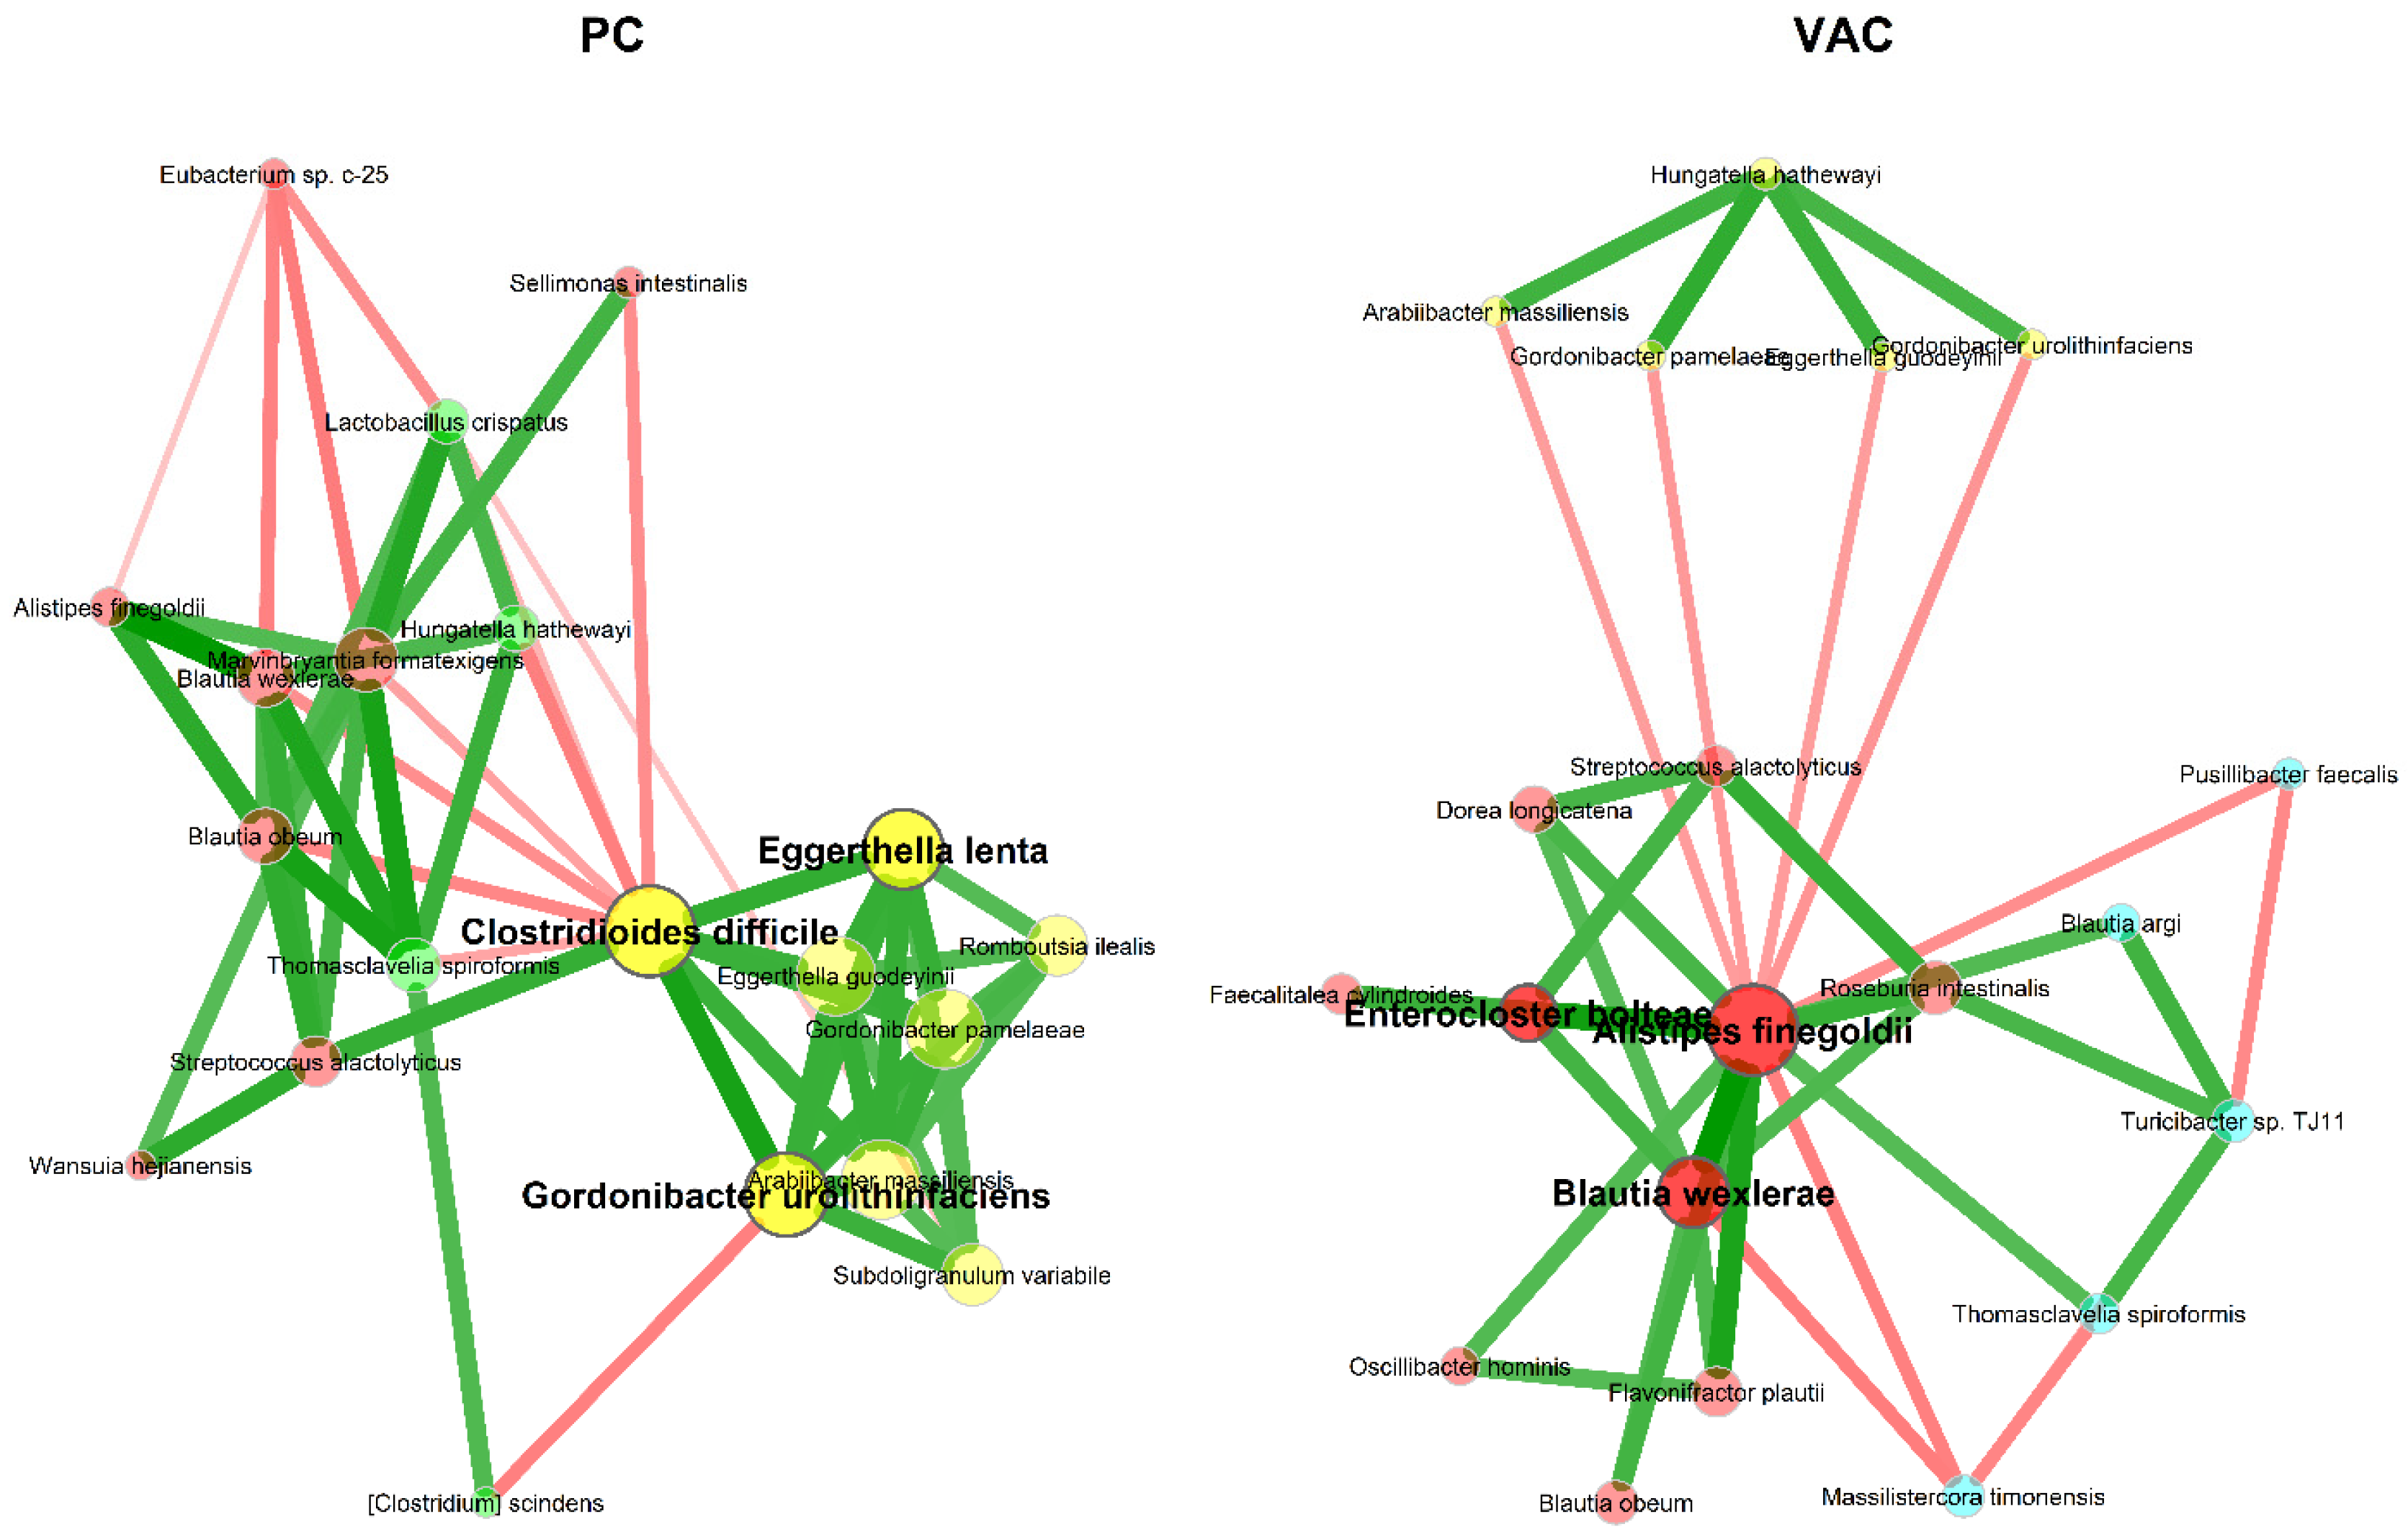
3.2.2. Microbial Association Network Analysis

Network analysis aimed to (i) determine the effect of AA treatments on network structure and (ii) determine the hub taxa difference in other treatments, if any, compared to PC. There were no significant differences in the network structure parameters such as positive edge percentage (positive interactions between the nodes), edge density (interconnectedness of network), or natural connectivity (robustness of network connection) in treatments compared to PC (Table S9A–D, p > 0.05). However, the hub taxa in the other four treatments differed from PC. Hub taxa are those nodes with a significant role in the network connection, and this depends on the centrality measure chosen for determining the hub taxa. Here, we used the eigenvector centrality as the hub parameter. Eigenvector centrality determines hub taxa as the most central nodes (taxa) that have many connections and are interconnected to other important nodes. The hub taxa seen in PC and NC differed (Figure 4), with the hub taxa in NC being Flavonifractor plautii, Alistipes finegoldii, and Eggerthella guodeyinii, and those in PC were potentially pathogenic, such as Clostridiodes difficile, Gordonibacter pamelaeae, and Gordonibacter urolithinfaciens.
In comparison to PC, the hub taxa in the PF were Roseburia hominis, Ruminococcus gnavus, and Eubacterium sp. c-25, whereas PC had potential pathogens, including Clostridiodes difficile, Eggerthella lenta, and Gordonibacter urolithinfaciens (Figure 5).
In the LAB-PC comparison (Figure 6), Streptococcus alactolyticus, Alistipes finegoldii, and Dysosmobacter welbionis were the hub taxa in LAB, and Clostridiodes difficile, Gordonibacter urolithinfaciens, and Maliibacterium massiliense [50] were the hub taxa in PC. In VAC-PC, VAC had Alistipes finegoldii, Enterocloster bolteae, and Blautia wexlerae (Figure 7), whereas PC had Clostridiodes difficile, Eggerthella lenta, and Gordonibacter urolithinfaciens as hub taxa.

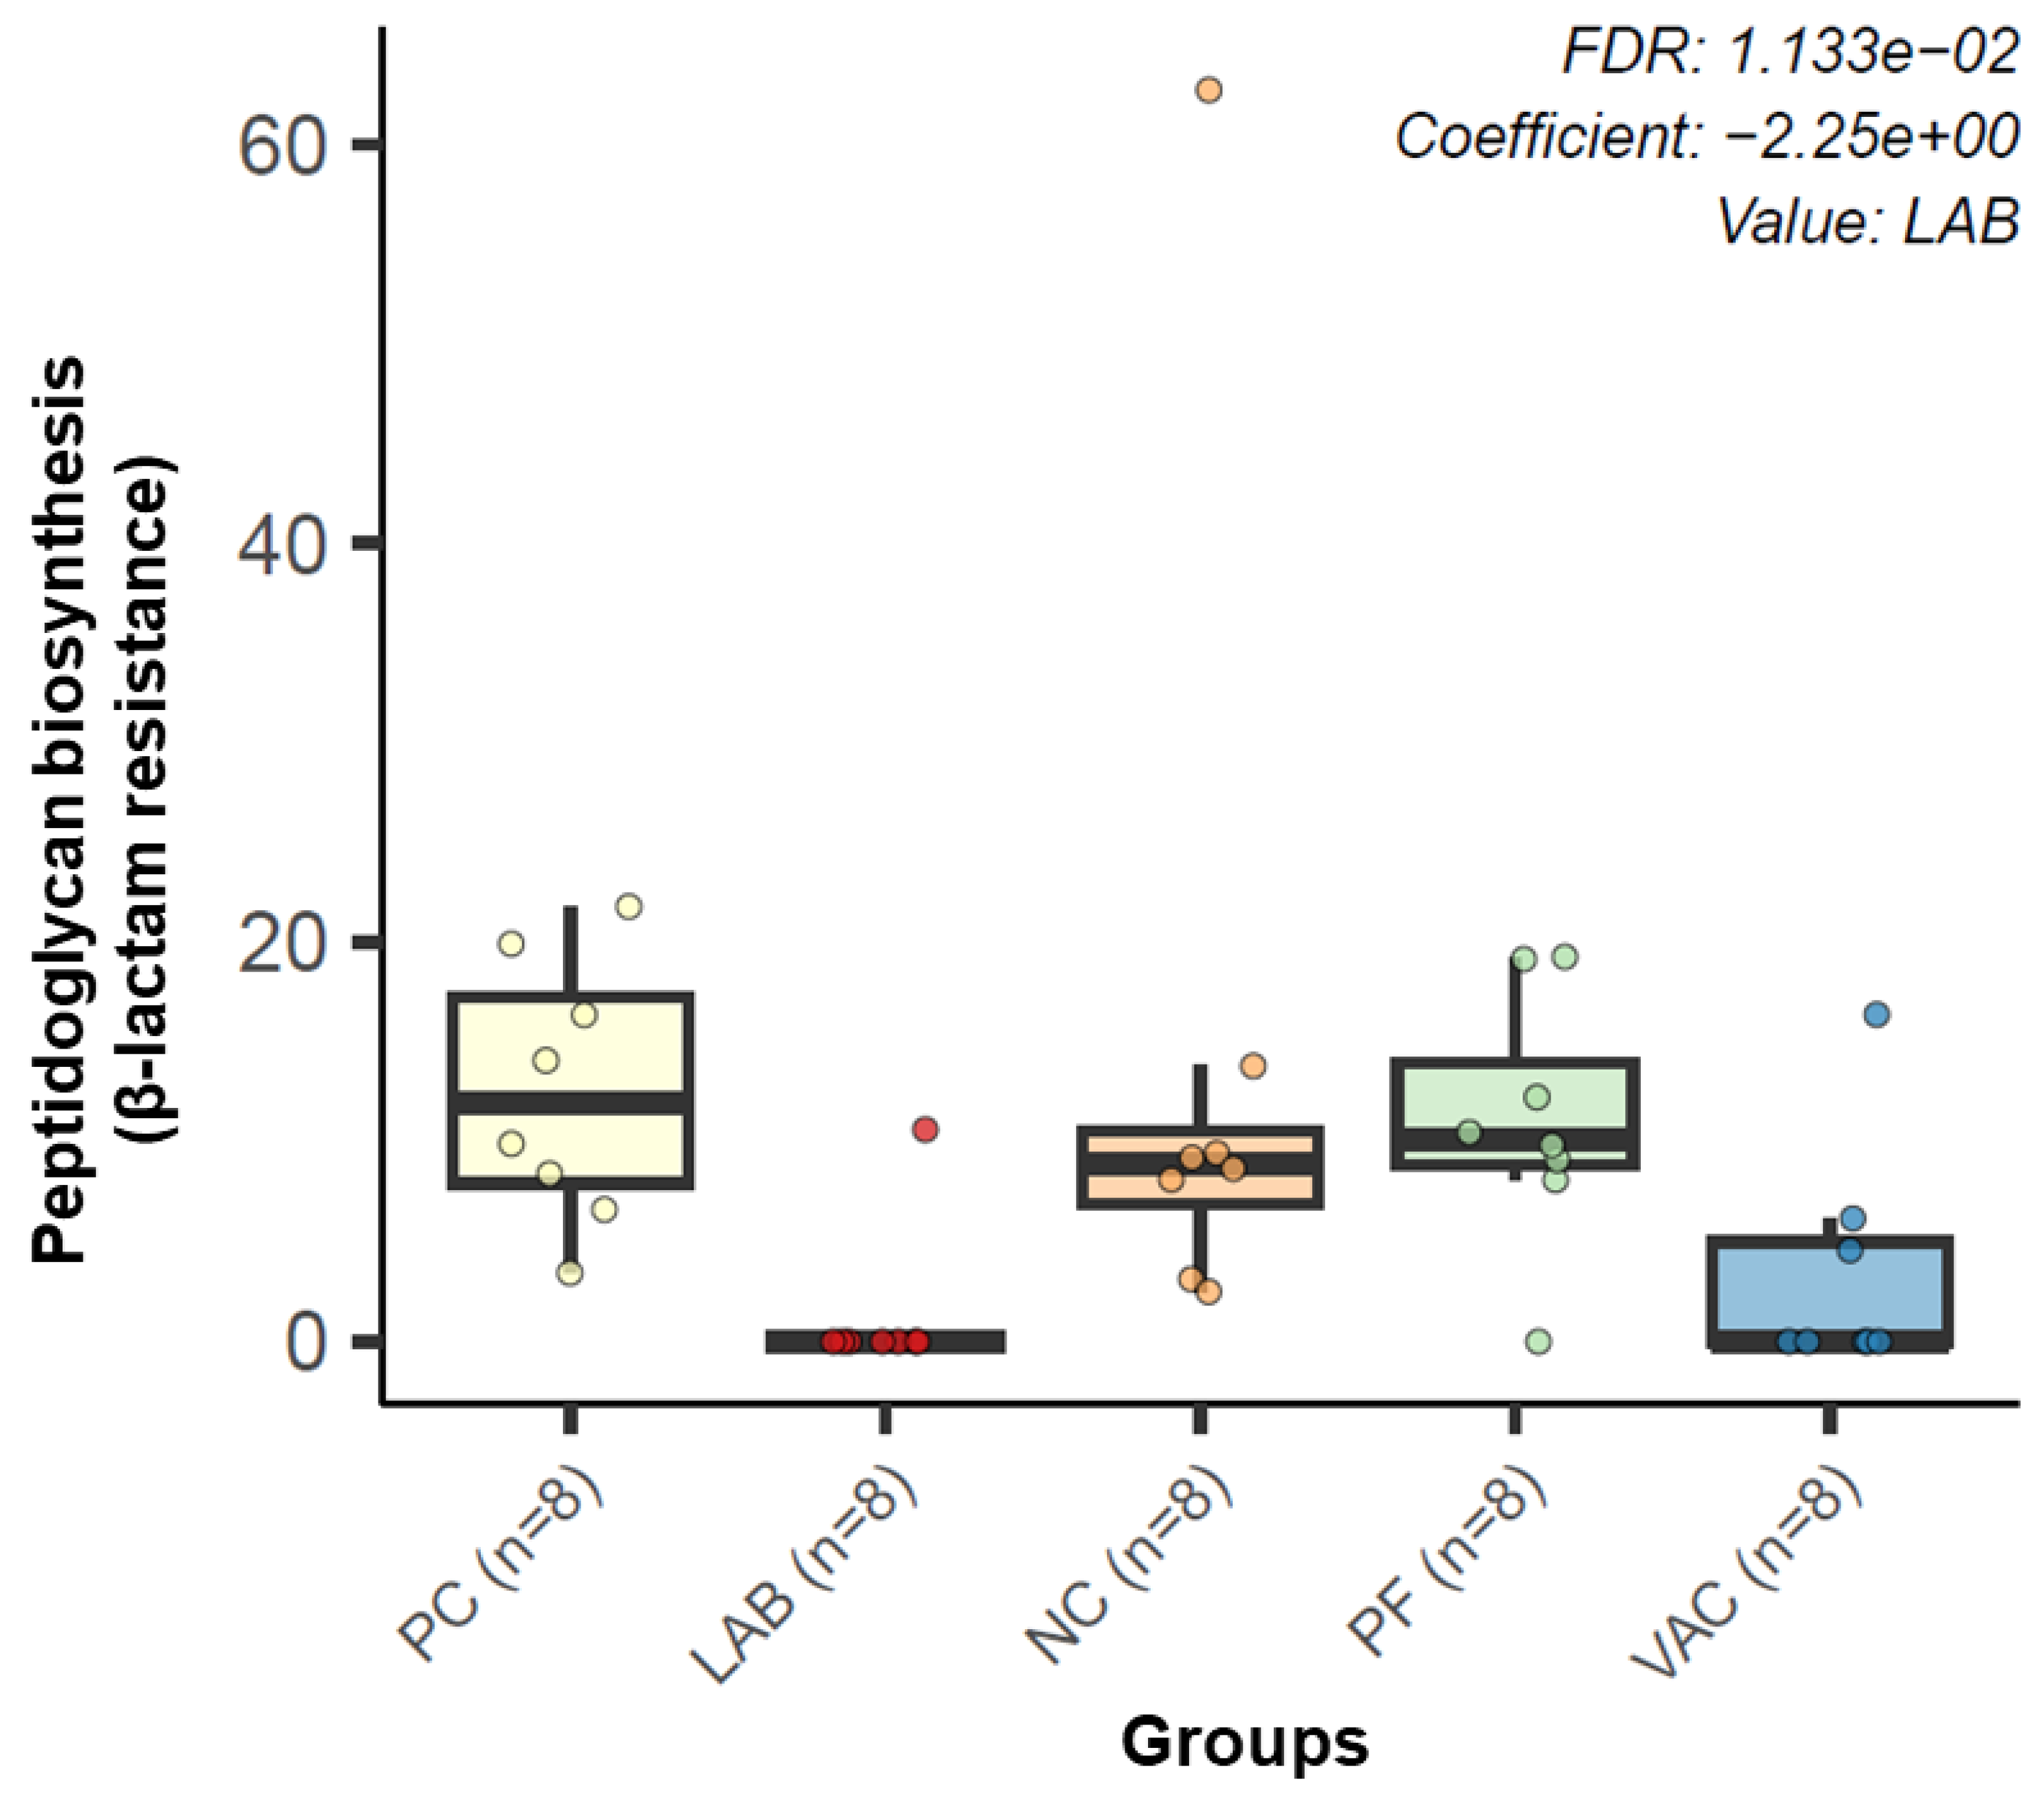
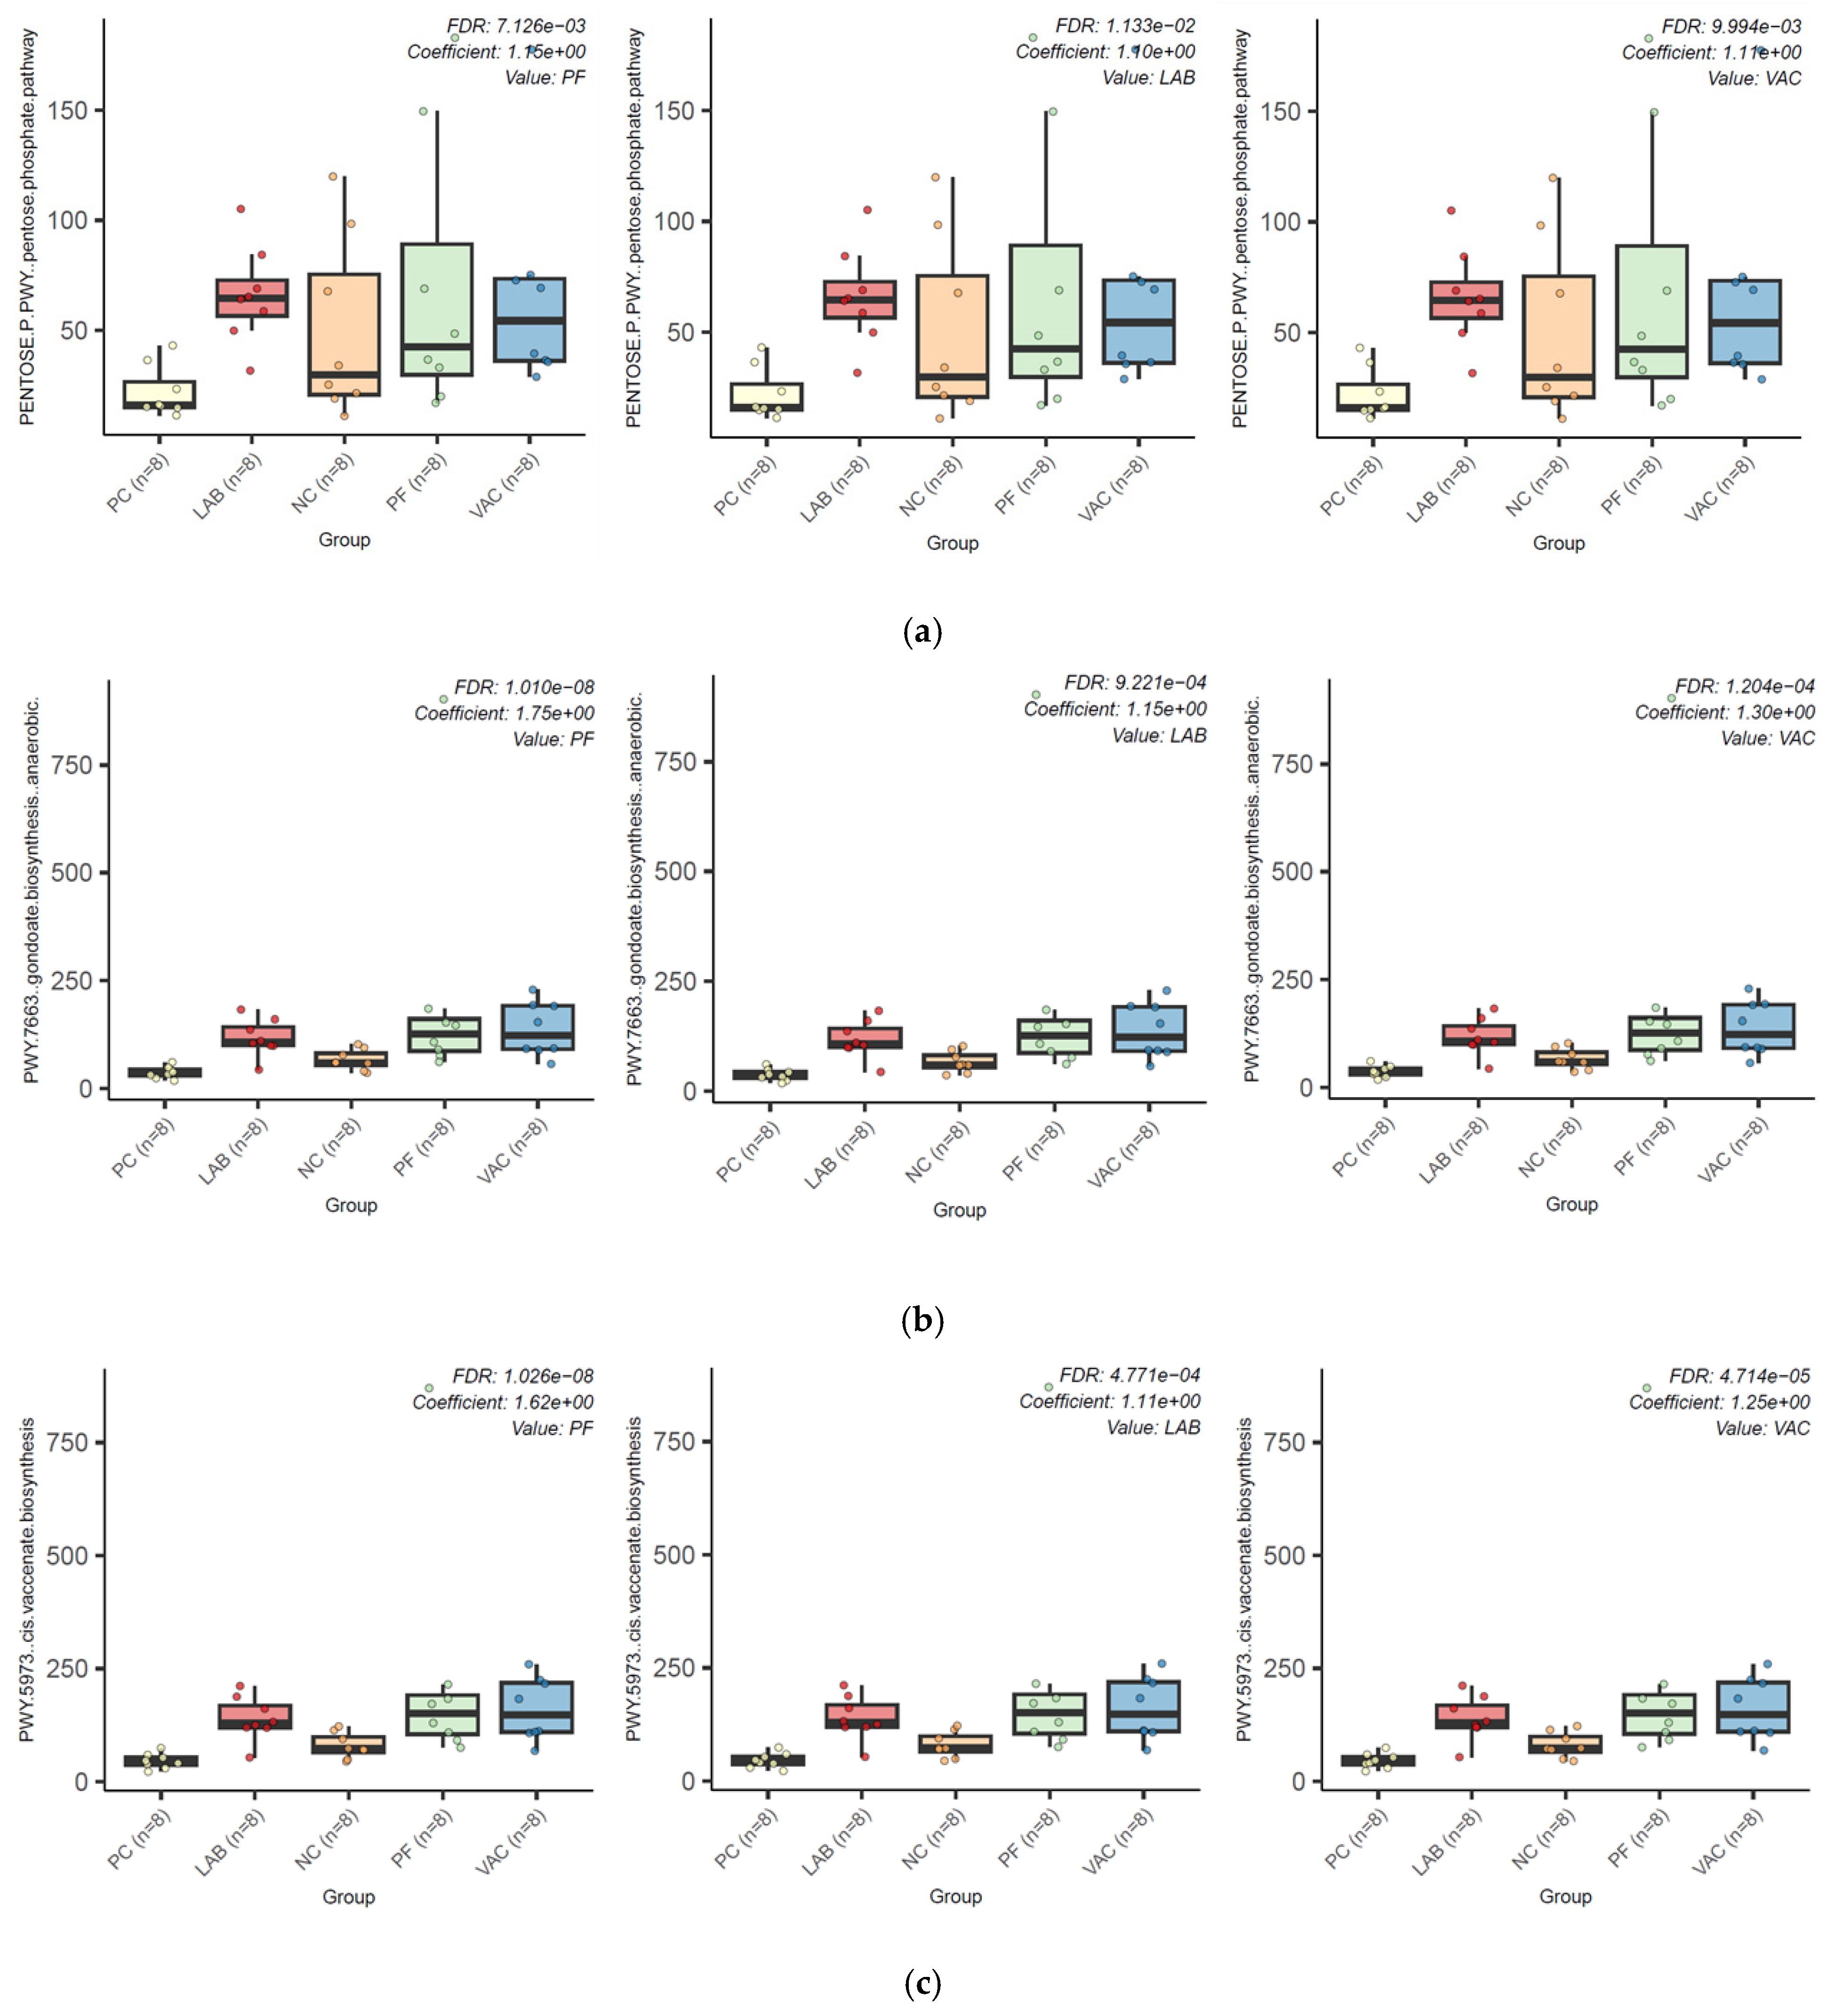
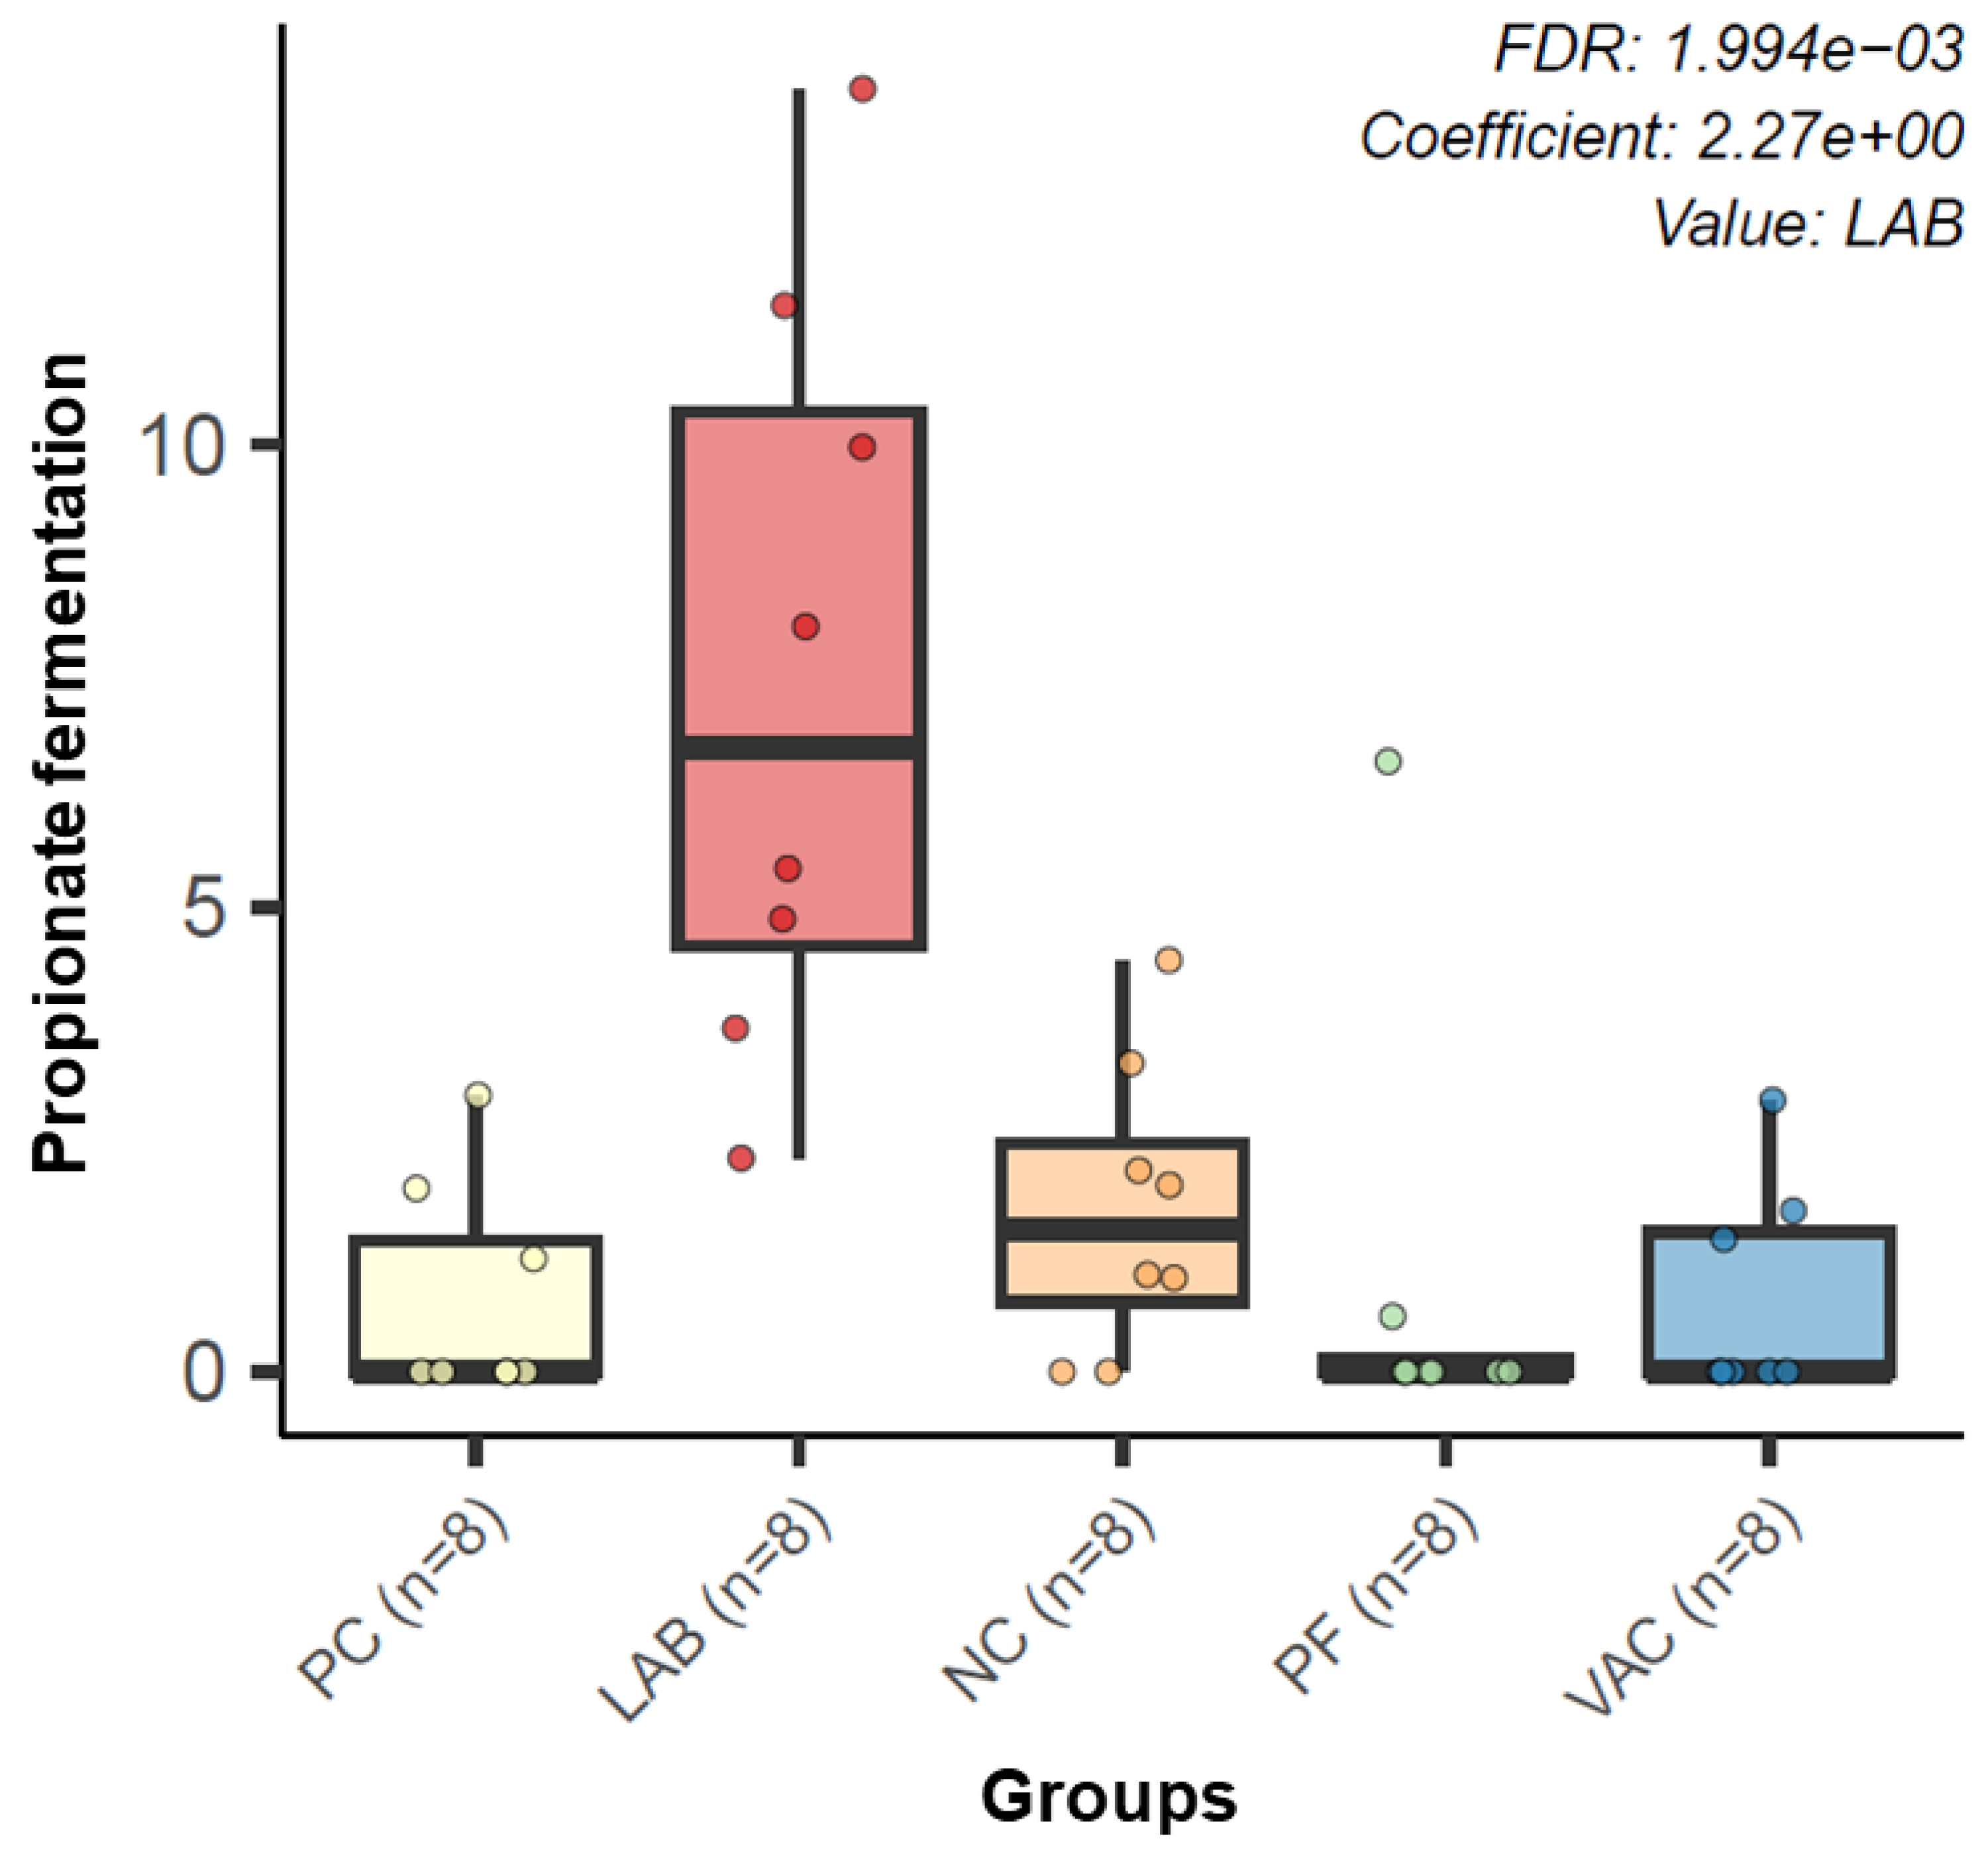
3.2.3. Microbial Functional Profiling

Microbial functionality was predicted using HUMAnN2. Figure S2 shows the top 50 pathways seen enriched or depleted in differential abundance in treatments compared to PC. Compared to PC, the AA treatments were significantly enriched for the differential abundance of some critical metabolic pathways. Nine, seven, and six pathways were enriched in PF, LAB, and VAC treatments, respectively, compared to PC (Table S10). No pathways were depleted in differential abundance in PF. Still, notably, a single pathway, the peptidoglycan biosynthesis V (β-lactam resistance) pathway, was depleted in its abundance in LAB (Figure 8) compared to PC.
In VAC, 19 pathways were depleted in differential abundance compared to PC (Table S10). Pentose phosphate pathway (PPP), gondoate biosynthesis (anaerobic), and cis-vaccenate biosynthesis (both fatty acid) pathways were the three common pathways enriched in the three AA treatments (Figure 9a–c, Table S10).
The only pathway in NC significantly different from PC was glucose-1-phosphate degradation (Table S10). In PF, two fatty acid metabolic pathways, two carbohydrate metabolic pathways, and an amino acid metabolic pathway were enriched (Table S10). In LAB, three carbohydrates, two fatty acids, a formaldehyde assimilation pathway, and a pyruvate fermentation to propionate fermentation pathway were enriched in differential abundance compared to PC (Figure 10, Table S10). Three carbohydrate, two fatty acid, and one amino acid metabolism pathways were enriched in VAC compared to PC (Table S10). The pathways showing abundance depletion in VAC compared to PC included nucleic acid, fermentation, and amino acid metabolic pathways (Table S10).

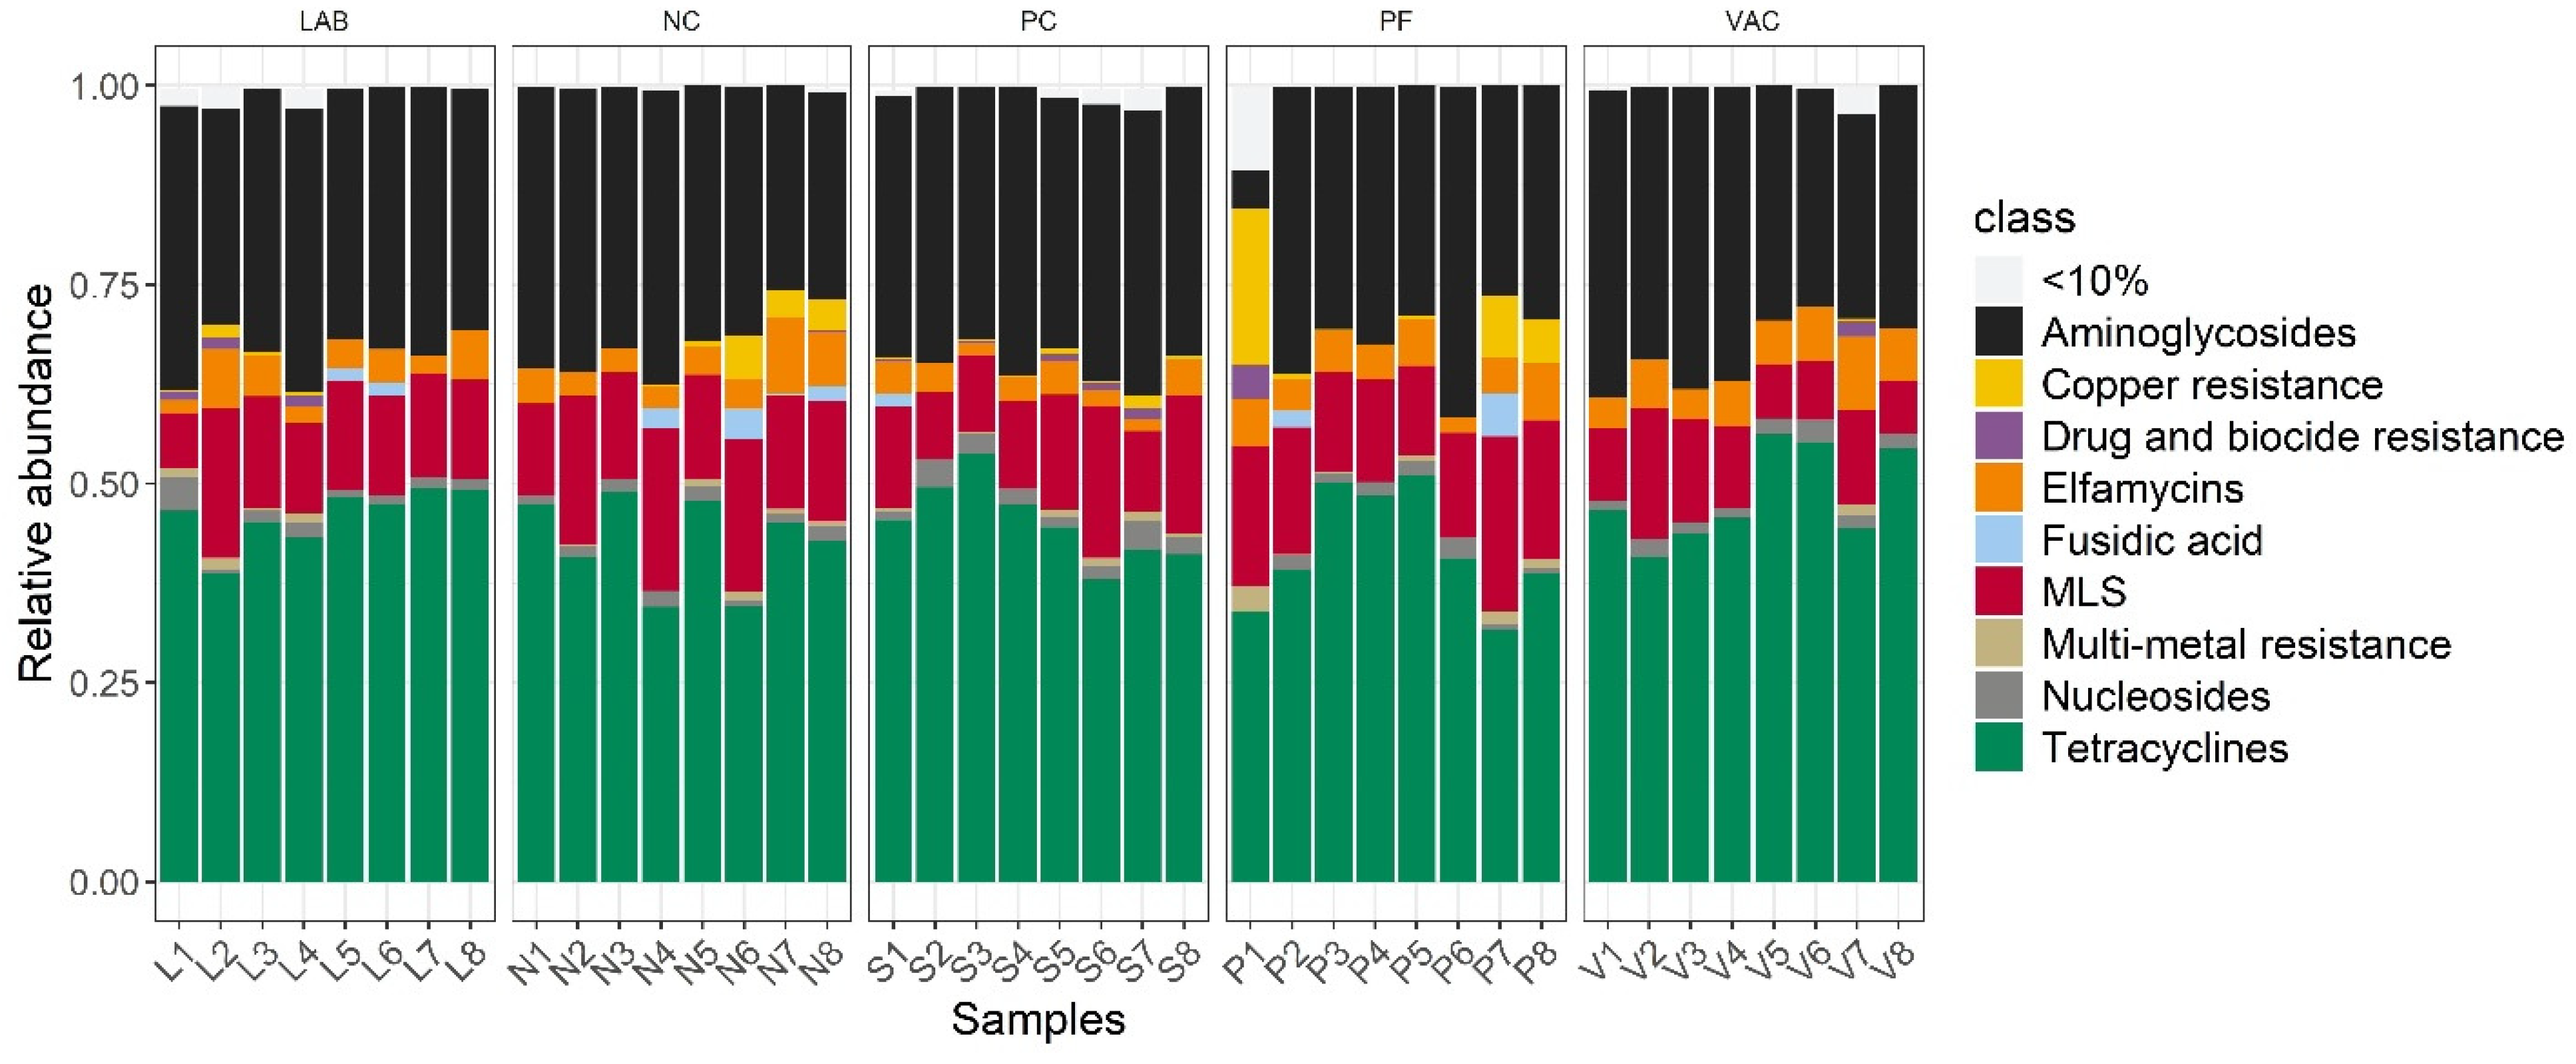
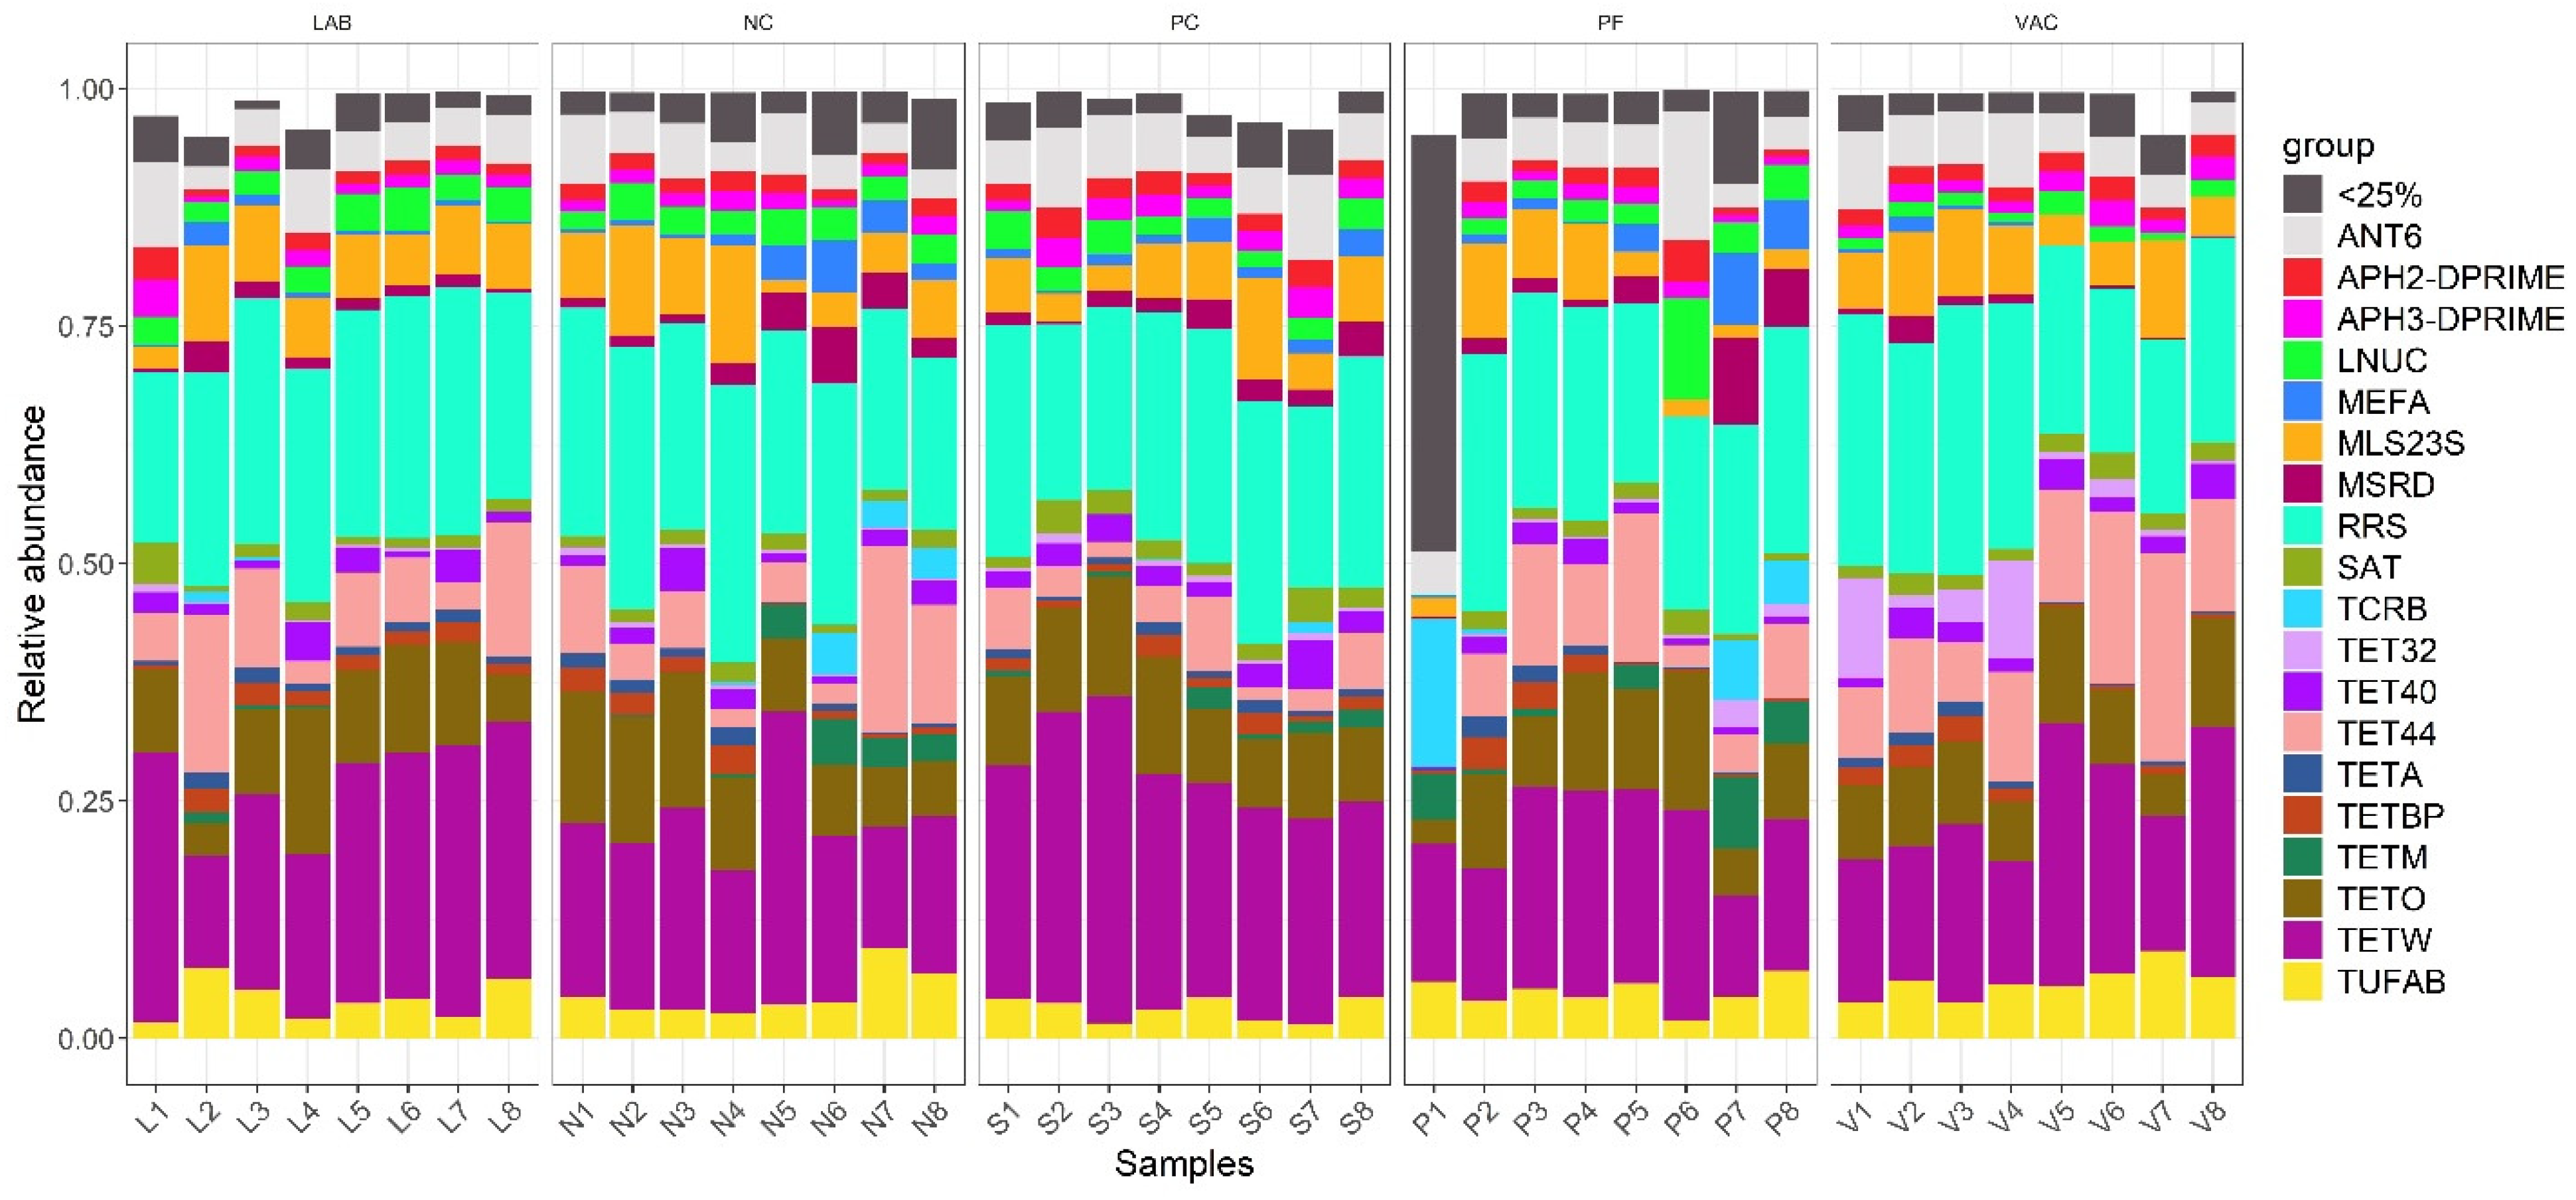
3.3. Resistance Gene Profiling

Overall, 555 resistomes were detected in the 40 samples, and 359 resistomes remained after filtering the low-abundance genes. This accounts for 33 classes of antimicrobials identified in the resistome, including 17 antimicrobial drug classes. The two major types of resistomes identified in this study were drug and metal resistance (Figure S3, Table S11). Tetracycline resistance was the most abundant antibiotic class (Figure 11, Table S12) in all treatments, followed by aminoglycoside resistance, macrolide-lincosamide-streptogramin B (MLS) resistance, elfamycin resistance, and fusidic acid resistance.
Tetracycline-resistant ribosomal protection proteins were the most abundant mechanism detected in all treatments (Figure S4, Table S13), followed by aminoglycoside-resistant 16S ribosomal subunit protein, macrolide-resistant 23S rRNA mutation, aminoglycoside O-nucleotidyltransferases, and EF-Tu inhibition. In the tetracycline-resistance class, the most abundant resistance genes identified in all the treatments were tetW, tetO, tet44, tet40, and tet32 (Figure 12, Table S14).
Other resistance genes, such as tetM, tetBP, and tetA were also detected. In the aminoglycoside class, detected genes included rrs, ant(6), aph(2)-dprime, and aph(3)-dprime. lnuC, MLS23S, msrD, and mefA were the most abundant resistant genes in the MLS class and were found in all the treatments (Figure 11). Also detected were a fusA gene conferring resistance to fusidic acid, and streptothricin acetyltransferase (SAT), conferring resistance to nucleosides antibiotic class. tufAB (elfamycin resistance) and TCRB (copper resistance) were the other antimicrobial resistance genes abundant in the samples. The most abundant genes in the treatments were rrs, followed by tetW, tetO, and tet44 (Table S14).
There was no difference in ARG richness among the treatments (Figure S5A, p > 0.05). However, the results of pairwise comparisons revealed significant differences in the Shannon diversity index between the PC and NC (p = 0.015) and between the VAC and PC (p < 0.05) (Figure S5B). The β diversity analysis by Principal Coordinate Analysis indicates a significant change in resistome composition among the treatments (Figure S6). We obtained a p-value of 0.006 with R2 = 16.16% from PERMANOVA, suggesting that at least one of the treatments is significantly different from the others in resistome composition. The pairwise PERMANOVA refined this result, indicating that the VAC significantly differs from NC (p = 0.01) and PC (p = 0.04) (Table S15). However, the ANCOM-BC2 result showed that there were no significantly differentially abundant resistance genes among the treatments.

4. Discussion

We conducted several previous challenge studies in turkeys experimentally infected with SH [51,52] and explored the microbiota via 16S rRNA gene amplicon sequencing, where our chief limitation was that cecal microbiota profiling was possible only at the genus level [53]. The current study analyzed cecal DNA metadata from another study, using shotgun metagenomic sequencing to explore the microbial composition, interactions, functional potential, and resistome in response to three AAs tested against SH in commercial turkeys (average body weight = 8–9 kg/turkey) where a 2 log10 CFU/g reduction in cecal SH colonization in all three AA treatments compared to PC was reported [54].

4.1. Differentially Abundant Species in Treatments Compared to PC

The differentially abundant species in treatments NC, LAB, PF, and VAC compared to PC can be found in Tables S4–S7. The abundance of Lactococcus garvieae was increased in NC compared to PC (Table S4). Zhang et al. (2016) reported a reduction in the rate of diarrhea and mortality in broilers when they supplemented Lactococcus garvieae B310 isolated from healthy piglets to broilers [55]. In addition, they also noticed an increase in the number of cecal lactic acid bacteria and Bifidobacterium.
Compared to PC, we found an increased abundance of Limosilactobacillus gastricus in all three AA treatments (LAB, PF, and VAC) (Table 1). This organism has been isolated from human milk, having probiotic potential in a roundworm model [56]. L. gastricus reduced the colonization of pathogenic Cronobacter sakazakii and upregulated genes involved in the worm’s longevity [57]. Weisella spp. is grouped with other lactic acid-producing bacteria, such as Lactobacillus spp. and Leuconostoc spp. [58]. Some members of Weissella have been linked with human infections [58], but some are regarded as potential candidates for GRAS status in food fermentation processes [59]. Weissella hellenica was increased in all three AA treatments compared to PC (Table 1). This bacterium has probiotic properties [60] and is reported to produce bacteriocins [61]. One such bacteriocin, weissellicin L, inhibits the growth of Listeria monocytogenes [62]. Pediococcus acidilactici are cocci-shaped lactic acid-producing bacteria [63]. Our study confirmed an increased abundance of these beneficial organisms in all three AA treatments compared to PC. Jazi and co-authors found that when broilers were supplemented with a combination of Pediococcus acidilactici, mannan-oligosaccharides, and butyric acid, the cecal population of Salmonella Typhimurium was reduced, and the growth performance of broilers was improved [63]. In another study, Seo and Kang [64] reported that bacteriocins K10 and HW01 purified from Pediococcus acidilactici inhibited biofilm formation by S. Typhimurium. In addition, Pediococcus acidilactici was also effective in resisting birds against other enteric disease, such as coccidiosis [65]. Liquorilactobacillus mali has been associated with improvement in obesity therapy in mice by regulating gut microbiome [66]. The increased abundance of these lactic acid-producing bacteria in all three AA treatments compared to PC could suggest the potential of LAB, PF, and VAC in improving the growth of lactic acid bacteria in turkey ceca as a mechanism to resist SH colonization (Table 1). The possible mechanism by which lactic acid bacteria and other probiotics reduce pathogen colonization includes competitive exclusion and immune modulation [11]. In competitive exclusion, they compete with pathogens for nutrients and space in the gut, and produce antimicrobial compounds such as SCFAs and bacteriocins which inhibit pathogen growth [11]. Lactic acid bacteria could modulate birds’ immunity by upregulating gene expression of Toll-like receptor genes and T cell-associated genes, by modulating cytokine gene expression, and improving antibody response [67].

4.2. Microbial Association Network Analysis

Two of the three hub taxa in network analysis of NC, compared to PC, Flavonifractor plautii, and Alistipes finegoldii, are related to a healthy gut environment (Figure 4). Studies show that F. plautii is associated with reduced inflammation in the adipose tissue of mice [68]. In another study, F. plautii reduced antigen-associated immune response in mice [69]. Few studies of F. plautii have been reported in poultry. Alistipes finegoldii is linked with the reduction in colitis in mice [70,71], suggesting its potential as a gut-protecting agent. A study on broiler chicken reported Alistipes finegoldii linked with growth promotion [72].
Hub taxa seen in PC, compared to other treatments, are potential pathogens (Figure 4, Figure 5, Figure 6 and Figure 7). Clostridiodes difficile (seen in all four comparisons; Figure 4, Figure 5, Figure 6 and Figure 7) can potentially cause nosocomial infections [73]. Community-associated infections of C. difficile are also reported, suggesting zoonotic routes, including food sources such as poultry meat, as potential sources [74,75]. Gordonibacter urolithinfaciens is a human gut-associated bacterium that produces urolithin from ellagitannins in foods [76]. The role of these bacteria in poultry has not been studied; however, the abundance of Gordonibacter urolithinfaciens is reportedly less in the poultry gut treated with prebiotics such as mannan oligosaccharides [77]. Prebiotic supplementation also reduced the abundance of pathogenic C. difficile and improved the beneficial bacteria population. Another hub taxa Eggerthella lenta (seen in PC-PF, PC-VAC comparisons; Figure 5 and Figure 7) is an opportunistic pathogen [78]. A higher abundance of Eggerthella lenta is observed in people with inflammatory bowel disease and can cause colitis in mice [79]. In chickens, the genus Eggerthella is seen abundantly in immunosuppressed chickens [80].
In PF treatment (Figure 5), Roseburia hominis could produce SCFAs such as butyric acid, resulting in immunomodulatory effects in the gut [81,82,83]. Studies on Ruminococcus gnavus have found that their bacteriocins, including ruminococcin A and C1, are effective against pathogenic members of Clostridia, including C. difficile and other drug-resistant bacteria [84,85,86]. In addition to the antimicrobial property, ruminococcin C1 benefits the host by beneficially modifying the gut microbial environment and acting as an anti-inflammatory protein [86]. Little is known about Eubacterium sp. c-25, but Song et al. [87] found it could produce deoxycholic acid, which plays a part in C. difficile infection resistance in humans [88]. Identifying these taxa as hubs in PF compared to PC suggests that P. freudenreichii positively modifies gut microbial connectivity and association in PF-treated turkeys.
The key hub taxa in LAB were Dysosmobacter welbionis, Alistipes finegoldii, and Streptococcus alactolyticus (Figure 6). Recent studies have found Dysosmobacter welbionis to be a strong probiotic candidate focused on metabolic diseases [89,90]. Studies on mice have found that Dysosmobacter welbionis improves colitis and exhibits anti-inflammatory properties [91]. Streptococcus alactolyticus is a lactic acid-producing bacterium [92] and in vitro studies of Streptococcus alactolyticus isolated from chicken cecum found it to possess probiotic properties without harming cells [93,94]. These beneficial bacteria, as the keystone/hub taxa, suggest the role of Lactobacillus in maintaining a positive gut microbial environment.
In the VAC group, Alistipes finegoldii, Blautia wexlerae, and Enterocloster bolteae were the hub taxa (Figure 7). Many species of the genus Blautia, including Blautia wexlerae, have gained attention as a potential next-generation probiotic [95,96]. Blautia wexlerae showcases its probiotic property in reducing metabolic diseases by imparting anti-inflammatory effects, producing short-chain fatty acids, and altering the gut microbial environment [97]. The other key taxon, Enterocloster bolteae, is linked with human gut dysbiosis [98]. The presence of beneficial bacteria Alistipes finegoldii and Blautia wexlerae as hub taxa from two out of three in the VAC-PC comparison suggests possible beneficiary modification of gut microbial structure by Salmonella vaccine administration in turkeys.

4.3. Metagenomic Functional Profiling

Compared to PC, enriched abundance of the PPP in the three AA treatments could suggest improved anti-oxidative properties and favorable gut bacterial composition to replenish the microbial composition disturbed due to the Salmonella challenge (Figure 9a). The PPP is another way of glucose utilization that mainly occurs in the cytosol of most organisms, including bacteria [99]. The products of PPP have anti-oxidative properties and are involved in cell signaling mechanisms and DNA synthesis [99,100]. The PPP also plays a crucial role in heterolactic fermenting bacteria via the conversion of Ribulose-5-phosphate, NADPH, and CO2 from glucose-6-phosphate [101]. Studies with different species of probiotic lactic acid bacteria have shown that PPP is a vital carbohydrate metabolic pathway [102,103,104]. A study in fish found PPP is downregulated in the gut microbiome of infected fish, possibly due to tissue injury and related disruption of the gut microbiota [105].
In LAB, the abundance of pyruvate fermentation to propanoate II (acrylate) pathway, with the end product of propionic acid, was enriched (Figure 10). Like other SCFAs, propionate also exhibits antibacterial properties. For example, SCFAs produced by gut microbes, including propionic acid, reduced the motility and biofilm formation of Salmonella in vitro [106]. Dietary incorporation of propionic acid is shown to reduce Salmonella Gallinarum colonization in the crop and cecum of chicks [107]. A similar study found the antibacterial properties of propionic acid in combination with formic acid against Salmonella Pullorum in chicks [108]. Enrichment of this pathway in LAB suggests Lactobacillus modified the gut microbial environment in response to the Salmonella challenge. Fatty acids are essential for maintaining cell membrane integrity [109].
Gondoate biosynthesis (anaerobic) and cis-vaccenate biosynthesis pathways were the two differentially abundant fatty acid metabolic pathways in the three AA treatments (Figure 9b,c). Few studies have examined the relationship between these two fatty acids and poultry gut health or gut microbiota. In one study, the gondoate biosynthesis pathway was positively correlated with unclassified Lactobacillales genera [110], suggesting a relation between some lactic acid-producing bacteria and the metabolic pathway. A study using E. coli as a bacterial model found that cis-vaccenate was downregulated during toxic conditions [111]. Recently, Zan et al. reported the downregulation of cis-vaccenate biosynthesis in the gut microbiome when fish were infected by gut bacteria such as Vibrio cholerae and Aeromonas veronii [105]. These studies suggest that cis-vaccenate biosynthesis is inversely associated with any disturbance. However, a study in Japanese quails reported that both cis-vaccenate, and gondoate biosynthesis were upregulated when quail chicks were negatively stressed [112].
β-lactam class antibiotics include common antibiotics such as penicillin and cephalosporins. These are also among the classes of drugs to which pathogenic bacteria have acquired resistance [113]. In LAB, the peptidoglycan biosynthesis V (β-lactam resistance) pathway, by which bacteria acquire resistance against the β-lactam class of antibiotics, was downregulated (Figure 8). Nineteen pathways were downregulated in VAC, including nucleic acid biosynthesis, fermentation pathway, and amino acid biosynthesis (Table S10). This could be indicative of the immune response to the Salmonella vaccine, leading to a change in microbial composition between the treatments (evident in β diversity index; Figure 1). This change could have reduced the activity or abundance of microbes related to these pathways. A difference in microbial β diversity between vaccinated, Salmonella Enteritidis challenged, and non-vaccinated, but Salmonella Enteritidis challenged layers was recently observed [114]. Another possibility is a change in microbial composition leading to the shift in interaction and association of microbes due to vaccination (seen in microbial network analysis; Figure 7). This change in interaction dynamics could have altered these metabolic pathways.

4.4. Resistance Gene Profiling

Gut microbiota can be a significant reservoir of resistance genes [23]. Previous studies in humans, chickens, and pigs have revealed the presence of ARGs in gut samples, confirming resistance to at least 20 antibiotics [23]. ARGs can also be transferred from animal food sources such as poultry, pork, and beef to humans [24]. Reference [25] reported 114 genes involved in resistance to tetracycline isolated from chicken gut samples, followed by MLS (28 isolates) and aminoglycoside (25 isolates) resistance. We also found tetracycline resistance as the abundant drug class in poultry, where we detected Aminoglycoside (31.94%) and MLS (13.39%) as the second and third prominent classes of ARGs (Figure 11, Table S12). The significant difference in the Shannon index between NC and PC might suggest a change in resistome diversity due to the Salmonella challenge, in which PC has more diversity (Figure S5B). The most abundant resistance genes detected across the samples were tetW, tet44, and tetO (Figure 12, Table S14). This is similar to the previous findings [25] were tetW, tet32, tetO, and tetQ were the most frequently detected tetracycline-resistant genes in the chicken gut. Families Lachnospiraceae and Ruminococcaceae have also been linked with tetW encoding, and Lachnospiraceae is involved with tetO and tet32 abundance. In this study, we found that the mean abundance of Lachnospiraceae across the samples was higher than any other family (19.82%) (Figure S7, Table S16), and the most abundant tetracycline-resistant genes were tetW and tetO. It can be reasonably understood from these studies that the Lachnospiraceae could harbor tetracycline genes. Still, validation by correlation analysis between resistant genes and taxa is required.
Birds in the PF, LAB, and VAC treatments were given interventions before they, along with the PC, were challenged with the multidrug-resistant SH. Even though NC received neither any intervention nor was challenged with SH, ARGs were also detected in NC (Figure 12). This suggests environmental contamination with the resistome that could potentially influence the turkey gut. The gut microbiota could acquire resistance genes from the farm environment [26,27]. Piccirillo et al. (2024) found drinking water as a source of ARGs in broiler farms [27], and Xiao et al. (2023) found that feathers and cages, which are in direct contact with the environment, influenced cecal ARGs in layers [26]. Since litter material can affect the cecal microbiota of growing chicks [72], litter microbiota could also influence ARG acquisition in poultry. Exploration of large data sets could help obtain more insights in this direction.

5. Conclusions

We found that SH challenge influenced the cecal microbial structure in turkeys. Treating infected birds with interventions, including probiotics (Propionibacterium and turkey-derived Lactobacillus) and a live attenuated Salmonella vaccine, significantly impacted the microbial composition of the turkey gut by enriching the abundance of multiple beneficial lactic acid bacteria, improving the network association between the microbes, and enriching the abundance of critical metabolic pathways. This study emphasizes the potential of these interventional strategies to improve the gut health of adult turkeys challenged with SH. This study focused on the metagenomics of the turkey gut to understand how the microbiota is distributed, how they interact, and their functional potential. Functional profiling of microbes identified genes in the metagenomic data. Whether or not those genes are actively expressed cannot be determined without a complementary metatranscriptomics or metaproteomics study. Incorporating other omics techniques is necessary for a deeper understanding of how these antibiotic alternatives influence the microbiota and turkey health. Given that the turkey gut microbiome could be influenced by antimicrobial resistance genes from the environment, not all the resistance genes detected in the microbiome need to be expressed and transferred to other bacteria. However, a holistic understanding of these interactions could inform the accuracy of following adequate production and processing steps to help control potential gene transfers to the food chain.

Supplementary Materials

The following supporting information can be downloaded at: https://www.mdpi.com/article/10.3390/microbiolres16070136/s1, Figure S1A: α diversity (species richness) observed among treatments; Figure S1B: α diversity (Shannon index) observed among treatments; Figure S2: Top 50 pathways observed among the treatments with PC as the reference; Figure S3: Relative abundance of the type of resistome in samples (n = 8/treatment) among treatments; Figure S4: Relative abundance of the mechanism of action of resistome in samples (n = 8/treatment) among treatments; Figure S5A: α diversity (resistome richness) observed among treatments; Figure S5B: α diversity (Shannon index) of resistome observed among treatments; Figure S6: β diversity of resistome observed among treatments; Figure S7: Relative abundance of taxa at the family level for samples (n = 8/treatment) among treatments; Table S1: Pairwise mean comparison of β diversity among treatments using pairwise PERMANOVA; Table S2: Mean relative abundance (%) of taxa at phylum level in treatments; Table S3: Mean relative abundance (%) of taxa at genus level in treatments; Table S4: Differentially abundant species in NC compared to PC; Table S5: Differentially abundant species in LAB compared to PC; Table S6: Differentially abundant species in PF compared to PC; Table S7: Differentially abundant species in VAC compared to PC; Table S8: Differentially abundant lactic acid bacteria in LAB and VAC compared to PC; Table S9A: Global network metrics comparison of microbial networks between PC and NC; Table S9B: Global network metrics comparison of microbial networks between PC and PF; Table S9C: Global network metrics comparison of microbial networks between PC and LAB; Table S9D: Global network metrics comparison of microbial networks between PC and VAC; Table S10: Microbial functional profiling to determine differentially abundant microbial pathways among treatments compared to PC; Table S11: Mean relative abundance (%) of the type of resistance in treatments; Table S12: Mean relative abundance (%) of the class of resistance in treatments; Table S13: Mean relative abundance (%) of the mechanism of resistance in treatments; Table S14: Mean relative abundance (%) of resistance genes in treatments; Table S15: Pairwise mean comparison of β diversity of resistance genes among treatments using pairwise PERMANOVA; Table S16: Mean relative abundance (%) of taxa at family level in treatments.

Author Contributions

D.M.P. performed bioinformatics, data, and statistical analysis, and wrote the manuscript. A.K.J. conceived the idea, designed the experiment, conducted the turkey challenge study with D.V.T.N., gathered funds and resources, and reviewed and revised the manuscript. D.V.T.N. led the turkey challenge study, collected cecal content, extracted DNA with S.M., and reviewed the manuscript. T.J.J., K.M.R. and S.N. collaborated on this project with AKJ as Co-PIs and student advisory committee members (D.M.P. and D.V.T.N.) and reviewed the manuscript. All authors have read and agreed to the published version of the manuscript.

Funding

This project was funded in part through the following grants awarded to the corresponding author, Anup Kollanoor Johny: (1) United States Department of Agriculture (USDA) NIFA #2018-68003-27464 (child project); (2) MAES Project #MIN-16-141; (3) Rapid Agricultural Response grant (Minnesota Department of Agriculture #229).

Institutional Review Board Statement

The University of Minnesota’s Institutional Animal Care and Use Committee (IACUC; #1803-35686A) and Institutional Biosafety Committee (IBC; #1706-34893H; #2006-38232H) approved animal care and use of infectious agents, respectively.

Informed Consent Statement

Not applicable.

Data Availability Statement

The raw shotgun metagenomic sequences of all samples are available in the NCBI database under BioProject PRJNA1252780.

Acknowledgments

The authors thank the MnDRIVE GFV graduate fellowship awarded to the first author, DMP, during his training in bioinformatics analysis. We also thank the University of Minnesota Genomics Center for the DNA library preparation and shotgun metagenomic sequencing, and the Minnesota Supercomputing Institute for providing a High-Performance Computing system for bioinformatics analysis.

Conflicts of Interest

The authors declare no conflicts of interest.

References

  1. Bull, M.J.; Plummer, N.T. Part 1: The Human Gut Microbiome in Health and Disease. Integr. Med. 2014, 13, 17–22. [Google Scholar]
  2. Rougière, N.; Carré, B. Comparison of Gastrointestinal Transit Times between Chickens from D+ and D− Genetic Lines Selected for Divergent Digestion Efficiency. Animal 2010, 4, 1861–1872. [Google Scholar] [CrossRef]
  3. Pan, D.; Yu, Z. Intestinal Microbiome of Poultry and Its Interaction with Host and Diet. Gut Microbes 2014, 5, 108–119. [Google Scholar] [CrossRef]
  4. Rimet, C.-S.; Maurer, J.J.; Pickler, L.; Stabler, L.; Johnson, K.K.; Berghaus, R.D.; Villegas, A.M.; Lee, M.; França, M. Salmonella Harborage Sites in Infected Poultry That May Contribute to Contamination of Ground Meat. Front. Sustain. Food Syst. 2019, 3, 2. [Google Scholar] [CrossRef]
  5. Yadav, S.; Jha, R. Strategies to Modulate the Intestinal Microbiota and Their Effects on Nutrient Utilization, Performance, and Health of Poultry. J. Anim. Sci. Biotechnol. 2019, 10, 2. [Google Scholar] [CrossRef]
  6. Dibner, J.J.; Richards, J.D. Antibiotic Growth Promoters in Agriculture: History and Mode of Action. Poult. Sci. 2005, 84, 634–643. [Google Scholar] [CrossRef] [PubMed]
  7. Yegani, M.; Korver, D.R. Factors Affecting Intestinal Health in Poultry. Poult. Sci. 2008, 87, 2052–2063. [Google Scholar] [CrossRef]
  8. Aruwa, C.E.; Pillay, C.; Nyaga, M.M.; Sabiu, S. Poultry Gut Health—Microbiome Functions, Environmental Impacts, Microbiome Engineering and Advancements in Characterization Technologies. J. Anim. Sci. Biotechnol. 2021, 12, 119. [Google Scholar] [CrossRef]
  9. Shang, Y.; Kumar, S.; Oakley, B.; Kim, W.K. Chicken Gut Microbiota: Importance and Detection Technology. Front. Vet. Sci. 2018, 5, 254. [Google Scholar] [CrossRef]
  10. Cisek, A.A.; Binek, M. Chicken Intestinal Microbiota Function with a Special Emphasis on the Role of Probiotic Bacteria. Pol. J. Vet. Sci. 2014, 17, 385–394. [Google Scholar] [CrossRef]
  11. Yang, Y.; Iji, P.A.; Choct, M. Dietary Modulation of Gut Microflora in Broiler Chickens: A Review of the Role of Six Kinds of Alternatives to in-Feed Antibiotics. World’s Poult. Sci. J. 2009, 65, 97–114. [Google Scholar] [CrossRef]
  12. Mead, G.C. Prospects for ‘Competitive Exclusion’ Treatment to Control Salmonella and Other Foodborne Pathogens in Poultry. Vet. J. 2000, 159, 111–123. [Google Scholar] [CrossRef] [PubMed]
  13. Van Der Wielen, P.W.J.J.; Biesterveld, S.; Notermans, S.; Hofstra, H.; Urlings, B.A.P.; Van Knapen, F. Role of Volatile Fatty Acids in Development of the Cecal Microflora in Broiler Chickens during Growth. Appl. Environ. Microbiol. 2000, 66, 2536–2540. [Google Scholar] [CrossRef]
  14. Nair, D.V.T.; Kollanoor Johny, A. Characterizing the Antimicrobial Function of a Dairy-Originated Probiotic, Propionibacterium freudenreichii, Against Multidrug-Resistant Salmonella enterica Serovar Heidelberg in Turkey Poults. Front. Microbiol. 2018, 9, 1475. [Google Scholar] [CrossRef]
  15. Thomas, J.V.; Nair, D.V.T.; Noll, S.; Johnson, T.J.; Cardona, C.; Johny, A.K. Effect of Turkey-Derived Beneficial Bacteria Lactobacillus salivarius and Lactobacillus ingluviei on a Multidrug-Resistant Salmonella Heidelberg Strain in Turkey Poults. J. Food Prot. 2019, 82, 435–440. [Google Scholar] [CrossRef]
  16. Manjankattil, S.; Dewi, G.; Peichel, C.; Creek, M.; Bina, P.; Lerohl, K.; Deniz, K.; Akhtar, L.; Porter, R.; Johnson, T.J.; et al. Dairy-Origin Propionibacterium freudenreichii, Turkey-Origin Lactobacillus salivarius, and a Salmonella Typhimurium Vaccine Elicit Comparable Colonization Resistance on Drug-Resistant Salmonella Serotypes (S. Reading, S. Agona, and S. Saintpaul) in Growing Turkeys After Oral Challenge. J. Appl. Poult. Res. 2024, 33, 100428. [Google Scholar] [CrossRef]
  17. Dewi, G.; Manjankattil, S.; Peichel, C.; Johnson, T.J.; Noll, S.; Cardona, C.; Kollanoor Johny, A. Combination of Autochthonous Lactobacillus Strains and Trans-Cinnamaldehyde in Water Reduces Salmonella Heidelberg in Turkey Poults. Front. Microbiol. 2024, 15, 1337428. [Google Scholar] [CrossRef] [PubMed]
  18. Desin, T.S.; Köster, W.; Potter, A.A. Salmonella Vaccines in Poultry: Past, Present and Future. Expert. Rev. Vaccines 2013, 12, 87–96. [Google Scholar] [CrossRef]
  19. Crouch, C.F.; Nell, T.; Reijnders, M.; Donkers, T.; Pugh, C.; Patel, A.; Davis, P.; Van Hulten, M.C.W.; De Vries, S.P.W. Safety and Efficacy of a Novel Inactivated Trivalent Salmonella enterica Vaccine in Chickens. Vaccine 2020, 38, 6741–6750. [Google Scholar] [CrossRef]
  20. NACMCF. Response to Questions Posed by the Food Safety and Inspection Service: Enhancing Salmonella Control in Poultry Products. J. Food Prot. 2024, 87, 100168. [Google Scholar] [CrossRef]
  21. Monson, M.S.; Gurung, M.; Bearson, B.L.; Whelan, S.J.; Trachsel, J.M.; Looft, T.; Sylte, M.J.; Bearson, S.M.D. Evaluating Two Live-Attenuated Vaccines against Salmonella enterica Serovar Reading in Turkeys: Reduced Tissue Colonization and Cecal Tonsil Transcriptome Responses. Front. Vet. Sci. 2024, 11, 1502303. [Google Scholar] [CrossRef]
  22. Crouch, C.F.; Pugh, C.; Patel, A.; Brink, H.; Wharmby, C.; Watts, A.; Van Hulten, M.C.W.; De Vries, S.P.W. Reduction in Intestinal Colonization and Invasion of Internal Organs after Challenge by Homologous and Heterologous Serovars of Salmonella enterica Following Vaccination of Chickens with a Novel Trivalent Inactivated Salmonella Vaccine. Avian Pathol. 2020, 49, 666–677. [Google Scholar] [CrossRef]
  23. Wang, Y.; Hu, Y.; Liu, F.; Cao, J.; Lv, N.; Zhu, B.; Zhang, G.; Gao, G.F. Integrated Metagenomic and Metatranscriptomic Profiling Reveals Differentially Expressed Resistomes in Human, Chicken, and Pig Gut Microbiomes. Environ. Int. 2020, 138, 105649. [Google Scholar] [CrossRef]
  24. Salyers, A.; Gupta, A.; Wang, Y. Human Intestinal Bacteria as Reservoirs for Antibiotic Resistance Genes. Trends Microbiol. 2004, 12, 412–416. [Google Scholar] [CrossRef] [PubMed]
  25. Juricova, H.; Matiasovicova, J.; Kubasova, T.; Cejkova, D.; Rychlik, I. The Distribution of Antibiotic Resistance Genes in Chicken Gut Microbiota Commensals. Sci. Rep. 2021, 11, 3290. [Google Scholar] [CrossRef] [PubMed]
  26. Xiao, S.; Mi, J.; Chen, Y.; Feng, K.; Mei, L.; Liao, X.; Wu, Y.; Wang, Y. The Abundance and Diversity of Antibiotic Resistance Genes in Layer Chicken Ceca Is Associated with Farm Enviroment. Front. Microbiol. 2023, 14, 1177404. [Google Scholar] [CrossRef]
  27. Piccirillo, A.; Tolosi, R.; Mughini-Gras, L.; Kers, J.G.; Laconi, A. Drinking Water and Biofilm as Sources of Antimicrobial Resistance in Free-Range Organic Broiler Farms. Antibiotics 2024, 13, 808. [Google Scholar] [CrossRef]
  28. Vogwill, T.; MacLean, R.C. The Genetic Basis of the Fitness Costs of Antimicrobial Resistance: A Meta-Analysis Approach. Evol. Appl. 2014, 8, 284. [Google Scholar] [CrossRef]
  29. Nair, D.V.; Kollanoor-Johny, A. Effect of Propionibacterium freudenreichii on Salmonella Multiplication, Motility, and Association with Avian Epithelial Cells. Poult. Sci. 2017, 96, 1376–1386. [Google Scholar] [CrossRef] [PubMed]
  30. Johny, A.K.; Baskaran, S.A.; Charles, A.S.; Amalaradjou, M.A.R.; Darre, M.J.; Khan, M.I.; Hoagland, T.A.; Schreiber, D.T.; Donoghue, A.M.; Donoghue, D.J.; et al. Prophylactic Supplementation of Caprylic Acid in Feed Reduces Salmonella Enteritidis Colonization in Commercial Broiler Chicks. J. Food Prot. 2009, 72, 722–727. [Google Scholar] [CrossRef]
  31. Manjankattil, S.; Nair, D.V.T.; Peichel, C.; Noll, S.; Johnson, T.J.; Cox, R.B.; Donoghue, A.M.; Kollanoor Johny, A. Effect of Caprylic Acid Alone or in Combination with Peracetic Acid against Multidrug-Resistant Salmonella Heidelberg on Chicken Drumsticks in a Soft Scalding Temperature-Time Setup. Poult. Sci. 2021, 100, 101421. [Google Scholar] [CrossRef] [PubMed]
  32. National Research Council (U.S.) (Ed.) Nutrient Requirements of Poultry, 9th rev. ed.; Nutrient Requirements of Domestic Animals; National Academy Press: Washington, DC, USA, 1994; ISBN 978-0-309-04892-7. [Google Scholar]
  33. Martin, M. Cutadapt Removes Adapter Sequences from High-throughput Sequencing Reads. EMBnet. J. 2011, 17, 10–12. [Google Scholar] [CrossRef]
  34. Cunningham, F.; Allen, J.E.; Allen, J.; Alvarez-Jarreta, J.; Amode, M.R.; Armean, I.M.; Austine-Orimoloye, O.; Azov, A.G.; Barnes, I.; Bennett, R.; et al. Ensembl 2022. Nucleic Acids Res. 2022, 50, D988–D995. [Google Scholar] [CrossRef] [PubMed]
  35. Bonin, N.; Doster, E.; Worley, H.; Pinnell, L.J.; Bravo, J.E.; Ferm, P.; Marini, S.; Prosperi, M.; Noyes, N.; Morley, P.S.; et al. MEGARes and AMR++, v3.0: An Updated Comprehensive Database of Antimicrobial Resistance Determinants and an Improved Software Pipeline for Classification Using High-Throughput Sequencing. Nucleic Acids Res. 2023, 51, D744–D752. [Google Scholar] [CrossRef]
  36. Wood, D.E.; Lu, J.; Langmead, B. Improved Metagenomic Analysis with Kraken 2. Genome Biol. 2019, 20, 257. [Google Scholar] [CrossRef]
  37. Franzosa, E.A.; McIver, L.J.; Rahnavard, G.; Thompson, L.R.; Schirmer, M.; Weingart, G.; Lipson, K.S.; Knight, R.; Caporaso, J.G.; Segata, N.; et al. Species-Level Functional Profiling of Metagenomes and Metatranscriptomes. Nat. Methods 2018, 15, 962–968. [Google Scholar] [CrossRef] [PubMed]
  38. McMurdie, P.J.; Holmes, S. Phyloseq: An R Package for Reproducible Interactive Analysis and Graphics of Microbiome Census Data. PLoS ONE 2013, 8, e61217. [Google Scholar] [CrossRef]
  39. Peschel, S.; Müller, C.L.; Von Mutius, E.; Boulesteix, A.-L.; Depner, M. NetCoMi: Network Construction and Comparison for Microbiome Data in R. Brief. Bioinform. 2021, 22, bbaa290. [Google Scholar] [CrossRef]
  40. Oksanen, J.; Simpson, G.L.; Blanchet, F.G.; Kindt, R.; Legendre, P.; Minchin, P.R.; O’Hara, R.B.; Solymos, P.; Stevens, M.H.H.; Szoecs, E.; et al. The Vegan Package Version 2.6-10, Community Ecology Package. 2025. Available online: https://cran.r-project.org/src/contrib/Archive/vegan/ (accessed on 5 March 2023).
  41. Lahti, L.; Shetty, S. Microbiome R Package. Bioconductor. 2017. Available online: https://research.rug.nl/en/publications/microbiome-r-package (accessed on 5 March 2023).
  42. Anderson, M.J. Permutational Multivariate Analysis of Variance (PERMANOVA). In Wiley StatsRef: Statistics Reference Online; John Wiley & Sons, Ltd.: Hoboken, NJ, USA, 2017; pp. 1–15. ISBN 978-1-118-44511-2. [Google Scholar]
  43. Wickham, H. Ggplot2; Use R! Springer International Publishing: Cham, Switzerland, 2016; ISBN 978-3-319-24275-0. [Google Scholar]
  44. Lin, H.; Peddada, S.D. Multigroup Analysis of Compositions of Microbiomes with Covariate Adjustments and Repeated Measures. Nat. Methods 2024, 21, 83–91. [Google Scholar] [CrossRef]
  45. Friedman, J.; Alm, E.J. Inferring Correlation Networks from Genomic Survey Data. PLoS Comput. Biol. 2012, 8, e1002687. [Google Scholar] [CrossRef]
  46. Olbricht, H.; Twadell, K.; Sandel, B.; Stephens, C.; Whittall, J.B. Is There a Universal Endurance Microbiota? Microorganisms 2022, 10, 2213. [Google Scholar] [CrossRef]
  47. Mallick, H.; Rahnavard, A.; McIver, L.J.; Ma, S.; Zhang, Y.; Nguyen, L.H.; Tickle, T.L.; Weingart, G.; Ren, B.; Schwager, E.H.; et al. Multivariable Association Discovery in Population-Scale Meta-Omics Studies. PLoS Comput. Biol. 2021, 17, e1009442. [Google Scholar] [CrossRef]
  48. Kayani, M.R.; Huang, W.; Feng, R.; Chen, L. Genome-Resolved Metagenomics Using Environmental and Clinical Samples. Brief. Bioinform. 2021, 22, bbab030. [Google Scholar] [CrossRef] [PubMed]
  49. Oren, A.; Garrity, G.M. Valid Publication of the Names of Forty-Two Phyla of Prokaryotes. Int. J. Syst. Evol. Microbiol. 2021, 71, 005056. [Google Scholar] [CrossRef]
  50. Traore, S.I.; Lo, C.I.; Mossaab, M.; Durand, G.; Lagier, J.C.; Raoult, D.; Fournier, P.-E.; Fenollar, F. Maliibacterium massiliense Gen. Nov. sp. Nov., Isolated from Human Feces and Proposal of Maliibacteriaceae Fam. Nov. Curr. Microbiol. 2023, 80, 211. [Google Scholar] [CrossRef]
  51. Nair, D.V.T.; Vazhakkattu Thomas, J.; Dewi, G.; Noll, S.; Brannon, J.; Kollanoor Johny, A. Reduction of Multidrug-Resistant Salmonella enterica Serovar Heidelberg Using a Dairy-Originated Probiotic Bacterium, Propionibacterium freudenreichii freudenreichii B3523, in Growing Turkeys. J. Appl. Poult. Res. 2019, 28, 356–363. [Google Scholar] [CrossRef]
  52. Nair, D.V.T.; Vazhakkattu Thomas, J.; Dewi, G.; Brannon, J.; Noll, S.L.; Johnson, T.J.; Cox, R.B.; Kollanoor Johny, A. Propionibacterium freudenreichii freudenreichii B3523 Reduces Cecal Colonization and Internal Organ Dissemination of Multidrug-Resistant Salmonella Heidelberg in Finishing Turkeys. J. Appl. Poult. Res. 2021, 30, 100107. [Google Scholar] [CrossRef]
  53. Nair, D.V.T.; Johnson, T.J.; Noll, S.L.; Kollanoor Johny, A. Effect of Supplementation of a Dairy-Originated Probiotic Bacterium, Propionibacterium freudenreichii subsp. freudenreichii, on the Cecal Microbiome of Turkeys Challenged with Multidrug-Resistant Salmonella Heidelberg. Poult. Sci. 2021, 100, 283–295. [Google Scholar] [CrossRef]
  54. Nair, D.V.T.; Thomas, J.V.; Dewi, G.; Noll, S.; Johnson, T.; Kollanoor Johny, A. Effects of Multiple Alternatives to Antibiotic Interventions on Multidrug-Resistant Salmonella Heidelberg in Commercial Turkeys. Poult. Sci. 2019, 98 (Suppl. 1), 256. [Google Scholar]
  55. Zhang, T.; Xie, J.; Zhang, M.; Fu, N.; Zhang, Y. Effect of a Potential Probiotics Lactococcus garvieae B301 on the Growth Performance, Immune Parameters and Caecum Microflora of Broiler Chickens. J. Anim. Physiol. Anim. Nutr. 2016, 100, 413–421. [Google Scholar] [CrossRef]
  56. Martín, V.; Cárdenas, N.; Jiménez, E.; Maldonado, A.; Rodríguez, J.M.; Fernández, L. Genome Sequence of Lactobacillus gastricus PS3, a Strain Isolated from Human Milk. Genome Announc. 2013, 1, e00489-13. [Google Scholar] [CrossRef] [PubMed]
  57. Kavita, S.; Pooranachithra, M.; Singh, N.; Prasanth, M.I.; Balamurugan, K.; Goel, G. Lactobacillus gastricus BTM 7 Prevents Intestinal Colonization by Biofilm Forming Cronobacter sakazakii in Caenorhabditis elegans Model Host. Antonie Van Leeuwenhoek 2020, 113, 1587–1600. [Google Scholar] [CrossRef]
  58. Kamboj, K.; Vasquez, A.; Balada-Llasat, J.-M. Identification and Significance of Weissella Species Infections. Front. Microbiol. 2015, 6, 1204. [Google Scholar] [CrossRef] [PubMed]
  59. Wan, X.; Takala, T.M.; Huynh, V.A.; Ahonen, S.L.; Paulin, L.; Björkroth, J.; Sironen, T.; Kant, R.; Saris, P. Comparative Genomics of 40 Weissella paramesenteroides Strains. Front. Microbiol. 2023, 14, 1128028. [Google Scholar] [CrossRef]
  60. Panthee, S.; Paudel, A.; Blom, J.; Hamamoto, H.; Sekimizu, K. Complete Genome Sequence of Weissella hellenica 0916-4-2 and Its Comparative Genomic Analysis. Front. Microbiol. 2019, 10, 1619. [Google Scholar] [CrossRef] [PubMed]
  61. Ahmed, S.; Singh, S.; Singh, V.; Roberts, K.D.; Zaidi, A.; Rodriguez-Palacios, A. The Weissella Genus: Clinically Treatable Bacteria with Antimicrobial/Probiotic Effects on Inflammation and Cancer. Microorganisms 2022, 10, 2427. [Google Scholar] [CrossRef]
  62. Leong, K.-H.; Chen, Y.-S.; Lin, Y.-H.; Pan, S.-F.; Yu, B.; Wu, H.-C.; Yanagida, F. Weissellicin L, a Novel Bacteriocin from Sian-Sianzih-Isolated Weissella hellenica 4-7. J. Appl. Microbiol. 2013, 115, 70–76. [Google Scholar] [CrossRef]
  63. Jazi, V.; Foroozandeh, A.D.; Toghyani, M.; Dastar, B.; Rezaie Koochaksaraie, R.; Toghyani, M. Effects of Pediococcus acidilactici, Mannan-Oligosaccharide, Butyric Acid and Their Combination on Growth Performance and Intestinal Health in Young Broiler Chickens Challenged with Salmonella Typhimurium. Poult. Sci. 2018, 97, 2034–2043. [Google Scholar] [CrossRef]
  64. Seo, H.-J.; Kang, S.-S. Inhibitory Effect of Bacteriocin Produced by Pediococcus acidilactici on the Biofilm Formation of Salmonella Typhimurium. Food Control 2020, 117, 107361. [Google Scholar] [CrossRef]
  65. Lee, S.H.; Lillehoj, H.S.; Dalloul, R.A.; Park, D.W.; Hong, Y.H.; Lin, J.J. Influence of Pediococcus-Based Probiotic on Coccidiosis in Broiler Chickens. Poult. Sci. 2007, 86, 63–66. [Google Scholar] [CrossRef]
  66. Chen, Y.-T.; Yang, N.-S.; Lin, Y.-C.; Ho, S.-T.; Li, K.-Y.; Lin, J.-S.; Liu, J.-R.; Chen, M.-J. A Combination of Lactobacillus mali APS1 and Dieting Improved the Efficacy of Obesity Treatment via Manipulating Gut Microbiome in Mice. Sci. Rep. 2018, 8, 6153. [Google Scholar] [CrossRef] [PubMed]
  67. Brisbin, J.T.; Gong, J.; Orouji, S.; Esufali, J.; Mallick, A.I.; Parvizi, P.; Shewen, P.E.; Sharif, S. Oral Treatment of Chickens with Lactobacilli Influences Elicitation of Immune Responses. Clin. Vaccine Immunol. 2011, 18, 1447–1455. [Google Scholar] [CrossRef]
  68. Mikami, A.; Ogita, T.; Namai, F.; Shigemori, S.; Sato, T.; Shimosato, T. Oral Administration of Flavonifractor plautii Attenuates Inflammatory Responses in Obese Adipose Tissue. Mol. Biol. Rep. 2020, 47, 6717–6725. [Google Scholar] [CrossRef] [PubMed]
  69. Ogita, T.; Yamamoto, Y.; Mikami, A.; Shigemori, S.; Sato, T.; Shimosato, T. Oral Administration of Flavonifractor plautii Strongly Suppresses Th2 Immune Responses in Mice. Front. Immunol. 2020, 11, 379. [Google Scholar] [CrossRef]
  70. Dziarski, R.; Park, S.Y.; Kashyap, D.R.; Dowd, S.E.; Gupta, D. Pglyrp-Regulated Gut Microflora Prevotella falsenii, Parabacteroides distasonis and Bacteroides eggerthii Enhance and Alistipes finegoldii Attenuates Colitis in Mice. PLoS ONE 2016, 11, e0146162. [Google Scholar] [CrossRef]
  71. Parker, B.J.; Wearsch, P.A.; Veloo, A.C.M.; Rodriguez-Palacios, A. The Genus Alistipes: Gut Bacteria with Emerging Implications to Inflammation, Cancer, and Mental Health. Front. Immunol. 2020, 11, 906. [Google Scholar] [CrossRef] [PubMed]
  72. Torok, V.A.; Hughes, R.J.; Mikkelsen, L.L.; Perez-Maldonado, R.; Balding, K.; MacAlpine, R.; Percy, N.J.; Ophel-Keller, K. Identification and Characterization of Potential Performance-Related Gut Microbiotas in Broiler Chickens across Various Feeding Trials. Appl. Environ. Microbiol. 2011, 77, 5868–5878. [Google Scholar] [CrossRef]
  73. Guh, A.Y.; Kutty, P.K. Clostridioides difficile Infection. Ann. Intern. Med. 2018, 169, ITC49–ITC64. [Google Scholar] [CrossRef]
  74. Bolton, D.; Marcos, P. The Environment, Farm Animals and Foods as Sources of Clostridioides difficile Infection in Humans. Foods 2023, 12, 1094. [Google Scholar] [CrossRef]
  75. Heise, J.; Witt, P.; Maneck, C.; Wichmann-Schauer, H.; Maurischat, S. Prevalence and Phylogenetic Relationship of Clostridioides difficile Strains in Fresh Poultry Meat Samples Processed in Different Cutting Plants. Int. J. Food Microbiol. 2021, 339, 109032. [Google Scholar] [CrossRef]
  76. Singh, A.; D’Amico, D.; Andreux, P.A.; Dunngalvin, G.; Kern, T.; Blanco-Bose, W.; Auwerx, J.; Aebischer, P.; Rinsch, C. Direct Supplementation with Urolithin A Overcomes Limitations of Dietary Exposure and Gut Microbiome Variability in Healthy Adults to Achieve Consistent Levels across the Population. Eur. J. Clin. Nutr. 2022, 76, 297–308. [Google Scholar] [CrossRef] [PubMed]
  77. Leigh, R.J.; Corrigan, A.; Murphy, R.A.; Walsh, F. Effect of Mannan-Rich Fraction Supplementation on Commercial Broiler Intestinum Tenue and Cecum Microbiota. Anim. Microbiome 2022, 4, 66. [Google Scholar] [CrossRef] [PubMed]
  78. Gardiner, B.J.; Tai, A.Y.; Kotsanas, D.; Francis, M.J.; Roberts, S.A.; Ballard, S.A.; Junckerstorff, R.K.; Korman, T.M. Clinical and Microbiological Characteristics of Eggerthella lenta Bacteremia. J. Clin. Microbiol. 2015, 53, 626–635. [Google Scholar] [CrossRef] [PubMed]
  79. Alexander, M.; Ang, Q.Y.; Nayak, R.R.; Bustion, A.E.; Sandy, M.; Zhang, B.; Upadhyay, V.; Pollard, K.S.; Lynch, S.V.; Turnbaugh, P.J. Human Gut Bacterial Metabolism Drives Th17 Activation and Colitis. Cell Host Microbe 2022, 30, 17–30.e9. [Google Scholar] [CrossRef]
  80. Li, S.; Lin, R.; Chen, J.; Hussain, R.; Zhang, S.; Su, Y.; Chan, Y.; Shi, D. Integrated Gut Microbiota and Metabolomic Analysis Reveals Immunomodulatory Effects of Echinacea Extract and Astragalus Polysaccharides. Front. Vet. Sci. 2022, 9, 971058. [Google Scholar] [CrossRef]
  81. Patterson, A.M.; Mulder, I.E.; Travis, A.J.; Lan, A.; Cerf-Bensussan, N.; Gaboriau-Routhiau, V.; Garden, K.; Logan, E.; Delday, M.I.; Coutts, A.G.P.; et al. Human Gut Symbiont Roseburia hominis Promotes and Regulates Innate Immunity. Front. Immunol. 2017, 8, 1166. [Google Scholar] [CrossRef]
  82. Rychlik, I. Composition and Function of Chicken Gut Microbiota. Animals 2020, 10, 103. [Google Scholar] [CrossRef]
  83. Song, L.; Sun, Q.; Zheng, H.; Zhang, Y.; Wang, Y.; Liu, S.; Duan, L. Roseburia hominis Alleviates Neuroinflammation via Short-Chain Fatty Acids through Histone Deacetylase Inhibition. Mol. Nutr. Food Res. 2022, 66, 2200164. [Google Scholar] [CrossRef]
  84. Chiumento, S.; Roblin, C.; Kieffer-Jaquinod, S.; Tachon, S.; Leprètre, C.; Basset, C.; Aditiyarini, D.; Olleik, H.; Nicoletti, C.; Bornet, O.; et al. Ruminococcin C, a Promising Antibiotic Produced by a Human Gut Symbiont. Sci. Adv. 2019, 5, eaaw9969. [Google Scholar] [CrossRef]
  85. Dabard, J.; Bridonneau, C.; Phillipe, C.; Anglade, P.; Molle, D.; Nardi, M.; Ladiré, M.; Girardin, H.; Marcille, F.; Gomez, A.; et al. Ruminococcin A, a New Lantibiotic Produced by a Ruminococcus gnavus Strain Isolated from Human Feces. Appl. Environ. Microbiol. 2001, 67, 4111–4118. [Google Scholar] [CrossRef]
  86. Roblin, C.; Chiumento, S.; Jacqueline, C.; Pinloche, E.; Nicoletti, C.; Olleik, H.; Courvoisier-Dezord, E.; Amouric, A.; Basset, C.; Dru, L.; et al. The Multifunctional Sactipeptide Ruminococcin C1 Displays Potent Antibacterial Activity In Vivo as Well as Other Beneficial Properties for Human Health. Int. J. Mol. Sci. 2021, 22, 3253. [Google Scholar] [CrossRef] [PubMed]
  87. Song, I.; Gotoh, Y.; Ogura, Y.; Hayashi, T.; Fukiya, S.; Yokota, A. Comparative Genomic and Physiological Analysis against Clostridium scindens Reveals Eubacterium sp. c-25 as an Atypical Deoxycholic Acid Producer of the Human Gut Microbiota. Microorganisms 2021, 9, 2254. [Google Scholar] [CrossRef] [PubMed]
  88. Buffie, C.G.; Bucci, V.; Stein, R.R.; McKenney, P.T.; Ling, L.; Gobourne, A.; No, D.; Liu, H.; Kinnebrew, M.; Viale, A.; et al. Precision Microbiome Reconstitution Restores Bile Acid Mediated Resistance to Clostridium difficile. Nature 2015, 517, 205–208. [Google Scholar] [CrossRef]
  89. Le Roy, T.; Moens de Hase, E.; Van Hul, M.; Paquot, A.; Pelicaen, R.; Régnier, M.; Depommier, C.; Druart, C.; Everard, A.; Maiter, D.; et al. Dysosmobacter welbionis Is a Newly Isolated Human Commensal Bacterium Preventing Diet-Induced Obesity and Metabolic Disorders in Mice. Gut 2022, 71, 534–543. [Google Scholar] [CrossRef] [PubMed]
  90. Moens De Hase, E.; Neyrinck, A.M.; Rodriguez, J.; Cnop, M.; Paquot, N.; Thissen, J.-P.; Xu, Y.; Beloqui, A.; Bindels, L.B.; Delzenne, N.M.; et al. Impact of Metformin and Dysosmobacter welbionis on Diet-Induced Obesity and Diabetes: From Clinical Observation to Preclinical Intervention. Diabetologia 2024, 67, 333–345. [Google Scholar] [CrossRef]
  91. Moens De Hase, E.; Petitfils, C.; Alhouayek, M.; Depommier, C.; Le Faouder, P.; Delzenne, N.M.; Van Hul, M.; Muccioli, G.G.; Cenac, N.; Cani, P.D. Dysosmobacter Welbionis Effects on Glucose, Lipid, and Energy Metabolism Are Associated with Specific Bioactive Lipids. J. Lipid Res. 2023, 64, 100437. [Google Scholar] [CrossRef]
  92. Rinkinen, M.L.; Koort, J.M.K.; Ouwehand, A.C.; Westermarck, E.; Björkroth, K.J. Streptococcus alactolyticus Is the Dominating Culturable Lactic Acid Bacterium Species in Canine Jejunum and Feces of Four Fistulated Dogs. FEMS Microbiol. Lett. 2004, 230, 35–39. [Google Scholar] [CrossRef]
  93. Gu, X.; Wang, H.; Wang, L.; Zhang, K.; Tian, Y.; Wang, X.; Xu, G.; Guo, Z.; Ahmad, S.; Egide, H.; et al. The Antioxidant Activity and Metabolomic Analysis of the Supernatant of Streptococcus alactolyticus Strain FGM. Sci. Rep. 2024, 14, 8413. [Google Scholar] [CrossRef]
  94. Zhang, J.; Zhang, H.; Wang, L.; Zhang, K.; Qiu, Z.; Zhang, K.; Yue, C.; Zhang, Y.; Zhao, X.; Li, J. The Safety and Potential Probiotic Properties Analysis of Streptococcus alactolyticus Strain FGM Isolated from the Chicken Cecum. Ann. Microbiol. 2021, 71, 19. [Google Scholar] [CrossRef]
  95. Liu, X.; Mao, B.; Gu, J.; Wu, J.; Cui, S.; Wang, G.; Zhao, J.; Zhang, H.; Chen, W. Blautia—A New Functional Genus with Potential Probiotic Properties? Gut Microbes 2021, 13, 1875796. [Google Scholar] [CrossRef]
  96. Rui, W.; Li, X.; Wang, L.; Tang, X.; Yang, J. Potential Applications of Blautia wexlerae in the Regulation of Host Metabolism. Probiotics Antimicrob. Proteins 2024, 5, 1866–1874. [Google Scholar] [CrossRef]
  97. Hosomi, K.; Saito, M.; Park, J.; Murakami, H.; Shibata, N.; Ando, M.; Nagatake, T.; Konishi, K.; Ohno, H.; Tanisawa, K.; et al. Oral Administration of Blautia wexlerae Ameliorates Obesity and Type 2 Diabetes via Metabolic Remodeling of the Gut Microbiota. Nat. Commun. 2022, 13, 4477. [Google Scholar] [CrossRef]
  98. Magdy Wasfy, R.; Mbaye, B.; Borentain, P.; Tidjani Alou, M.; Murillo Ruiz, M.L.; Caputo, A.; Andrieu, C.; Armstrong, N.; Million, M.; Gerolami, R. Ethanol-Producing Enterocloster bolteae Is Enriched in Chronic Hepatitis B-Associated Gut Dysbiosis: A Case–Control Culturomics Study. Microorganisms 2023, 11, 2437. [Google Scholar] [CrossRef]
  99. Werner, C. Chapter 4—Metabolic Pathways and Cycles. In The Scientist’s Guide to Cardiac Metabolism; Academic Press: Cambridge, MA, USA, 2016. [Google Scholar]
  100. Riganti, C.; Gazzano, E.; Polimeni, M.; Aldieri, E.; Ghigo, D. The Pentose Phosphate Pathway: An Antioxidant Defense and a Crossroad in Tumor Cell Fate. Free Radic. Biol. Med. 2012, 53, 421–436. [Google Scholar] [CrossRef] [PubMed]
  101. Wang, Y.; Wu, J.; Lv, M.; Shao, Z.; Hungwe, M.; Wang, J.; Bai, X.; Xie, J.; Wang, Y.; Geng, W. Metabolism Characteristics of Lactic Acid Bacteria and the Expanding Applications in Food Industry. Front. Bioeng. Biotechnol. 2021, 9, 612285. [Google Scholar] [CrossRef] [PubMed]
  102. Abriouel, H.; Pérez Montoro, B.; Casimiro-Soriguer, C.S.; Pérez Pulido, A.J.; Knapp, C.W.; Caballero Gómez, N.; Castillo-Gutiérrez, S.; Estudillo-Martínez, M.D.; Gálvez, A.; Benomar, N. Insight into Potential Probiotic Markers Predicted in Lactobacillus pentosus MP-10 Genome Sequence. Front. Microbiol. 2017, 8, 891. [Google Scholar] [CrossRef] [PubMed]
  103. Jung, M.Y.; Lee, C.; Seo, M.-J.; Roh, S.W.; Lee, S.H. Characterization of a Potential Probiotic Bacterium Lactococcus raffinolactis WiKim0068 Isolated from Fermented Vegetable Using Genomic and in Vitro Analyses. BMC Microbiol. 2020, 20, 136. [Google Scholar] [CrossRef]
  104. Nishimura, J. Probiotic Characteristics and Carbohydrate Metabolism of Lactobacillus reuteri. Milk Sci. 2020, 69, 71–82. [Google Scholar] [CrossRef]
  105. Zan, Z.; Mao, Q.; Han, Z.; Sun, J. Changes in the Intestinal Microbiota of Farmed Northern Sheatfish (Silurus Soldatovi) Associated with Natural Bacterial Infection. J. World Aquac. Soc. 2023, 54, 1575–1591. [Google Scholar] [CrossRef]
  106. Lamas, A.; Regal, P.; Vázquez, B.; Cepeda, A.; Franco, C.M. Short Chain Fatty Acids Commonly Produced by Gut Microbiota Influence Salmonella enterica Motility, Biofilm Formation, and Gene Expression. Antibiotics 2019, 8, 265. [Google Scholar] [CrossRef]
  107. Alshawabkeh, K.; Tabbaa, M.J. Using Dietary Propionic Acid to Limit Salmonella Gallinarum Colonization in Broiler Chicks. Asian Australas. J. Anim. Sci. 2002, 15, 243–246. [Google Scholar] [CrossRef]
  108. Al-Tarazi, Y.H.; Alshawabkeh, K. Effect of Dietary Formic and Propionic Acids on Salmonella Pullorum Shedding and Mortality in Layer Chicks after Experimental Infection. J. Vet. Med. Ser. B 2003, 50, 112–117. [Google Scholar] [CrossRef]
  109. de Carvalho, C.C.C.R.; Caramujo, M.J. The Various Roles of Fatty Acids. Molecules 2018, 23, 2583. [Google Scholar] [CrossRef] [PubMed]
  110. Tian, H.; Wang, Y.; Liu, Z.; Hu, Z.; Guo, Y.; Deng, M.; Liu, G.; Sun, B. Effects of Malic Acid and Sucrose on the Fermentation Parameters, CNCPS Nitrogen Fractions, and Bacterial Community of Moringa oleifera Leaves Silage. Microorganisms 2021, 9, 2102. [Google Scholar] [CrossRef]
  111. Wang, H.; McElfresh, G.; Wijesuriya, N.; Podgorny, A.; Hecht, A.D.; Ray, J.C.J. Overlapping Stimulons Arising in Response to Divergent Stresses in Escherichia coli. bioRxiv 2021. [Google Scholar] [CrossRef]
  112. Kraimi, N.; Lormant, F.; Calandreau, L.; Kempf, F.; Zemb, O.; Lemarchand, J.; Constantin, P.; Parias, C.; Germain, K.; Rabot, S.; et al. Microbiota and Stress: A Loop That Impacts Memory. Psychoneuroendocrinology 2022, 136, 105594. [Google Scholar] [CrossRef] [PubMed]
  113. Turner, J.; Muraoka, A.; Bedenbaugh, M.; Childress, B.; Pernot, L.; Wiencek, M.; Peterson, Y.K. The Chemical Relationship Among Beta-Lactam Antibiotics and Potential Impacts on Reactivity and Decomposition. Front. Microbiol. 2022, 13, 807955. [Google Scholar] [CrossRef]
  114. Jan, T.-R.; Lin, C.-S.; Wang, S.-Y.; Yang, W.-Y. Cytokines and Cecal Microbiome Modulations Conferred by a Dual Vaccine in Salmonella-Infected Layers. Poult. Sci. 2023, 102, 102373. [Google Scholar] [CrossRef]
Figure 1. β diversity of taxa observed among treatments. NC = Negative Control (without any AA supplementation and non-SH challenge); PC = Positive Control (without any AA supplementation but with SH challenge); LAB = Lactobacillus supplemented, SH challenged; PF = P. freudenreichii supplemented, SH challenged; VAC = Salmonella vaccine treated, SH challenged.
Microbiolres 16 00136 g001
Figure 2. Relative abundance of taxa at the phylum level for samples (n = 8/treatment) among treatments. LAB = Lactobacillus supplemented, SH challenged; NC = Negative Control (without any AA supplementation and non-SH challenge); PC = Positive Control (without any AA supplementation but with SH challenge); PF = P. freudenreichii supplemented, SH challenged; VAC = Salmonella vaccine treated, SH challenged.
Microbiolres 16 00136 g002
Figure 3. Relative abundance of taxa at the genus level for samples (n = 8/treatment) among treatments. LAB = Lactobacillus supplemented, SH challenged; NC = Negative Control (without any AA supplementation and non-SH challenge), PC = Positive Control (without any AA supplementation but with SH challenge); PF = P. freudenreichii supplemented, SH challenged; VAC = Salmonella vaccine treated, SH challenged.
Microbiolres 16 00136 g003
Figure 4. Bacterial species’ association comparison between PC and NC. Association between the top 50 most frequent species in PC and NC as identified using CClasso association measure. The node size was determined by the eigenvector centrality. Edge thickness indicates the strength of the association, with green color positive and red color negative estimated association. Here, the fast greedy modularity optimization was used as the clustering method and eigenvector centrality for determining the hub taxa from the nodes. Nodes above the 95th empirical quantile of centrality are chosen as hubs. Taxa in bold letters are the hub taxa. Node color is based on the clustering of nodes. PC = Positive Control (without any supplementation but with SH challenge), NC = Negative Control (without any supplementation and non-SH challenge).
Microbiolres 16 00136 g004
Figure 5. Bacterial species’ association comparison between PC and PF. Association between the top 50 most frequent species in PC and PF as identified using CClasso association measure. The node size in the network was determined by the eigenvector centrality. Edge thickness indicates the strength of the association, with green color positive and red color negative estimated association. Here, the fast greedy modularity optimization was used as the clustering method and eigenvector centrality for determining the hub taxa from the nodes. Nodes above the 95th empirical quantile of centrality are chosen as hubs. Taxa in bold letters are the hub taxa. Node color is based on the clustering of nodes. PC = Positive Control (without any supplementation but with SH challenge); PF = P. freudenreichii supplemented, SH challenged.
Microbiolres 16 00136 g005
Figure 6. Bacterial species’ association comparison between PC and LAB. Association between the top 50 most frequent species in PC and LAB was identified using CClasso association measure. The node size in the network was determined by the eigenvector centrality. Edge thickness indicates the strength of the association, with green color positive and red color negative association. Here, the fast greedy modularity optimization was used as the clustering method and eigenvector centrality for determining the hub taxa from the nodes. Nodes above the 95th empirical quantile of centrality are chosen as hubs. Taxa in bold letters are the hub taxa. Node color is based on the clustering of nodes. PC = Positive Control (without any AA supplementation but with SH challenge); LAB = Lactobacillus supplemented, SH challenged.
Microbiolres 16 00136 g006
Figure 7. Bacterial species’ association comparison between PC and VAC. Association between the top 50 most frequent species in PC and VAC as identified using CClasso association measure. The node size in the network was determined by the eigenvector centrality. Edge thickness indicates the strength of the association, with green color positive and red color negative association. Here, the fast greedy modularity optimization was used as the clustering method and eigenvector centrality for determining the hub taxa from the nodes. Nodes above the 95th empirical quantile of centrality are chosen as hubs. Taxa in bold letters are the hub taxa. Node color is based on the clustering of nodes. PC = Positive Control (without any AA supplementation but with SH challenge); VAC = Salmonella vaccine treated, SH challenged.
Microbiolres 16 00136 g007
Figure 8. Peptidoglycan biosynthesis V (β-lactam resistance) pathway abundance observed in treatments. A negative binomial method with BH correction using PC as the reference was employed as the statistical method to find differentially abundant pathways (significance at FDR < 0.05, Coefficient < −1). PC = Positive Control (without any supplementation but with SH challenge); LAB = Lactobacillus-supplemented, SH-challenged; NC = Negative Control (without any AA supplementation and no-SH challenge); PF = P. freudenreichii-supplemented, SH-challenged; VAC = Salmonella vaccine-treated, SH-challenged. FDR and coefficient indicate that the differential abundance of the Peptidoglycan biosynthesis V (β-lactam resistance) pathway is depleted in LAB compared to PC.
Microbiolres 16 00136 g008
Figure 9. (a) PPP abundance in treatments. A negative binomial method with BH correction using PC as the reference was employed as the statistical method to find differentially abundant pathways (Significance at FDR < 0.05, Coefficient > 1). PC = Positive Control (without any AA supplementation but with SH challenge); LAB = Lactobacillus supplemented, SH challenged; NC = Negative Control (without any AA supplementation and no-SH challenge); PF = P. freudenreichii-supplemented, SH-challenged; VAC = Salmonella-vaccine-treated, SH-challenged. FDR and coefficient values indicate that the differential abundance of PPP is enriched in all three AA treatments (from left to right PF, LAB, and VAC) compared to PC. (b) Gondoate biosynthesis (anaerobic) pathway abundance in treatments. A negative binomial method with BH correction using PC as the reference was employed as the statistical method to find differentially abundant pathways (Significance at FDR < 0.05, Coefficient > 1). PC = Positive Control (without any AA supplementation but with SH challenge), LAB = Lactobacillus-supplemented, SH-challenged; NC = Negative Control (without any AA supplementation and no SH challenge); PF = P. freudenreichii-supplemented, SH-challenged; VAC = Salmonella-vaccine-treated, SH-challenged. FDR and coefficient values indicate that the differential abundance of the gondoate biosynthesis (anaerobic) pathway is enriched in all three AA treatments (From left to right PF, LAB, and VAC) compared to PC. (c) Cis-vaccenate biosynthesis pathway abundance in treatments. A negative binomial method with BH correction using PC as the reference was employed as the statistical method to find differentially abundant pathways (Significance at FDR < 0.05, Coefficient > 1). PC = Positive Control (without any AA supplementation but with SH challenge); LAB = Lactobacillus-supplemented, SH-challenged; NC = Negative Control (without any AA supplementation and no SH challenge); PF = P. freudenreichii-supplemented, SH-challenged; VAC = Salmonella-vaccine-treated, SH-challenged. FDR and coefficient values indicate that the differential abundance of the Cis-vaccinate biosynthesis pathway is enriched in all three AA treatments (from left to right PF, LAB, and VAC) compared to PC.
Microbiolres 16 00136 g009
Figure 10. Differential abundance of the Pyruvate fermentation to the propionate pathway in LAB compared to PC. A negative binomial method with BH correction using PC as the reference was employed as the statistical method to find differentially abundant pathways (Significance at FDR < 0.05, Coefficient > 1). PC = Positive Control (without any AA supplementation but with SH challenge), LAB = Lactobacillus supplemented, SH challenged; NC = Negative Control (without any AA supplementation and no SH challenge); PF = P. freudenreichii-supplemented, SH-challenged; VAC = Salmonella-vaccine-treated, SH-challenged. FDR and coefficient values indicate that the differential abundance of the pyruvate fermentation to propionate pathway is enriched in LAB compared to PC.
Microbiolres 16 00136 g010
Figure 11. Relative abundance of the class of resistance for samples (n = 8/treatment) among treatments. LAB = Lactobacillus supplemented; SH challenged; NC = Negative Control (without any AA supplementation and non SH challenge); PC = Positive Control (without any AA supplementation but with SH challenge); PF = P. freudenreichii-supplemented, SH-challenged; VAC = Salmonella-vaccine-treated, SH-challenged.
Microbiolres 16 00136 g011
Figure 12. Relative abundance of resistance genes for samples (n = 8/treatments) among treatments. LAB = Lactobacillus supplemented, SH challenged; NC = Negative Control (without any AA supplementation and non-SH challenge); PC = Positive Control (without any AA supplementation but with SH challenge); PF = P. freudenreichii supplemented, SH challenged; VAC = Salmonella vaccine treated, SH challenged.
Microbiolres 16 00136 g012
Table 1. Differentially abundant species in antibiotic alternative treatments (AA); LAB (Lactobacillus supplemented, SH challenged), PF (P. freudenreichii supplemented, SH challenged), and VAC (Salmonella vaccine treated, SH challenged) compared to PC. The Dunnett test with PC as the reference was used to find differentially abundant species in treatments compared to PC. Mixed directional false discovery rate (mdFDR) was considered in the Dunnett test to control for the false discovery rate. Species were considered differentially abundant at q-value < 0.01. A positive lfc indicates an increase and a negative lfc indicate a decrease in the abundance of species in treatments compared to PC.
SpeciesTreatmentslfcq-Value
Limosilactobacillus gastricusLAB3.02<0.0001
PF2.960.0067
VAC3.60<0.0001
Lactobacillus sp. ESL0681LAB2.850.0003
PF3.190.0095
VAC3.51<0.0001
Weissella hellenicaLAB2.360.0011
PF2.810.0011
VAC3.800.0004
Pediococcus acidilacticiLAB1.93<0.0001
PF2.240.0086
VAC2.59<0.0001
Liquorilactobacillus maliLAB1.850.0006
PF2.280.0013
VAC2.51<0.0001
Massilia forsythiaeLAB−1.170.0013
PF−1.700.006
VAC−1.550.0022
Tsuneonella dongtanensisLAB−1.460.0002
PF−2.190.0009
VAC−1.650.0024
Disclaimer/Publisher’s Note: The statements, opinions and data contained in all publications are solely those of the individual author(s) and contributor(s) and not of MDPI and/or the editor(s). MDPI and/or the editor(s) disclaim responsibility for any injury to people or property resulting from any ideas, methods, instructions or products referred to in the content.

