1. Introduction
Quality Function Deployment (QFD) aims to satisfy customers (quality) by translating their needs into a design and ensuring that all organisational functions (function) systematically collaborate in measurable and controllable activities (deployment) [
1]. It is a method of product and service design [
2] that captures the voice of the customer and transforms it into design and operational characteristics that align with market demands.
Initially developed for new product design, QFD has evolved into a methodology that integrates marketing, engineering, and operations, contributing to activities such as quality management [
3]. It allows companies to respond more effectively to customer requirements by facilitating communication between departments, reducing costs, shortening development times, and enhancing competitive positioning.
In recent years, quality management has shifted its focus from production control to the proactive design of products based on customer needs. In this context, QFD becomes particularly relevant for industries undergoing technological transformation, such as the automotive sector, with the introduction of electric vehicles (EVs).
This study applies the QFD methodology to assess the potential integration of EVs into the Spanish automotive market. Although Spain currently has approximately one million EVs in circulation, this figure remains modest compared to the thirty-two million insured vehicles. Given the global drive towards sustainability and carbon neutrality, EVs play a critical role in reducing greenhouse gas emissions and promoting environmental protection.
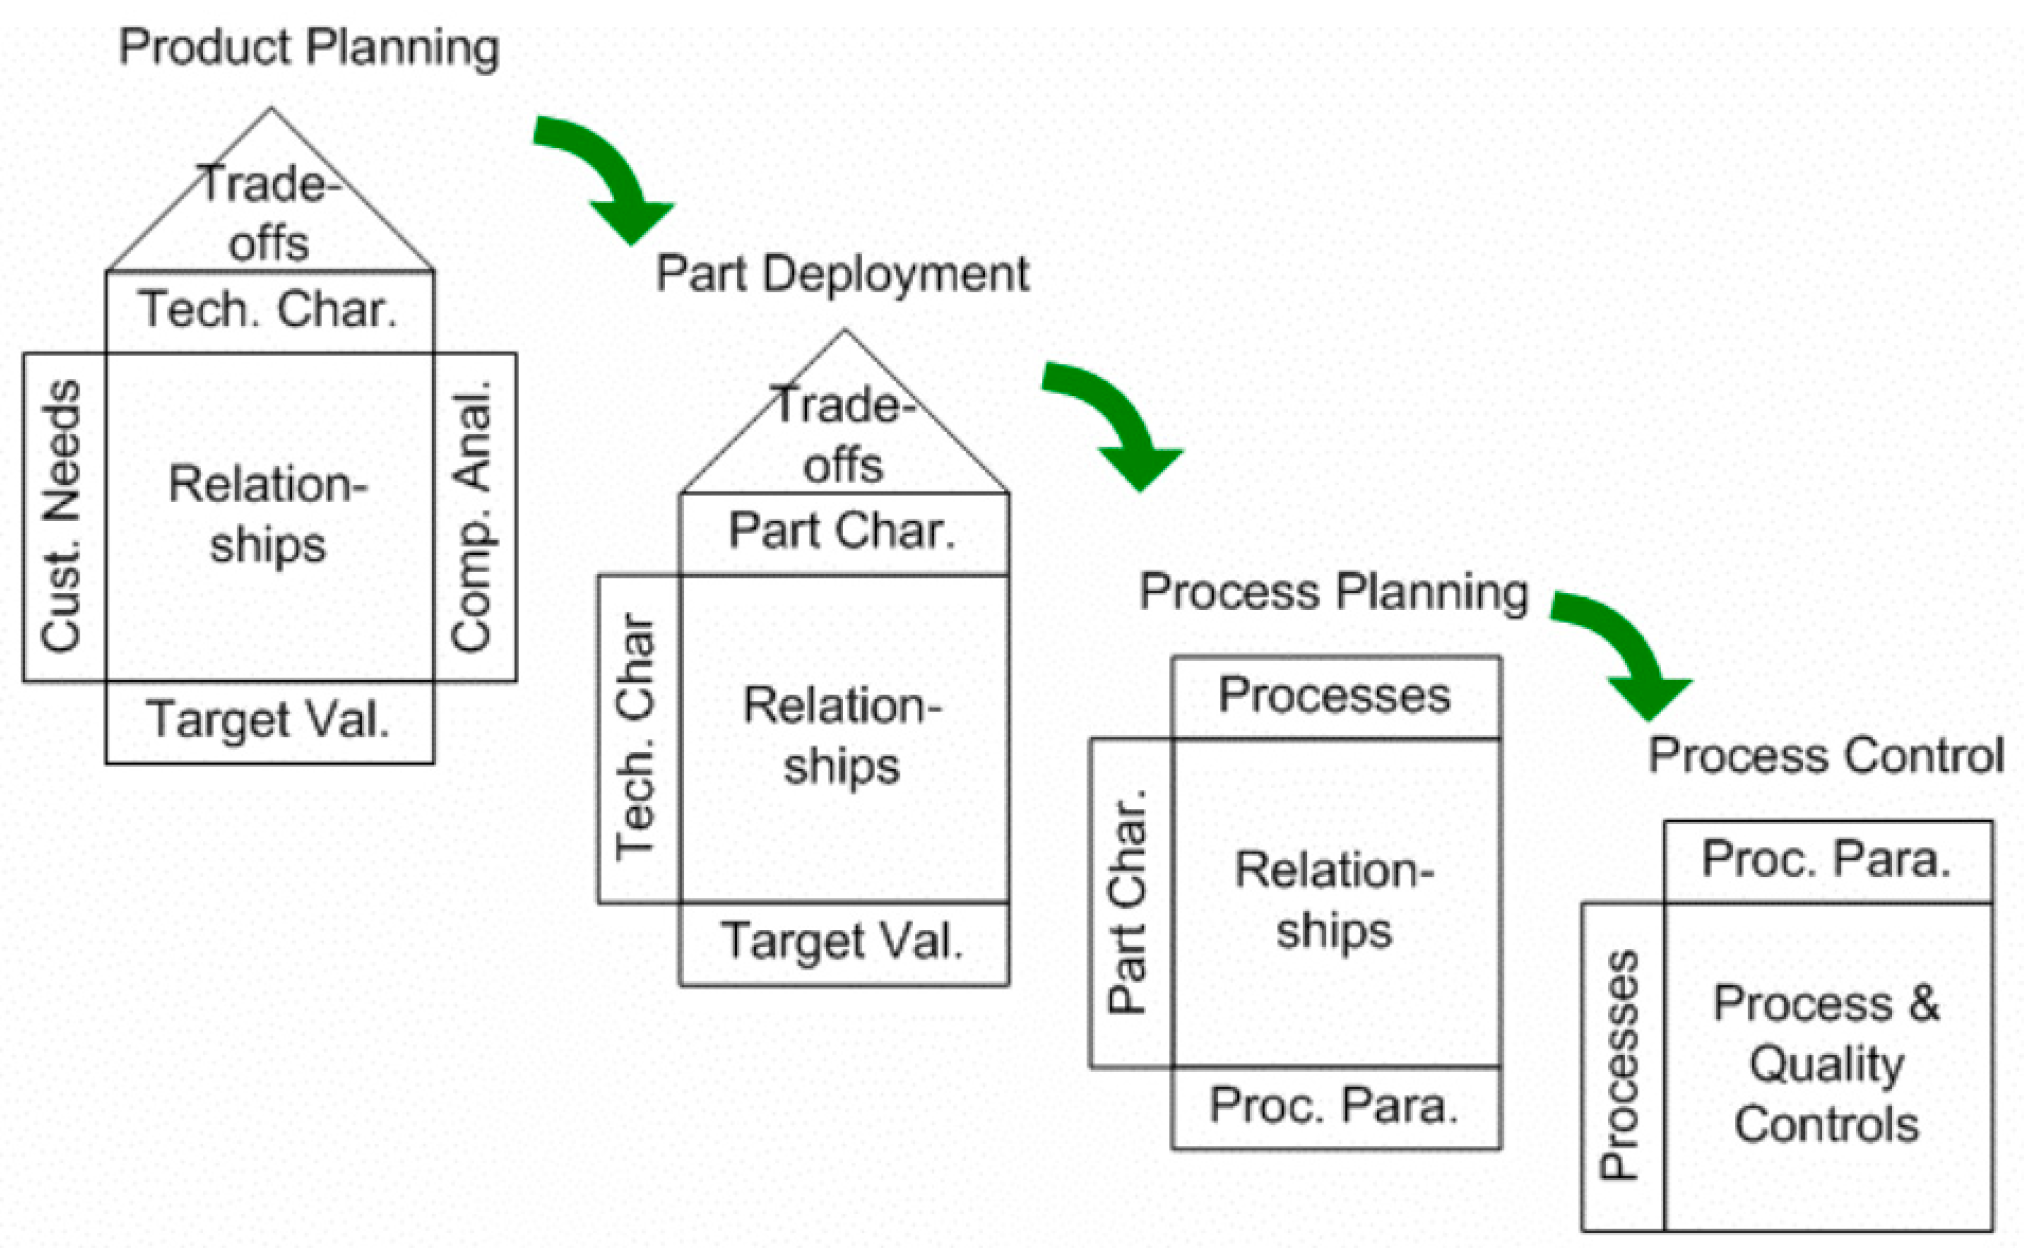
To understand customer expectations regarding EVs, surveys were conducted among engineering students at the University of Málaga, their faculty, and automotive professionals such as the instructors at the “Torcal” driving school in Málaga. The data collected form the basis for applying the first phase of the QFD methodology (
Figure 1) [
4], focusing on identifying customer needs and translating them into design and service requirements.
Ultimately, QFD provides a structured and systematic approach to translating customer preferences into product development strategies, making it an essential tool to support the broader adoption of electric vehicles in Spain. By aligning product offerings more closely with consumer expectations, manufacturers and service providers can foster a greater acceptance of EVs and contribute to achieving national and European sustainability goals.
2. Fundamentals
The concept of Quality Function Deployment (QFD) was introduced in Japan during the late 1960s by Dr. Yoji Akao, aiming to integrate critical quality points into the design and manufacturing phases [
5]. Drawing on the teachings of Deming, Juran, Feigenbaum, Ishikawa, Mizuno, and Kogure, QFD emerged within the Total Quality Control (TQC) movement that transformed Japanese manufacturing [
6]. Initially, QFD was intended to ensure that customer requirements were considered from the design stage [
1].
The formalisation of QFD occurred at Mitsubishi Heavy Industries’ Kobe shipyard in 1972, leading to the development of the quality matrix, which systematised the relationship between customer needs and product characteristics [
7]. Dr. Akao later introduced QFD to the United States through an article in
Quality Progress in 1973. In 1975, the Japan Society for Quality Control (JSQC) established a study committee that documented significant applications, including the reduction in initial quality problems, development costs, and time to market [
8].
Toyota’s implementation of QFD from 1977 onwards demonstrated its effectiveness, resulting in its adoption across various industries such as electronics, synthetic rubber, home appliances, and services. QFD expanded internationally, reaching the United States, Europe, Argentina, Brazil, Korea, and China, among others [
9]. It promoted a shift from a technology-driven (“product-out”) to a market-driven (“market-in”) development strategy, enhancing cross-functional communication between marketing and engineering departments [
10].
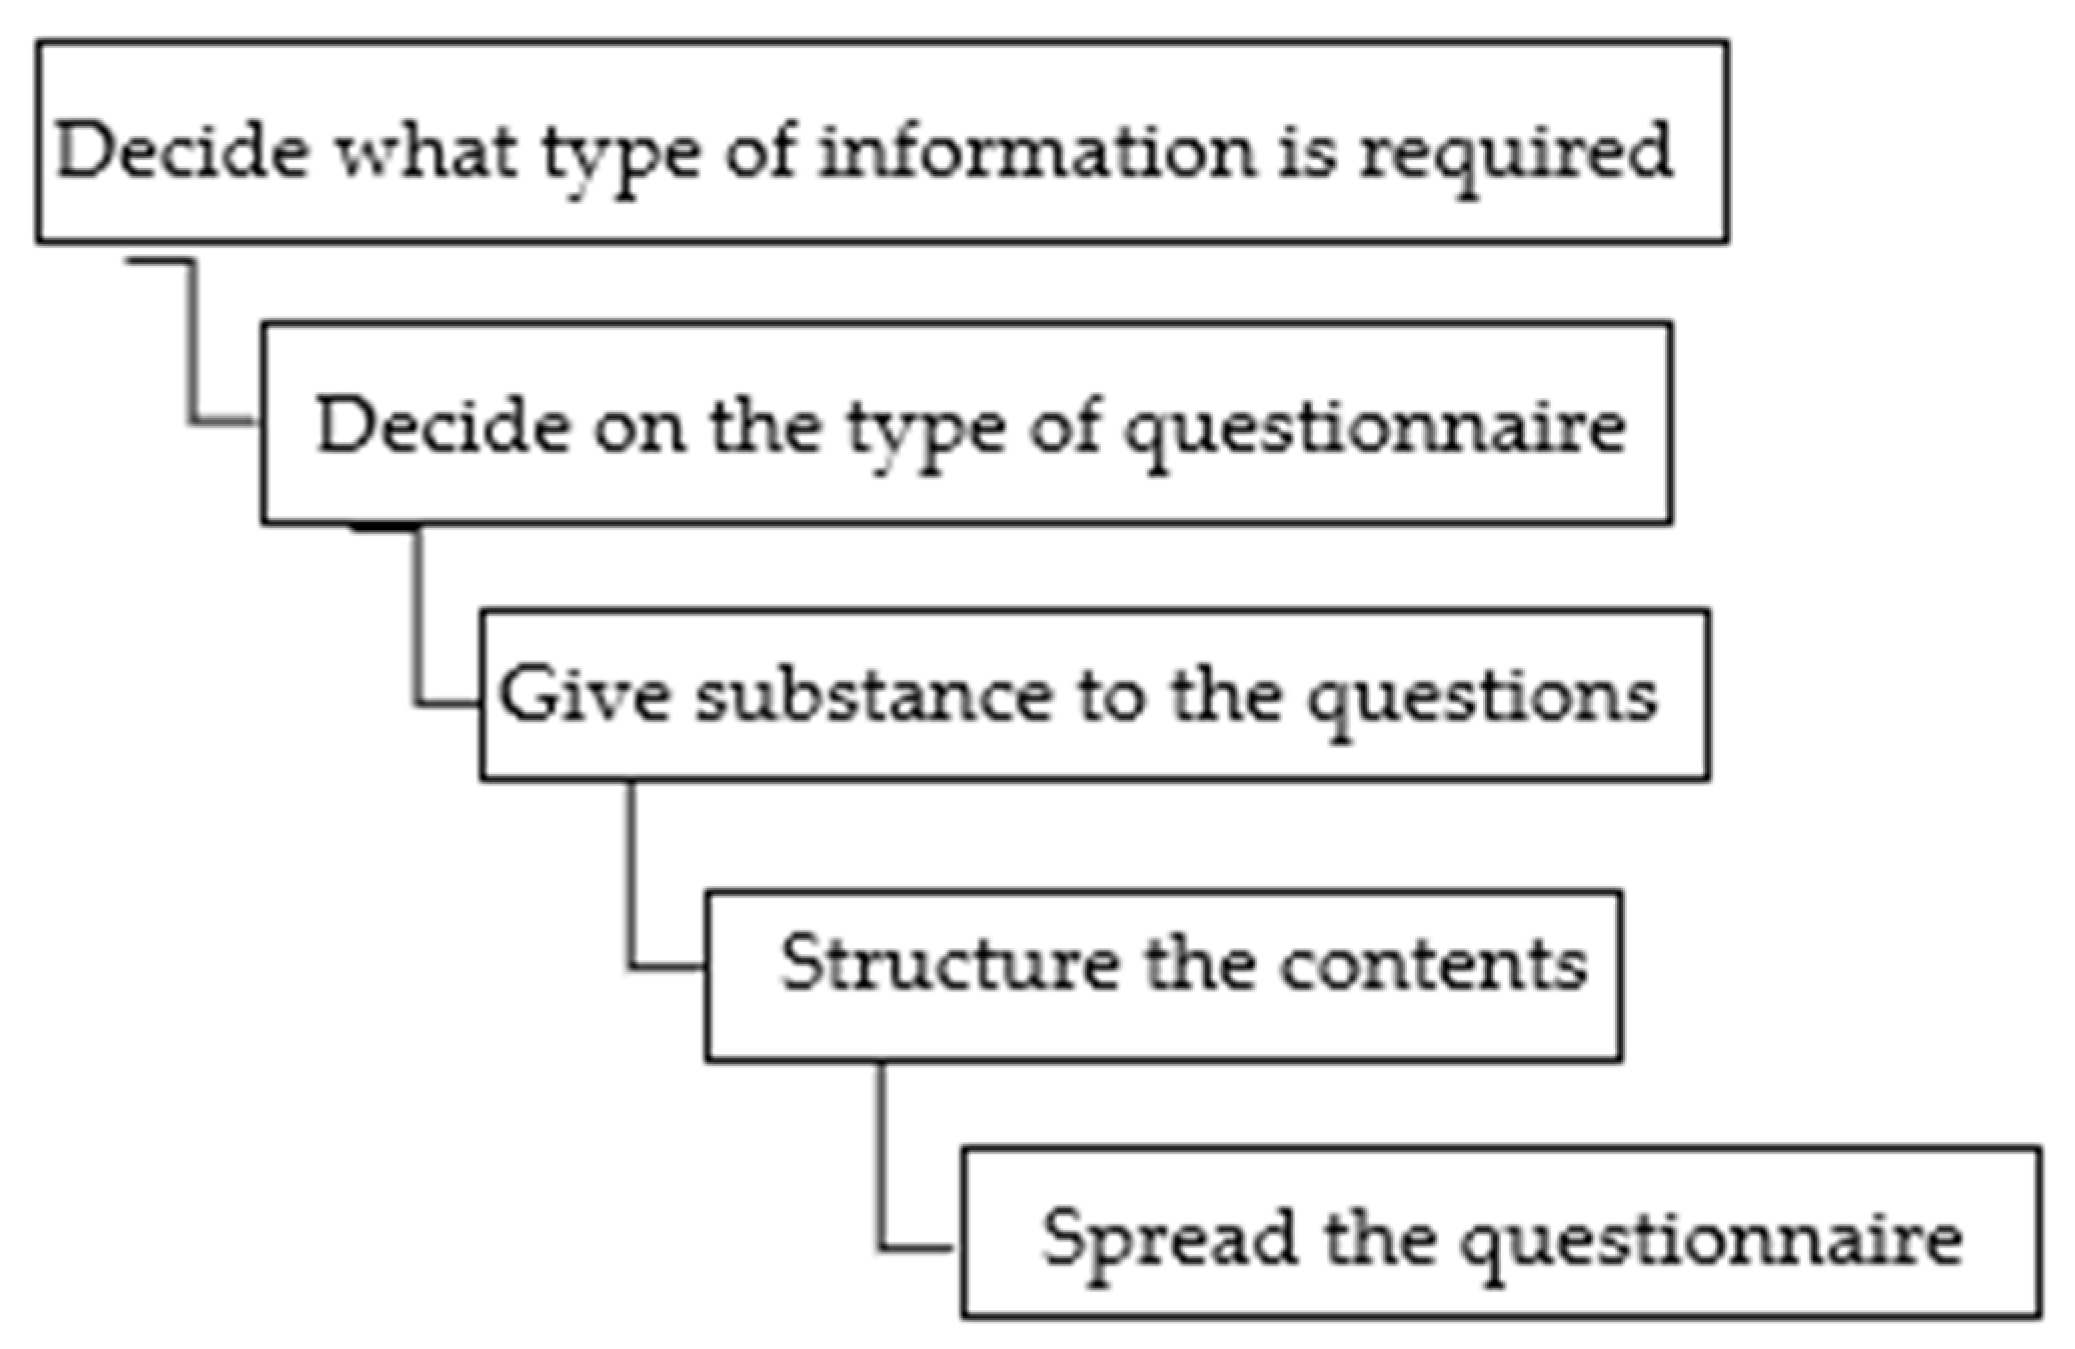
QFD’s evolution also paralleled advancements in customer-focused methodologies, particularly in collecting the “voice of the customer” through structured surveys [
11]. To gather this information, it is necessary to follow a series of phases (
Figure 2):
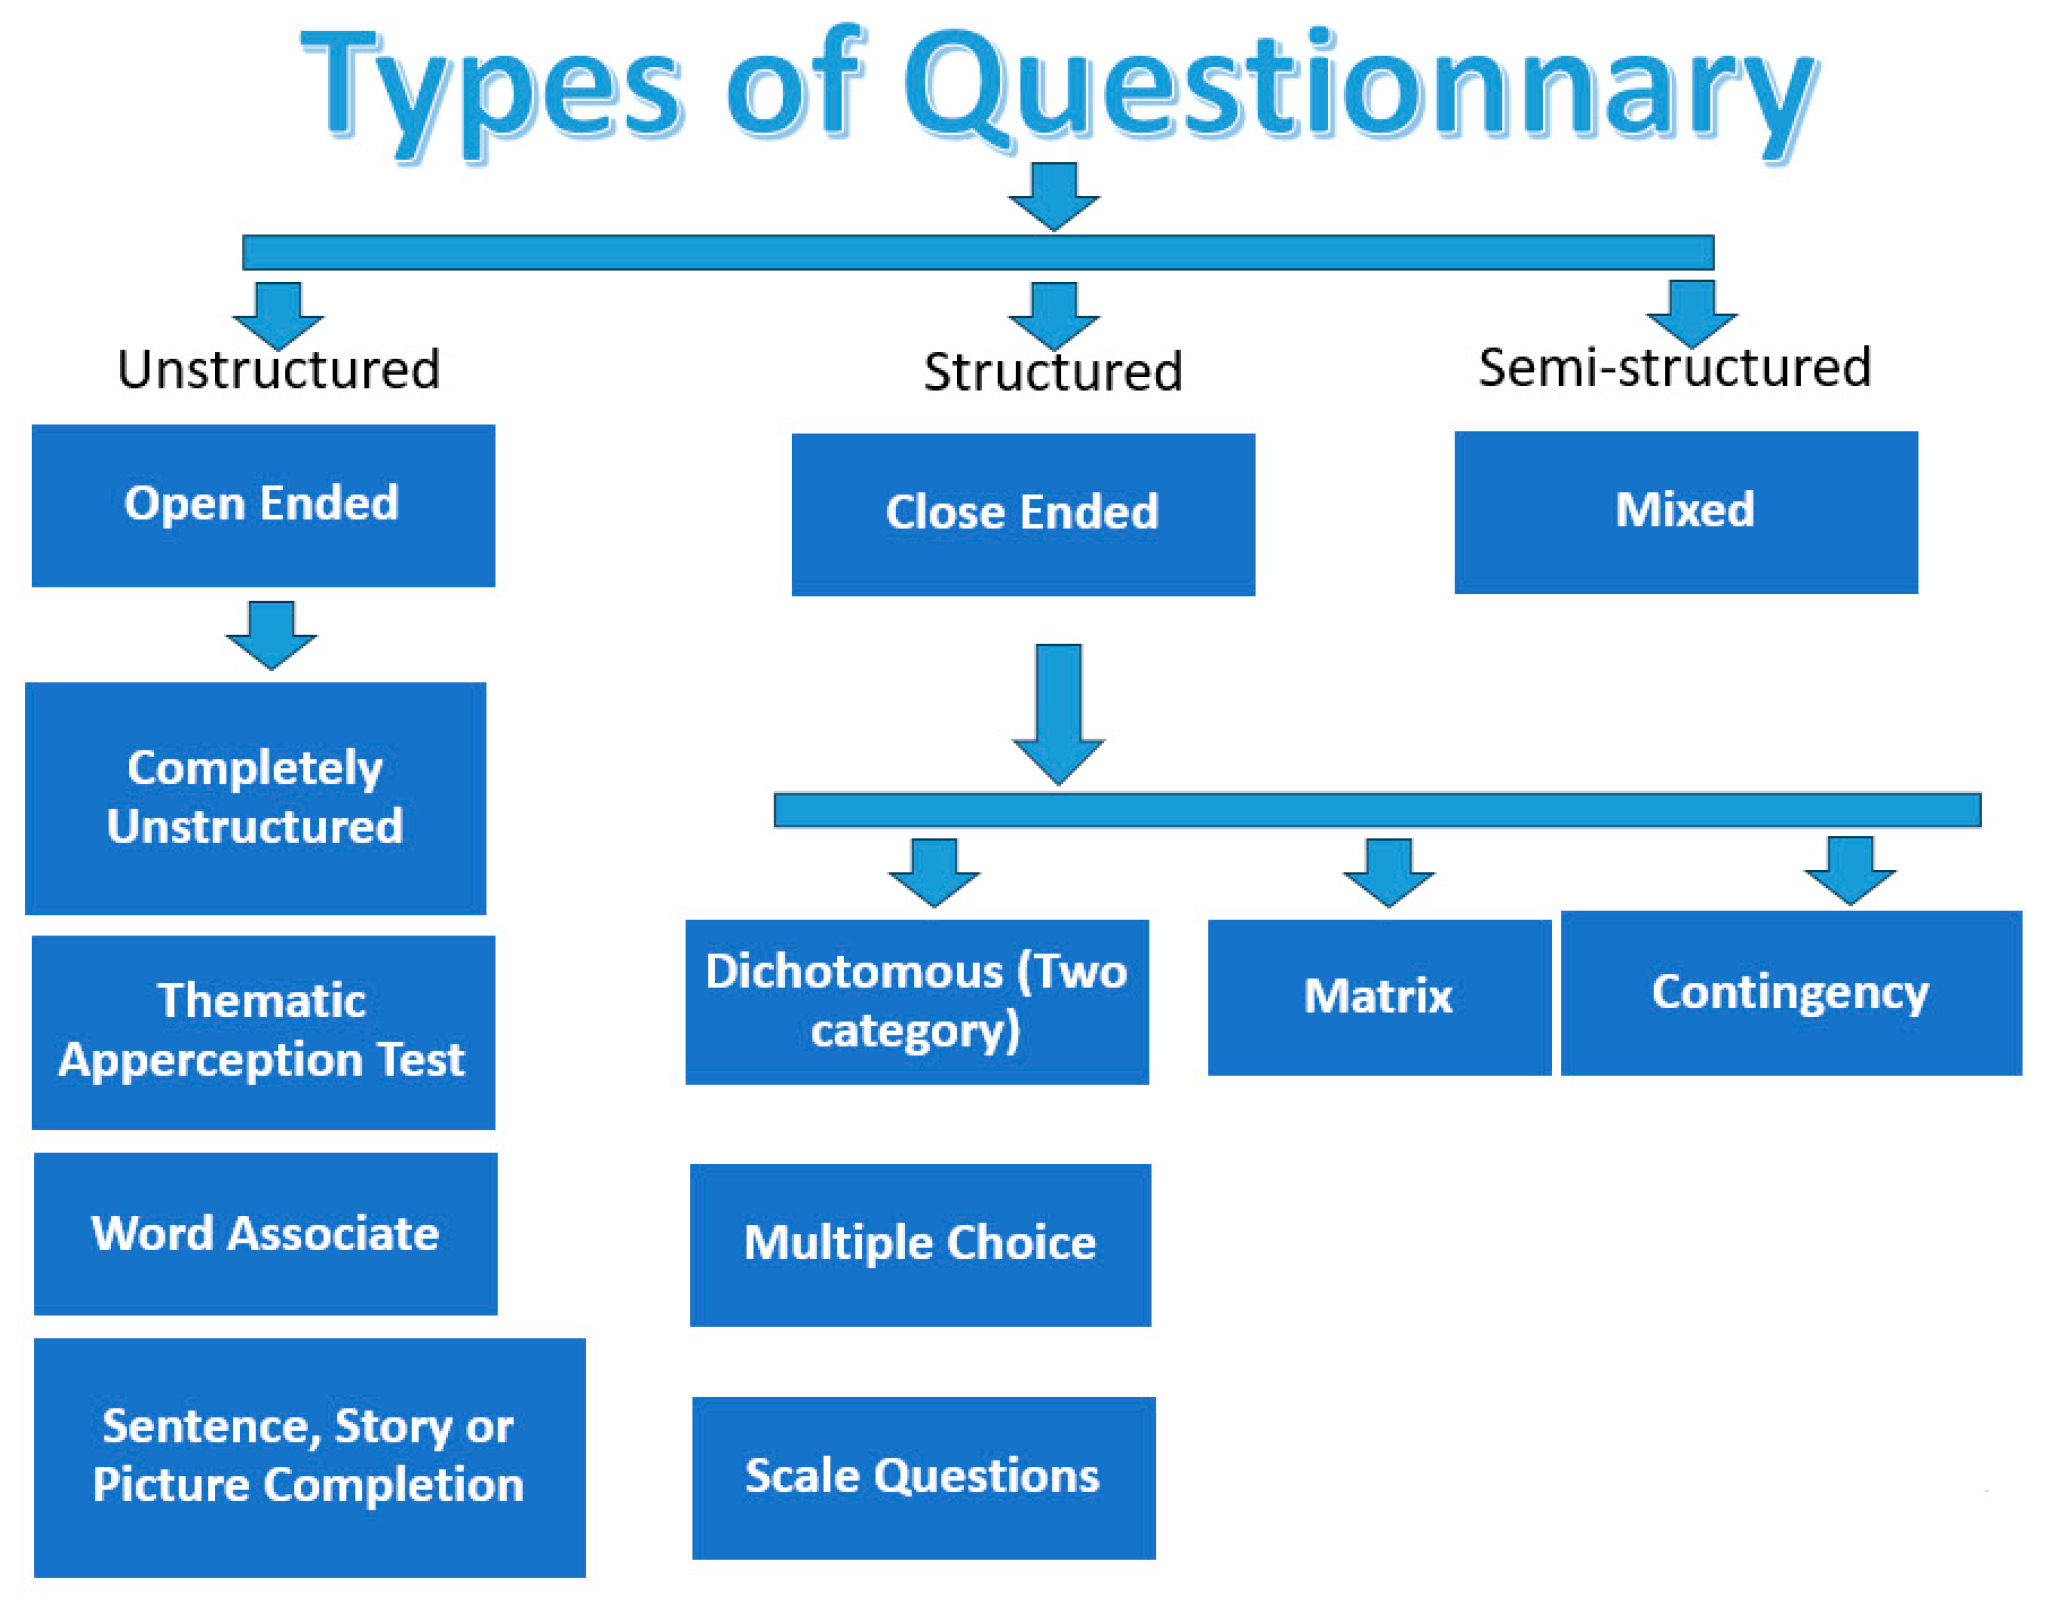
As shown in
Figure 3, several types of questionnaires exist; for this study, a closed questionnaire was selected due to its advantages in data quantification and analysis.
The development of the questionnaire content requires careful design, ensuring that questions are clear, simple, and appropriately coded for statistical processing.
Table 1 classifies different types of questions according to criteria such as freedom of response, number of options, purpose, and formulation method.
The different types of questions are as follows:
Open questions: The interviewee can answer freely.
Closed questions: In these questions, the answer alternatives are limited to the possible answers.
Semi-closed questions: They provide closed answer alternatives and also leave the possibility for the respondent to answer any of the questions freely.
Dichotomous questions: When the respondent can only answer yes or no.
Multiple choice questions: When the respondent can choose one of several optional answers.
Battery questions: These are questions that are asked one after the other, in such a way that the answer to the first question conditions the answer to the second.
Filter questions: These are questions whose answer excludes the formulation of others.
Control questions: They are used to verify the coherence and veracity of previous answers.
Direct questions: They are formulated to obtain direct answers without beating around the bush.
Indirect questions: They are formulated in this way because it would be more difficult to obtain an answer otherwise.
To determine the sample size for the survey, statistical methods such as Cochran’s formula are applied, ensuring the sample’s representativeness [
9].
where
would be equal to 30%;
(corresponds to the value assigned in the normal curve table, assuming a confidence level for the study of 95%);
(equivalent to the estimation error with respect to the mean assumed with a value of 15%); and a margin of non-response to the survey of around 20% is considered. Thus, the minimum number of people to survey would be 300 people.
Finally, questionnaires must be carefully checked for errors or omissions before analysis, recognising that a permissible margin of error is inherent in survey-based research.
Having laid out the theoretical foundations and historical evolution of the QFD methodology, including the importance of tools such as the Kano model and structured questionnaires, we now move towards its practical application. The following sections will detail how QFD is implemented in the context of electric vehicle deployment through the collection and analysis of user expectations.
3. Methodology
The first action to be taken is the collection, analysis, and processing of customer expectations [
12]. This is why this stage concerns market research and the examination of the environment. Its purpose is to get to know the customer, listen to them, and collect their expectations.
First of all, in order to correctly identify their expectations, it is necessary to know these customers. You have to start by identifying them and getting to know them well. This means knowing all the customers, their professions, their working habits, their usual practices, their constraints, the evolution of their environment, what they want to do, and where they want to go.
There are several ways to capture the voice of the customer, e.g., by collecting existing customer information, selecting a representative sample of the market with the objective of conducting targeted research, etc.
It should be borne in mind that market research is the most expensive in terms of cost, time, and dedication, but it is the most effective and will give us the clearest idea of the needs and tastes of the market.
The diversity of customers and their expectations requires a new operation, the hierarchisation of customers. Indeed, for obvious economic reasons for the company and the customer, the company cannot multiply, beyond a certain limit, the number of versions of the same product in order to personalise it or adapt it as well as possible to the customer’s expectations. To do so, it has no choice but to rank its customers. The criterion adopted for this classification may be economic and/or strategic. This is why the degree of importance or the weight of each customer class is defined.
However, the identification and recording of the customer’s expectations are two equally necessary operations. It should be noted immediately that these operations are extremely complex and can be costly. Moreover, the methods and tools currently available for collecting these expectations are very limited. This means that it might be advisable to reduce commercial efforts in favour of tasks further up the chain, in particular, the knowledge of the customer and the display of their expectations.
In order to establish an exhaustive list of these expectations, marketing, with the collaboration of the other functions of the company, has to collect those other characteristics that the customer has not expressly requested but that are necessary or advisable to guarantee, such as those that the customer expects to find implicitly and without asking for them, those required by standards and regulations, the strong points that characterise the product and distinguish it from the products of the competition, etc.
The list of expectations will never be complete without a functional analysis of the product. Indeed, the number of functions identified by the functional analysis and that must be taken into account from the outset to avoid quality problems is often higher than the number of functions required by the customer and identified by the product specification or by the design without the functional analysis. This work assumes the following [
6]:
Good knowledge of the market needs and market developments.
Good knowledge of the competition.
Working in multidisciplinary teams: marketing, sales, strategy, research, manufacturing, after-sales service, etc.
Significant time and investment.
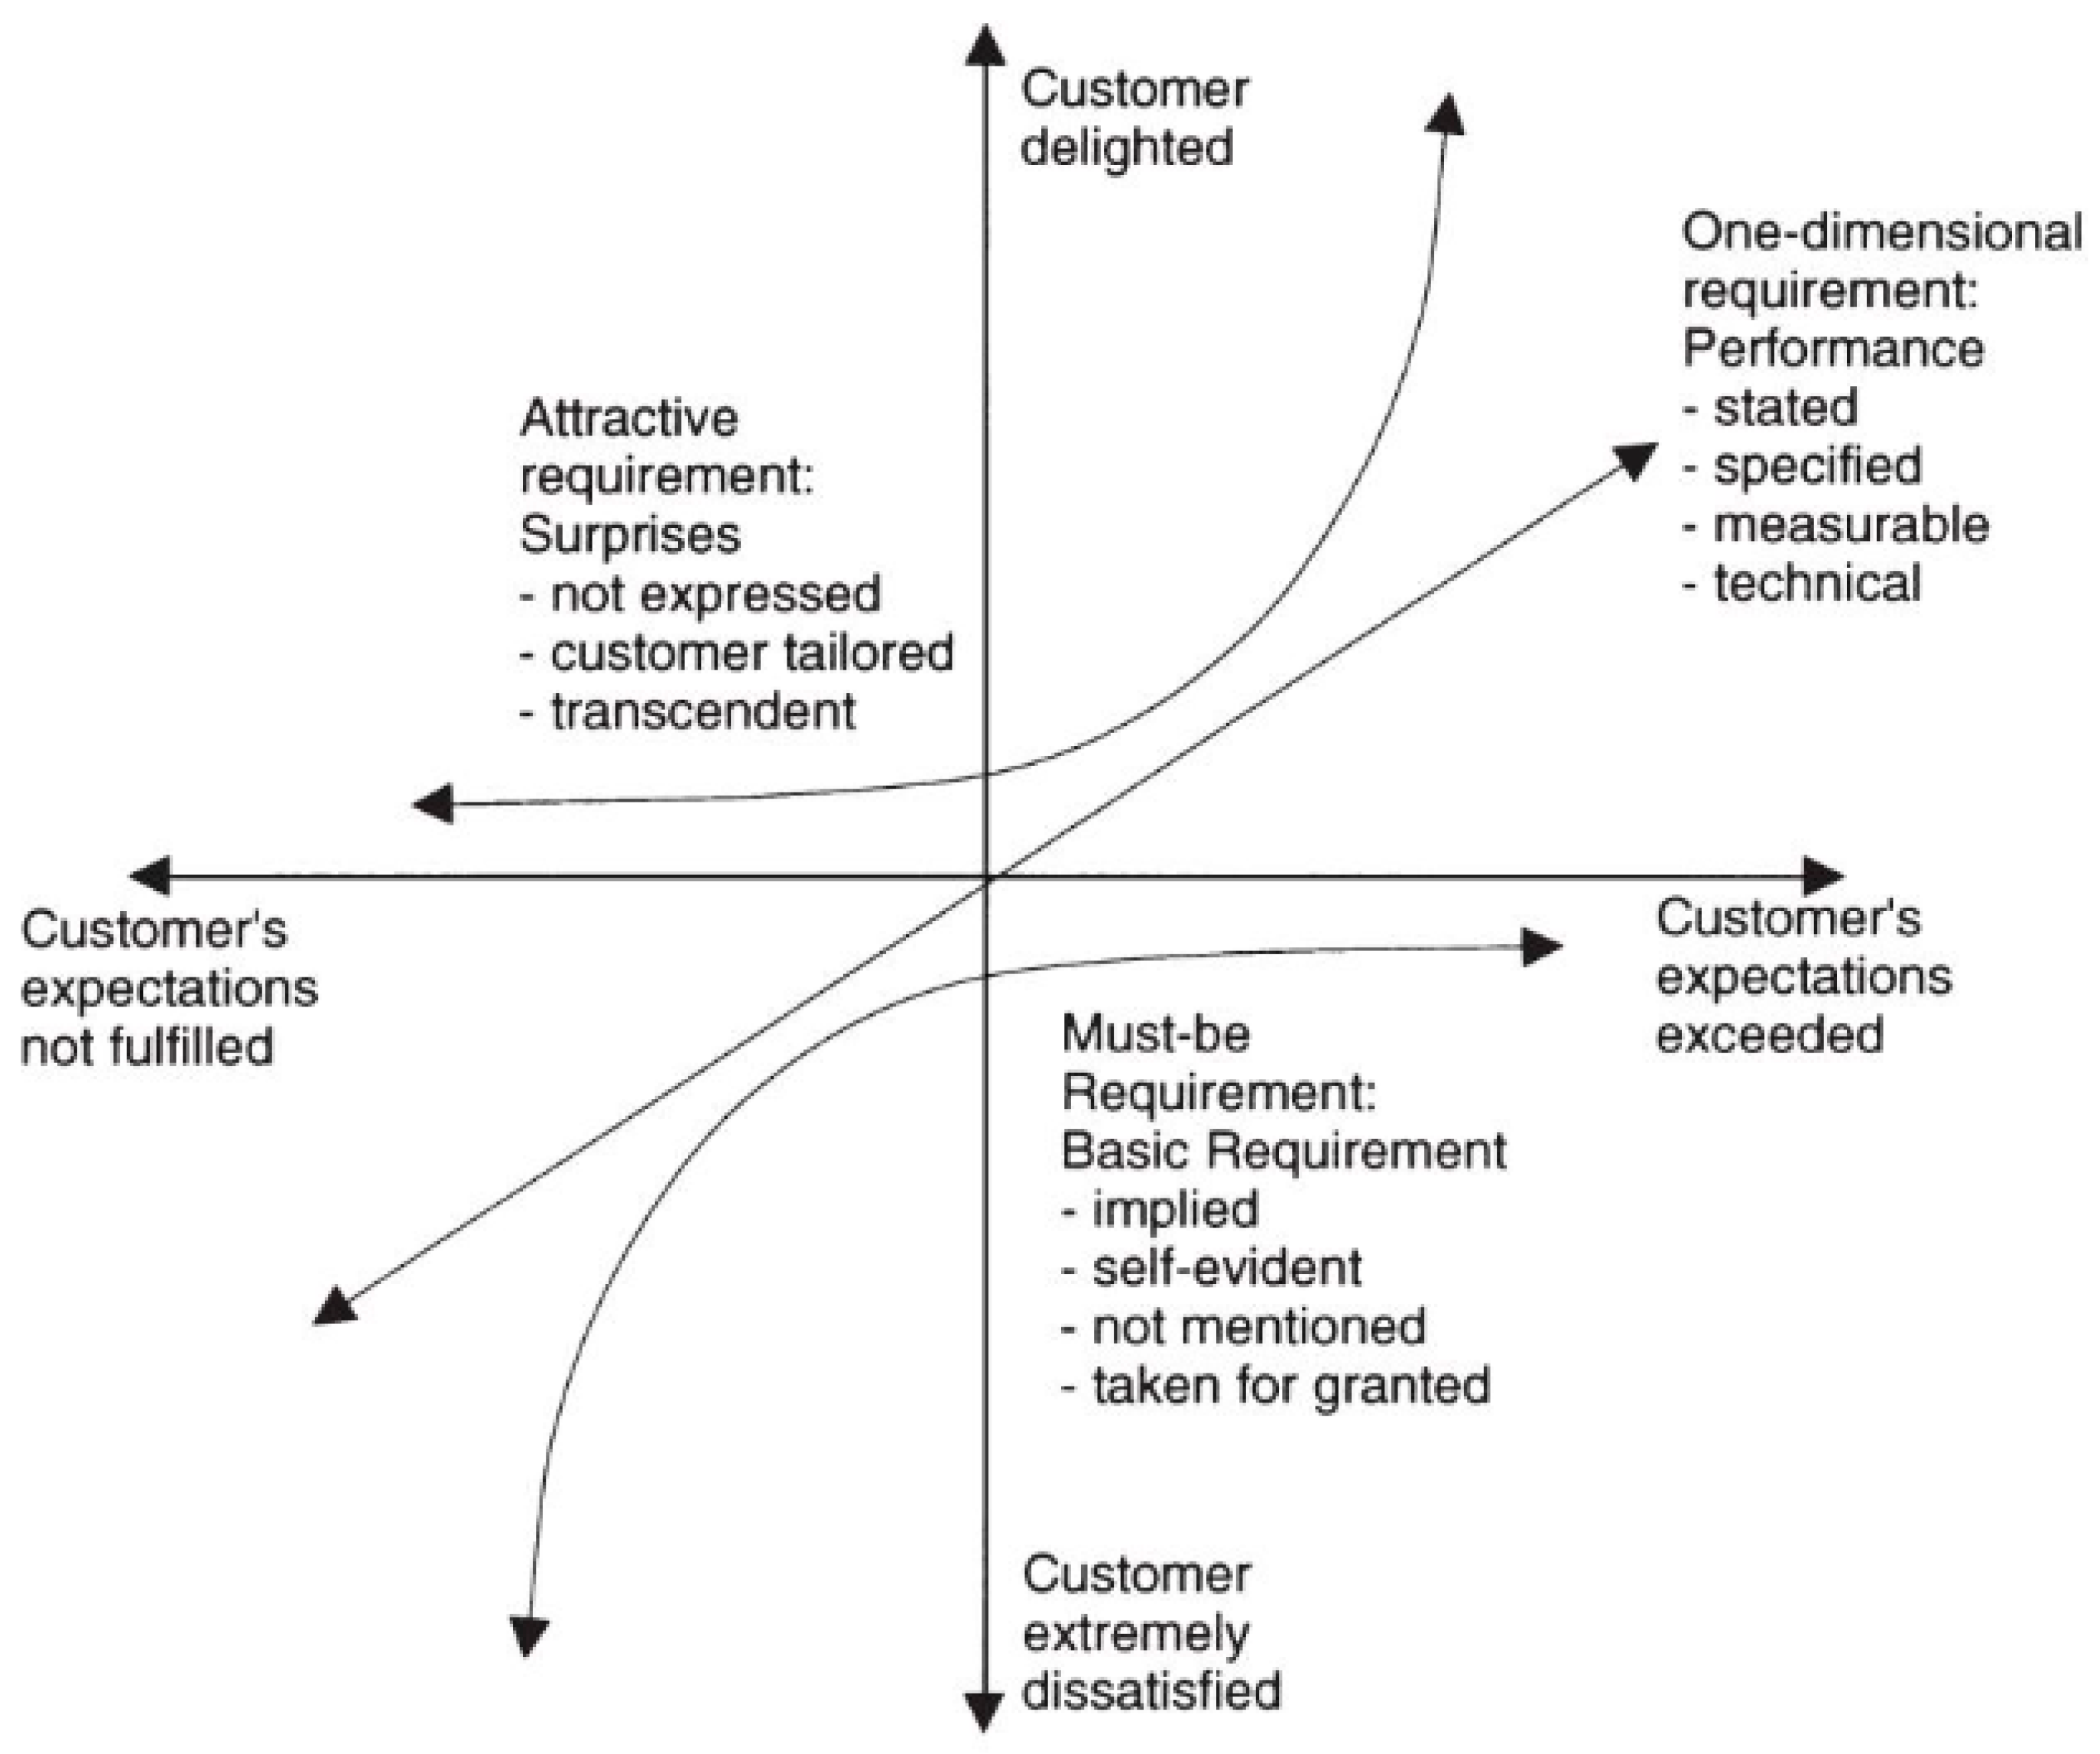
The Kano model makes it possible to extract the needs that cannot be determined from a direct analysis or that are not mentioned. This tool makes it possible to classify user demands according to the degree of relevance in their satisfaction.
The idea proposed by Noriaki Kano (
Figure 3) is to distinguish three types of quality or performance characteristics of a product [
4]:
Expected quality: The characteristics that the customer always expects from the product and would be very dissatisfied if he/she did not find them.
Improvable quality: The characteristics that provide greater user satisfaction the higher their level of appearance or development in the product, and vice versa, but which are not particularly significant in the performance of the product.
Quality of over-satisfaction: Features that are unexpected by the user but which, if found, provide high user satisfaction.
Therefore, the Kano model (
Figure 4) is applied through a questionnaire where each attribute or requirement under analysis is evaluated with the opinions of the users, in the cases that it is present and not present, in order to determine the degree of satisfaction or dissatisfaction that it generates [
13].
Once the list of customer expectations has been obtained, it is necessary to prioritise the homogeneous list previously established. In recent years, researchers have explored enhanced approaches to QFD by integrating it with multi-criteria decision-making techniques, such as hesitant fuzzy logic, particularly in the context of electric vehicle design and development [
14]. To do this, two criteria must be considered. The first is the relative importance of each characteristic for each type of customer, and the second is the relative importance of each type of customer for the company.
Each type of customer gives each characteristic a rating according to its importance, from 1 to 5 or any other appropriate but simple scale. Of course, these ratings represent averages. To calculate the weight of each expectation, these ratings are weighted by the weight of each customer. This is an optimisation operation whose objective is, on the one hand, to better match the product to the customer’s expectations and, on the other hand, to optimise efforts and costs.
It can be seen that the hierarchical list of customer expectations is the most important document in the QFD method, since it is from this list, which constitutes the raw material, that all the company’s plans, commitments, options, and actions will be drawn up.
This is why this first stage is the most difficult for most staff to understand and the least equipped with quality tools.
The second stage is based on the results of the previous stage, i.e., the list of customer expectations. This is then the stage of defining the product in terms of service functions, which is called the “house of quality” [
7].
The QFD methodology requires the development of matrices, and in these matrices, the list of customer expectations is known as the WHATs. The client’s expectations and, more generally, the objectives pursued by a project are, in effect, the WHATs to which a response must be given.
These WHATs become part of the matrix horizontally, on the left side (wall) (see
Figure 4); but before starting to work with the requirements, it is necessary to filter this information and go deeper into what the client wants to tell us with their words in order to try to identify the real need for the required product.
Having the list of the WHATs (the expectations) is all well and good, but the more important question that is not asked as much as it should be, or at least not systematically, is: HOW to realise those WHATs? This is achieved by using a number of manageable elementary characteristics that constitute the HOW.
To be rigorous, it is necessary to identify, for each of the WHATs, the corresponding HOW(s) [
5]. This process of translation, or deployment, must be continued until one or more operational and manageable HOWs are obtained for each initial WHAT. This is the meaning of the word deployment in the phrase “Quality Function Deployment”. QFD is thus based on this principle of translation. It is a fundamental principle of Quality Assurance: to ensure that the objectives (the WHATs) are met, the necessary means (the HOWs) are identified and activated. This is a logical and rigorous way of acting, but it constitutes a break with our usual working methods: we know more or less what needs to be achieved (the WHATs), we execute it and then control it, but we never pay attention to the necessary means (the HOWs) [
15].
The complexity of the overlaps between the WHATs and the HOWs makes the advantages of the representation of the data in the form of lists, and above all, of the annotation of the weight of each WHAT disappear, a weight that could easily be found if only one HOW corresponded to each given WHAT.
In order to avoid the difficulties mentioned above and to be able to appreciate the relative weight of the WHATs that have been determined, it is necessary to move from the one-dimensional representation of the data (lists) to the two-dimensional representation (correlation matrix).
In this matrix (
Figure 5), as in all those used in the QFD methodology, the rows correspond to the QUES and the columns to the HOWs by convention. In order to represent. in these matrices, the relationships between the WHATs and the HOWs previously determined [
15], (simple) symbols are used, as shown in
Table 2.
The use of matrices and the representation of relationships through symbols facilitate the understanding and detection of the multiple and complex relationships that can exist between the different WHATs and the different HOWs.
Distinguishing the degree of correlation—strong, medium, or weak—makes it possible to identify the most important HOWs. In fact, it makes it possible to rank the HOWs according to the respective weights of the corresponding WHATs.
Completing a correlation matrix is not always an easy operation [
16]. Indeed, while it is relatively easy to identify the HOWs relating to a WHAT, it is often difficult to know whether it is a strong correlation, a medium correlation, or a weak correlation. Since QFD does not provide any answers to such questions, one has to resort to the usual techniques: people’s knowledge and experience, group work, and experimental designs.
The ranking scale of correlations and the corresponding scores used in the case of
Table 1 are not unique [
17]; they are the ones used in this paper to make the correlations. It can be extended or shortened without losing sight of what is intended by these figures, namely the following:
Do not disregard or silence an important WHAT.
Do not waste efforts on unimportant WHATs.
Simplify, which is a source of efficiency.
This is an extremely simple, exhaustive, and powerful means of checking that all customer expectations are correctly taken into account and that, on the other hand, not too much effort is devoted to those features that are of little or no interest to customers. It is necessary to be aware that the costs generated by work performed on false problems are by far higher than the costs generated by work performed badly but related to real problems.
There is an important particular case: the one in which all the correlation symbols are located on the same diagonal of the matrix, as in
Figure 6. In this case, each WHAT corresponds to one and only one HOW. This means that there are neither interactions nor dependencies between the different LIKEs. It is a suitable case because it is easy to deal with, but such a situation is not to be trusted. Indeed, systems are generally so complex that it is very rare to find this kind of case.
The purpose of distinguishing between various levels of correlation and weighting them is to be able to prioritise the HOWs [
18]. The aim is to ensure that when moving from WHAT to HOW, i.e., from expectations to the corresponding substitute characteristics, the hierarchy of the WHATs is not overlooked. In this way, the priorities from the customer’s point of view and the company’s strategy will be respected.
The principle of the calculation is the same as that used in the ranking of the customer’s expectations carried out in the first stage. For each HOW, each symbol is replaced by its value, multiplied by the weight of the corresponding WHAT, and all the results thus obtained are added up. In this way, the list of HOWs is absolutely identical in its approximations (and errors) to the hierarchical list of customer expectations.
There are no distortions or filtering of the “voice of the customer” and there are no parasitic features that are born as the development cycle progresses.
If this mechanism is applied to each deployment, one can be sure, as sure as one can be, that the customer’s expectations and the company’s strategy reach the designer and the operator, i.e., those who have to actually make the product, without deformation and without parasitic elements.
It is also possible to graphically represent the weight of each HOW, which makes it possible to immediately detect which are the most important HOWs and which should be prioritised. Since the same WHAT can be translated into several HOWs and the same HOW can come from several WHATs, the order of importance of the HOWs often comes as a surprise to everyone. It is possible to discover that a previously disregarded HOW has great weight and that, on the other hand, a previously considered very important HOW has in reality only insignificant weight in the customer’s expectations.
The different HOWs are the elements and/or subsets of the same system. They are rarely independent of each other, and it is interesting to analyse the possible relationships between them. For this purpose, a matrix is built on the HOWs, called the “ceiling”, from which the name “house” of quality is derived. This ceiling shows the direction and degree of the correlation between the different HOWs, which are examined two by two in succession.
Table 3 shows the symbology used in this “ceiling”.
The usefulness of this “ceiling” is to serve as an extremely simple, useful, and effective support for analysis and decision making. In particular, it makes it possible to identify redundancies and conflicts. The “ceiling” thus serves as an instrument for verification and also for improvement.
4. Preparation of the Survey
To effectively implement the QFD methodology, it is essential to begin by capturing the voice of the customer, which forms the foundation for identifying the most relevant user requirements (WHATs). In the context of electric vehicle (EV) deployment, these needs are often diverse and influenced by technological, economic, and behavioural factors. Therefore, a carefully designed survey is a practical and systematic tool to collect quantifiable customer insights that can be directly translated into design and service priorities within the QFD framework.
This phase bridges the gap between the theoretical foundations of QFD and its practical application. The collected survey data not only represent customer preferences but are also statistically processed and weighted to determine their relative importance. These weights are then incorporated into the QFD matrix to prioritise design improvements (HOWs) that respond to the most significant user expectations.
By integrating this preliminary data collection stage into the overall QFD process, the methodology ensures that the development of EV-related solutions is rooted in real-world user feedback. This connection between empirical input and structured analysis enhances the reliability and customer orientation of the proposed product or service improvements.
In order to carry out the survey [
19], the different existing information on EVs was researched, and the data were analysed in order to adjust the questionnaire to the characteristics of the study. This questionnaire was carried out in closed form, as this was the most appropriate for the application of this study.
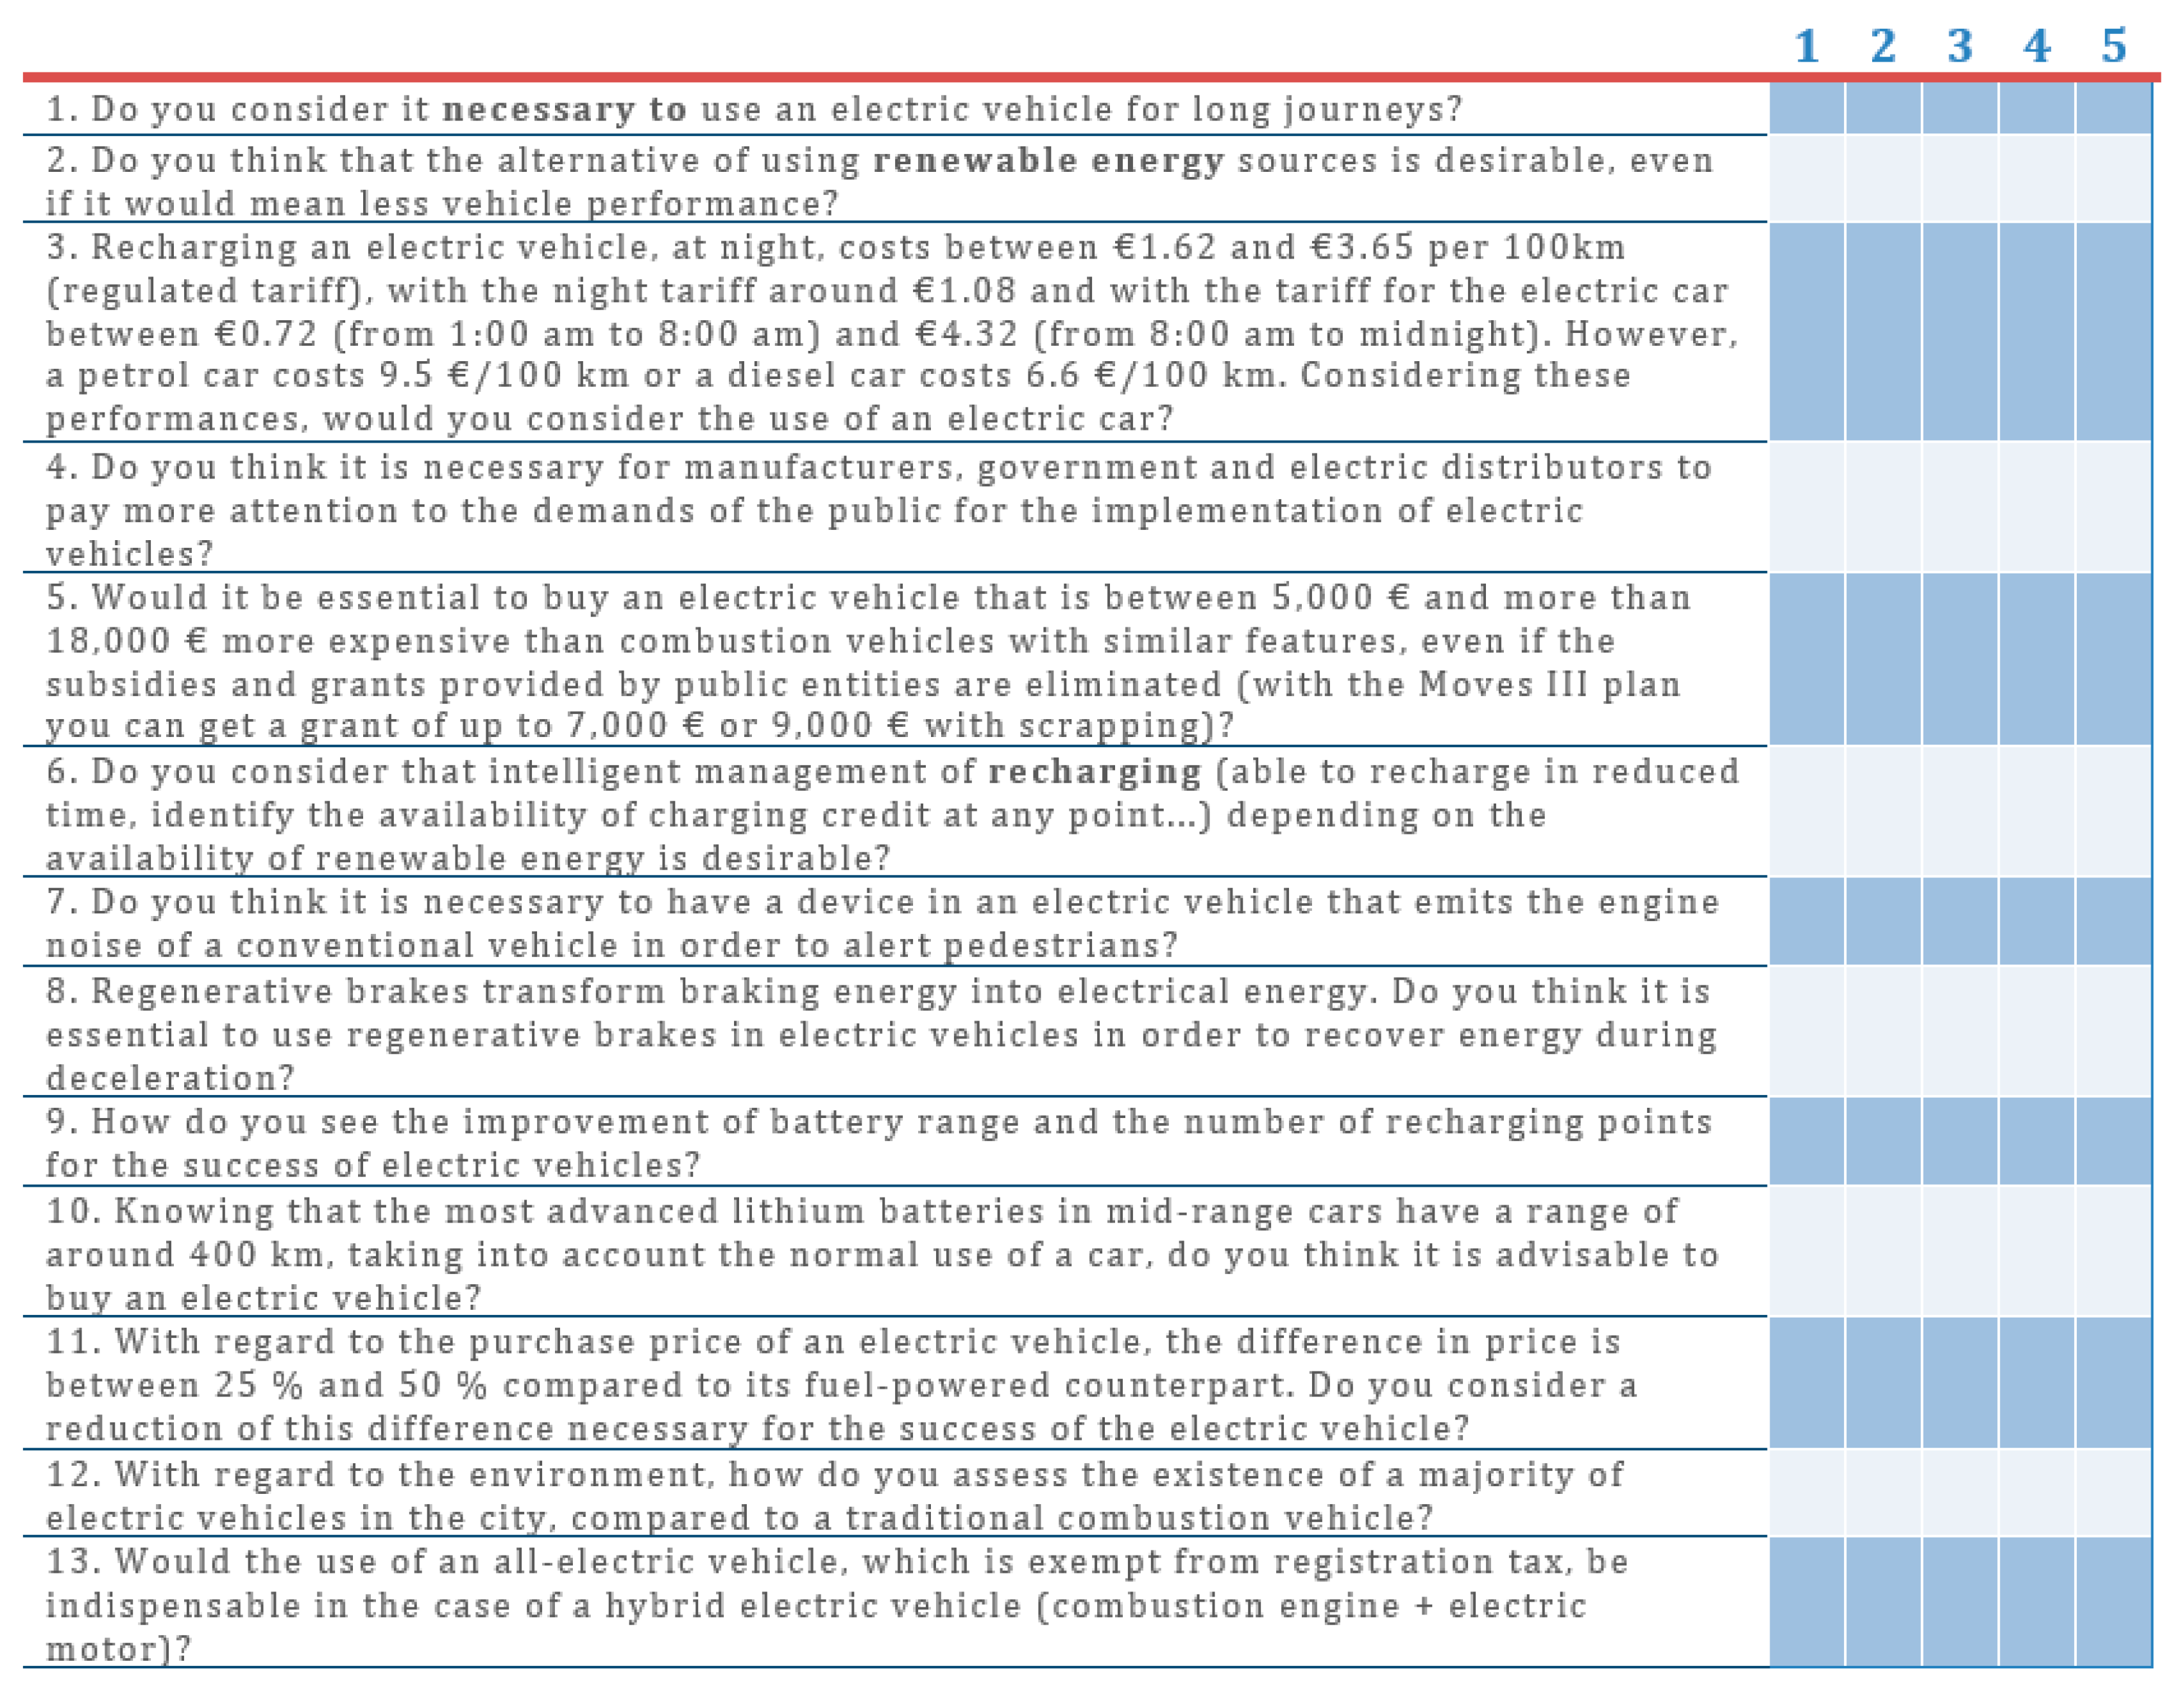
The type of questions chosen were closed questions, as can be seen in
Figure 3, in which the respondent marks one of the alternatives offered (see
Table 4 and
Table 5). This type of question was chosen because it can be answered quickly, is comfortable for the respondents, and does not make them think too much, and it is less tiring to answer than open questions.
The questionnaire (
Figure 7 and
Figure 8) should meet the following requirements: it should be short, clear, interesting, simple, attractive, precise, concrete, etc. Therefore, the questions in the questionnaire should be formulated using clear language, understandable by the respondents, not including words that are too technical, which could make the respondent feel “inferior” and predispose him/her to answer wrongly or even to refuse. Therefore, in questions where technical words are included, which could put respondents in the situation described above, the meanings of these words are explained in the question itself.
It should not be forgotten that the questionnaire should be composed of few questions, i.e., no more than 30 questions. This is why the questionnaire is composed of 20 questions on EVs.
The first 13 questions are coded differently from the others, as can be seen in
Table 4. In addition, for questions where technical words have been included, in which respondents could find themselves in the situation described above, the meanings of these words have been explained in the same question.
However, the remaining seven questions (see
Figure 8) are coded with a different meaning than the first thirteen due to the wording of the questions (see
Table 5).
The survey header (see
Figure 9) is defined by a series of questions that define the composition of the sample, such as identification questions (age, sex, and level of education) and factual questions (referring to specific events): Do you own your own car? Do you use public transport?
The formulation of the questionnaire is fundamental to the development of the research, which is why it has been meticulously designed and checked before being passed on to the representative sample of the population.
In this case, a non-random sampling method was used due to the lack of time to carry out the study. The sampling unit (see
Table 6) is defined by three significant groups of the population: the students at the School of Engineering of the University of Malaga, the teaching staff at this school, and the professionals at the “Torcal” driving schools in this province.
For statistical data to be highly reliable, the number of respondents should be between 500 and 600 people. Therefore, a total of 525 surveys were finally obtained. The student surveys are divided as reported in
Table 7.
As can be seen, the largest group is that of students, due to the fact that different types of students were chosen, as indicated in the table above, in order to have a variety of different ages and different specialisations in their studies.
Once the questionnaires are completed, the next step is to count the responses. In our case, having coded the answers beforehand, we only had numerical values, so these were entered into an Excel sheet.
Once the composition of the sample is known, its representativeness can be assessed, thanks to the characterisation questions in the heading of the questionnaire. It should be noted that the group of students is the largest group in the sample of the surveyed population, so this will have a great impact on the representation of the sample.
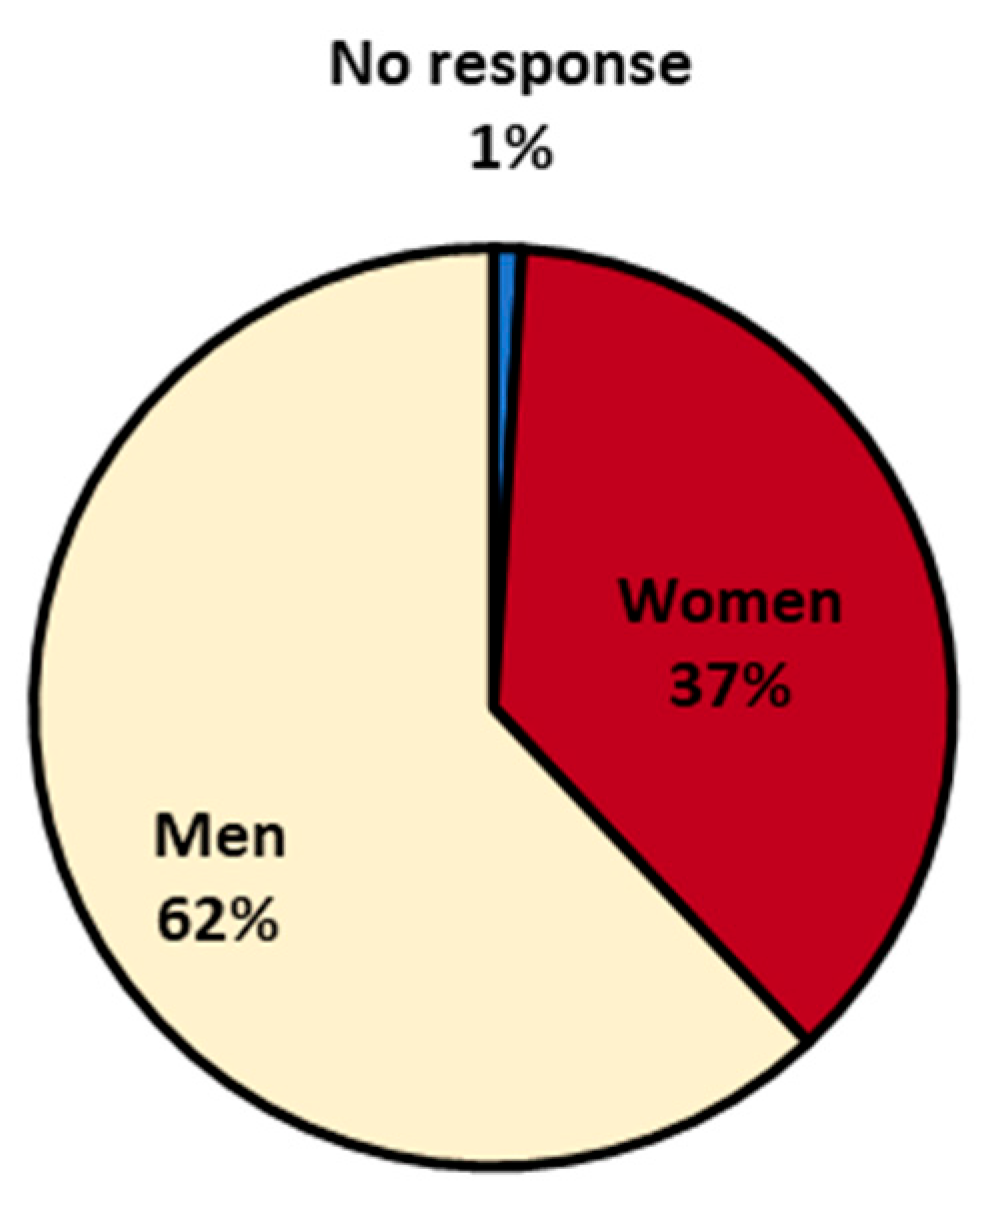
Firstly, the question is analysed by gender to see how men and women are represented in the sample (see
Figure 10).
When studying the composition of the sample by gender, it can be seen (
Table 8) that more than half of the sample is men (62.67%), compared to 37% represented by women. These participation percentages were expected, since the majority of the sample is represented by the students from the School of Engineering, where there are more men than women pursuing these degrees.
Even so, it cannot be ruled out that there is greater interest on the part of men than women, as the percentage of teachers who responded to this survey is quite high in this respect.
However, in the group of driving school professionals, there was equal participation between men and women.
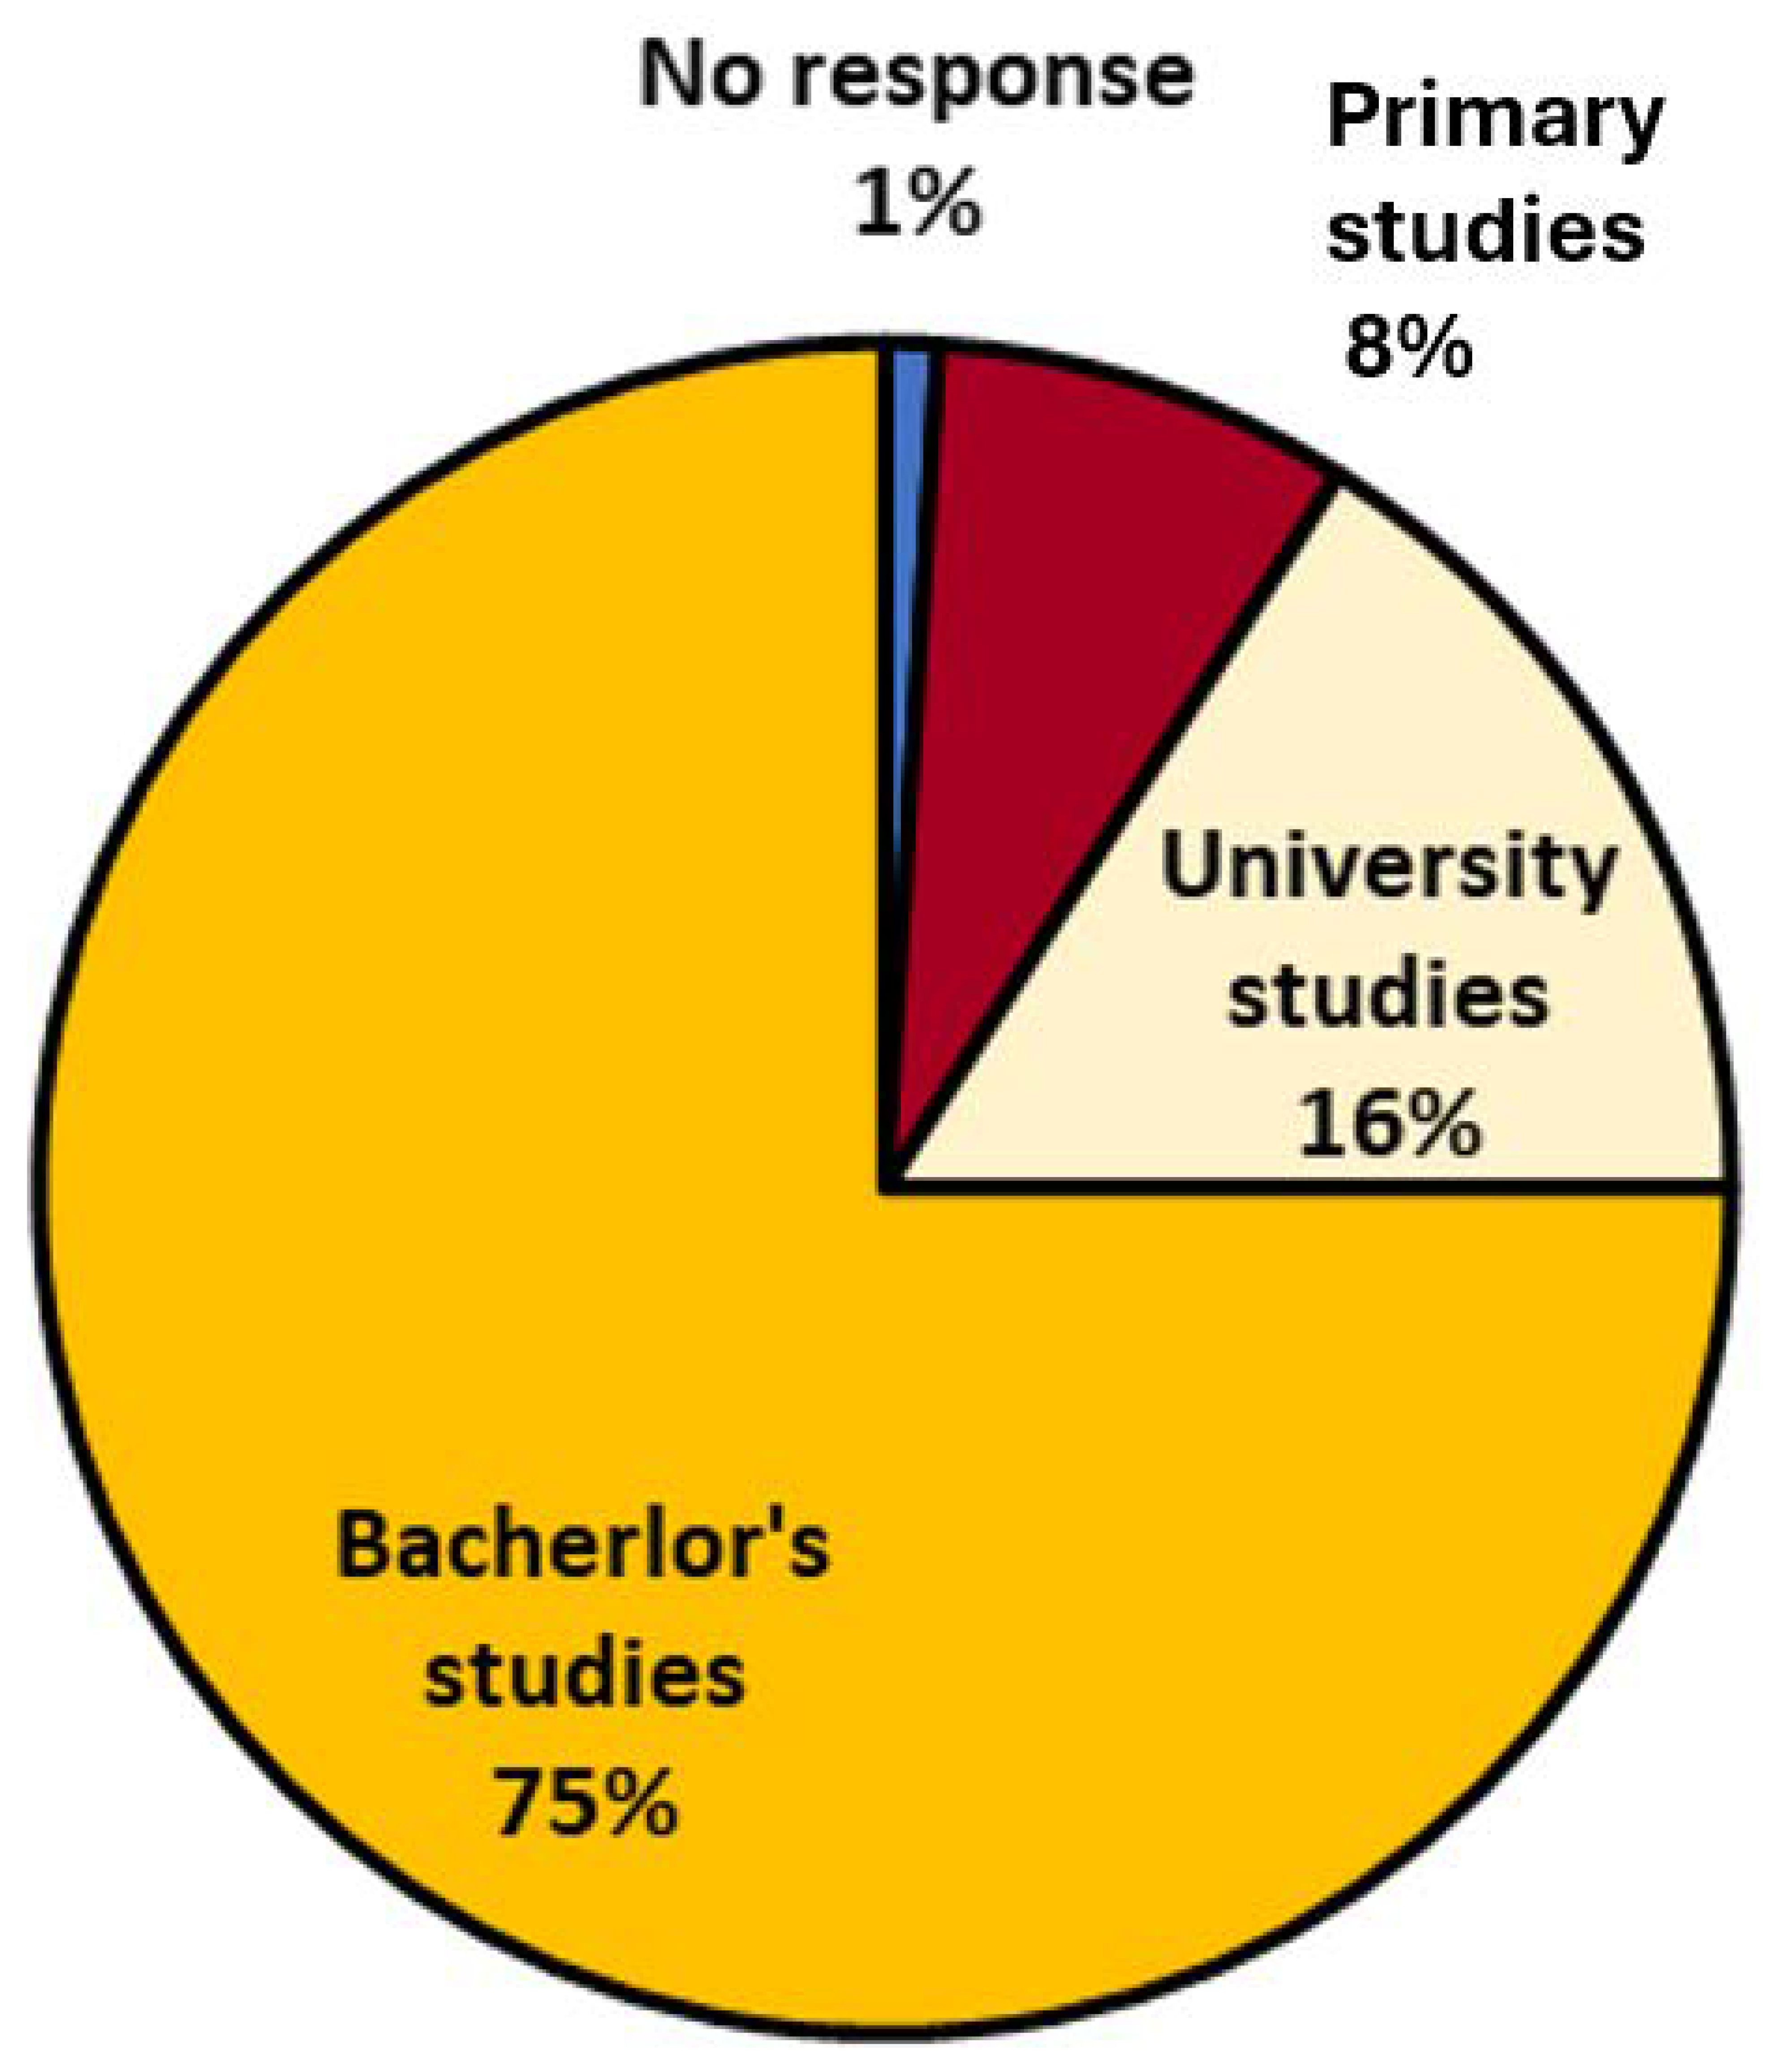
A similar approach was taken with the educational attainment question to see the percentage of the sample who have completed a certain level of education.
The majority of the surveyed population (see
Table 9 and
Figure 11) is in intermediate grades (baccalaureate), while a low percentage of the population has completed university studies (15.6%).
This may influence the quality of the responses, depending on the degree of technical knowledge the respondent possesses.
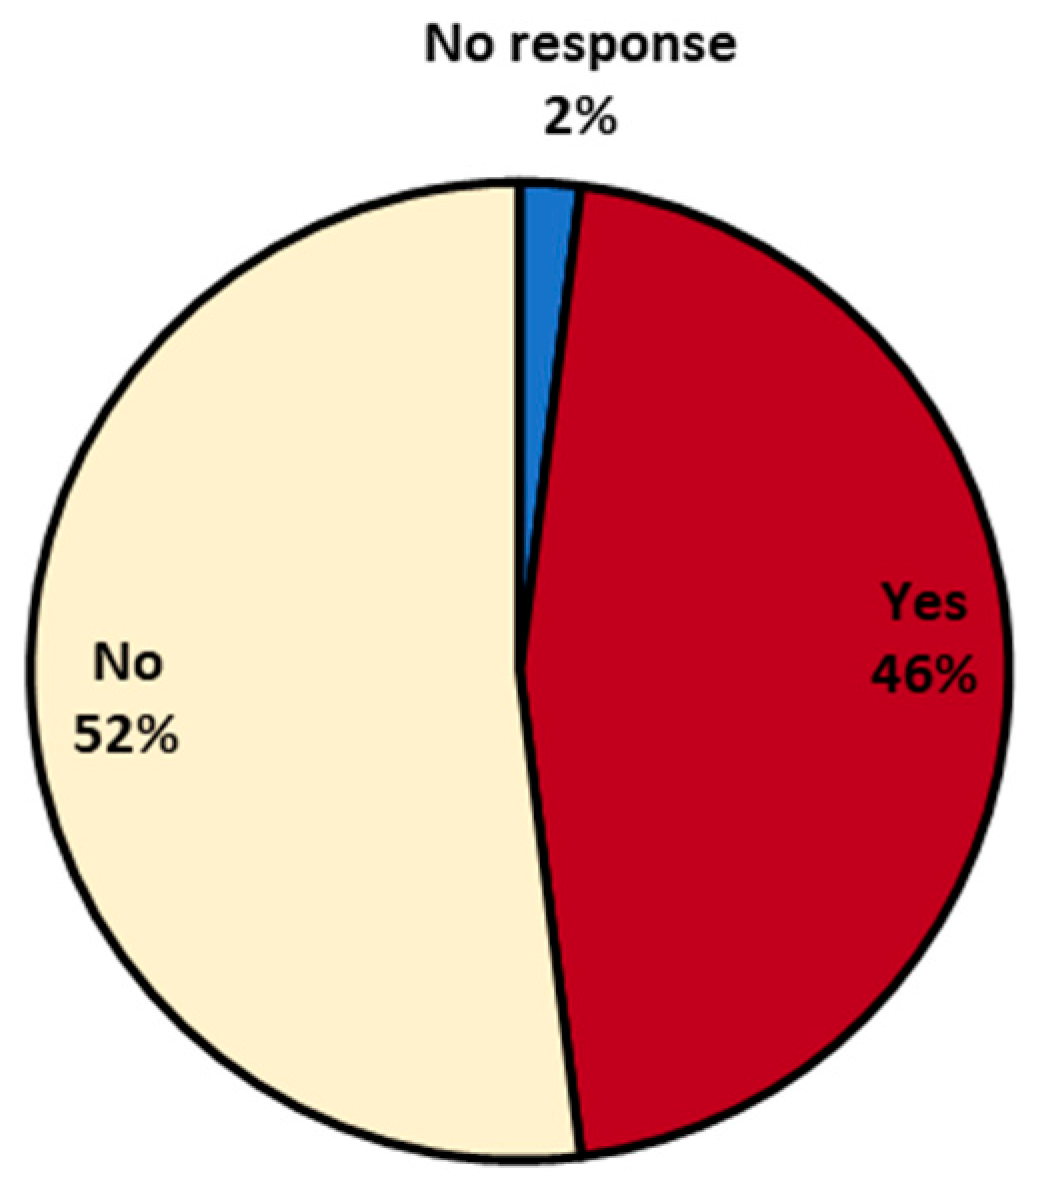
Subsequently, the question of whether the respondent has his or her own vehicle is analysed, as shown in
Figure 12.
It can be seen that more than half of the respondents have their own vehicle or use a family car, compared to 34% who do not have their own vehicle (see
Table 10).
Figure 13 shows the different percentages of the sample that use public transport.
No clear conclusions can be drawn from this graph and
Table 11, as half of the respondents do not use public transport.
Finally, the age question is analysed to see the range of ages in which the sample is comprised. For this purpose, the ages have been grouped into different age ranges, as shown in the figure below.
It can be seen (
Table 12 and
Figure 14) that the highest percentage is between 17 and 24 years of age (65.1%) and that there is a small percentage (8%) of individuals over 46 years of age. This may have an impact on access to sources of knowledge about EVs (e.g., the Internet) and on the future expectations of the respondents, since being younger means that they can see themselves as potential consumers of a product which they can purchase and therefore see it as a product that is closer to them.
5. QFD Methodology Applied to Electric Vehicle Deployment
This section represents the concrete application of the QFD methodology introduced earlier. Based on the structured survey conducted among three distinct user groups, we identify, quantify, and prioritise customer expectations to construct the house of quality. Each QFD phase is applied sequentially, aligning theoretical principles with real-world user data specific to the electric vehicle market.
The first phase of the QFD is to identify and prioritise customers. For this reason, information has been sought on the customer’s expectations of the electric vehicle in order to be able to consider them correctly.
For our study, as indicated above, we have taken a significant sample of the possible customers that the electric vehicle may have, such as three distinguished groups: the students at the School of Engineering of Malaga, the teaching staff and P.A.S. at this school, and the workers of the “Torcal” driving school in Malaga.
For the application of the second phase of the QFD, which is the identification of customer expectations, a survey was carried out with twenty questions on EVs in order to carry out a study based on this survey.
The survey was conducted on the basis of the existing knowledge of the electric vehicle, and some functions of the electric vehicle were explained in case the respondent was not aware of them.
Once the data obtained from the survey have been statistically analysed [
19], the next step is to unfold the table of quality demanded and quality planned in order to construct the “house of quality”. This is a matrix which contains the factors about which chosen sample was questioned.
For the analysis of the data, a method proposed by Professor Juan Antonio Aunón Hidalgo in his thesis “Propuesta de mejora de la técnica de despliegue de la función de calidad, aplicaciones al sector del automóvil” (Proposal for the improvement of the quality function deployment technique, applications to the automotive sector) has been applied.
To do this, the customer hierarchy was carried out (see
Figure 15), assigning different percentages to each of the groups in the chosen sample. Different percentages have been established for each of them in order to supplement the data obtained from the survey.
Depending on the importance given by the customer to a particular factor, we will decide on the planned quality we want to achieve in the future. This will be the value we will aim for, and we will assign a quality increase factor to this variable. With these data, we will be able to obtain the absolute weights (absolute importance) of the different factors.
To do this, the data obtained are processed, determining the different statistical variables used in survey analysis, such as the mean, mode, median, standard deviation, variance, and the different quartiles. Of all these variables, the mean is used for data processing as it is the one that provides the most information in this type of work.
Once the different parameters of the survey results are determined, the weighting of each question with respect to the mean is determined (see
Table 13).
where
is the average corresponding to the question, and “
” is the number of answers for each question (which in this case is 5, as each question is rated from 1 to 5).
On the other hand, the weight of each question with respect to its mean was obtained, giving a different coefficient of importance to the different groups that make up the sample. To do this, the following formula from the aforementioned thesis was used:
where
is the percentage of importance in each group, and
is the weight corresponding to that question.
However, in order to analyse the results, these values have been graphically represented together with the different groups (see
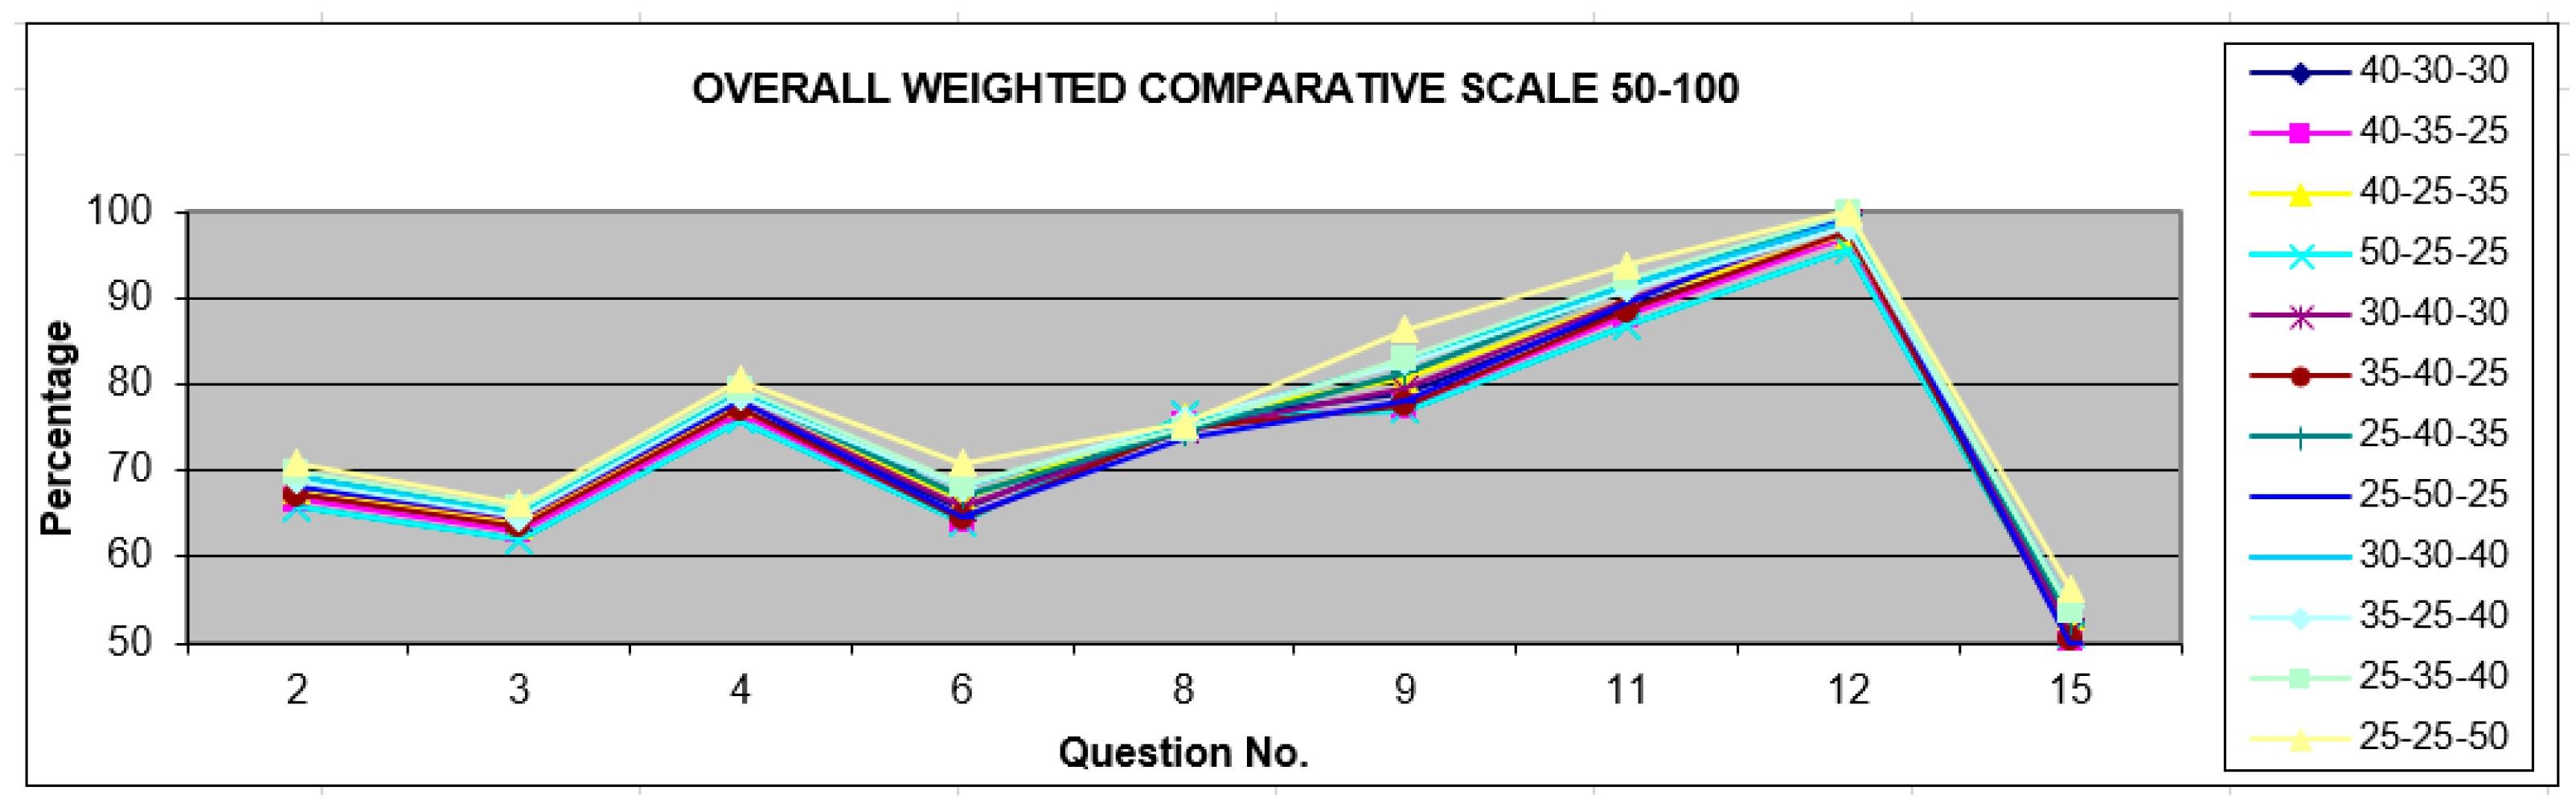
Figure 16) in order to see the questions that have the greatest weight of the respondents, and thus to be able to see the most relevant aspects that the electric vehicle has for this sample.
Figure 16 shows that questions 2, 3, 4, 6, 8, 9, 11, 12, and 15 have more weight than the other questions, so they should be considered in order to find the customer’s requirements.
On the other hand, the different weights were transformed from a 1–100 scale to a 50–100 scale. This was performed using the following formula from the above-mentioned thesis:
where
is the value corresponding to the mean of the question we want to address,
and
are the minimum and maximum values of the
found with the above formula.
Therefore, these values have been graphically represented as a whole for the different groups (see
Figure 16) in order to see the questions that have been most valued by the customer on a scale of 50–100, and thus to be able to more clearly observe the most relevant aspects of the electric vehicle.
In this figure, the questions with the greatest weight and the dispersion of the different percentages applied to the sample can be seen more clearly.
Finally, the value of the mean with respect to the percentage given to each group in the sample has been found, using the following formula:
where
would be the percentage of importance in each group, and
would be the mean for that question.
These values are shown in
Figure 16, which shows the value of the averages obtained in the survey with the different percentages applied to the sample.
The three graphs show (
Figure 17) how the number of questions that are most relevant in the different groups coincide, giving more or less importance to the different groups.
Therefore, from the questions 2, 3, 4, 6, 8, 9, 11, 12, and 15, we draw the requirements of the customer for the construction of the right wall of the quality house.
To provide a clearer and more accessible overview of the most relevant customer expectations identified through the survey, a summary of the weighted importance of each requirement has been included. These values were obtained from the statistical processing of the questionnaire results and reflect the degree of priority assigned by the different user groups. As can be seen in
Figure 18, the highest priority is given to the integration of the quality required by the user, followed by improvements in grid capacity, investment in R&D, and the development of a distributed charging network. These expectations represent the core of customer needs and serve as the foundation for the construction of the house of quality in the QFD process.
This study has been carried out for the different statistical variables found, being able to observe that this method for the customer’s requirements (WHATs of the quality house) [
20] is valid for the statistical variables measured in position, such as the mean, mode, and median.
However, for measures of dispersion, such as standard deviation and variance, the implementation of this method does not work. The statistical measures of dispersion (in this case, the variance and standard deviation) show the variability of a distribution by indicating, by means of a number, whether the different scores of a variable are far away from the mean. The only thing you obtain from the value of these variables is whether all cases are similar or vary a lot from each other.
It can be seen how in
Figure 16 of the comparative scale of 50–100, the weights of the questions with the highest customer ratings (2, 3, 4, 6, 8, 9, 11, 12, and 15) for the customer requirements are in the range of 81–100. This is due to the fact that the different possible values for the customer hierarchy have been analysed, giving them different weighting percentages, from minimum to maximum values, for each group in the sample.
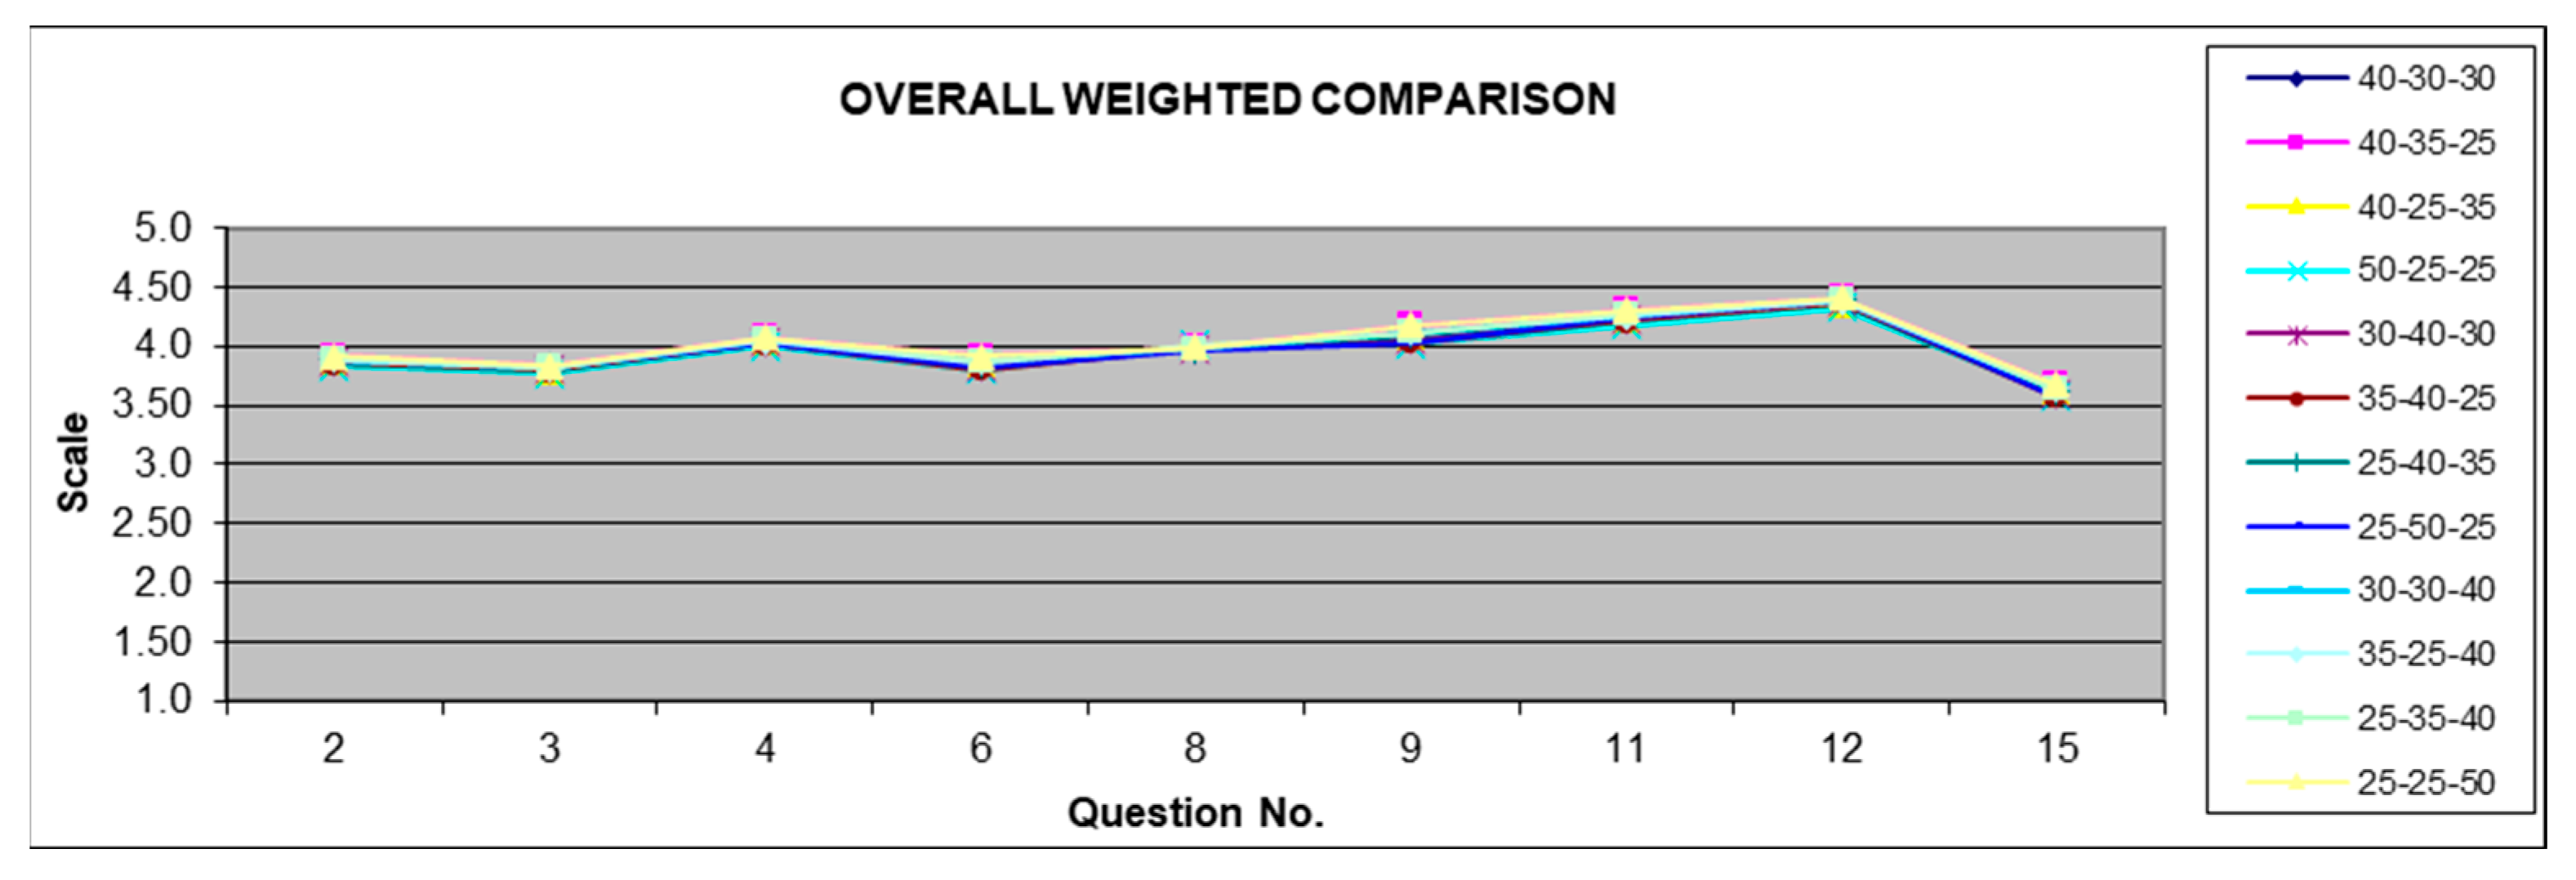
Therefore, to derive the values of the weights of the WHATs for the construction of the house of quality, we applied a new weighting to the selected questions, giving them percentages from 25 to 50, in order to not have too much dispersion in the results.
A graphical representation of the values found in the new weighting (see
Figure 19) shows the values of the weights of the questions with the highest scores in the sample, with the different weightings applied.
As in the other comparison, a weighted comparison has been carried out on a 50–100 scale (see
Figure 19), obtaining the weight of the customer’s requirements to be applied in the house of quality.
In this figure, it can be seen how the weights have changed in value with respect to the previous weighting, as they have been made only with the questions most highly valued by the sample.
Figure 20 also shows the value of the weighted averages of the questions chosen, where how the value is dispersed according to the weighting coefficients chosen for the sample group can be seen.
Of the different weightings given to the different groups, 30-40-30 was chosen (see
Table 14), giving greater importance to the group of driving school professionals.
The choice of giving the driving school 30% is due to the fact that it is part of a group that is closely related to the automobile, since one of its their particularities is that they teach, day by day, future drivers of vehicles. In addition, they use a large number of vehicles at work, which they renew according to their profitability.
On the other hand, since they are a group that is always using this product, their opinion can influence the future vehicle purchase of their pupils.
However, as this group is working, they have the financial means to buy such a vehicle.
However, a percentage of 30% has been given to the group of students, since due to the average age of the respondents, they have a valuable opinion for the future. Although, at the moment, being part of a group in which most of them do not work, they do not have enough income to buy an electric vehicle. Despite this, the composition of the sample shows that more than half of the students surveyed use their own or their family’s vehicle.
However, we must not forget that there are a large number of surveys by this group, so their opinion must be taken into account.
Although the sampling method employed in this study was non-random and limited to three specific groups—engineering students, university faculty, and driving school professionals in Málaga—the sample size of 525 respondents provides a high degree of reliability for statistical analysis. Based on Cochran’s formula for estimating minimum sample sizes, assuming a confidence level of 95% (Z = 1.96), a maximum variability (p = 0.5), and a margin of error of ±5%, the required minimum sample size would be approximately 385 respondents. Our study surpasses this threshold by more than 36%, which strengthens the internal validity of the findings.
Furthermore, the stratification of the sample into three distinct subgroups allows for a comparative analysis across profiles with different roles, ages, and levels of exposure to electric vehicles. While this does not fully resolve the issue of generalizability, it provides a robust empirical foundation for identifying and prioritising customer needs within the Quality Function Deployment (QFD) framework. Future research can build upon these results by expanding the demographic and geographic diversity of the participants using random or probabilistic sampling methods.
Finally, the teachers’ collective was given 40% because this collective is believed to have a greater knowledge of EVs, in addition to their knowledge acquired as engineers, in general. In addition, as this group is working, they have the economic income to purchase the vehicle.
This is already a step forward in terms of electric vehicle deployment, but there is another question to answer: “HOW” we improve it.
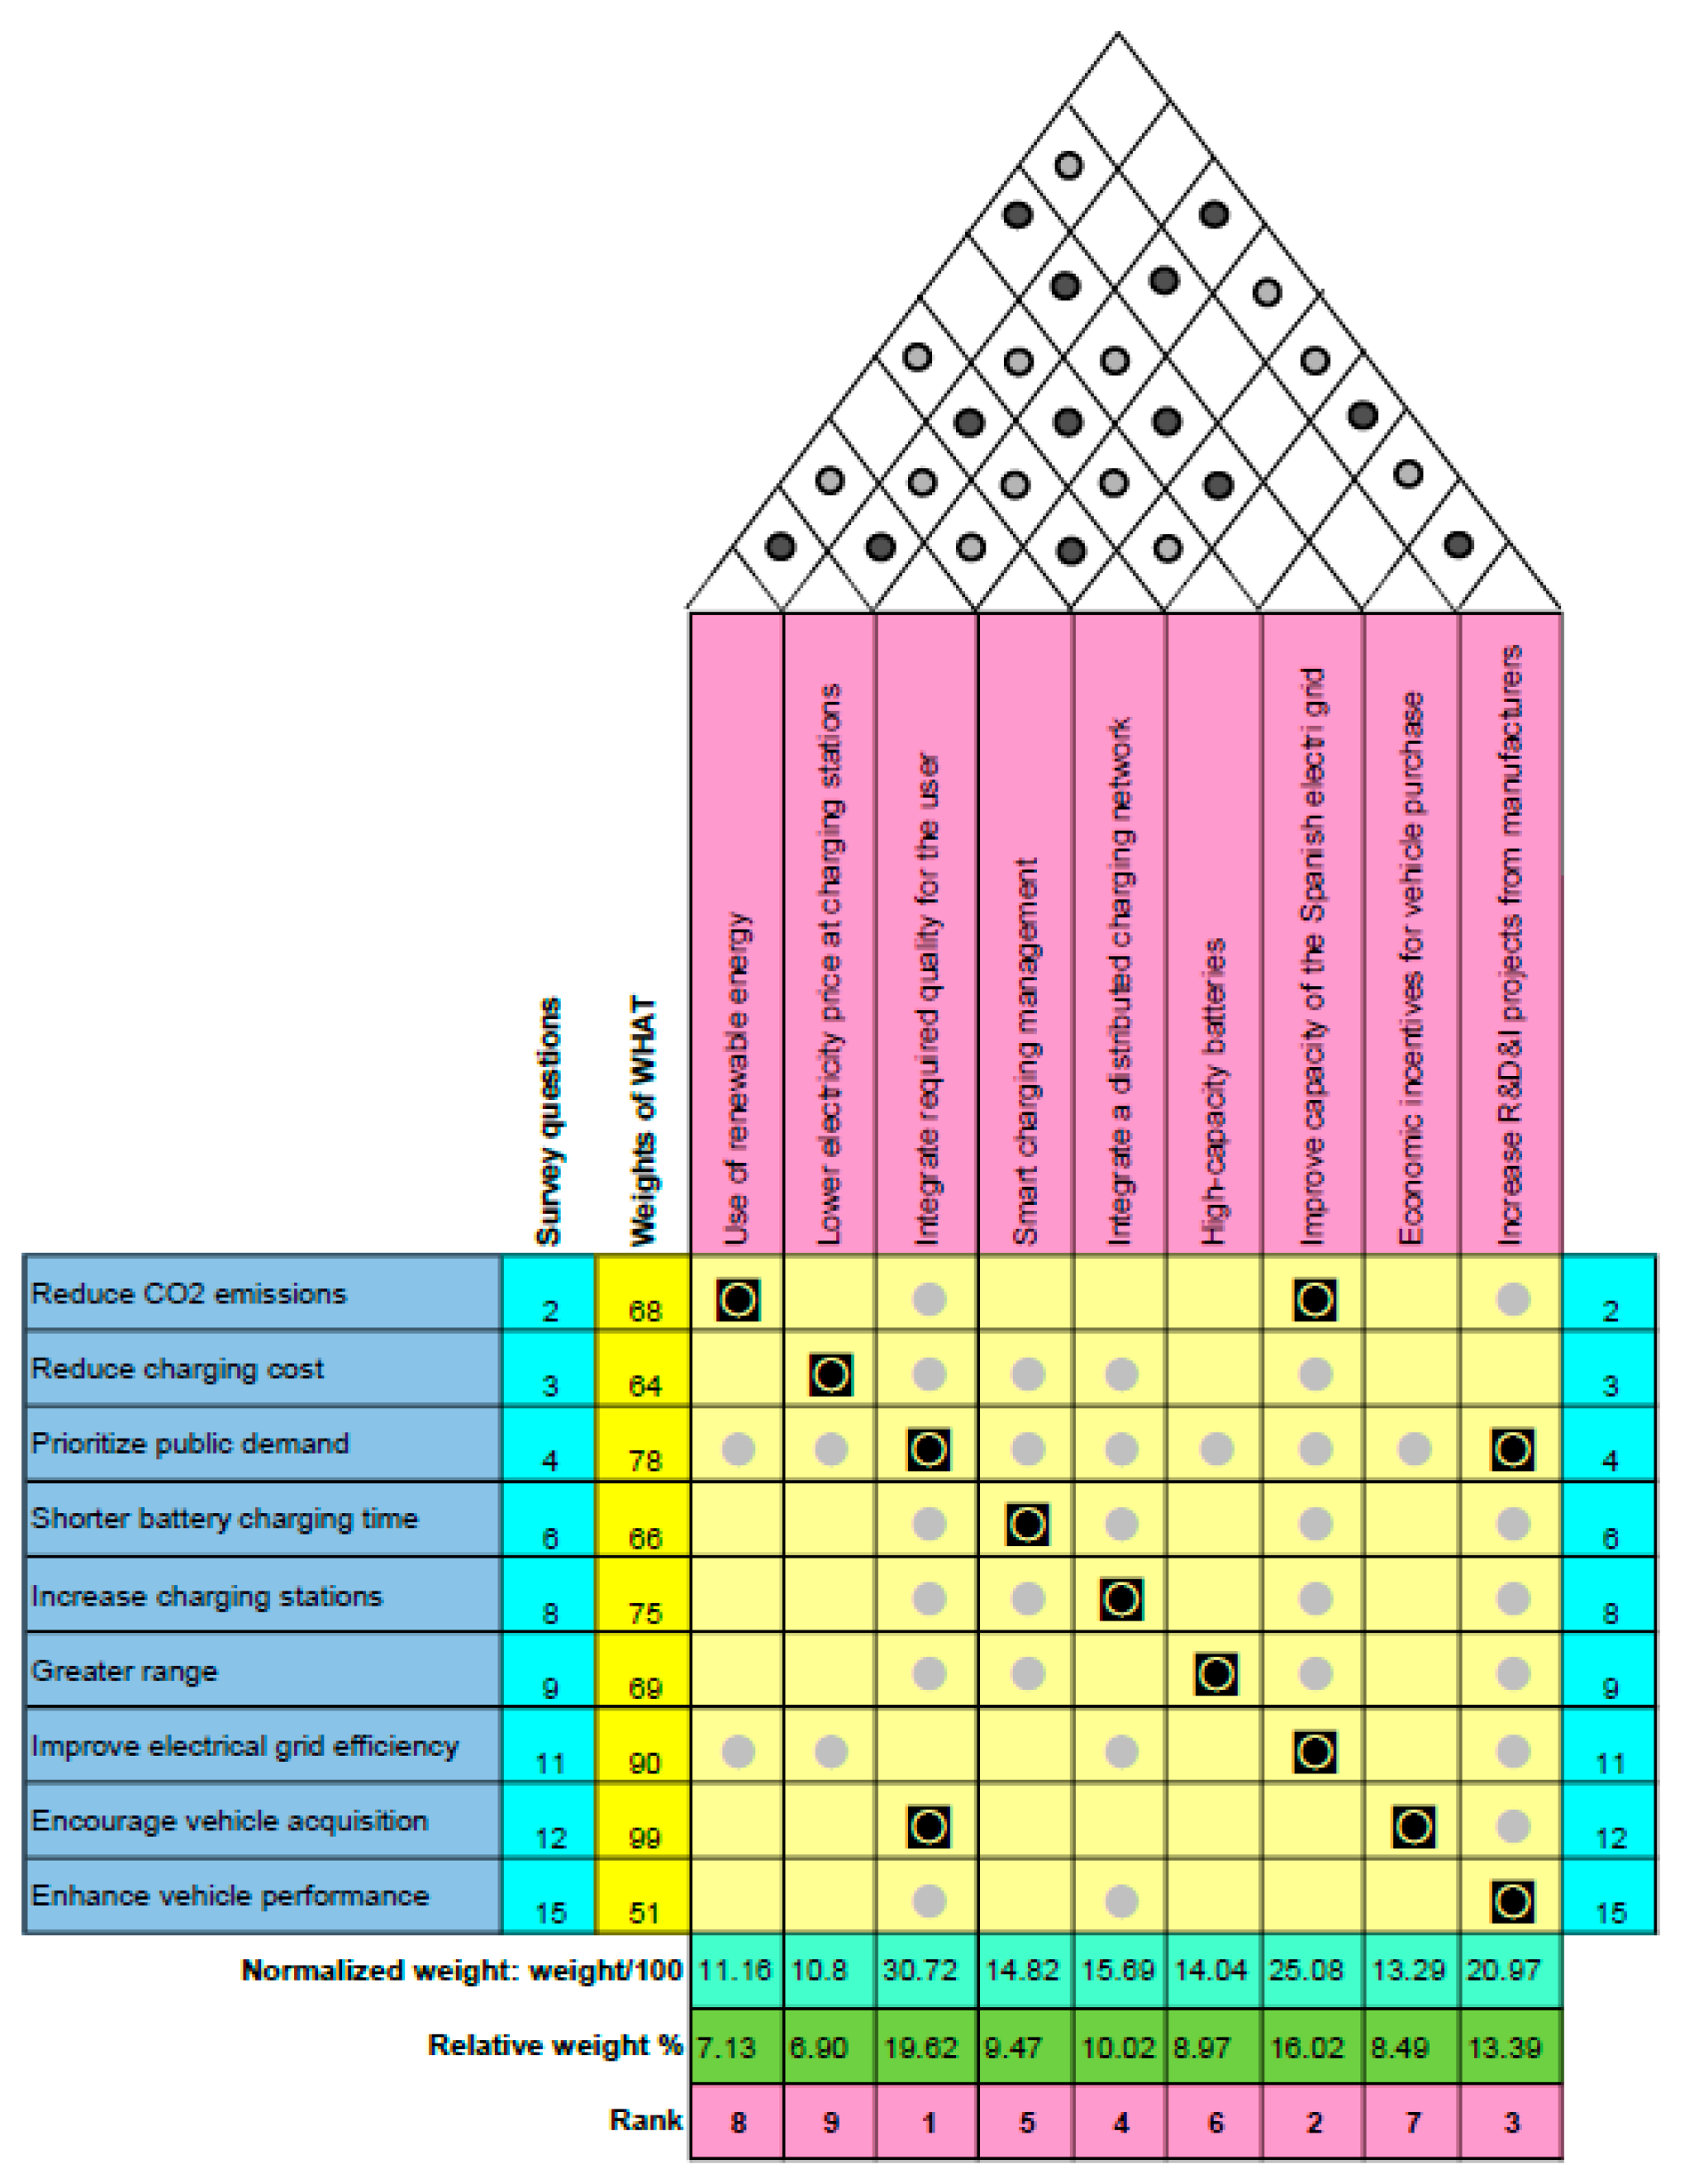
Once the customer requirements with the highest priority have been found, a list is made of the HOWs, which are the different immediate ways in which the WHATs can be met, and on these HOWs, it is necessary to quantify their importance in order to meet the different WHATs. In
Figure 21, the house of quality is represented, where it can be observed.
Next, quantify the intensity of the relationship between each WHAT versus each HOW [
21], using the scale previously mentioned in
Table 4.
Once this is found, the importance of each HOW with respect to its contribution to all WHATs is calculated. This is obtained by multiplying the weight of each WHAT by the intensity of the ratio given in the previous step and adding the results.
Performing the same for the other sub-processes results in the importance row at the bottom of the matrix.
The next step is to determine the relative weights (relative importance) of each of the variables in the improvement of the product. Evidently, it is a question of determining in which aspects it is necessary to make a greater effort to adjust our product to the demands of the client, such as “WHAT” needs to be improved.
For this purpose, it is necessary to deploy another table. This is a double-entry matrix in which the assessed factors are cross-referenced with the quality characteristics. The quality characteristics refer to the elements that are specific to the organisation’s world, i.e., those that the company can modify to a certain extent and which are therefore quantifiable and measurable indicators.
Finally, it has to be investigated whether there is any very strong (mostly negative) correlation between the HOWs [
22], what has been called the “ceiling” of the house of quality in
Section 5 (see
Figure 21).
Once the “house of quality” has been found, we can identify the customer’s needs and come to different conclusions, e.g., a characteristic that was considered unimportant until then is actually very important or vice versa.
In our case, the application of the QFD for the market implementation of the electric vehicle ends at this stage, as the other stages (
Figure 1) would be carried out by the different distributors and companies that implement this product in the market, such as the different vehicle manufacturers, electric companies, etc.
In case the QFD analysis is continued, the HOWs will be the new WHATs in the next QFD matrix at the next level of deployment. The priorities of the new WHATs will be equal to the relative importance they obtained in the previous matrix. Apply the above steps, starting with making a list of the HOWs [
23].
In
Figure 21, the house of quality [
24] is represented with the data obtained from the survey explained above.
The left blue parts are the customer requirements (WHATs), and the upper pink parts are the improvements corresponding to the WHATs found, what we call the HOWs [
25].
6. Results
Once the data obtained from the survey were defined, we analysed the results of the survey individually, for each individual in their corresponding group. An analysis was made of the measures that had the greatest impact on our study, such as the measures of position, specifically the mean and mode.
However, the different graphical representations were made with the different statistical measures studied (median, standard deviation, variance, and different quartiles), which had a smaller impact on the analysis of the data for each individual respondent.
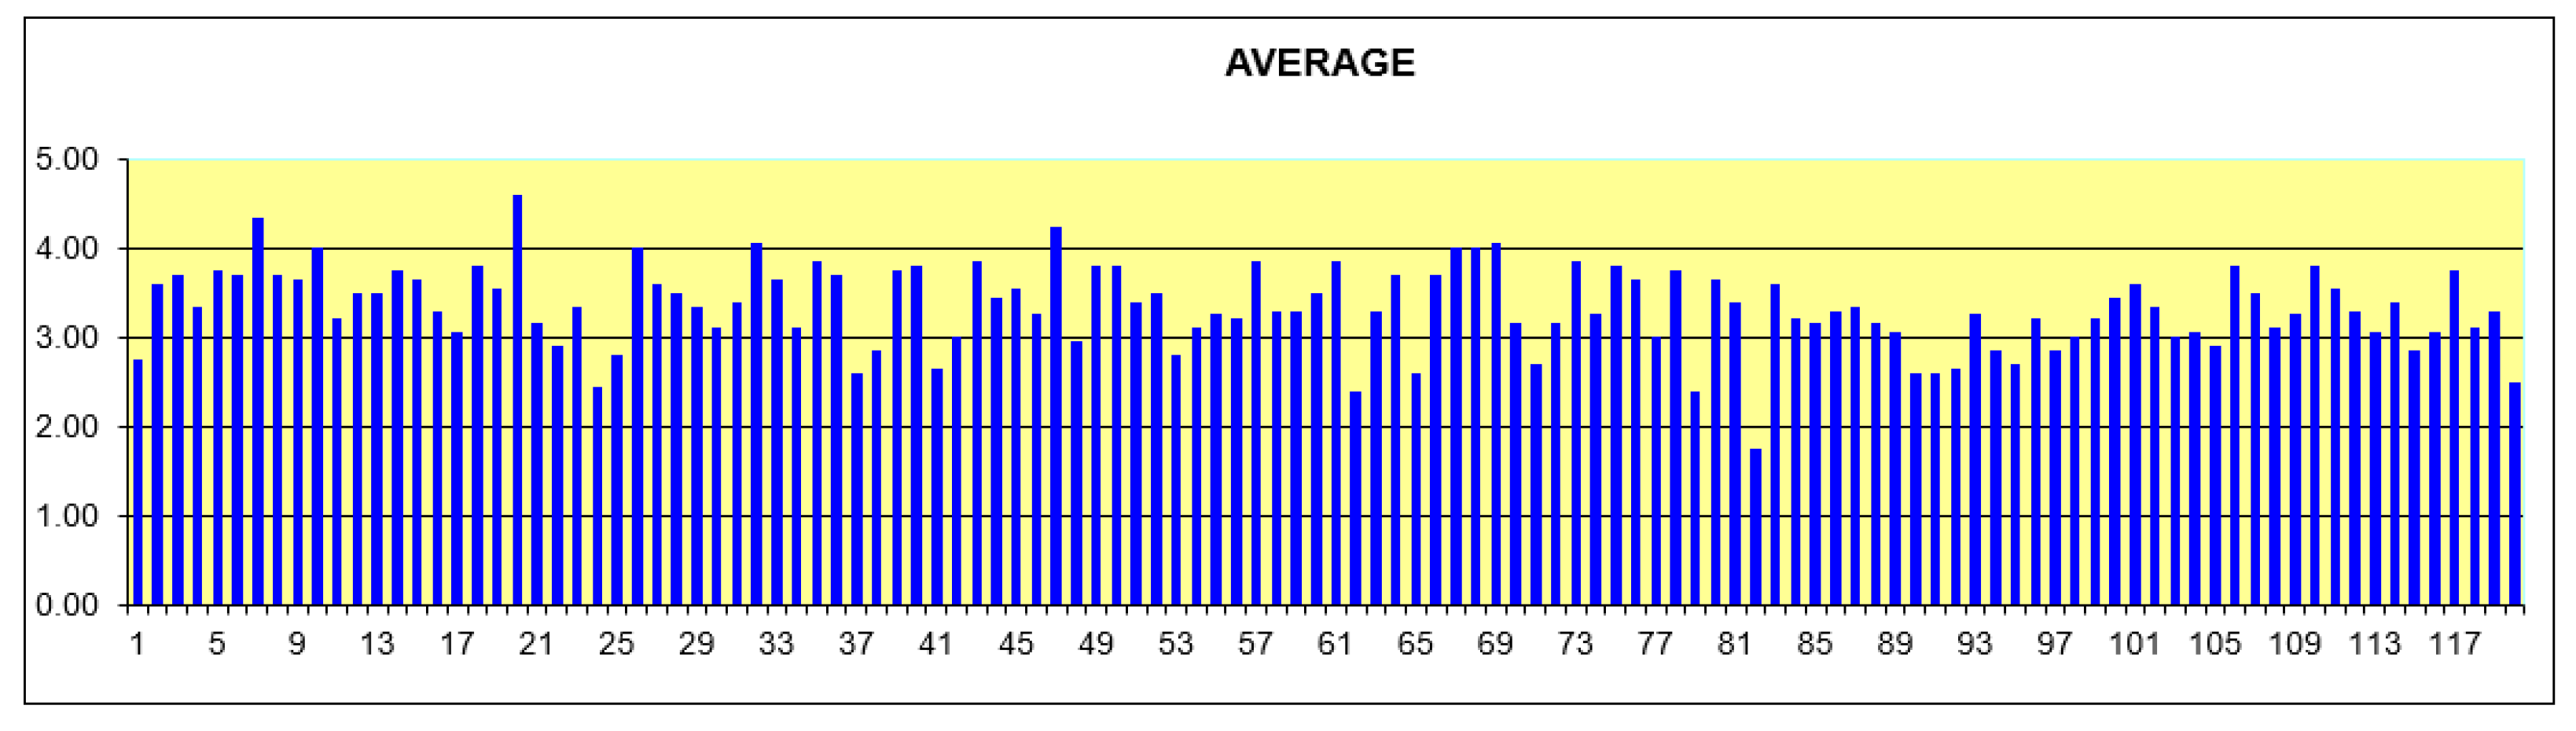
If we analyse the group of university students, as can be seen in the graphical representation in
Figure 22, it can be seen that 86 of the 360 students surveyed had an average response of less than 3, which means that approximately 24% of the sample of students see little need for the implementation of EVs.
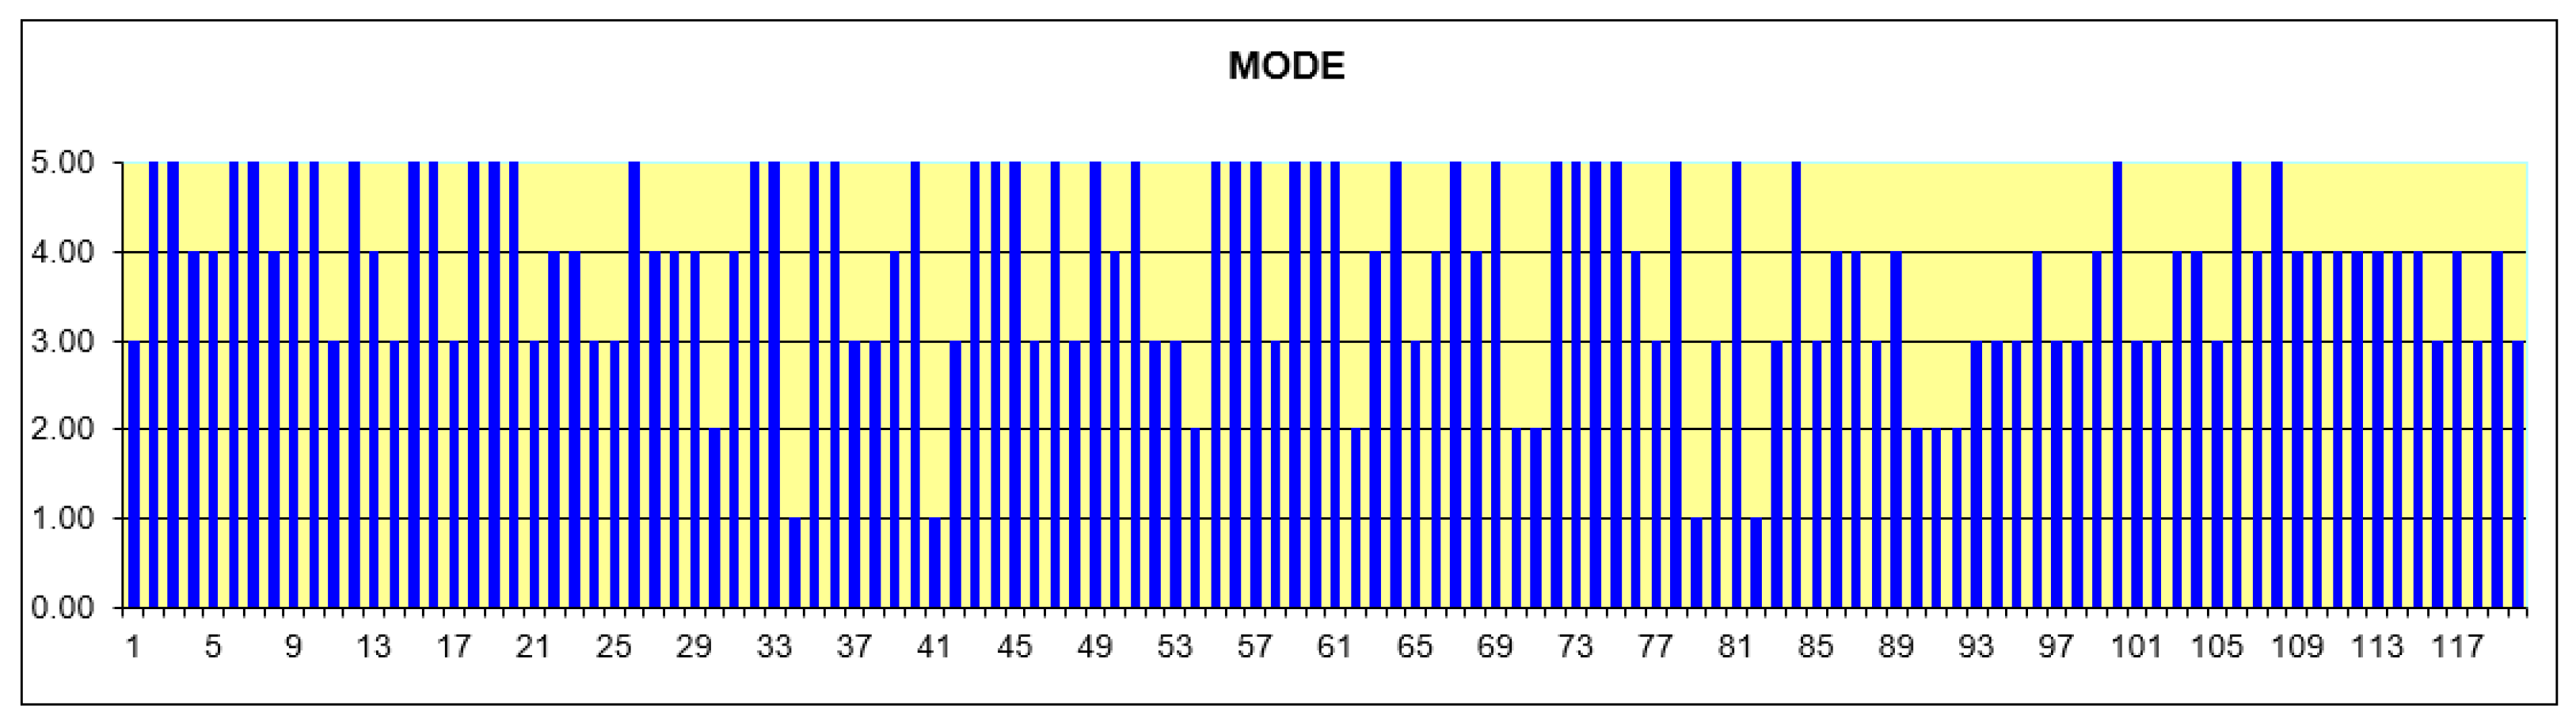
However, if we graphically represent the mode of each student (
Figure 23), we can see that 7.5% of the students surveyed (27 students) have a mode of value 1, and 7% of the students surveyed (25 students) have a mode of value 2, which means that 14.5% of the students surveyed have a value lower than 3. However, we can see that approximately 35% of the students surveyed (122 students) have the most frequent value of the answer equal to 3.
These graphs are representative of the sample, as they show the values that represent the results of the survey for this group.
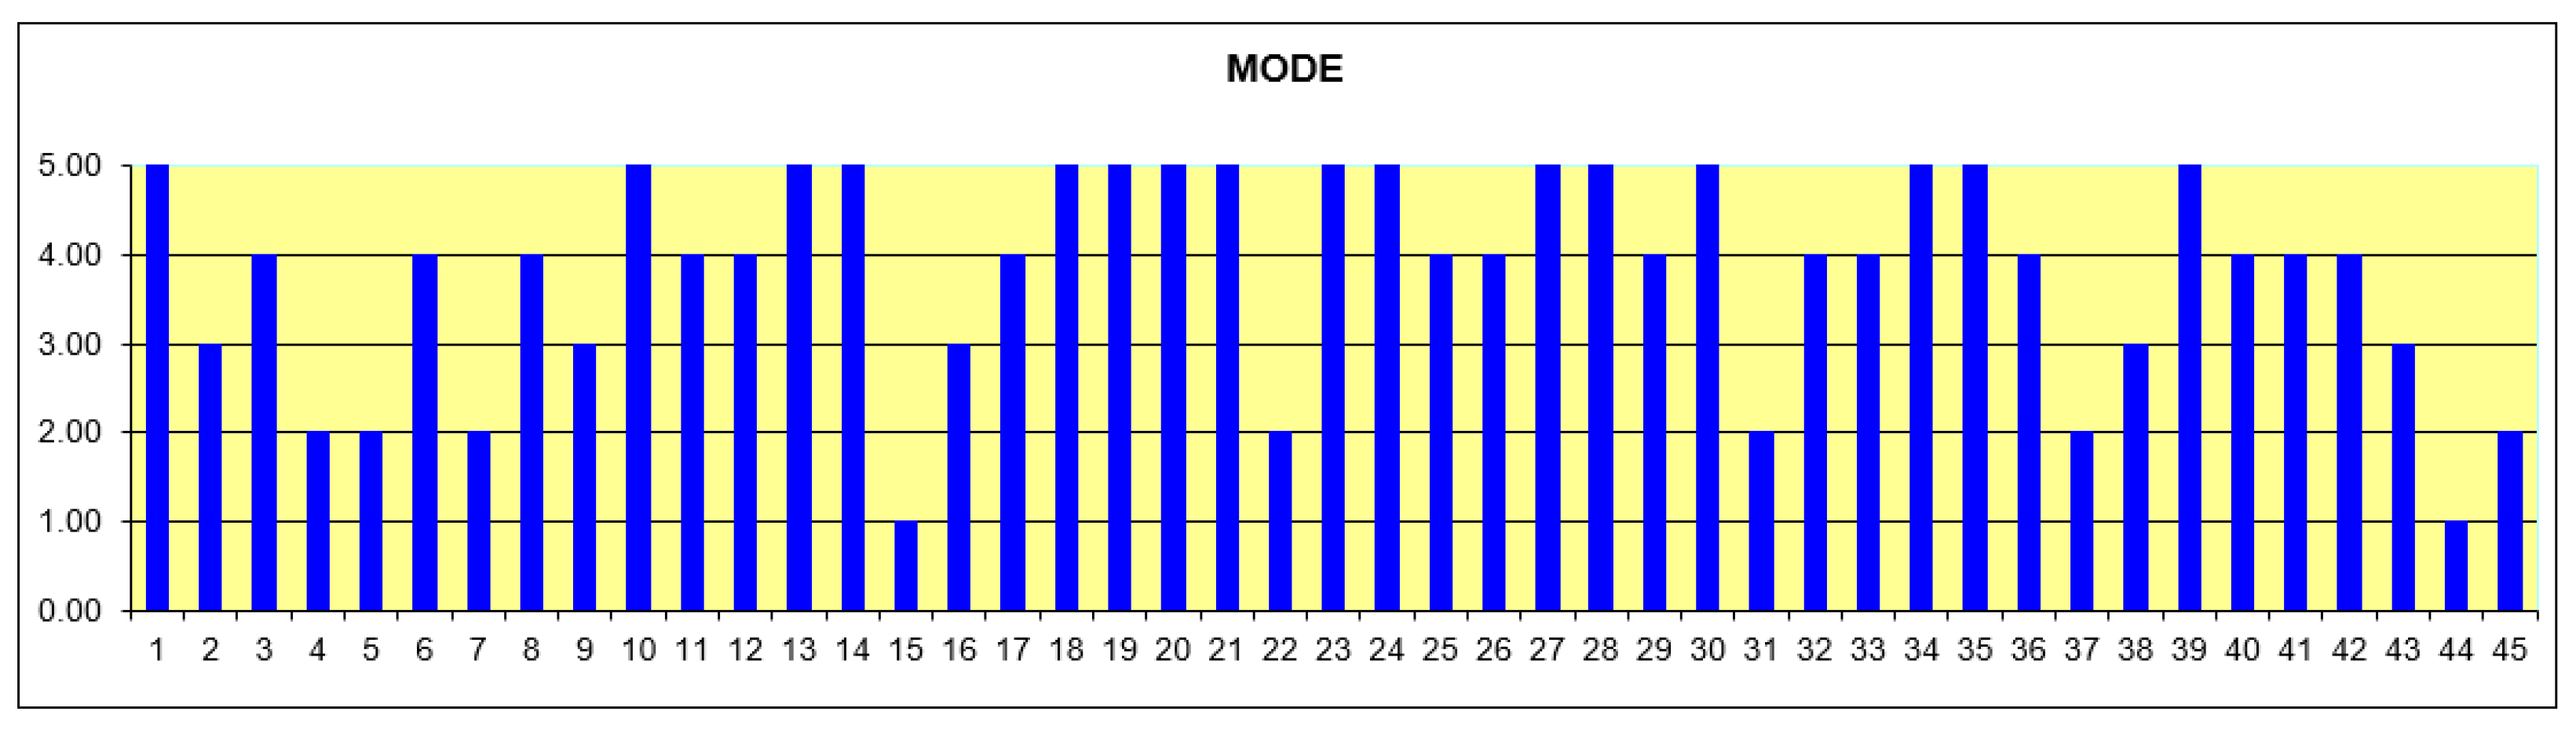
If we analyse the group made up of driving school professionals, as can be seen in
Figure 24, 24 of the 120 professionals working in the driving school surveyed have an average response of less than 3, which means that approximately 20% of the sample of this group consider the implementation of EVs to be not very necessary.
On the other hand, in
Figure 25, 3.33% of the staff surveyed (four individuals) have a mode value of 1, and 6.67% of the staff surveyed (eight individuals) have a mode value of 2, so 10% of the staff surveyed have the most frequent response value of less than 3.
Furthermore, it can be observed that the remaining percentages of this group, more than half, have a high frequency of response, showing a greater need for implementation.
As in the previous case, a smaller percentage of respondents have a mode value of less than 3, so the majority have a positive view towards electric vehicle deployment.
If we analyse the group formed by the university teaching staff, according to the data obtained in
Figure 26, we can see that 8 of the 45 teachers surveyed have an average response of less than 3, so that approximately 17.78% of the sample of teachers have a negative opinion with respect to the objective of the study of this work.
When plotting the mode for each teacher (see
Figure 27), 4.44% of the staff surveyed (two individuals) have a mode value of 1, and 15.5% (eight individuals) have a mode value of 2. So, for a mode value of less than 3, this corresponds to 20% of the staff surveyed.
Teachers follow the same trend as the rest of the groups surveyed. A small percentage of respondents do not believe that electric cars should be introduced.
Statistical analysis of each question asked:
Now, we proceed to an analysis of each question asked. We will also proceed to study the statistical variables of mean and mode, as they are more representative in this type of survey.
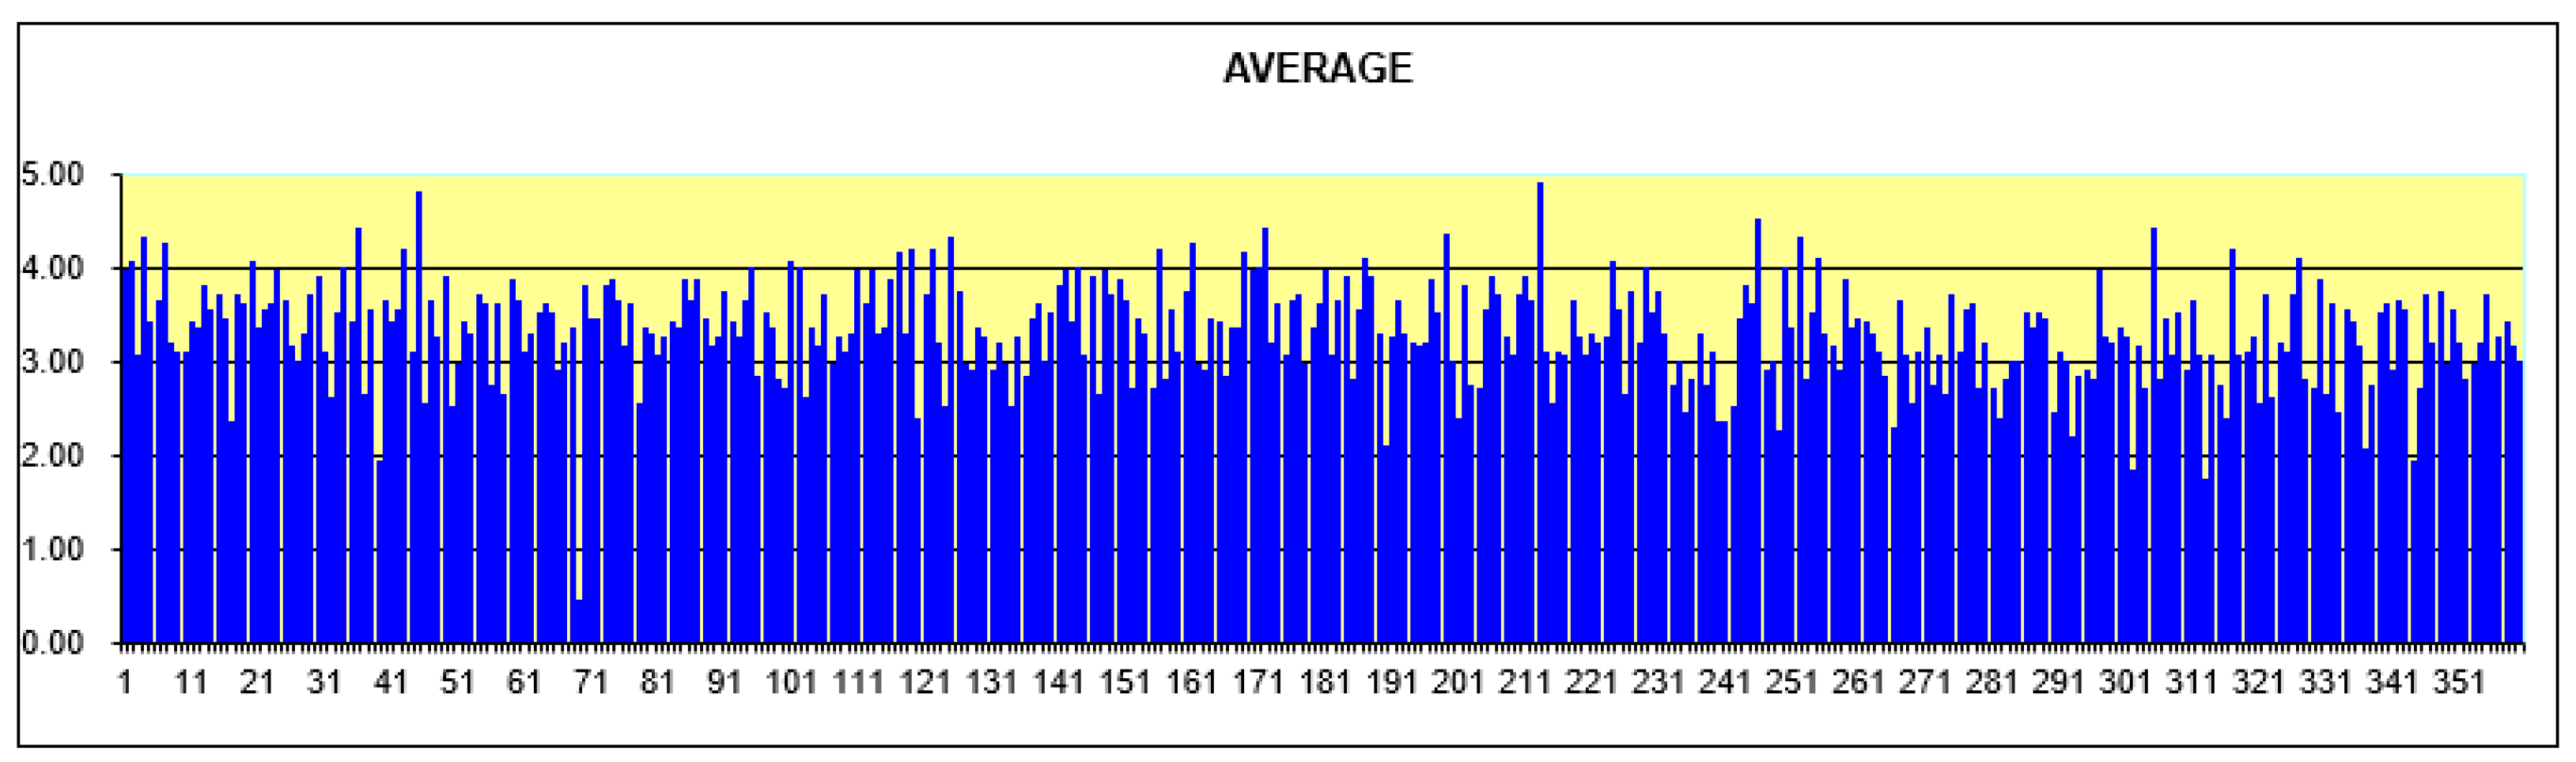
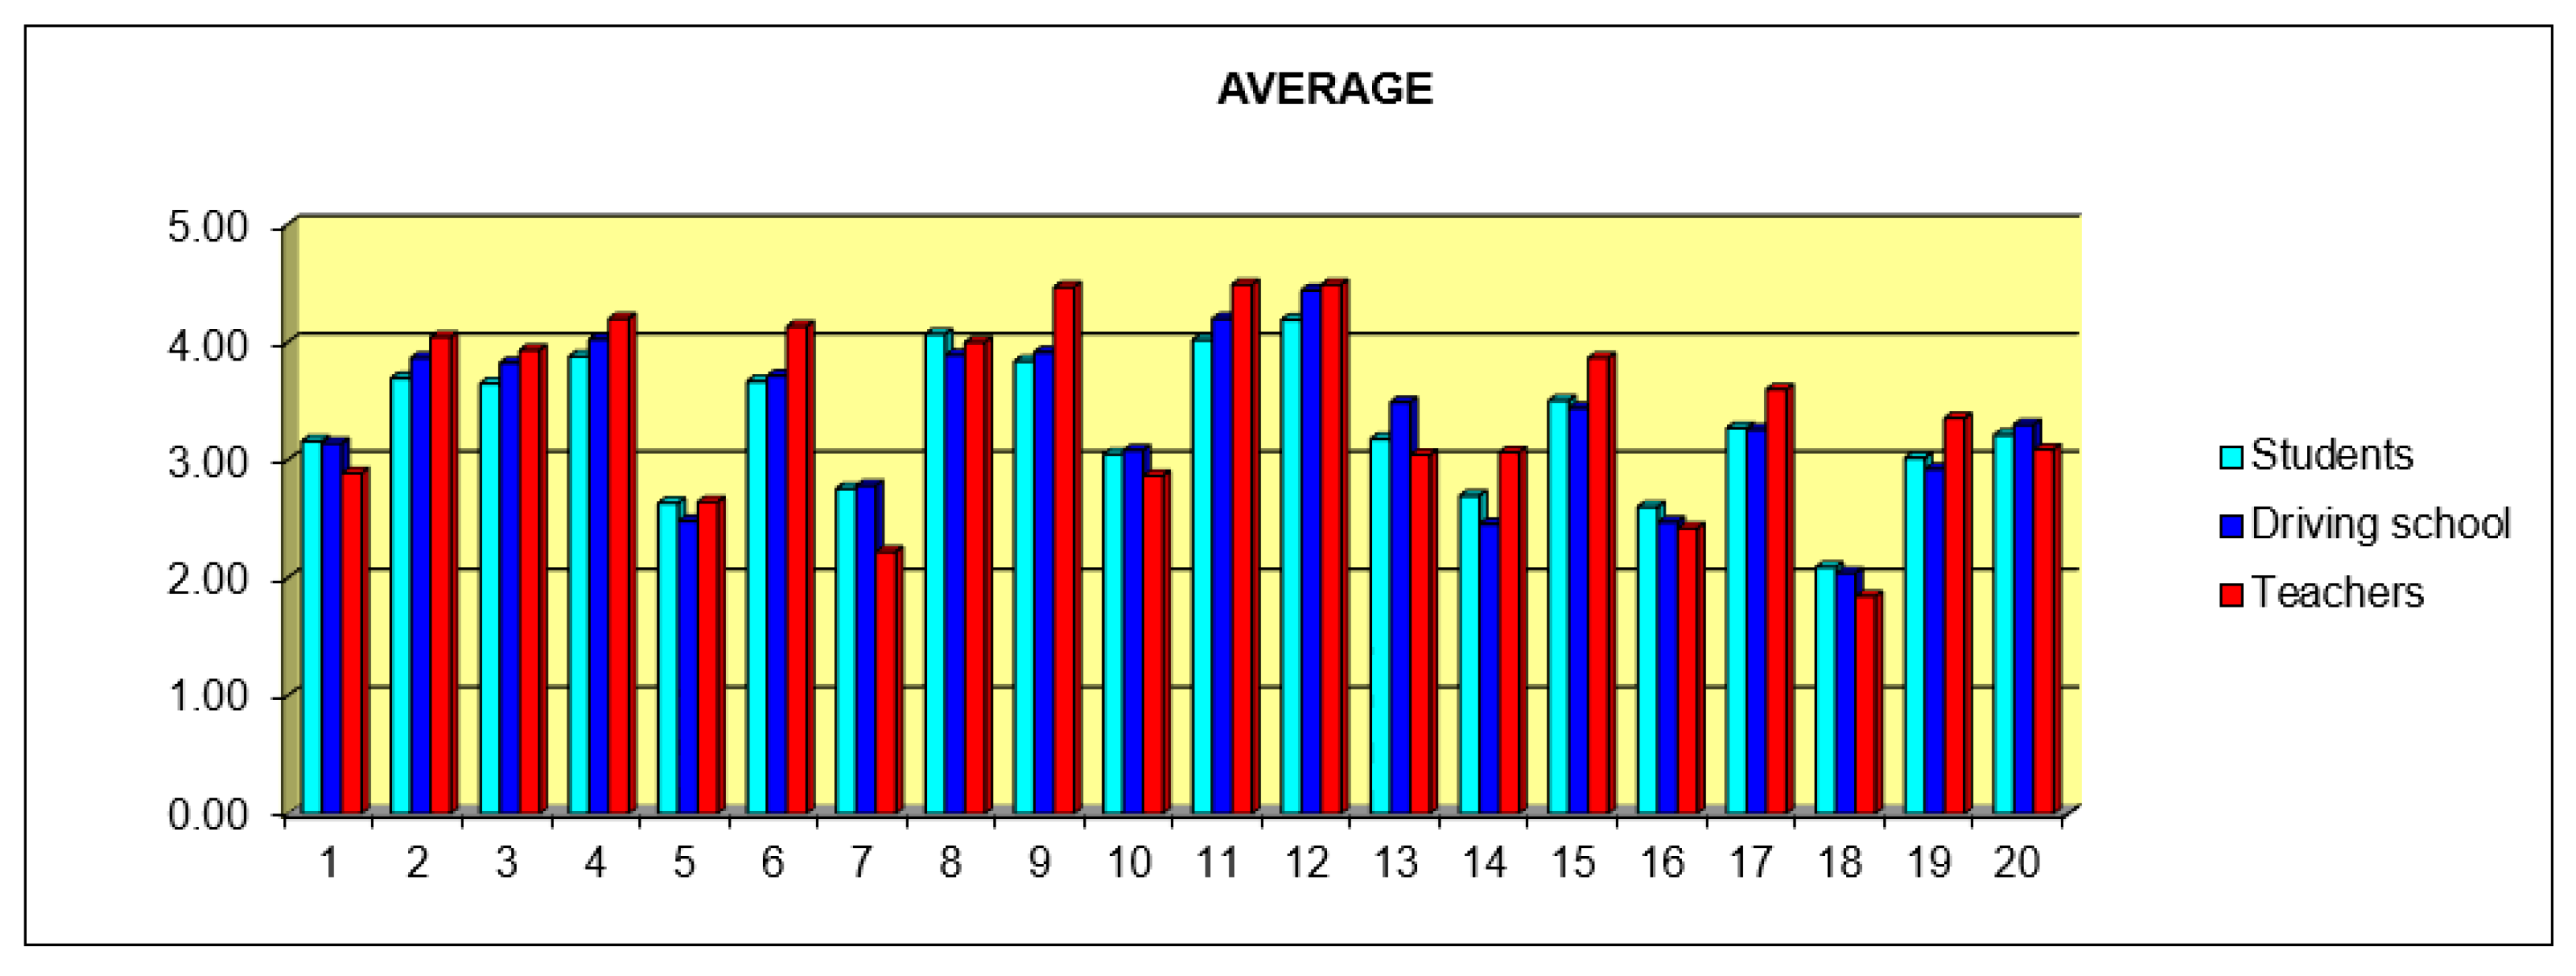
It can be seen, as in
Figure 28, that we have more questions with an average greater than 3, so many of the characteristics proposed in the survey for the implementation of the electric car in the market are necessary and very necessary.
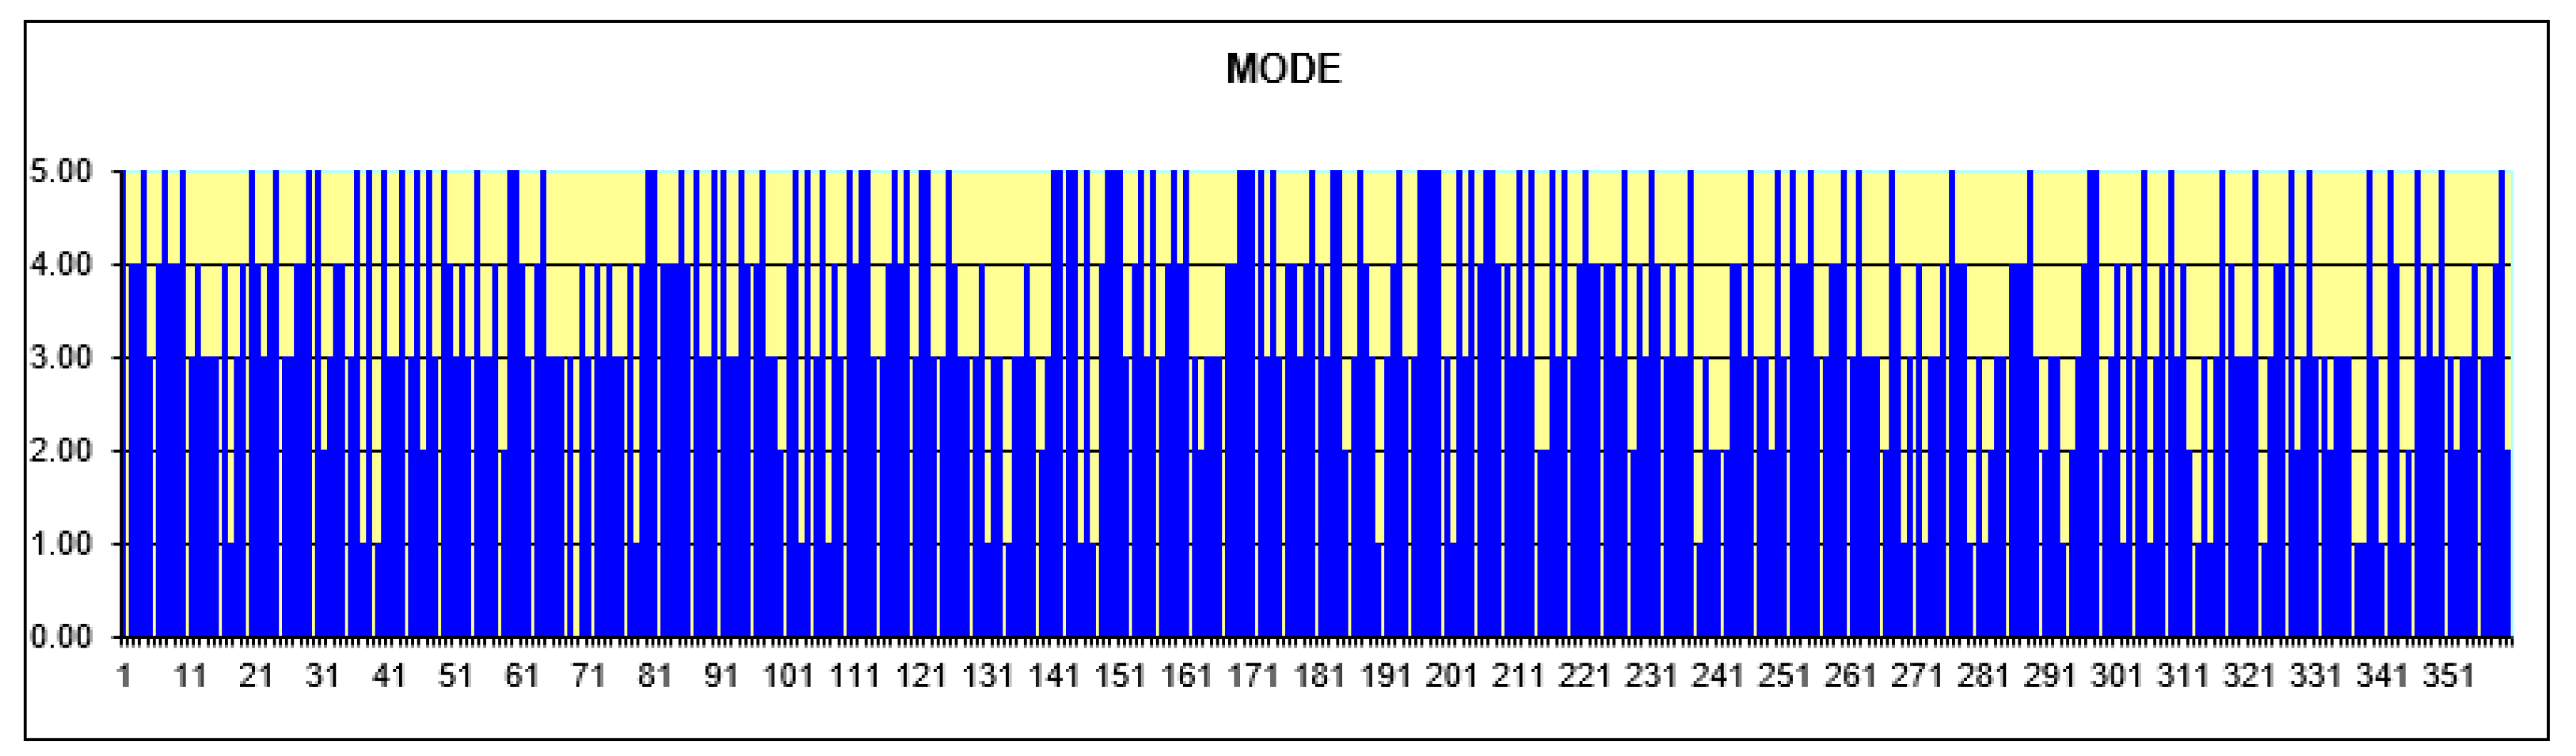
However, in the graphical representation of the mode (
Figure 29), it can be seen that two of the questions asked (7 and 18) have been answered with low values by the different groups, which shows little interest from the sample.
As well, you can see the most frequent values of the different collectives, which in questions 4, 5, 9, 11, 12, 14, 15, and 18 have the same value.
In the figures shown above, we have obtained the representation of the statistical variables of the mean and mode, showing the questions rated by the different groups.
In the analysis of the QFD application, with the construction of the house of quality, the customer requirements are obtained on the one hand, and on the other hand, the improvements that should be made so that the customer is satisfied with the electric vehicle. Thus, the corresponding relationships are made in order to arrive at the value of absolute importance that determines which aspects of the implementation of the electric vehicle require the greatest effort to achieve the required level of quality.
So, with the house of quality, we will know what needs to be improved in its implementation in the vehicle market. To do this, we will analyse all the relevant points of the quality house, which is shown in
Figure 21.
First of all, it can be seen that the different proposed improvements (HOWs) do not have a negative correlation with each other. This means that all the identified proposals are relevant for this implementation.
However, the weighting of the WHATs has values within a range between 51 and 98, and compared to the weights found in the first weighting (approximately between 88 and 99), there is a big difference. In addition to a more focused weighting of the different groups, this is due to the comparative weighting of the selected questions.
Table 15 shows the order of priority to carry out the different improvements proposed for the successful implementation of the electric vehicle in the market.
This prioritisation has been found with the average of all ratio weights, showing that the higher the value of an improvement, the greater its influence on customer satisfaction. Thus, more effort should be put into achieving this improvement in order to make the implementation of EVs more successful in the market.
Figure 30 shows the percentage weight of each improvement, ranked in order of priority according to
Table 15.
Looking at the results of the relative weights in
Figure 30, it can be seen that the highest value is 30.72, corresponding to the improvement in integrating the quality required by the user, which represents a 19.62% weight in all the proposed improvements.
However, the smallest value of the normalised weights corresponds to the improvement in lower electricity prices at recharging points, with a value of 10.8, so this represents a 6.9% weight in the improvements.
The other improvements are in the range of these two proposed improvements, with a percentage of weight with little difference between the sixth and seventh priority improvements.
On the other hand, the relative impact of improvements on the satisfaction of customer requirements, the correlation matrix (coloured light yellow in
Figure 21), is one of the key elements of the application of the QFD methodology, as it communicates the correlation of customer requirements with the various improvements in customer satisfaction.
In this matrix, it can be seen how in several questions, three of the proposed improvements have a strong correlation with the same requirement, which is a positive value to highlight in the house of quality.
7. Discussion
In general, it can be seen in
Figure 24,
Figure 26, and
Figure 28 that more than half of the respondents have a positive assessment of the implementation of EVs. Despite the fact that the respondents belong to completely different groups, in terms of age, profession, level of studies, etc., the majority tendency is the same, i.e., they are in favour of or believe the introduction of EVs in the market to be useful.
Furthermore, according to
Figure 29 and
Figure 30, there is a majority of questions whose most frequent mode values are at or above 3. With regard to these results, the same conclusions can be drawn as above.
However, with respect to the results obtained in the quality house for the market deployment of the electric vehicle, different conclusions can be drawn for each proposed improvement.
It can be seen how the integration of the quality required by the user has priority over the other improvements, as was to be expected. In order to be able to implement this, it is necessary to have permanent knowledge of the degree of customer satisfaction with respect to the required quality and the expected quality. This is the reason why this work has been carried out, as initially, we were looking for publications on the application of the QFD method in the electric vehicle, and we did not find anything.
However, the second point to be addressed is the improvement in the capacity and reliability of the Spanish electricity grid. If EV adoption continues to expand in Spain, there will be a significant increase in electricity demand, necessitating enhancements to grid stability and the quality of power supply. It is important to note that the transportation sector in Spain accounts for approximately 40% of the country’s total energy consumption.
Furthermore, EVs can serve as strategic assets in optimising the efficiency of the electricity system. Beyond product-level quality improvements, QFD has also been applied to broader sustainability challenges associated with EVs, such as battery waste processing and policy prioritisation, demonstrating its versatility in guiding environmentally responsible strategies [
26]. By leveraging vehicle-to-grid (V2G) technology, EVs could help balance fluctuations in energy demand, reducing the disparity between peak and off-peak periods [
27]. This synergy between electric mobility and the power grid could contribute to a more resilient and efficient energy infrastructure.
Thirdly, it is necessary to increase investment in research and development (R&D) by EV manufacturers to further improve key aspects such as cost, performance, and battery efficiency, ensuring a stronger market presence. The continuous development of new technologies will help enhance EV adoption and improve overall competitiveness in the automotive sector.
Furthermore, the production and maintenance of EVs generate employment opportunities in sustainable sectors, aiding the transition to a low-carbon economy. Strengthening R&D efforts will not only enhance vehicle performance but also contribute to long-term economic growth and energy sustainability.
The integration of a distributed network is very relevant for such a deployment, as one of the problems that customers may encounter is, where do you plug in? This is because most of the population probably lives in multi-storey dwellings and not everyone has a place to plug in their car.
It would also be a very efficient solution to the current range problems of these vehicles.
Another aspect addressed is the intelligent management of recharging, as these systems are capable of charging the batteries when energy is available and more economical, having the following series of characteristics: capable of identifying the availability of charging credit at any point, capable of discriminating between different recharging points in the same car park, and capable of recharging in a reduced amount of time, as they are more energy-efficient models. Thus, there would be great customer-oriented advantages, which are necessary for greater success with respect to conventional combustion vehicles.
These systems would also contribute to providing alternatives to traditional energy sources with environmentally friendly solutions, a very important factor to consider with regard to the planet.
The sixth improvement is the use of high-capacity batteries, since existing batteries are heavy, with low autonomy, and are difficult to recharge. This is a subject on which a lot of research is being carried out to improve these disadvantages, moreover, regarding emissions with battery production and recycling concerns.
An important factor for the successful implementation of the electric vehicle is to have economic advantages over conventional vehicles, since, for it to be a competitive product in the market, it must have an affordable price for potential buyers. Currently, in Spain, there are aids and subsidies provided by public entities, such as the Moves III Plan [
28], which can provide direct aid of up to EUR 7000 for EVs.
However, in order to benefit from this aid, the buyer must go to a dealer or shop that is a member of the Moves III Project, so if the customer wants to buy a vehicle that is not included in the catalogue drawn up by the IDAE, he/she cannot benefit from this aid.
However, it can be seen in
Figure 28 that the chosen sample is aware of the use of renewable energies, as all three groups see it as necessary, even if it means a disadvantage in the vehicle’s performance.
The planet’s energy needs are increasing every day, and energy sources are limited. In the medium and long term, global warming will cause serious disruptions to the way of life on the planet, which is why CO2 emission levels must be reduced, and why the use of renewable energies is necessary.
Of course, lower electricity prices at charging points would be an attractive factor for the purchase of the customer’s vehicle. The price of charging should not be excessive if the electric vehicle is to be a competitive product in the automotive market.
On the other hand,
Figure 28 shows the results of the different topics that were less relevant for the customers in the survey. For example, the evaluation of the existing information, in general, on EVs. At present, there are few advertising campaigns that encourage the public to buy EVs or provide information about EVs.
8. Conclusions
This research presents a comprehensive evaluation of consumer perceptions and technological requirements for the market deployment of electric vehicles using the QFD methodology. This study confirms that consumers generally support the implementation of EVs, identifying key improvement areas that manufacturers and policymakers must address to accelerate market penetration.
From a practical perspective, EV manufacturers should focus on continuous quality monitoring based on user feedback, advance battery technologies to improve autonomy, reduce recharging times, and collaborate with governments to expand affordable, distributed charging networks. Policy measures should also aim to simplify and broaden access to purchase incentives, making EVs a more competitive alternative to conventional vehicles.
However, this study has certain limitations, including a geographically limited sample focused on Spain and relatively small group sizes, which may constrain the generalizability of the results. Additionally, the cross-sectional design captures perceptions at a single point in time without tracking changes over the adoption lifecycle.
Future research should expand the demographic diversity of the sample, conduct longitudinal studies to analyse evolving consumer behaviour, and implement further stages of QFD, including the evaluation of technical specifications and benchmarking against competitor solutions. Moreover, the role of emerging technologies such as vehicle-to-grid (V2G) systems offers promising avenues for future exploration.
In conclusion, while challenges remain, the findings of this study underline the pivotal role that strategic innovation, infrastructure development, and user-centred design will play in shaping a sustainable and successful transition to electric mobility.


 ,
, 


