
Dynamic Closed-Loop Validation of a Hardware-in-the-Loop Testbench for Parallel Hybrid Electric Vehicles

 , ,
, ,  and
and
Abstract
1. Introduction and Motivation
2. Materials and Methods
2.1. Hardware-in-the-Loop Testbench Requirements
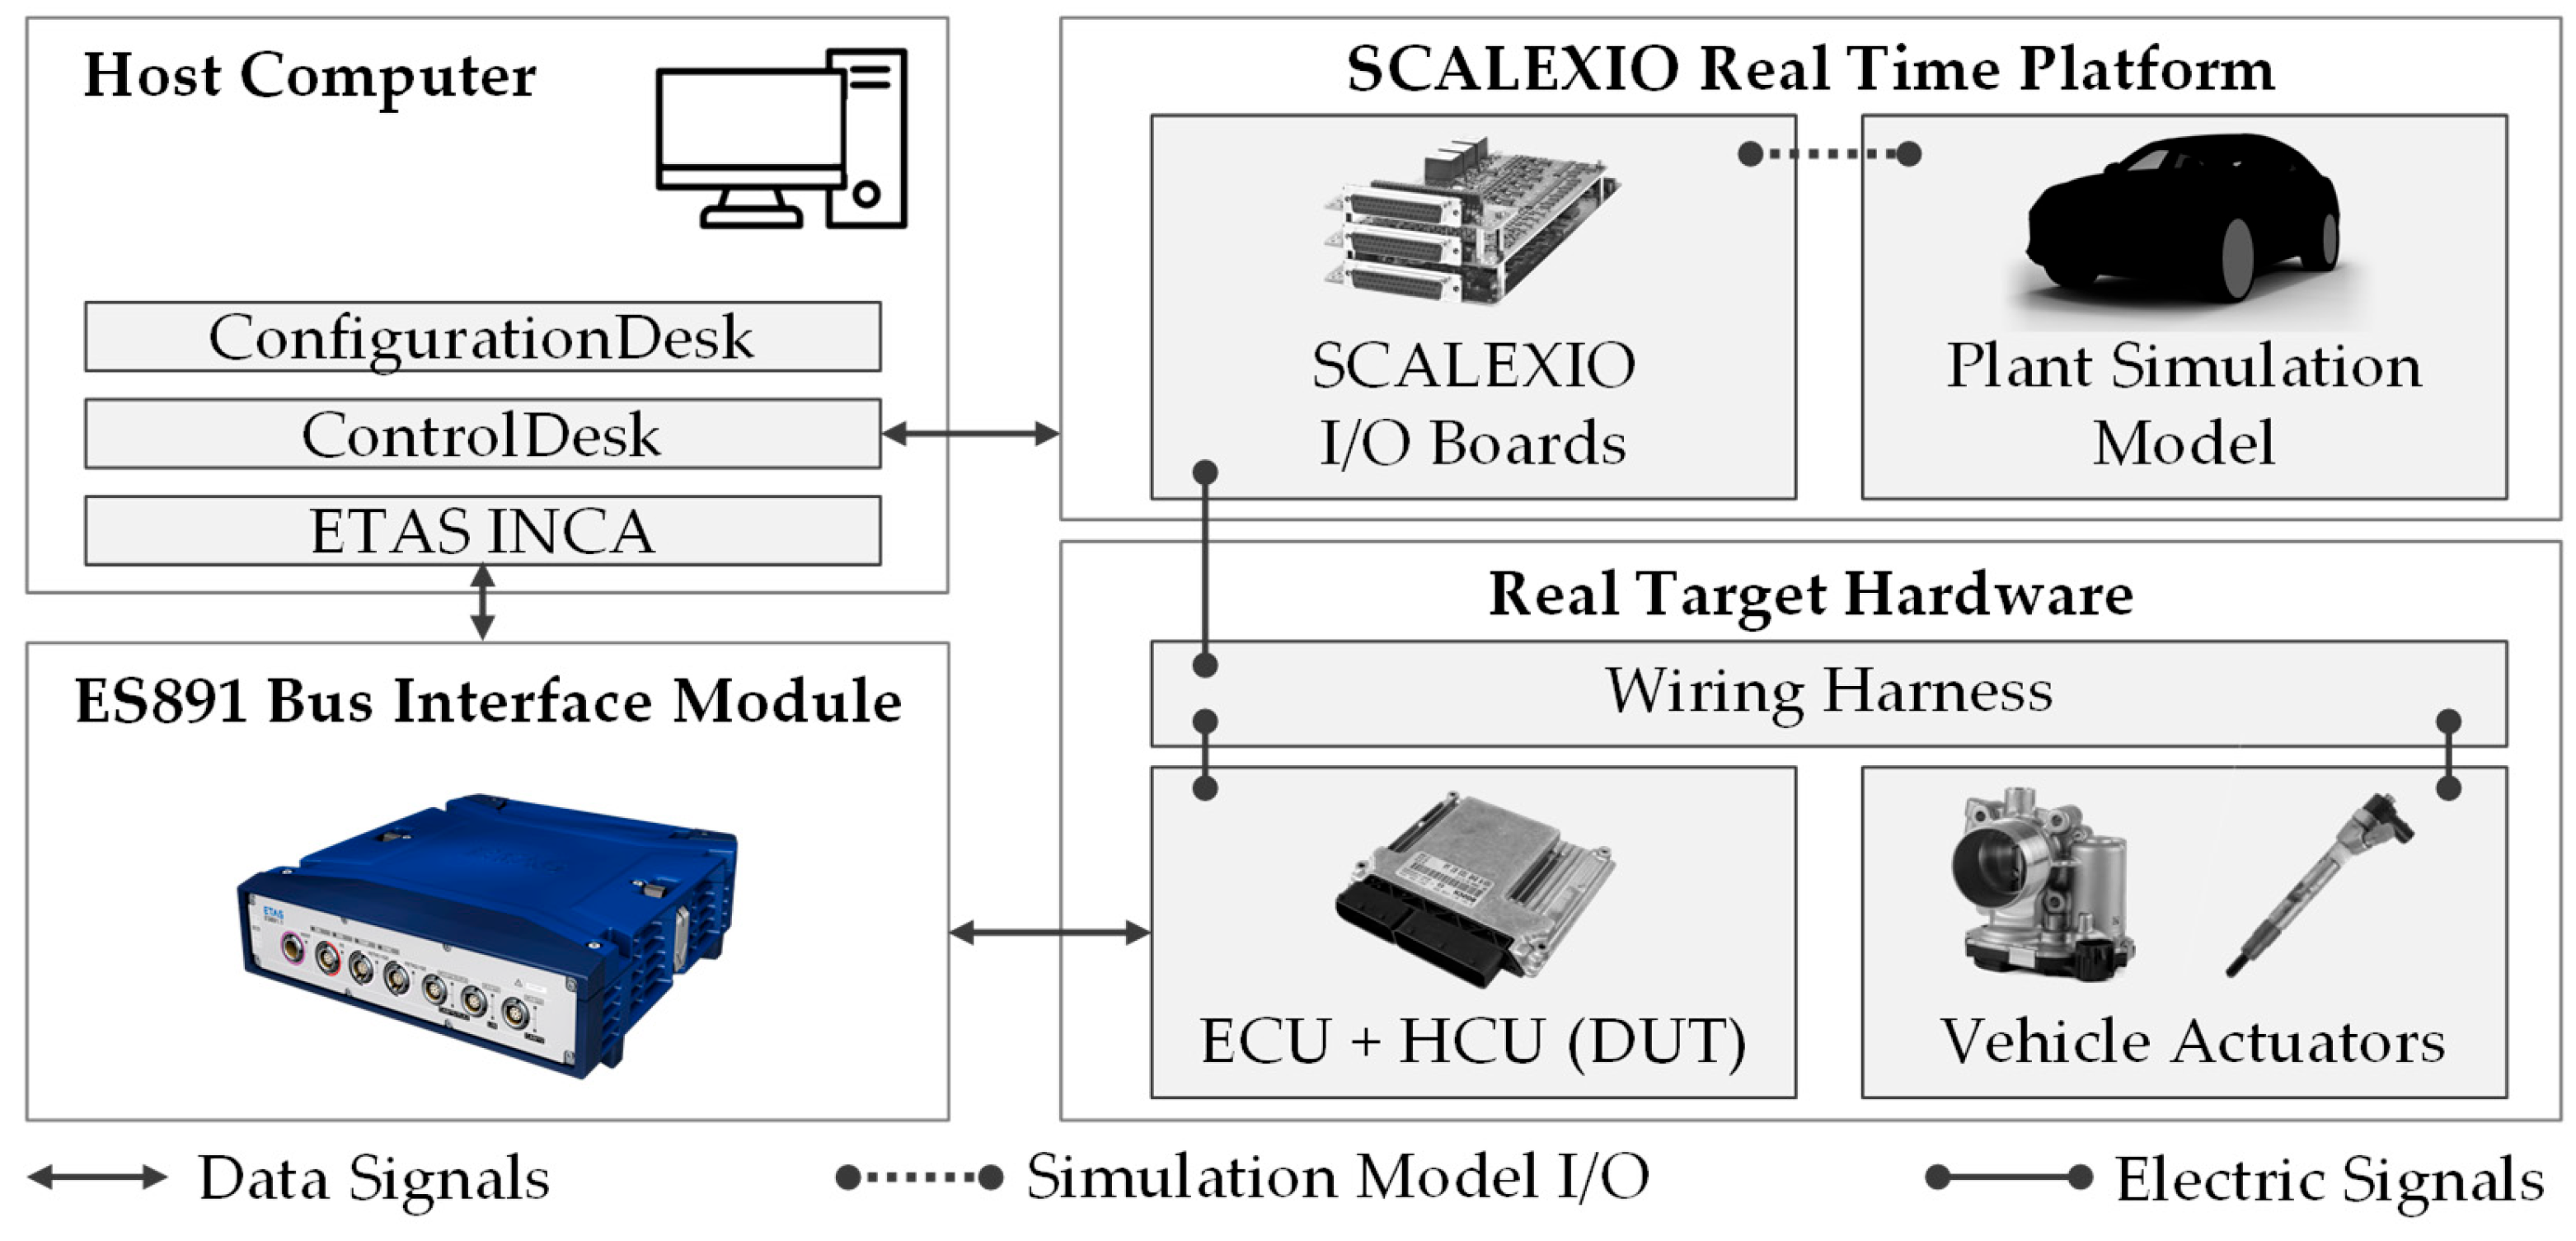
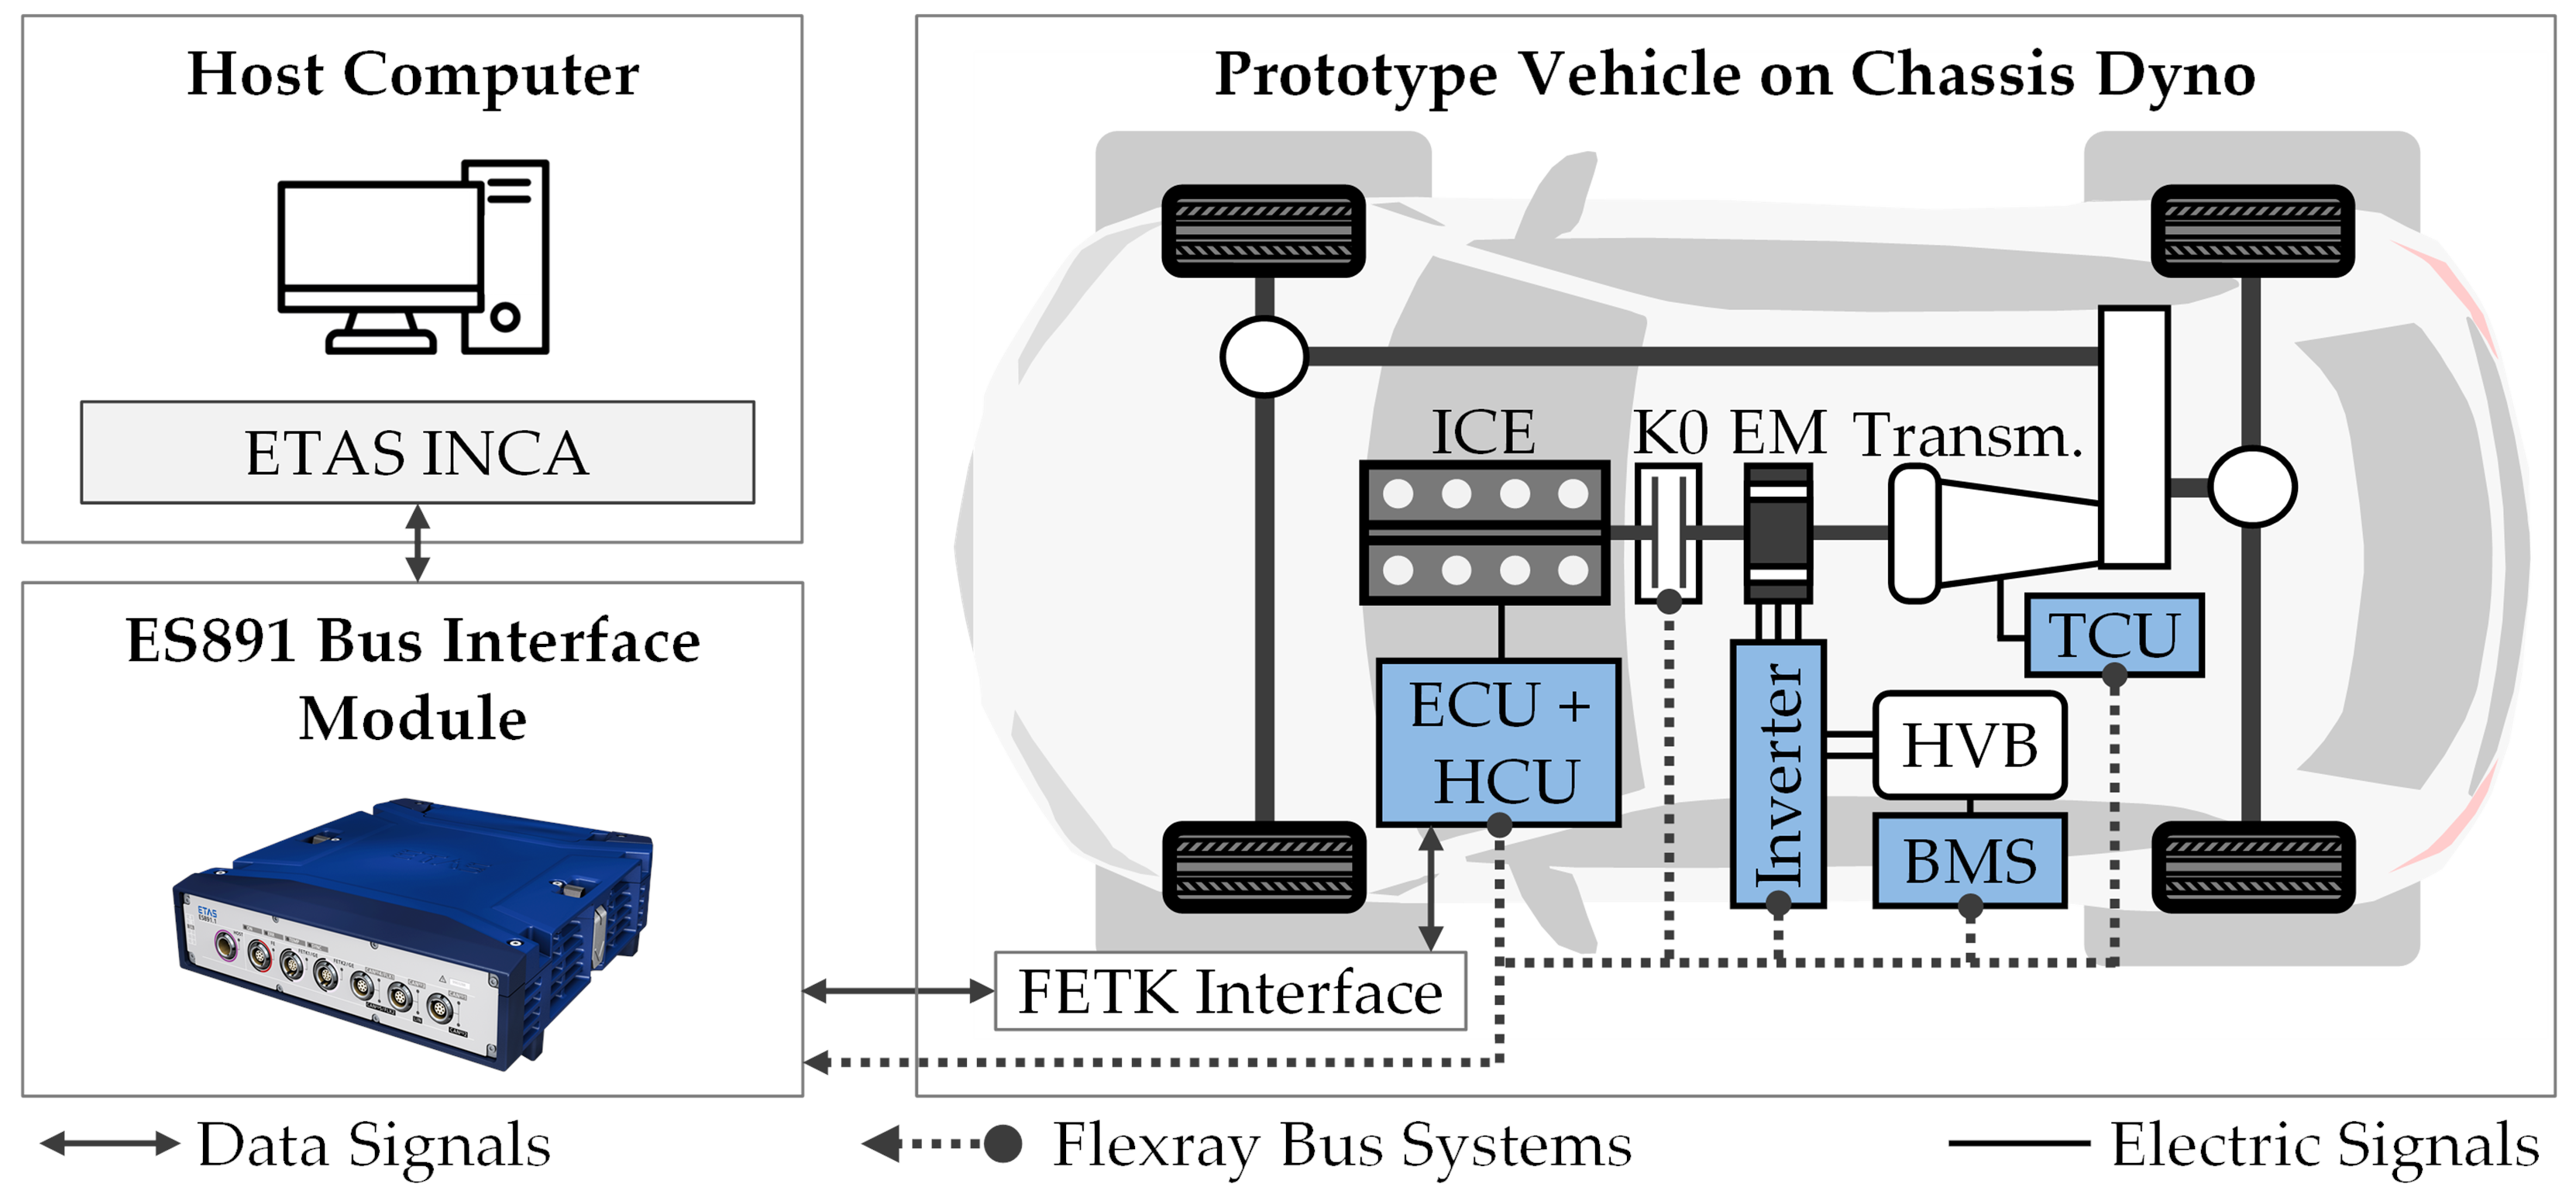
2.2. Test Vehicle and Developed Testbench Setup
- ICE start-stop coordination;
- HVB state of charge control;
- Charge torque determination.

| Vehicle Segment according to [35] | J—Sport Utility Vehicle (SUV) |
| Powertrain Topology | Plug-in hybrid, P2 configuration, all-wheel drive |
| Legislation | EU-6-AP |
| Vehicle Weight | 2500 kg |
| Power/Torque ICE | 455 kW/800 Nm |
| Power/Torque EM | 140 kW/480 Nm |
| Total Power/Torque Vehicle | 580 kW/950 Nm |
| HVB Capacity | 22 kWh |
3. Dynamic Closed-Loop Simulation Results
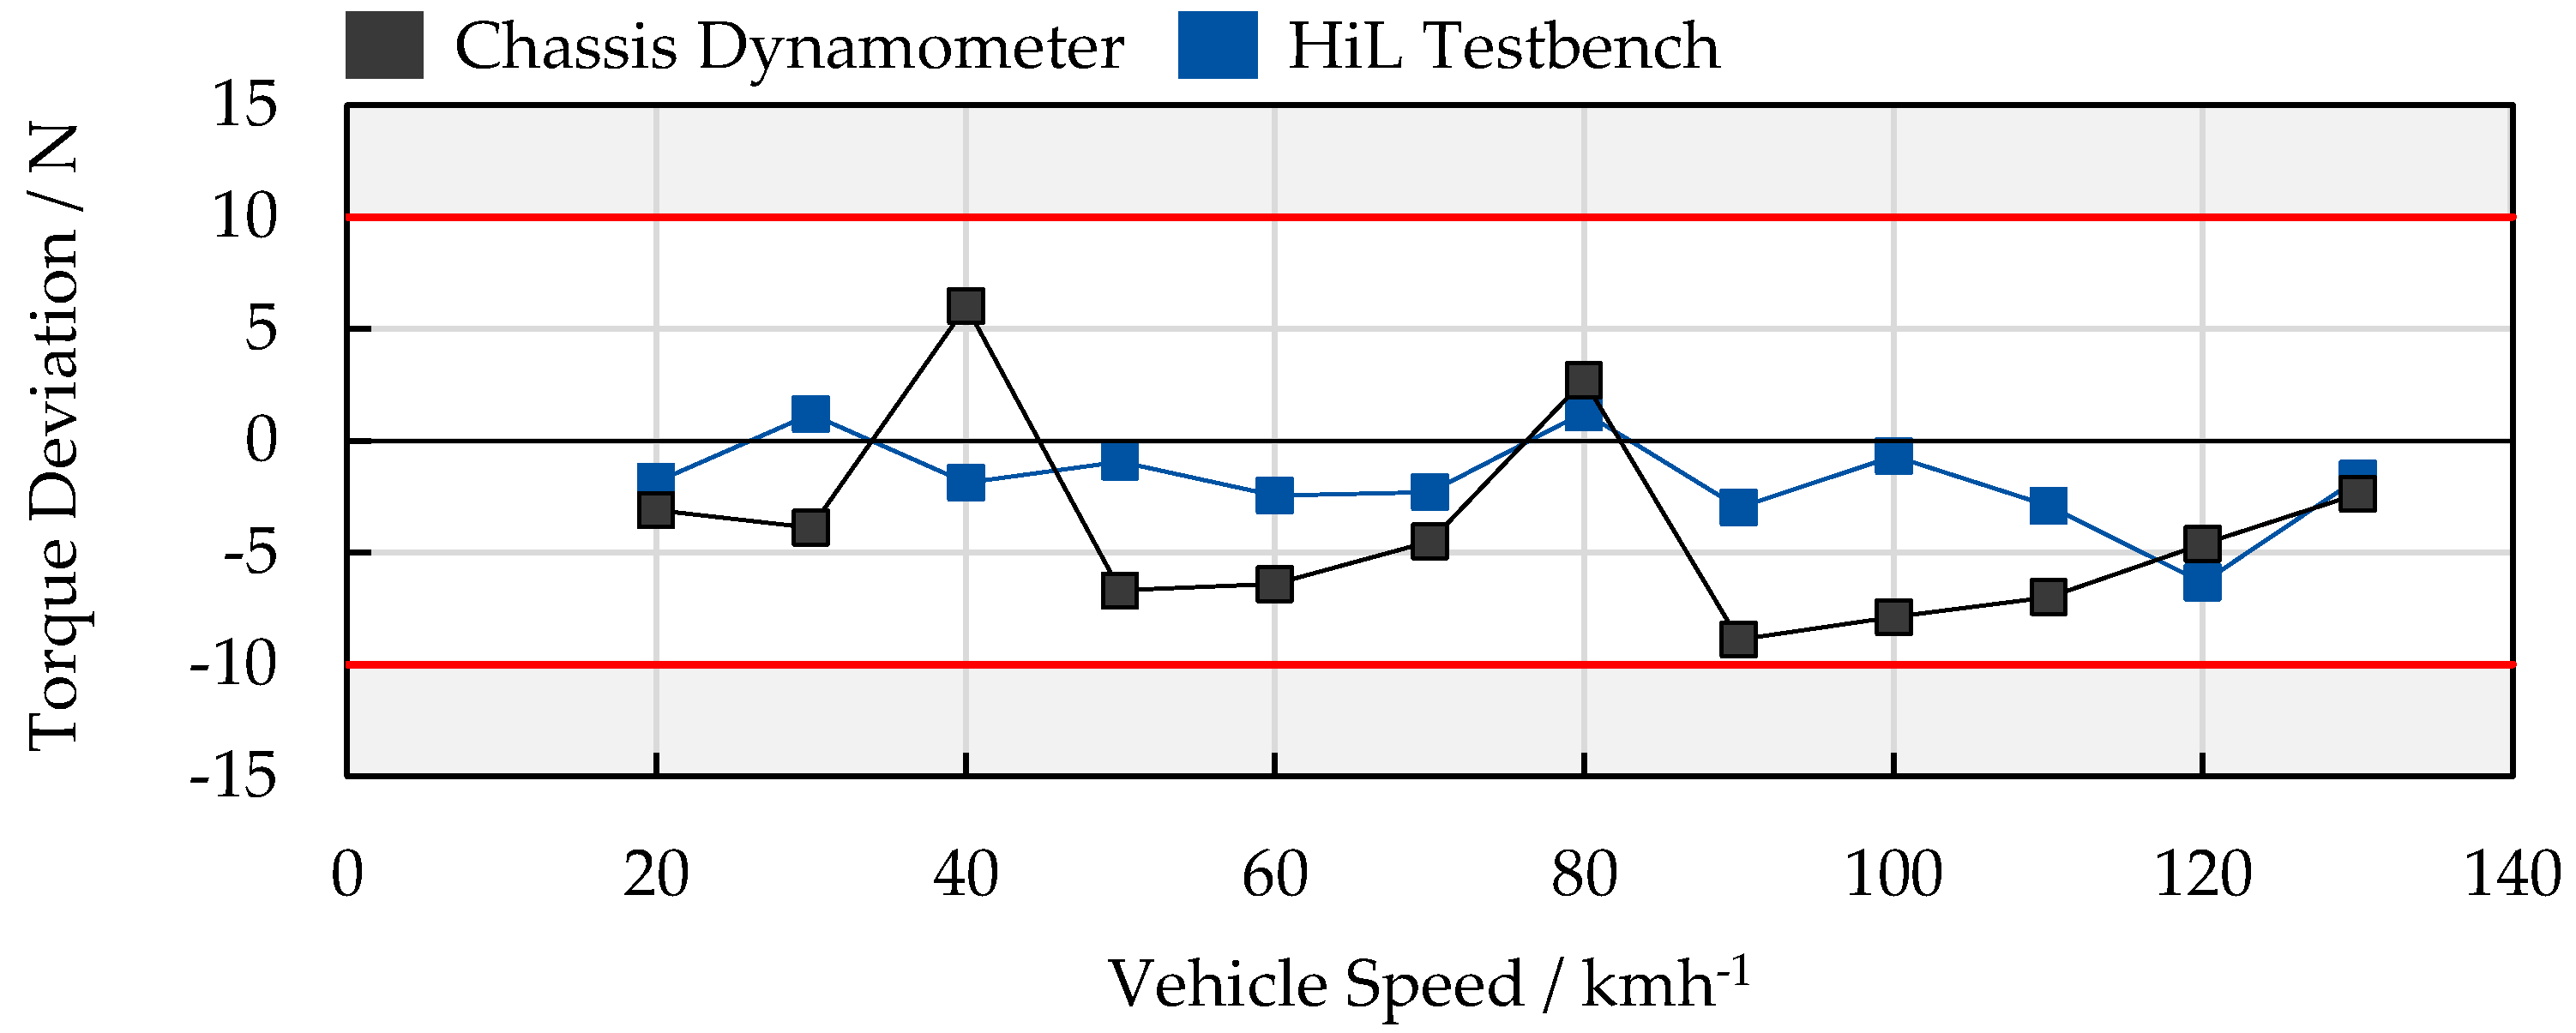
3.1. Chassis and Environment Simulation
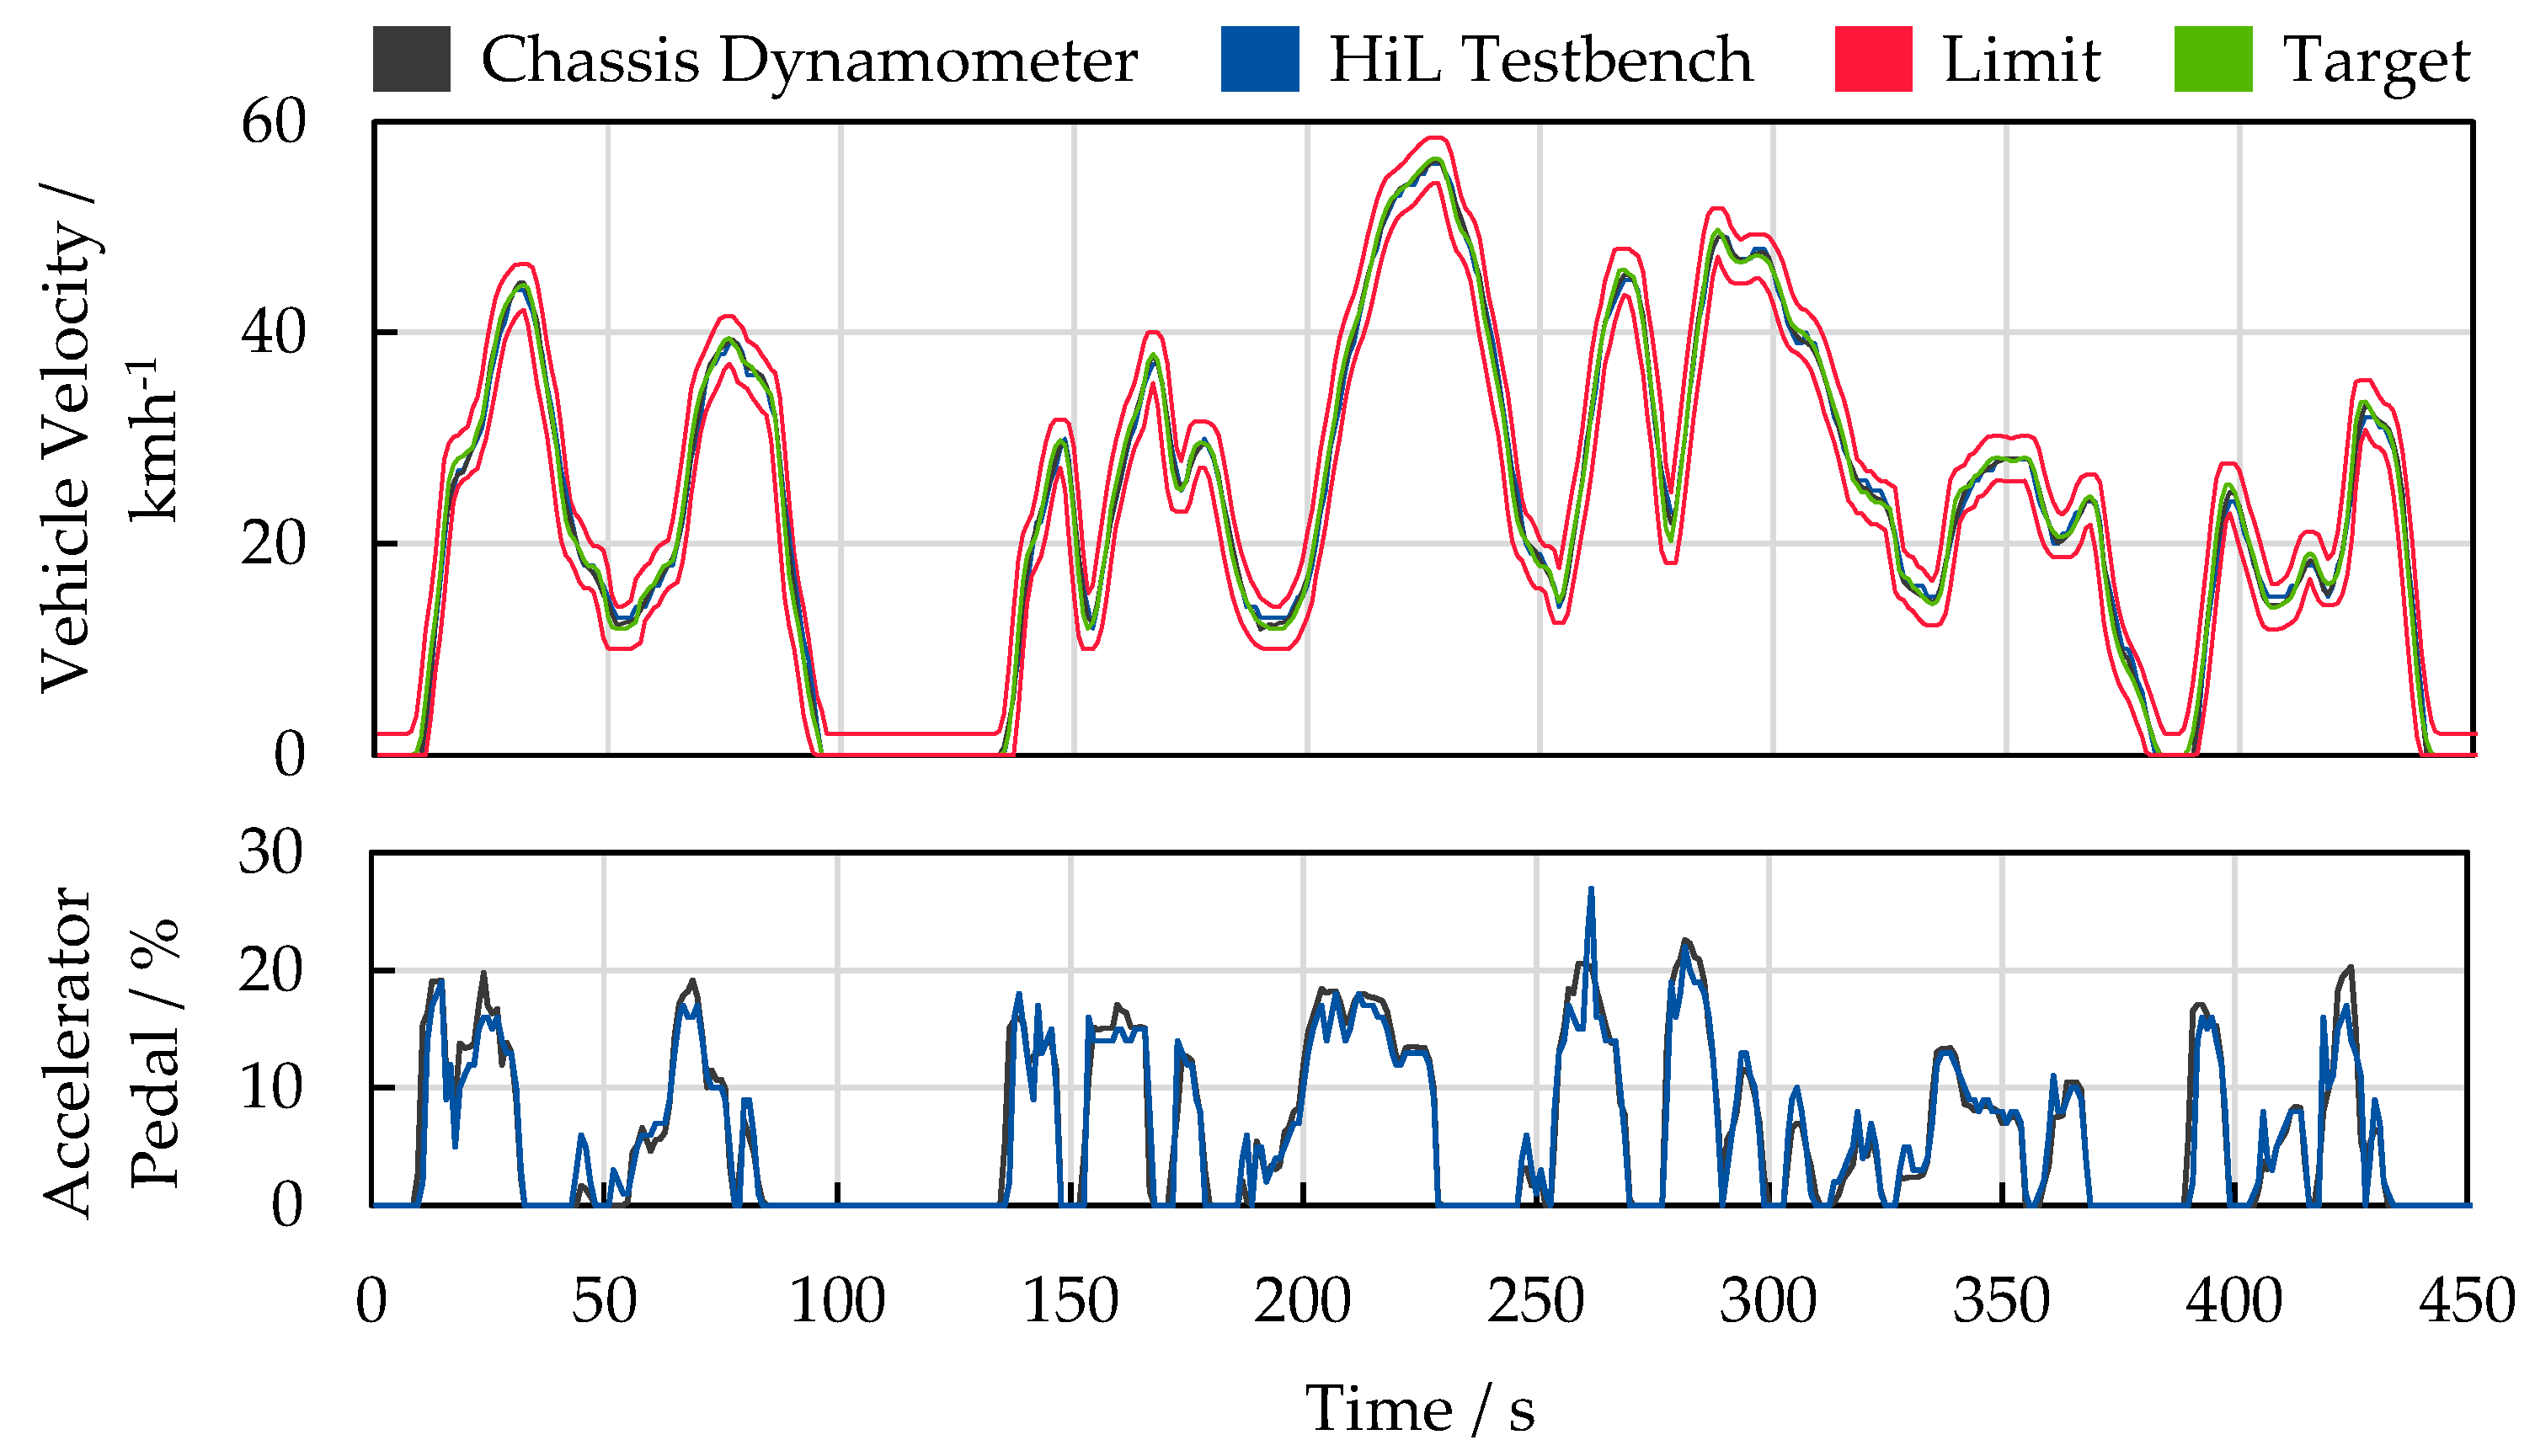
3.2. Driver Simulation
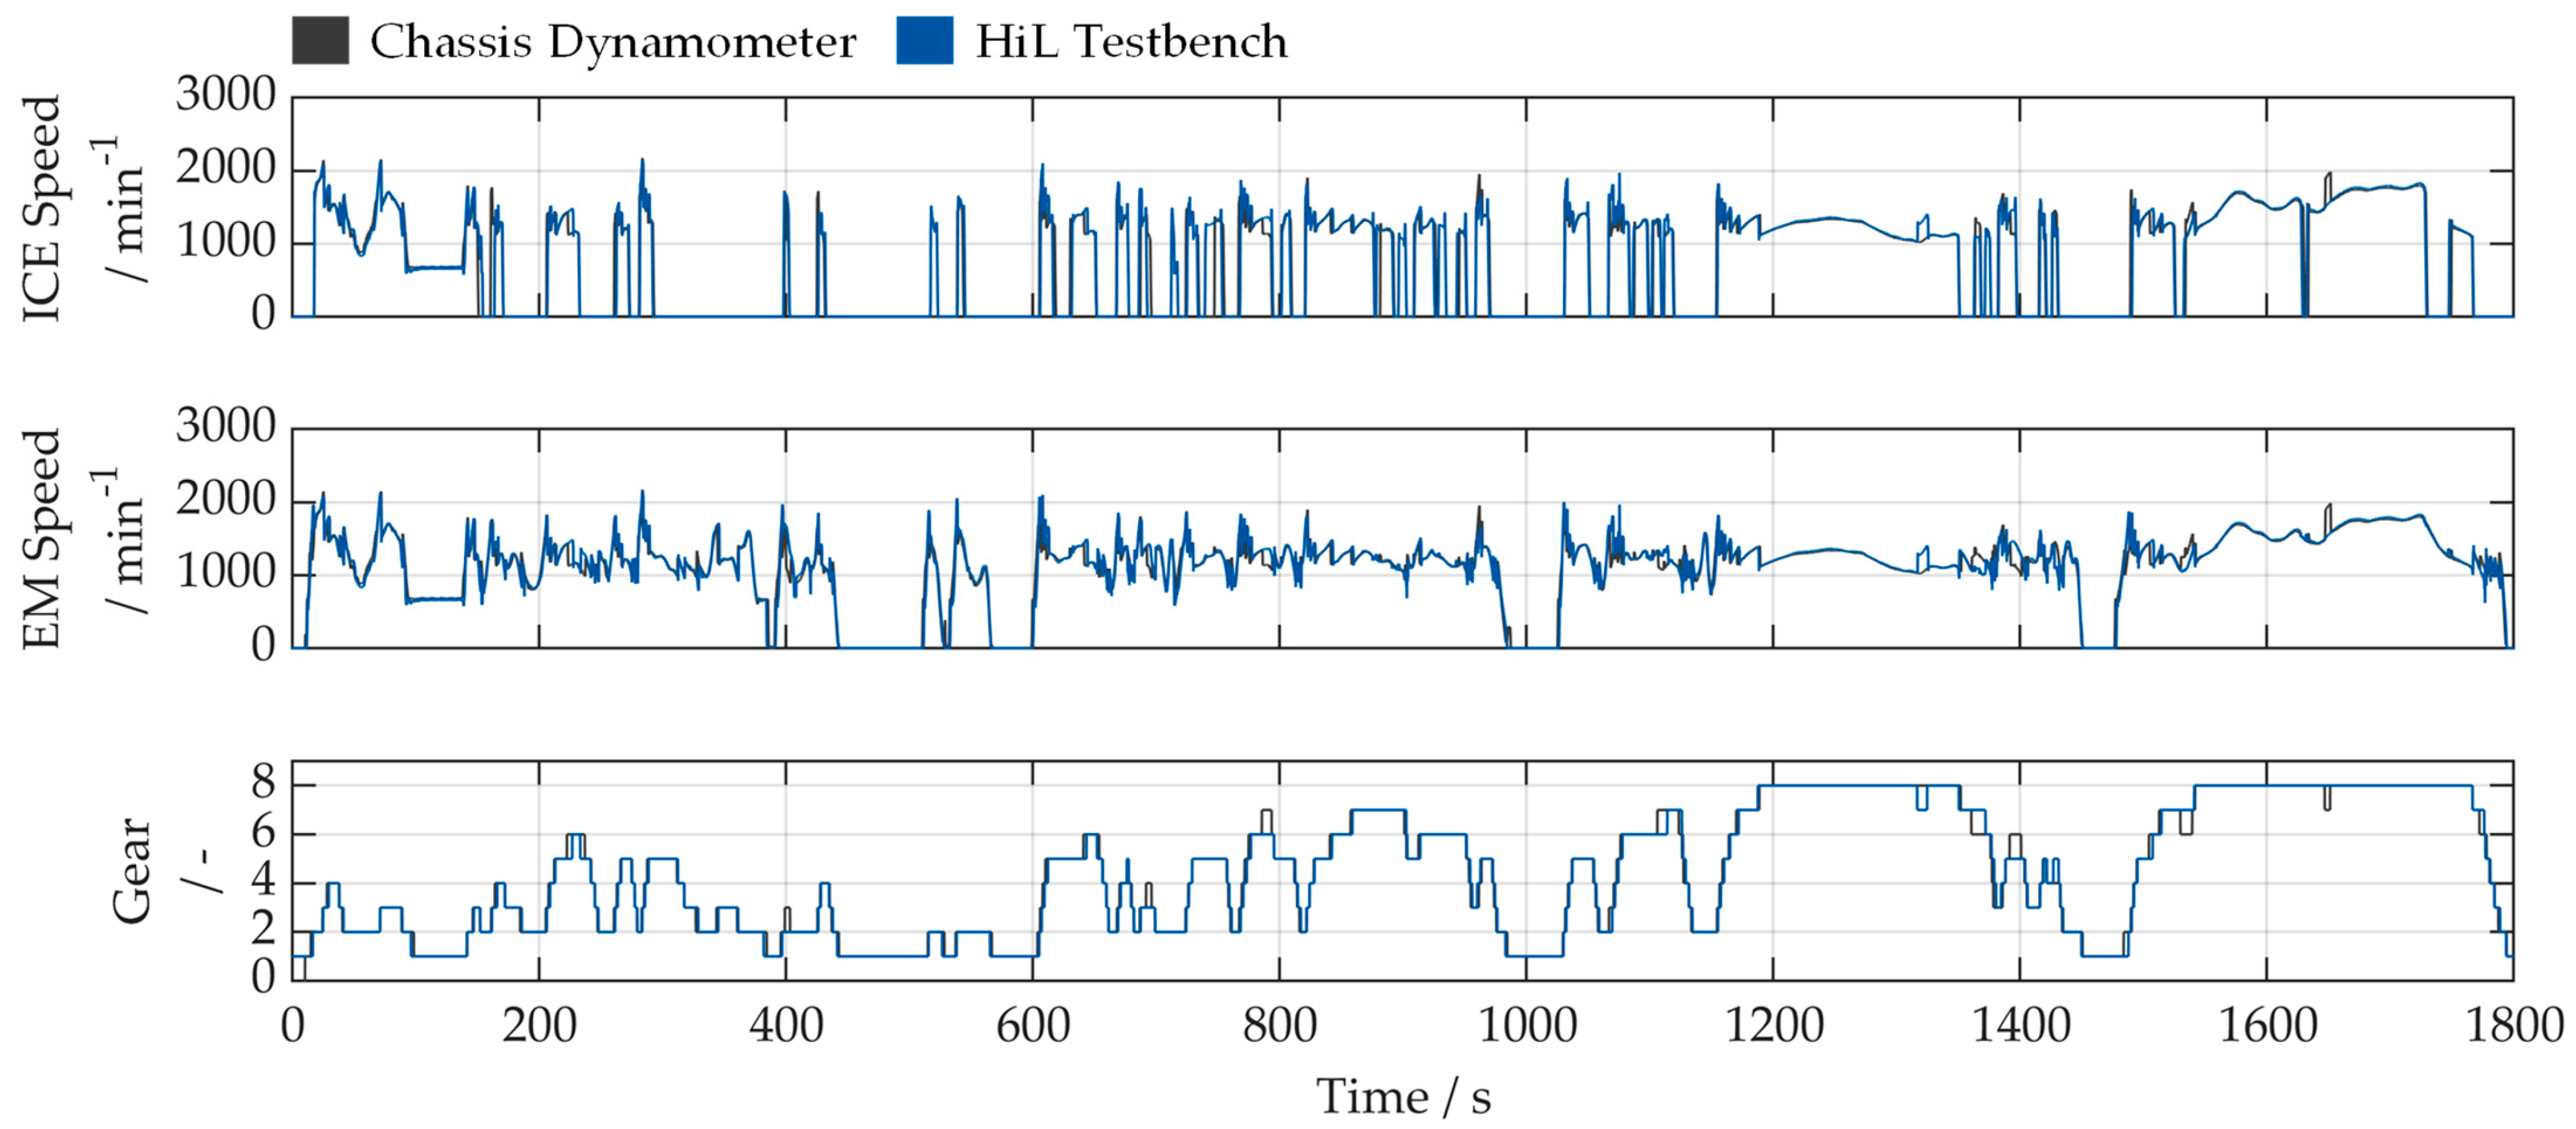
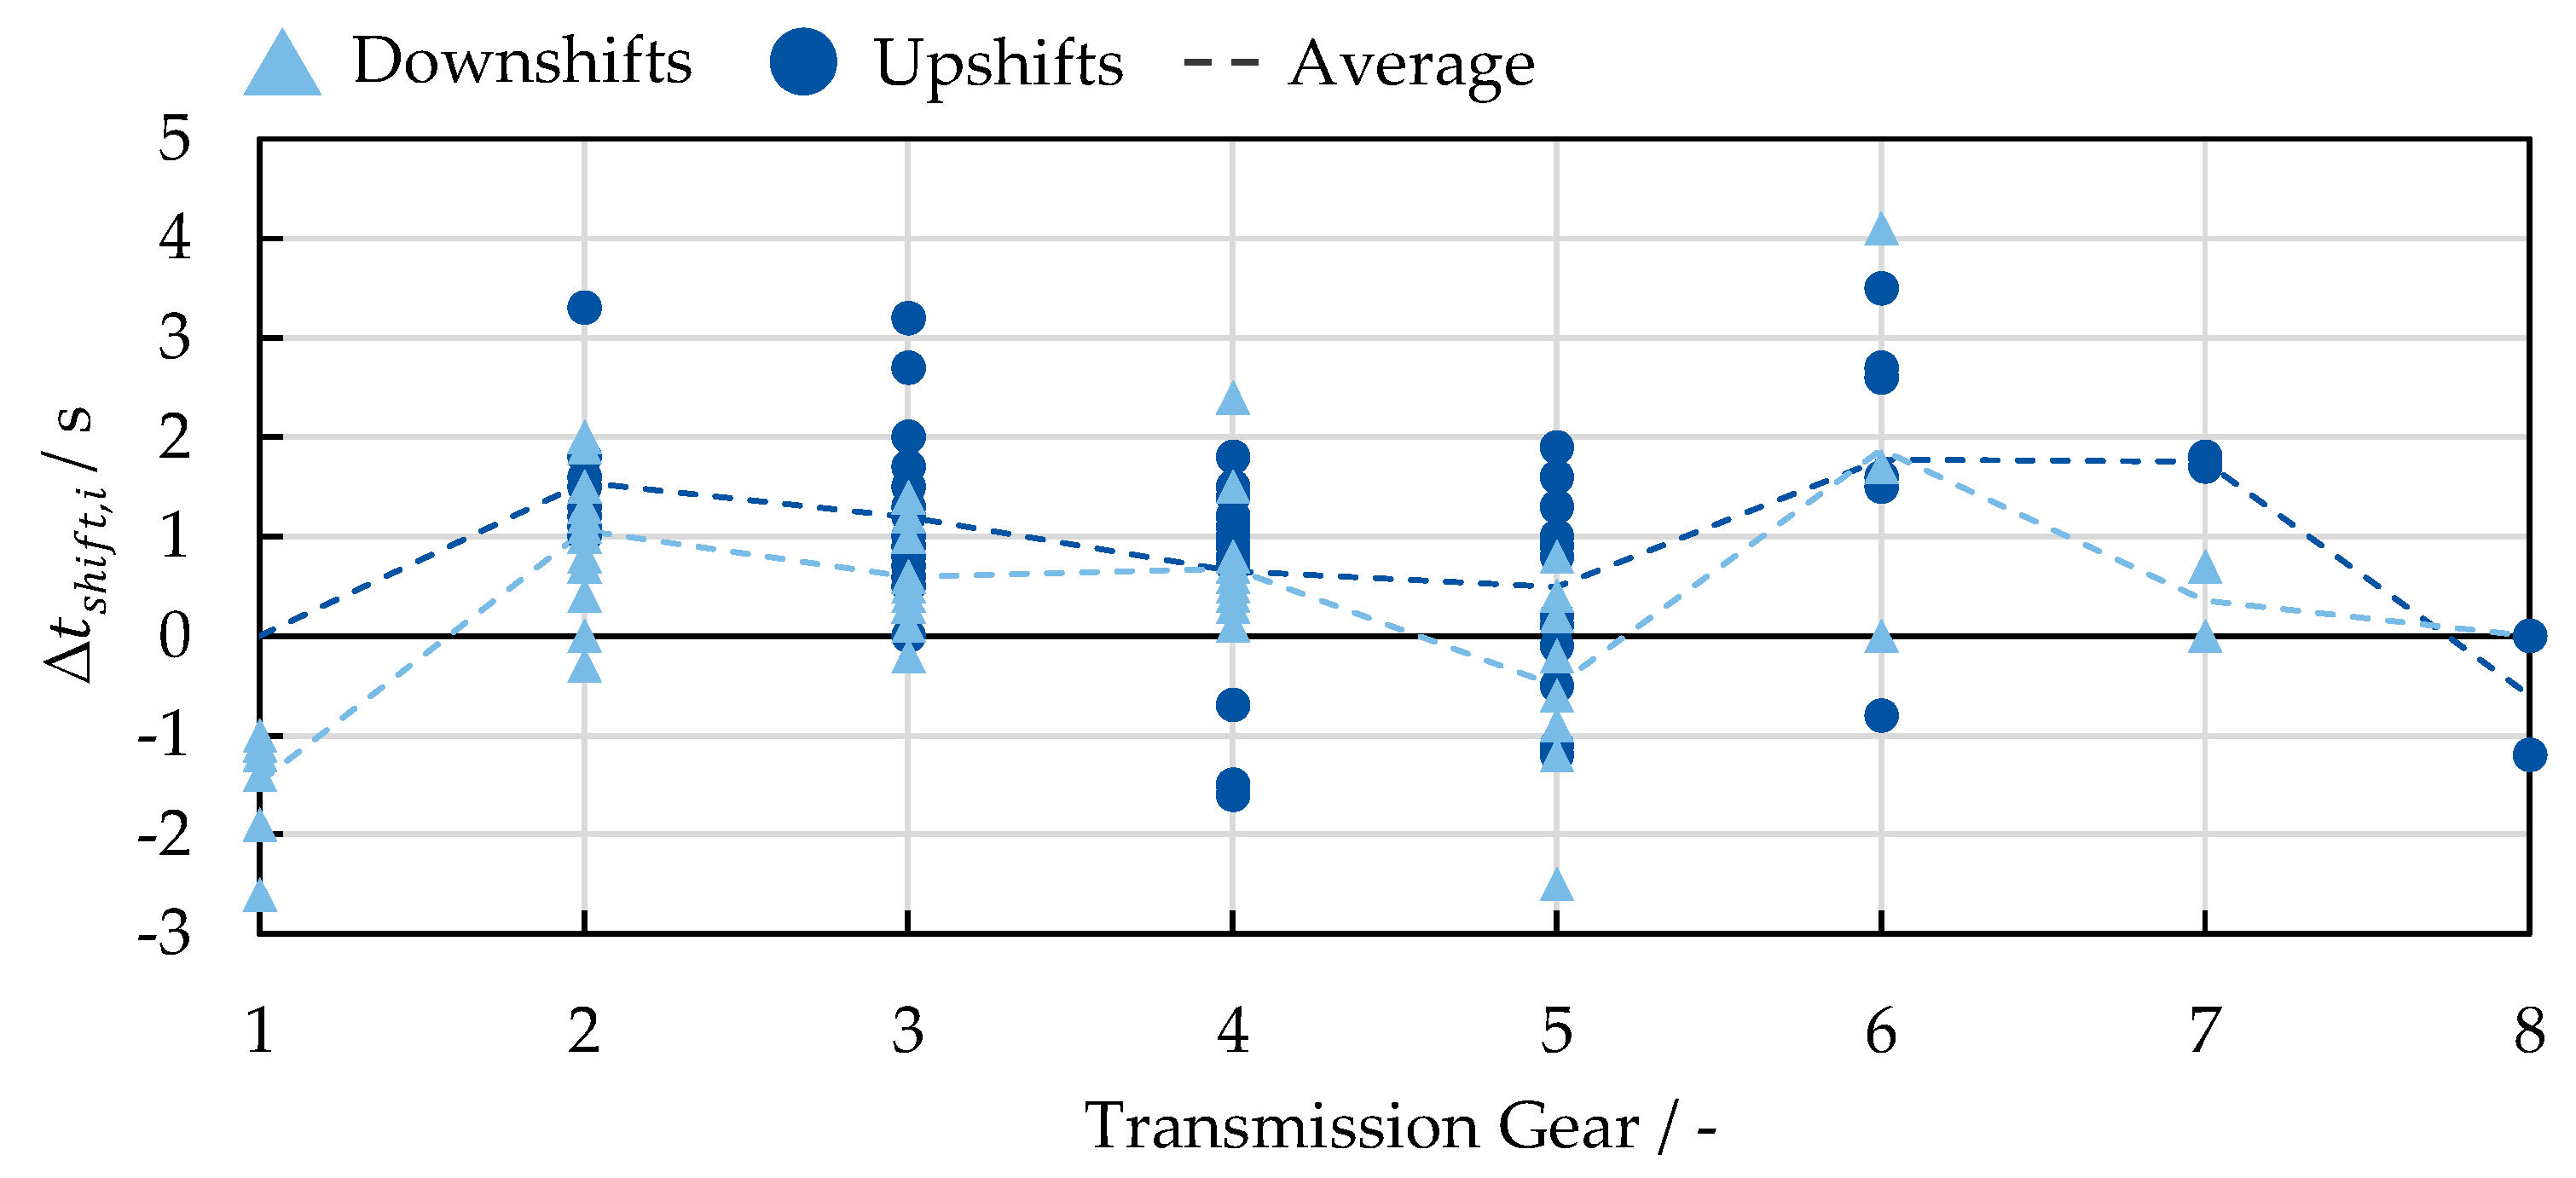
3.3. Transmission Simulation
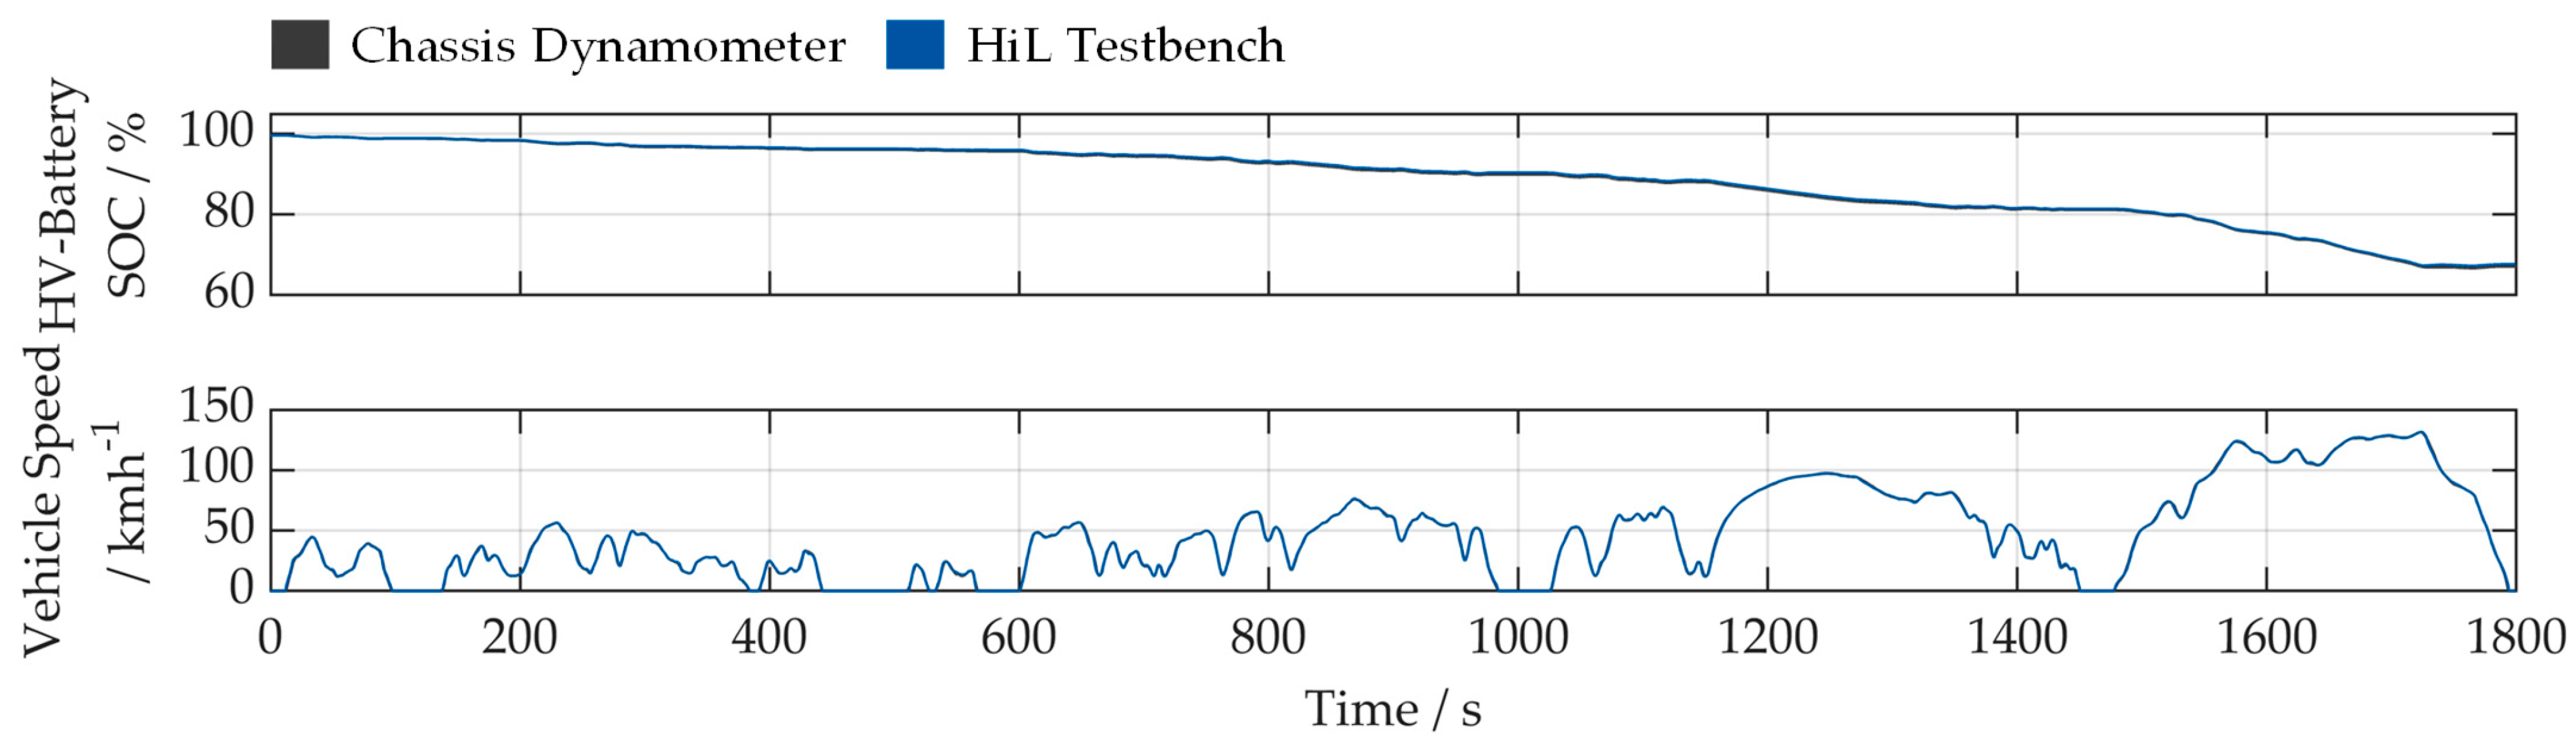
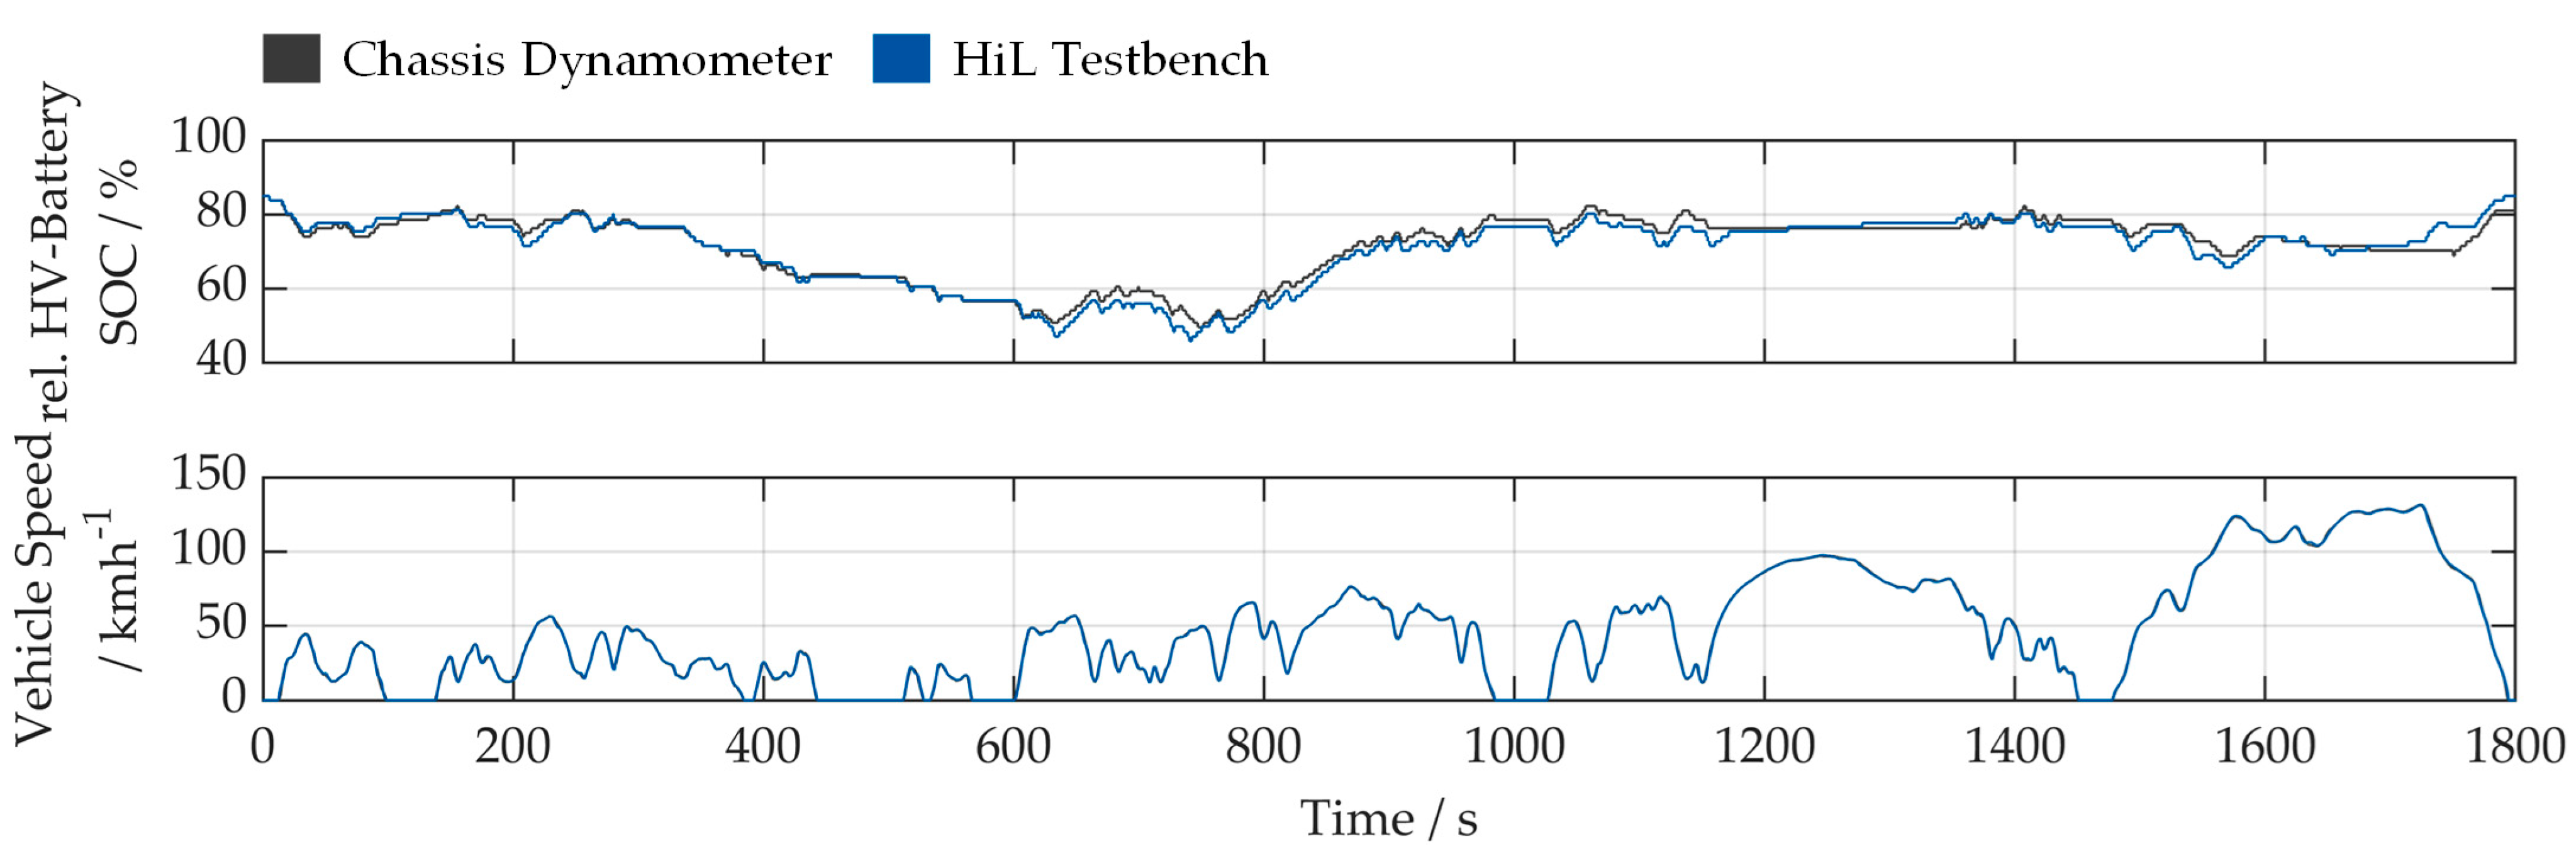
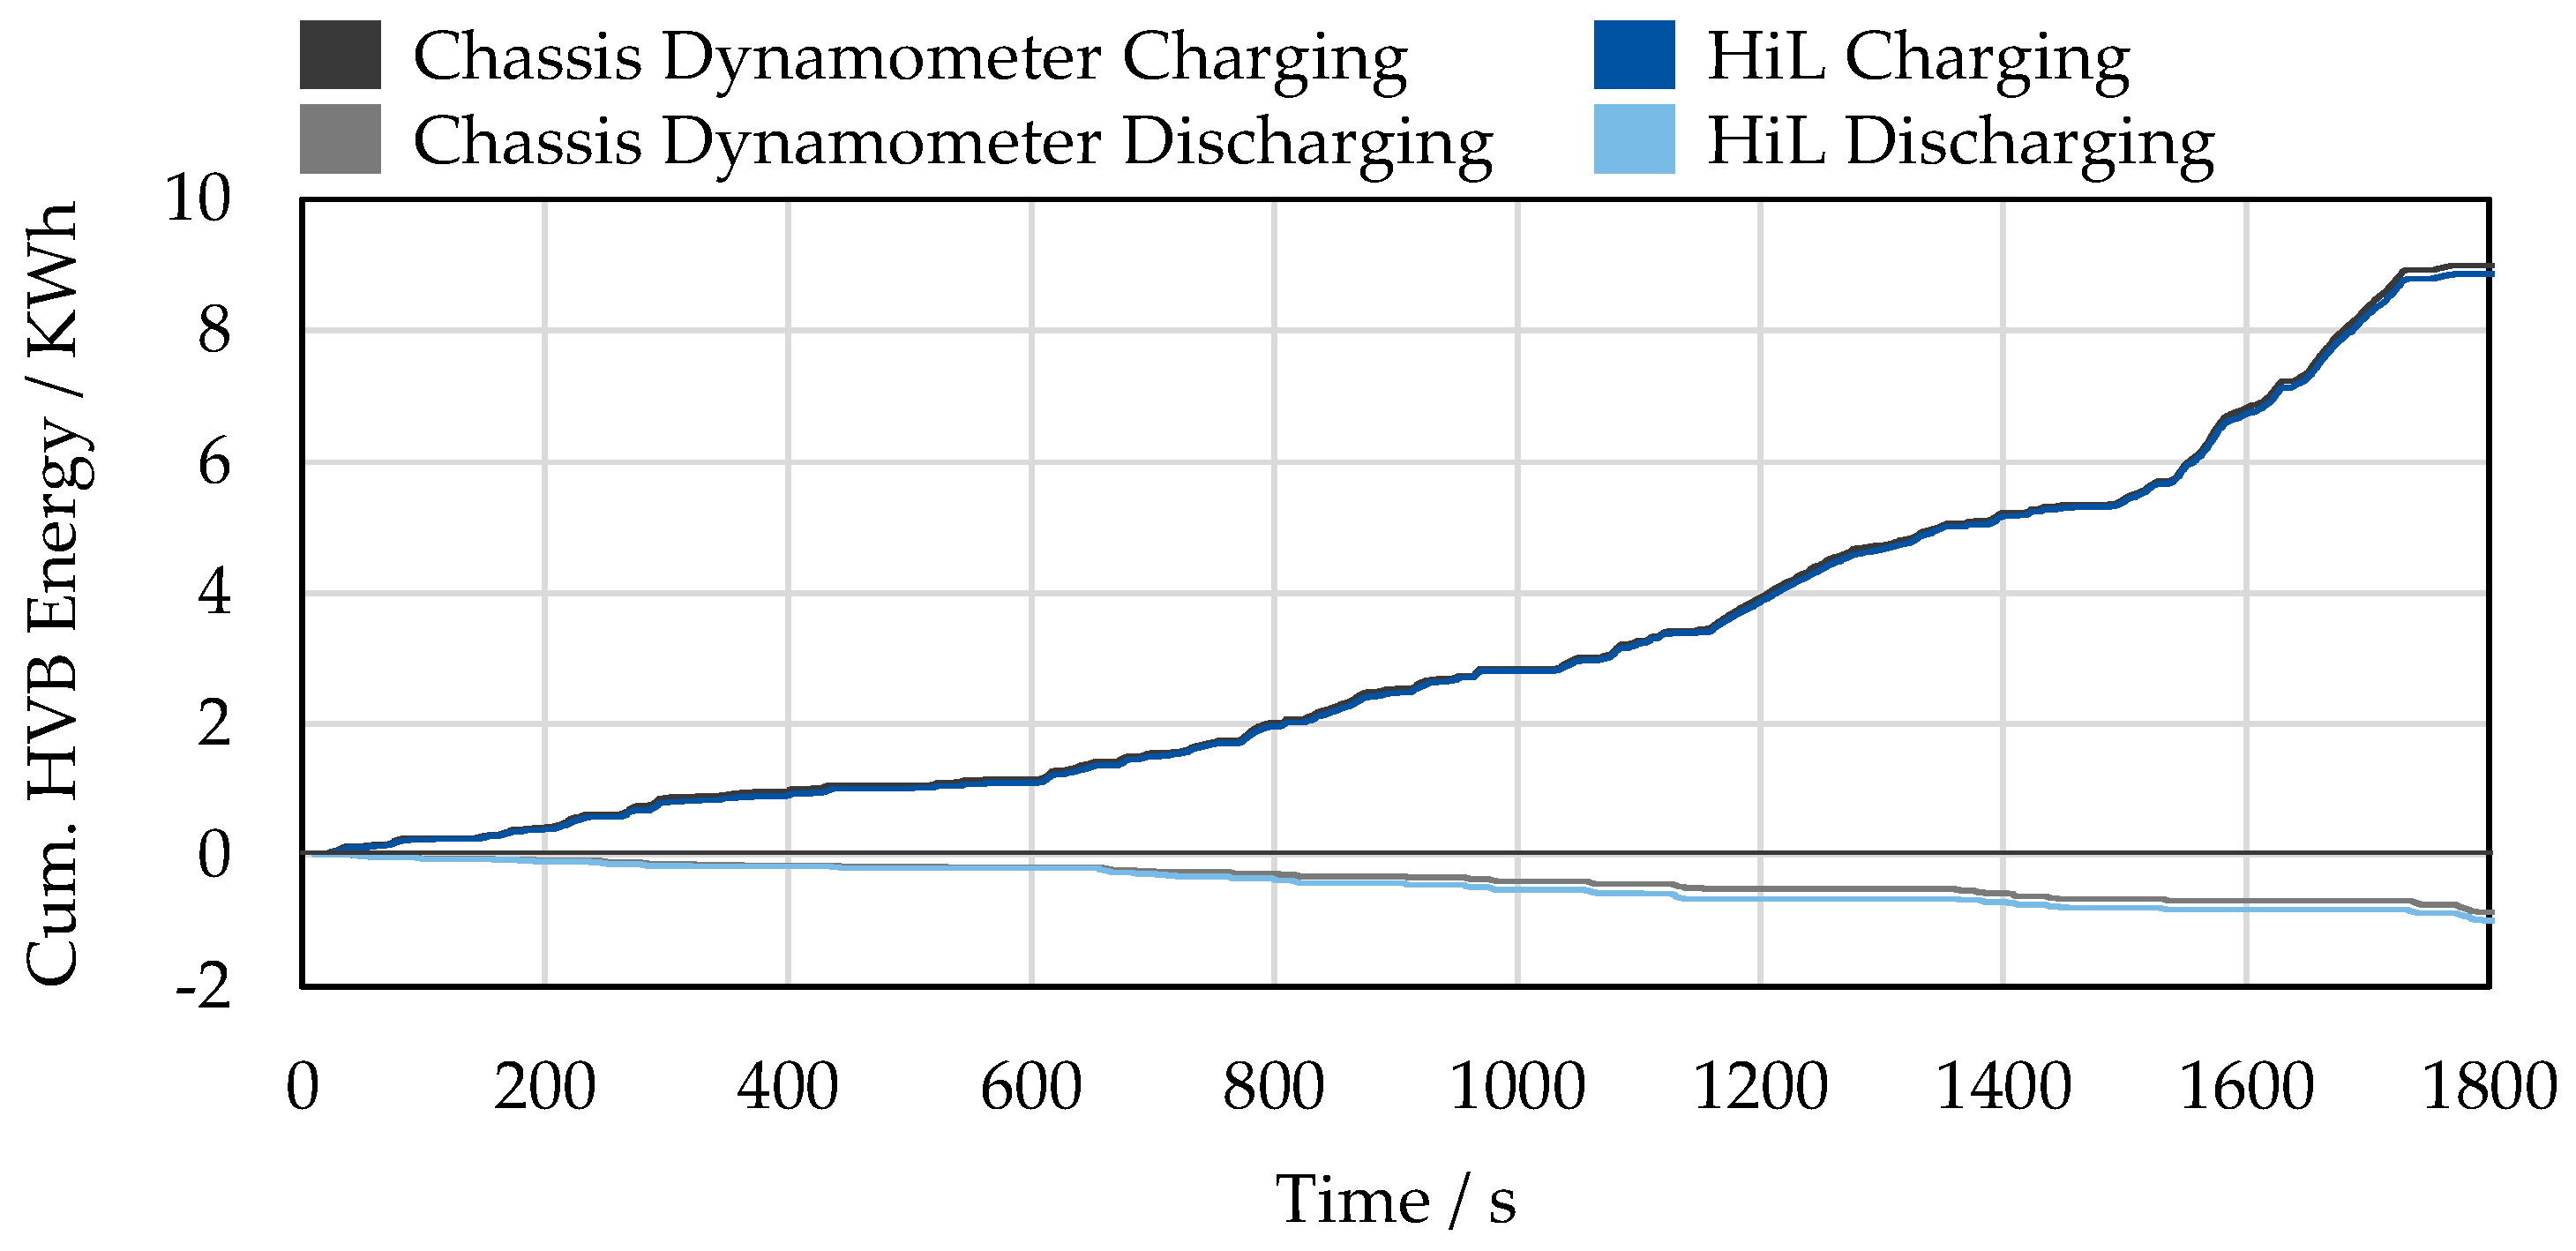
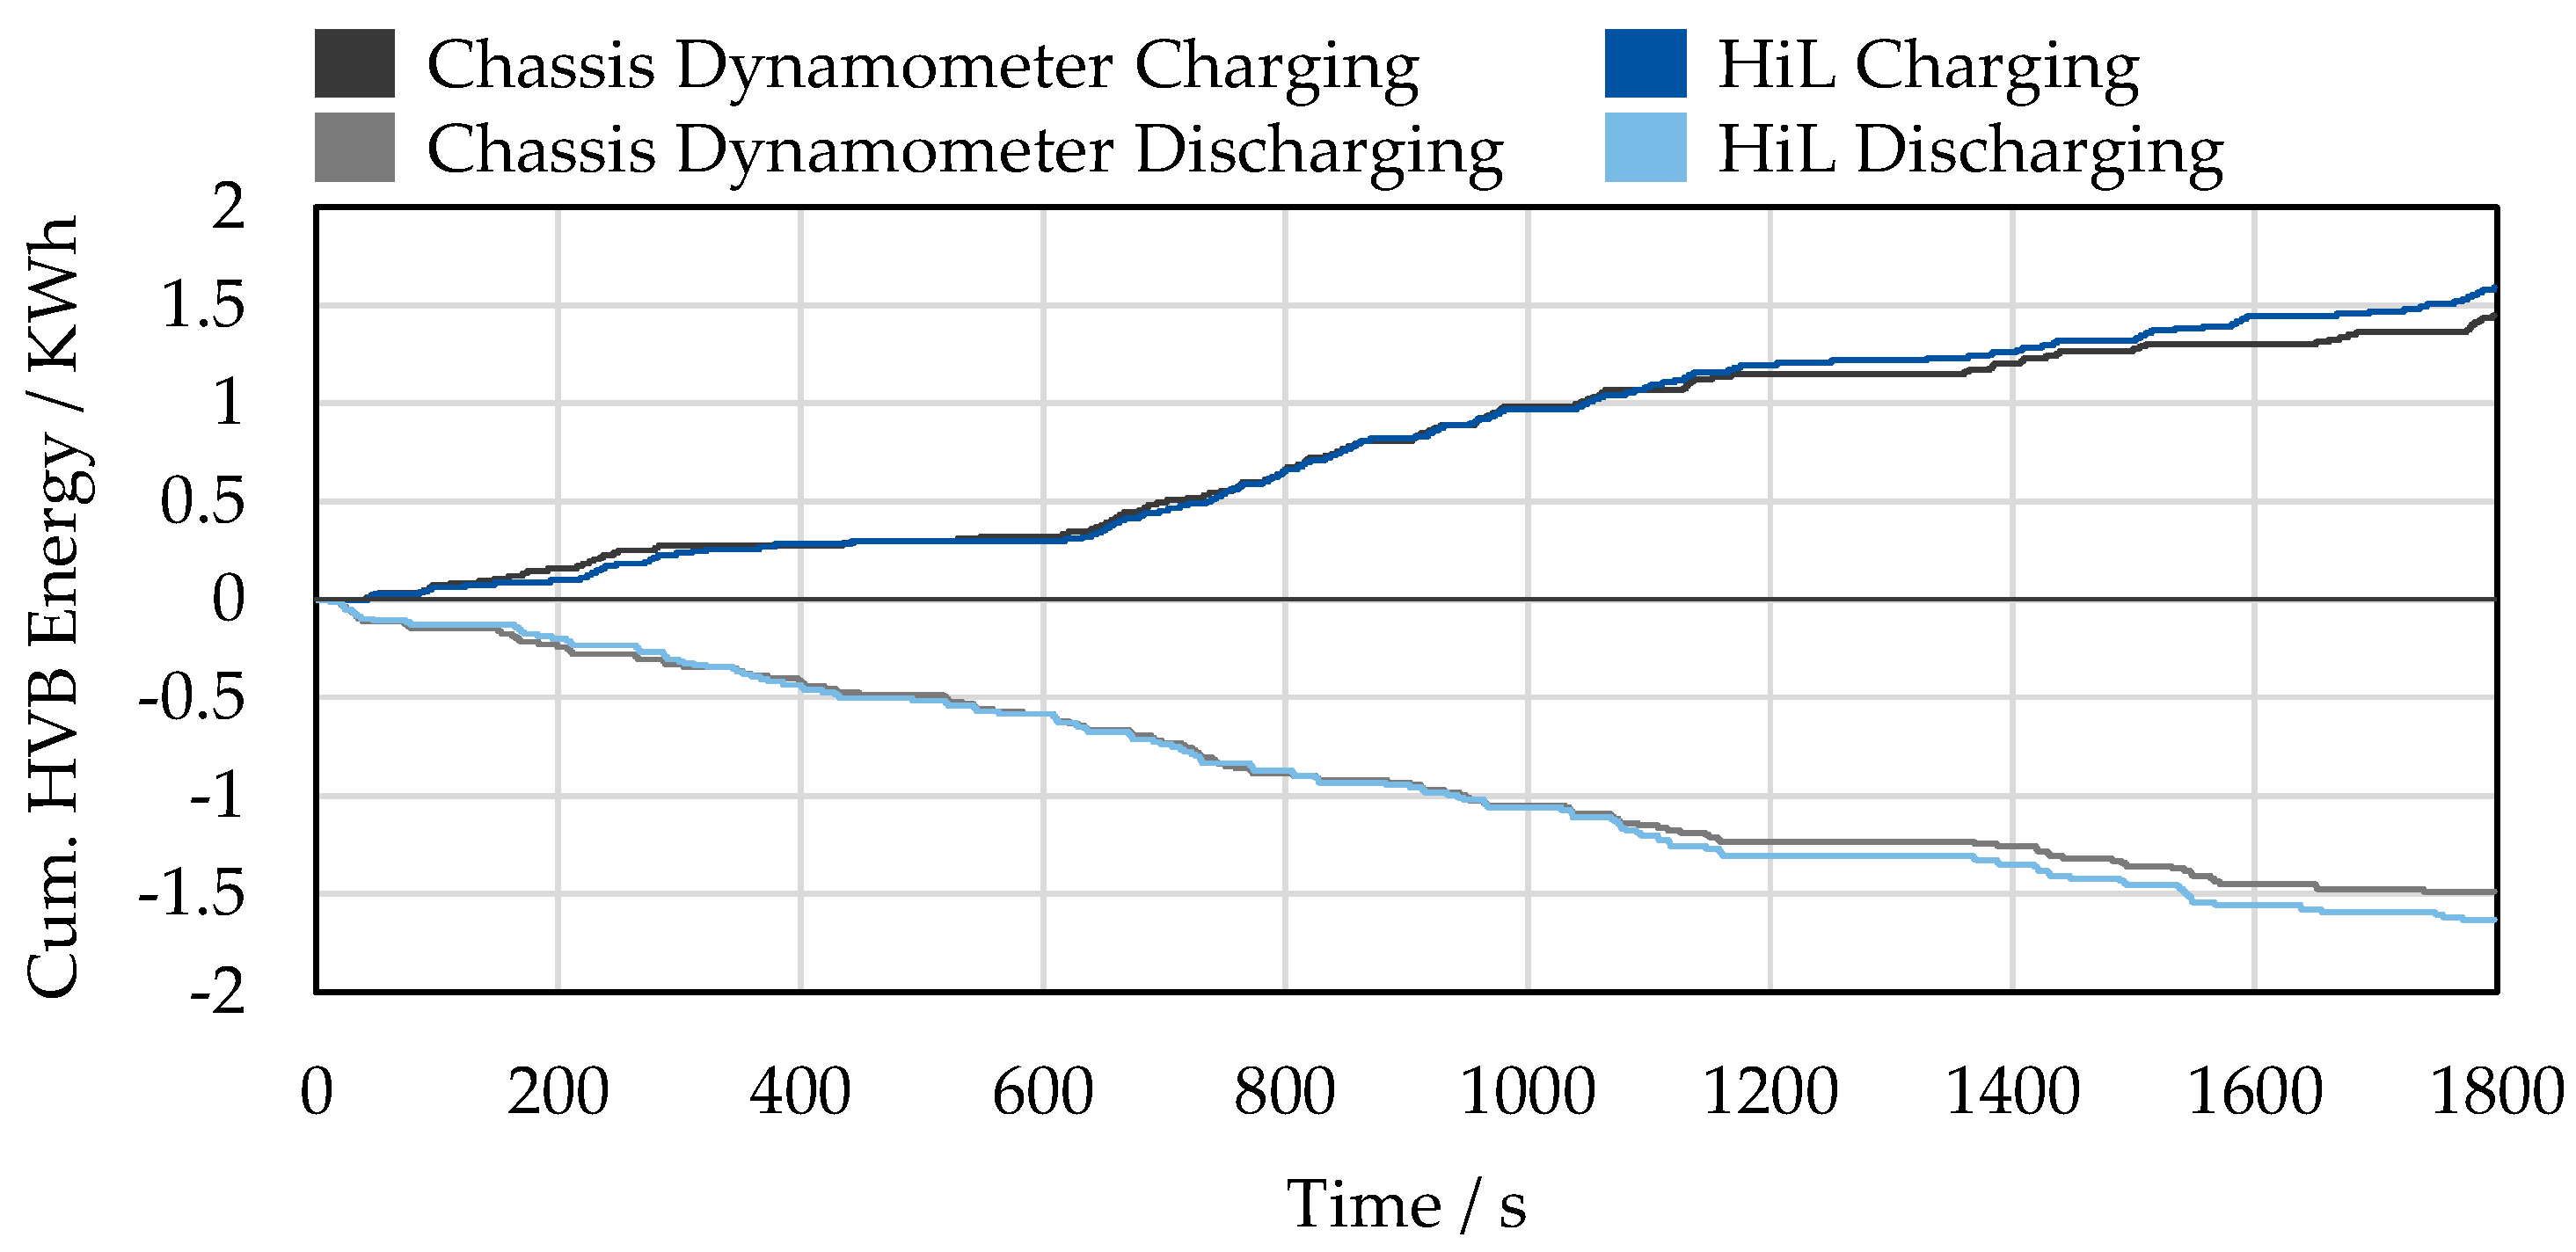
3.4. Electric Energy Flow and Efficiency Simulation
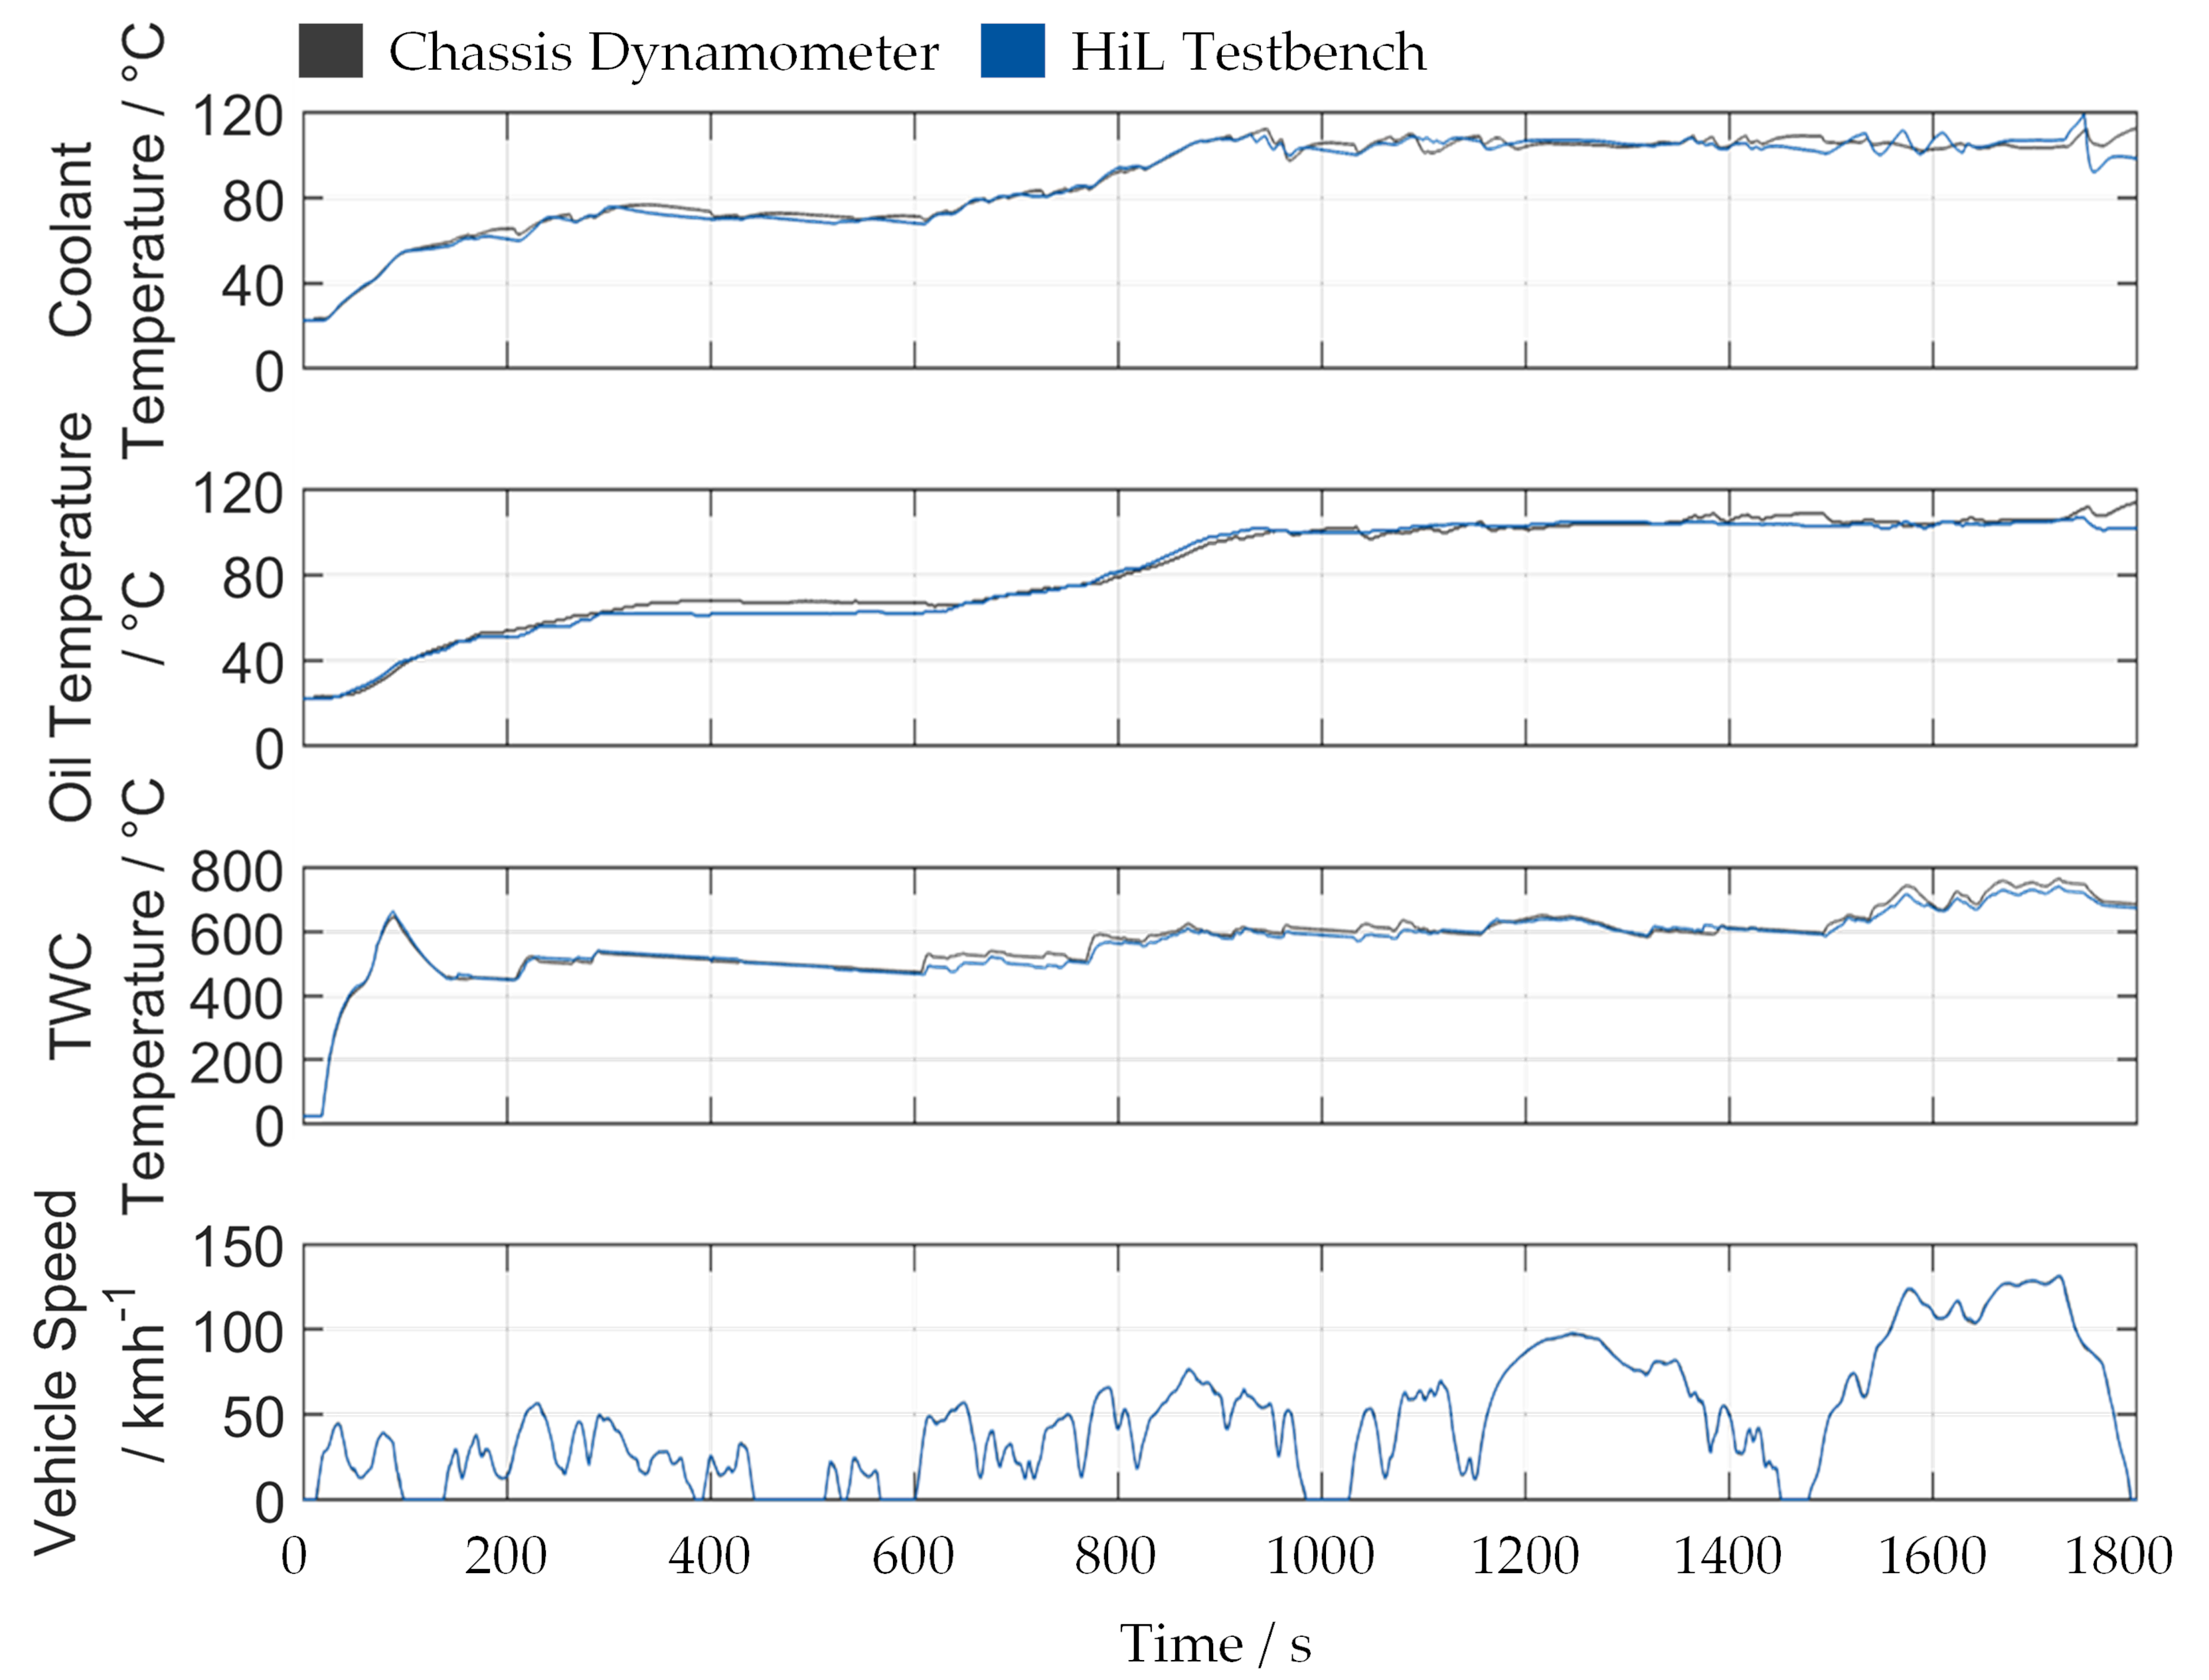
3.5. Thermal System Simulation
3.6. Fuel Consumption and CO2 Emission Simulation
3.7. Real-Time Capability
4. Conclusions and Outlook
5. Summary
Author Contributions
Funding
Data Availability Statement
Conflicts of Interest
Appendix A
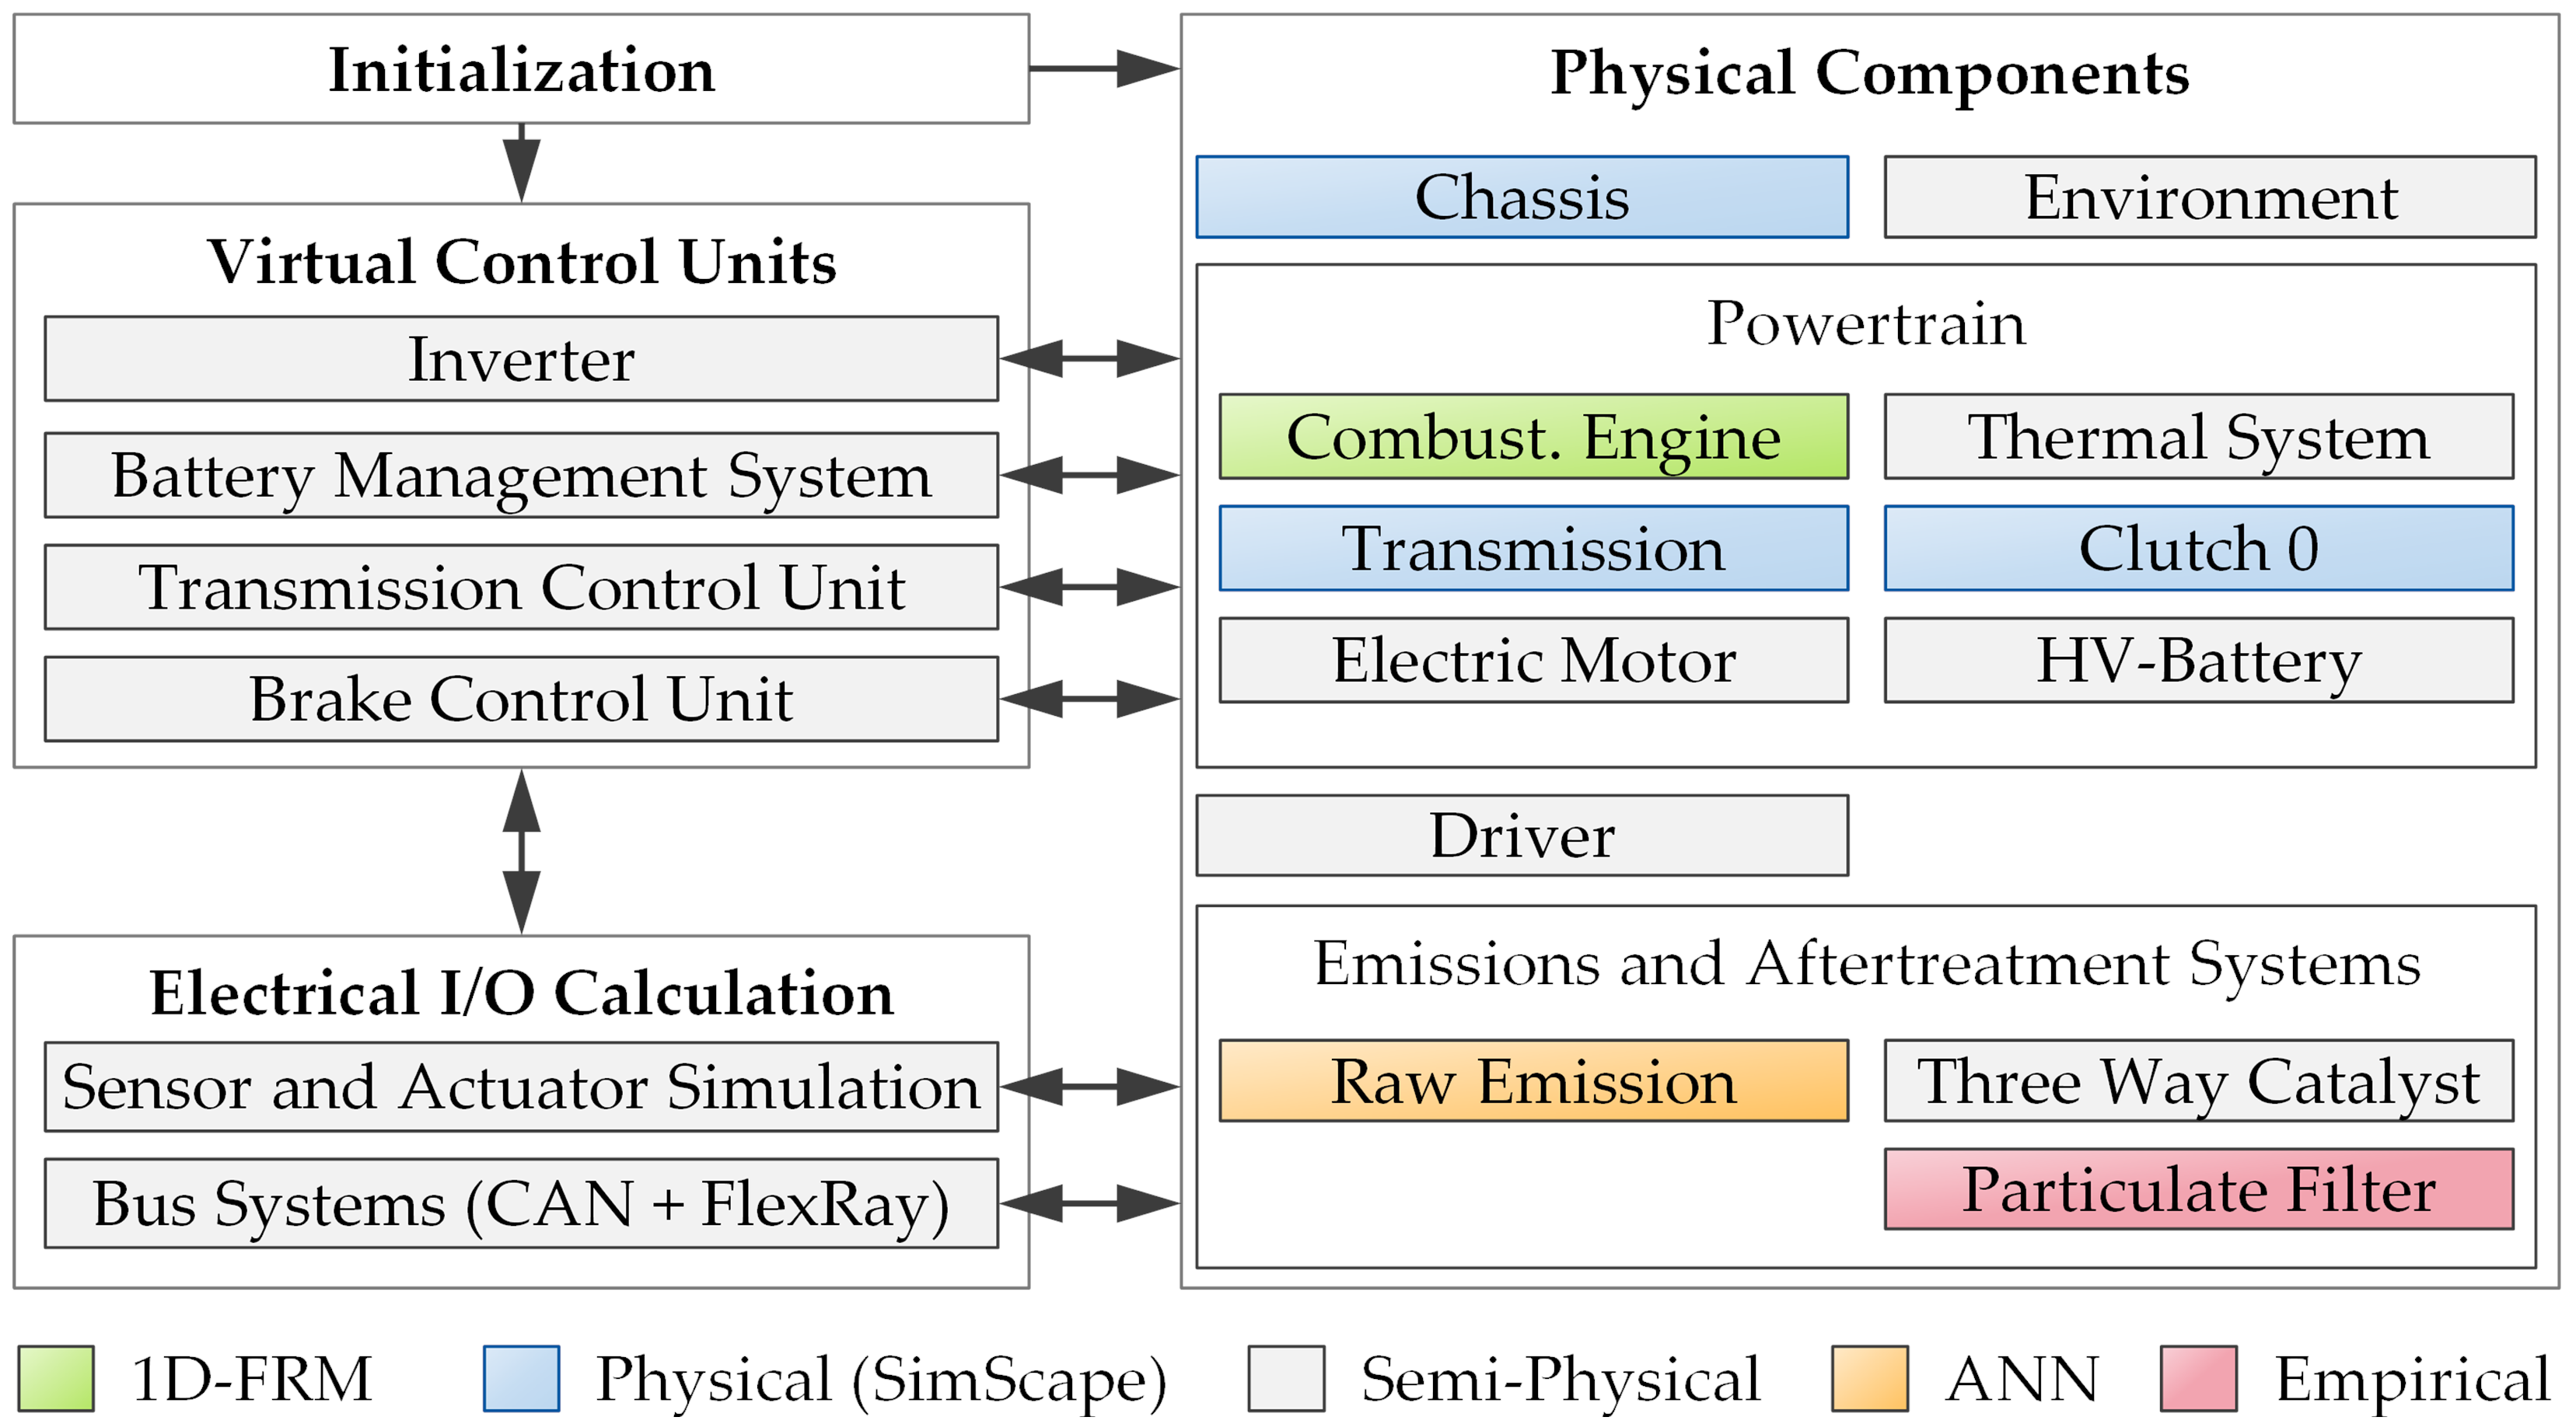
| Simulation Model | Simulation Approach | Details and References |
|---|---|---|
| Chassis | Physical, component-based | Based on MATLAB Simscape Driveline incl. custom extensions
|
| Combustion Engine | 1D GT-Suite FRM | Similar approaches: [38,39]
|
| Thermal System | Semi-physical, map based | Multiple 0D simulations based on [44,45]
|
| Transmission | Physical | Based on MATLAB Simscape Driveline incl. custom extensions
|
| Clutch 0 | Physical | Based on MATLAB Simscape Drivelineincl. custom extensions |
| Electric Motor | Semi-physical, map based | Custom multiphysics simulation incl.
|
| High-Voltage Battery | Semi-physical, map based | Custom equivalent electric circuit
|
| Driver | Map based | Model predictive controller combined with PID controller based on [46] |
| Raw Emission | Neural Network | Based on [47] incl. custom extensions |
| Three-way Catalyst | Semi-physical, map based | Thermal and chemical simulation based on [39] |
| Particulate Filter | Empirical, map based | Back pressure model |
| Vmax | Vmin | ttarget | tvehicle | ∆tvehicle | tHiL | ∆tHiL |
|---|---|---|---|---|---|---|
| 135 | 125 | 6.23 | 6.24 | +0.01 | 6.24 | +0.01 |
| 125 | 115 | 7.00 | 7.03 | +0.03 | 7.04 | +0.04 |
| 115 | 105 | 7.90 | 7.95 | +0.05 | 7.92 | +0.02 |
| 105 | 95 | 8.94 | 9.02 | +0.08 | 8.95 | +0.01 |
| 95 | 85 | 10.16 | 10.28 | +0.12 | 10.2 | +0.04 |
| 85 | 75 | 11.57 | 11.53 | −0.04 | 11.55 | −0.02 |
| 75 | 65 | 13.19 | 13.29 | +0.10 | 13.24 | +0.05 |
| 65 | 55 | 15.01 | 15.2 | +0.19 | 15.08 | +0.07 |
| 55 | 45 | 16.99 | 17.25 | +0.26 | 17.03 | +0.04 |
| 45 | 35 | 19.06 | 18.79 | −0.27 | 19.15 | +0.09 |
| 35 | 25 | 21.06 | 21.28 | +0.22 | 20.99 | −0.07 |
| 25 | 15 | 22.77 | 22.98 | +0.21 | 22.89 | +0.12 |
Appendix B
References
- Sabadka, D.; Molnár, V.; Fedorko, G. Shortening of Life Cycle and Complexity Impact on the Automotive Industry. TEM J. 2019, 8, 1295–1301. [Google Scholar] [CrossRef]
- Meli, M.; Wang, Z.; Bailly, P.; Pischinger, S. Neural Network Modeling of Black Box Controls for Internal Combustion Engine Calibration. In SAE Technical Paper Series, Proceedings of the 2024 Stuttgart International Symposium, Stuttgart, Germany, 2–3 July 2024; SAE International: Warrendale, PA, USA, 2024. [Google Scholar]
- Fletcher, R.; Mahindroo, A.; Santhanam, N.; Tschiesner, A. The Case for an End-To-End Automotive-Software Platform. Available online: https://www.mckinsey.com/industries/automotive-and-assembly/our-insights/the-case-for-an-end-to-end-automotive-software-platform#/ (accessed on 12 June 2024).
- Fischer, R.; Kücükay, F.; Jürgens, G.; Pollak, B. Der Fahrzeugantrieb. In Das Getriebebuch, 2nd ed.; Springer Vieweg: Wiesbaden, Germany, 2016; ISBN 978-3-658-13103-6. [Google Scholar]
- Kokalj, G.; Schatz, P.; Zach, C. Challenges and Opportunities in Variant Calibration of Hybrid Vehicles. In SAE Technical Paper Series, Proceedings of the SAE 2014 International Powertrain, Fuels & Lubricants Meeting, Birmingham, UK, 20 October 2014; SAE International: Warrendale, PA, USA, 2014. [Google Scholar]
- European Automobile Manufacturers’ Association Press Release Car Registrations August 2024: New Car Registrations: −18.3% in August 2024; BEV Market Share down by Almost One Third. Available online: https://www.acea.auto/pc-registrations/new-car-registrations-18-3-in-august-2024-bev-market-share-down-by-almost-one-third/ (accessed on 19 November 2024).
- Impey, B. Anteil von Hybridfahrzeugen an Globaler Automobilproduktion bis 2023. Available online: https://de.statista.com/statistik/daten/studie/875099/umfrage/anteil-von-hybridfahrzeugen-an-globaler-automobilproduktion/ (accessed on 18 November 2024).
- Statista Market Insights, Mobility, Elektrofahrzeuge: Plug-in-Hybrid Elektrofahrzeuge. Available online: https://de.statista.com/outlook/mmo/elektrofahrzeuge/plug-in-hybrid-elektrofahrzeuge/weltweit (accessed on 18 November 2024).
- Hu, X.; Han, J.; Tang, X.; Lin, X. Powertrain Design and Control in Electrified Vehicles: A Critical Review. IEEE Trans. Transp. Electrif. 2021, 7, 1990–2009. [Google Scholar] [CrossRef]
- Buttes, A.G.D.; Jeanneret, B.; Kéromnès, A.; Le Moyne, L.; Pélissier, S. Energy management strategy to reduce pollutant emissions during the catalyst light-off of parallel hybrid vehicles. Appl. Energy 2020, 266, 114866. [Google Scholar] [CrossRef]
- Dimauro, L.; Tota, A.; Galvagno, E.; Velardocchia, M. Torque Allocation of Hybrid Electric Trucks for Drivability and Transient Emissions Reduction. Appl. Sci. 2023, 13, 3704. [Google Scholar] [CrossRef]
- Morra, E.P. A Comprehensive Methodology for the Optimization of the Operating Strategy of Hybrid Electric Vehicles. Ph.D. Dissertation, Politecnico di Torino, Turin, Italy, April 2012. [Google Scholar]
- Fundamentals of automotive and engine technology: Standard drives, hybrid drives, brakes, safety systems. In Bosch Professional Automotive Information; Reif, K., Ed.; Springer Vieweg: Wiesbaden, Germany, 2014; ISBN 978-3-658-03972-1. [Google Scholar]
- Dhingra, S.; Hernandez, D.N. Accelerating JLR’s Propulsion Development Using Rig Based Testing Methodologies. Available online: https://fpc-event.co.uk/wp-content/uploads/2023/03/SulabhDhingra_DanielNavarro_DigitalEngineering.pdf (accessed on 12 June 2024).
- Merl, R.; Kokalj, G.; Wultsch, B.; Klumaier, K.; Eberhard, F.; Ivarson, M. Innovative Lösungen zur Applikation hybrider Antriebe. In Experten-Forum Powertrain: Simulation und Test 2020; Liebl, J., Ed.; Springer: Berlin/Heidelberg, Germany, 2021; pp. 121–134. ISBN 978-3-662-63605-3. [Google Scholar]
- Llopart Vázques, G.; Weck, T.R.; Kolar, A.; Jones, S. Multi-XiL as a Central Tool for the Integration, Calibration and Validation of Hybrid Powertrains. In VPC–Simulation und Test 2015: Methoden der Antriebsentwicklung im Dialog 17; Liebl, J., Beidl, C., Eds.; Springer Fachmedien Wiesbaden: Wiesbaden, Germany, 2018; pp. 81–95. ISBN 978-3-658-20735-9. [Google Scholar]
- Trampert, S.; Nijs, M.; Huth, T.; Guse, D. Simulation von realen Fahrszenarien am Prüfstand. MTZ Extra 2017, 22 (Suppl. 1), 12–19. [Google Scholar] [CrossRef]
- Qiu, W.; Ashta, S.; Shaver, G.M.; Johnson, S.C.; Frushour, B.C.; Rudolph, K. Expediting Hybrid Electric Wheel Loader Prototyping: Real-Time Dynamic Modeling and Power Management Through Advanced Hardware-in-the-Loop Simulation. IEEE Trans. Veh. Technol. 2024, 74, 2682–2691. [Google Scholar] [CrossRef]
- Kuznik, A.; Steinhaus, T.; Stumpp, M.; Beidl, C. Optimierung des Emissionsverhaltens innerhalb der hybriden Betriebsstrategie am Prüfstand mittels Co-Simulation. In Experten-Forum Powertrain: Simulation und Test 2020; Liebl, J., Ed.; Springer: Berlin/Heidelberg, Germany, 2021; pp. 31–45. ISBN 978-3-662-63605-3. [Google Scholar]
- Boumans, M.; Fischer, U. Entwicklung von Energiemanagementfunktionen für Hybridfahrzeuge. In VPC.Plus 2014; Liebl, J., Rainer, G., Eds.; Springer Fachmedien Wiesbaden: Wiesbaden, Germany, 2018; pp. 191–206. ISBN 978-3-658-23774-5. [Google Scholar]
- Karabiyik, E.; Özkaynak, S.; Kerpel Nde Pichler, A. Energy Management Trade-off: Virtual Optimization of Hybrid Electric Vehicles. In Proceedings of the 2023 10th International Conference on Electrical and Electronics Engineering (ICEEE), Istanbul, Turkiye, 8–10 May 2023; IEEE: Piscataway, NJ, USA, 2023; pp. 475–479, ISBN 979-8-3503-0429-9. [Google Scholar]
- Altun, Y.E.; Kutlar, O.A. Energy Management Systems’ Modeling and Optimization in Hybrid Electric Vehicles. Energies 2024, 17, 1696. [Google Scholar] [CrossRef]
- Düzgün, M.T.; Dorscheidt, F.; Krysmon, S.; Bailly, P.; Lee, S.-Y.; Dönitz, C.; Pischinger, S. Virtual Multi-Criterial Calibration of Operating Strategies for Hybrid-Electric Powertrains. Vehicles 2023, 5, 1367–1383. [Google Scholar] [CrossRef]
- European Union Commission Regulation (EU) 2017/1151. 2017. Available online: https://eur-lex.europa.eu/eli/reg/2017/1151/oj/eng (accessed on 7 May 2025).
- United Nations Worldwide harmonized Light vehicles Test Procedure: ECE/TRANS/180/Add.15. 2014. Available online: https://www.transportpolicy.net/wp-content/uploads/2021/08/GTR-No-15.pdf (accessed on 7 May 2025).
- Manheller, P. Mehrkriterielle Optimierung und Untersuchung Regelbasierter Betriebsstrategien für Plug-in Hybridfahrzeuge. Dissertation, Rheinisch-Westfälische Technische Hochschule Aachen, Aachen, Germany, 2016. [Google Scholar]
- Platner, S.; Kordon, M.; Fakiolas, E.; Atzler, H. Modellbasierte Serienkalibrierung-der effiziente Weg für Variantenentwicklung. MTZ-Mot. Z. 2013, 74, 754–761. [Google Scholar] [CrossRef]
- Yuan, R.; Price, C.; Kasurkar, R.; Spenley, M.; Dutta, N.; Ebrahimi, K. Numerical Investigation of Heat Retention and Warm-Up with Thermal Encapsulation of Powertrain. In SAE Technical Paper Series, Proceedings of the WCX SAE World Congress Experience, Detroit, MI, USA, 21 April 2020; SAE International: Warrendale, PA, USA, 2020. [Google Scholar]
- Ranjan, R.; Jha, K.K.; Brahmasani, L.; Khan, P. Prediction of Engine Thermal Behavior during Emission Cycle Using 1D Four Point Mass Model. In SAE Technical Paper Series, Proceedings of the SAE 2016 World Congress and Exhibition, Detroit, MI, USA, 12 April 2016; SAE International: Warrendale, PA, USA, 2016. [Google Scholar]
- Zöbel, D. Echtzeitsysteme: Grundlagen der Planung, 2nd ed.; Springer: Berlin/Heidelberg, Germany, 2019; ISBN 978-3-662-60420-5. [Google Scholar]
- Elektrifizierung des Antriebsstrangs: Grundlagen-vom Mikro-Hybrid zum vollelektrischen Antrieb. In ATZ/MTZ-Fachbuch; Tschöke, H., Gutzmer, P., Pfund, T., Eds.; Springer Vieweg: Berlin/Heidelberg, Germany, 2019; ISBN 978-3-662-60355-0. [Google Scholar]
- Enang, W.; Bannister, C. Modelling and control of hybrid electric vehicles (A comprehensive review). Renew. Sustain. Energy Rev. 2017, 74, 1210–1239. [Google Scholar] [CrossRef]
- Sittig, A. Optimierung und Applikation von Betriebsstrategien in Hybridfahrzeugen. Ph.D. Dissertation, Technische Universität München, München, Germany, 2013. [Google Scholar]
- Yue, H.; Lin, J.; Dong, P.; Chen, Z.; Xu, X. Configurations and Control Strategies of Hybrid Powertrain Systems. Energies 2023, 16, 725. [Google Scholar] [CrossRef]
- Commision of the European Communities Regulation (EEC) No 4064/89: 4064/89. vol. 1999. 1999. Available online: https://eur-lex.europa.eu/eli/reg/1989/4064/oj/eng (accessed on 7 May 2025).
- Lee, S.Y. Virtuelle Kalibrierung von Motorsteuergeräten Mittels Hardware-in-the-Loop Simulationen. Ph.D. Dissertation, Rheinisch-Westfälische Technische Hochschule Aachen, Aachen, Germany, 2023. [Google Scholar]
- Xia, F. Real-Time Capable One-Dimensional Models for Internal Combustion Engines in X-in-the-Loop Applications. Ph.D. Dissertation, Rheinisch-Westfälische Technische Hochschule Aachen, Aachen, Germany, 2020. [Google Scholar]
- Xia, F.; Dorscheidt, F.; Lücke, S.; Andert, J.; Gardini, P.; Scheel, T.; Walter, V.; Tharmakulasingam, J.K.R.; Böhmer, M.; Nijs, M. Experimental Proof-of-Concept of HiL Based Virtual Calibration for a Gasoline Engine with a Three-Way-Catalyst. In SAE Technical Paper Series, Proceedings of the 2019 JSAE/SAE Powertrains, Fuels and Lubricants, Kyoto, Japan, 26–29 August 2019; SAE International: Warrendale, PA, USA, 2019. [Google Scholar]
- Dorscheidt, F.; Düzgün, M.; Claßen, J.; Krysmon, S.; Pischinger, S.; Görgen, M.; Dönitz, C.; Nijs, M. Hardware-in-the-Loop Based Virtual Emission Calibration for a Gasoline Engine. In SAE Technical Paper Series, Proceedings of the SAE WCX Digital Summit, Online, 12–15 April 2021; SAE International: Warrendale, PA, USA, 2021. [Google Scholar]
- Schmidt, H.; Büttner, K.; Prokop, G. Methods for Virtual Validation of Automotive Powertrain Systems in Terms of Vehicle Drivability—A Systematic Literature Review. IEEE Access 2023, 11, 27043–27065. [Google Scholar] [CrossRef]
- Vadamalu, R.S.; Beidl, C. Explicit MPC PHEV energy management using Markov chain based predictor: Development and validation at Engine-In-The-Loop testbed. In Proceedings of the 2016 European Control Conference (ECC), Aalborg, Denmark, 29 June–1 July 2016; IEEE: Piscataway, NJ, USA; pp. 453–458, ISBN 978-1-5090-2591-6. [Google Scholar]
- Kaven, L.; Frehn, A.; Basler, M.; Jassmann, U.; Röttgers, H.; Konrad, T.; Abel, D.; Monti, A. Impact of Multi-Physics HiL Test Benches on Wind Turbine Certification. Energies 2022, 15, 1336. [Google Scholar] [CrossRef]
- Ramosaj, N.; Fusco, C.; Viennet, E. Development of a Hardware-in-the-Loop Test Bench for Validation of an Anti-lock Braking System on an E-Bike. In The Evolving Scholar-BMD 2023, 5th ed.; The Evolving Scholar: Delft, The Netherlands, 2023. [Google Scholar]
- Hoppe, M. Model-Based Development and Calibration of Diagnosis Functions in the Cooling Circuit of a Vehicle. Ph.D. Dissertation, RWTH Aachen University, Aachen, Germany, 2017. [Google Scholar]
- Varga, P. Thermisches Modell eines Verbrennungsmotors zur Untersuchung des Warmlaufverhaltens. Ph.D. Dissertation, Otto-von-Guericke-Universität Magdeburg, Magdeburg, Germany, 2014. [Google Scholar]
- Al Tarooti, A.; Meyer, N.; Guse, D.; Klein, S. Driver Modeling and Simulation for RDE Testing: Effect of driver behavior on representative test results. JSAE Tech. Pap. 2019, 5–167. [Google Scholar]
- Dorscheidt, F.; Aachen, G.V.R.; Meli, M.; Claßen, J.; Krysmon, S.; Pischinger, S.; Görgen, M.; Dönitz, C.; Bailly, P.; Nijs, M.; et al. Modelling of Gasoline Engine-Out Emissions Using Artificial Neural Networks. In Proceedings of the FISITA World Congress 2021, Prague, Czech Republic, 13–17 September 2021; ISBN 9781916025929. [Google Scholar]


| Evaluation Scope | Scenario | Boundary Conditions |
|---|---|---|
| Chassis and environment | Coast down test according to legislation [24,25] | Velocity coast down in neutral gear (140–10 km/h) |
| Driver | WLTC drive cycle | Electric and hybrid operation |
| Transmission | Steady-state points and WLTC drive cycle | Electric and hybrid operation |
| Electric energy flow and efficiency | WLTC drive cycle | Electric and hybrid operation |
| Fuel consumption and CO2 emissions | WLTC drive cycle | Hybrid operation |
| Thermal system | WLTC drive cycle | Hybrid operation |
| Real-time capability | Various driving scenarios | Electric and hybrid operation |
| Simulation Model | ||
|---|---|---|
| ICE coolant temperature | 3.4 °C | 12.4 °C |
| ICE oil temperature | 3.7 °C | 11.0 °C |
| Three-way catalyst temperature | 17.6 °C | 40.7 °C |
| Reference Measurement | HiL Measurement | Absolut Difference | Percentage Difference | |
|---|---|---|---|---|
| Phase 1 | 988.7 g | 987.0 g | −1.7 g | −0.17% |
| Phase 2 | 1433.8 g | 1434.8 g | −1.0 g | −0.07% |
| Phase 3 | 1714.8 g | 1695.9 g | −18.9 g | −1.10% |
| Phase 4 | 2372.0 g | 2324.0 g | −48.0 g | −2.02% |
| Total | 6509.2 g | 6441.6 g | −67.6 g | −1.04% |
Disclaimer/Publisher’s Note: The statements, opinions and data contained in all publications are solely those of the individual author(s) and contributor(s) and not of MDPI and/or the editor(s). MDPI and/or the editor(s) disclaim responsibility for any injury to people or property resulting from any ideas, methods, instructions or products referred to in the content. |
© 2025 by the authors. Published by MDPI on behalf of the World Electric Vehicle Association. Licensee MDPI, Basel, Switzerland. This article is an open access article distributed under the terms and conditions of the Creative Commons Attribution (CC BY) license (https://creativecommons.org/licenses/by/4.0/).
Share and Cite
Düzgün, M.T.; Heusch, C.; Krysmon, S.; Dönitz, C.; Lee, S.-Y.; Andert, J.; Pischinger, S. Dynamic Closed-Loop Validation of a Hardware-in-the-Loop Testbench for Parallel Hybrid Electric Vehicles. World Electr. Veh. J. 2025, 16, 273. https://doi.org/10.3390/wevj16050273
Düzgün MT, Heusch C, Krysmon S, Dönitz C, Lee S-Y, Andert J, Pischinger S. Dynamic Closed-Loop Validation of a Hardware-in-the-Loop Testbench for Parallel Hybrid Electric Vehicles. World Electric Vehicle Journal. 2025; 16(5):273. https://doi.org/10.3390/wevj16050273
Chicago/Turabian StyleDüzgün, Marc Timur, Christian Heusch, Sascha Krysmon, Christian Dönitz, Sung-Yong Lee, Jakob Andert, and Stefan Pischinger. 2025. "Dynamic Closed-Loop Validation of a Hardware-in-the-Loop Testbench for Parallel Hybrid Electric Vehicles" World Electric Vehicle Journal 16, no. 5: 273. https://doi.org/10.3390/wevj16050273
APA StyleDüzgün, M. T., Heusch, C., Krysmon, S., Dönitz, C., Lee, S.-Y., Andert, J., & Pischinger, S. (2025). Dynamic Closed-Loop Validation of a Hardware-in-the-Loop Testbench for Parallel Hybrid Electric Vehicles. World Electric Vehicle Journal, 16(5), 273. https://doi.org/10.3390/wevj16050273