Article

Social Planning for eBRT Innovations: Multi-Criteria Evaluation of Societal Impacts

by
Maria Morfoulaki
,
Maria Chatziathanasiou
and
Iliani Styliani Anapali
*
Centre for Research & Technology Hellas, Hellenic Institute of Transport, Thermi Thessaloniki—Central Directorate, 6th km Charilaou-Thermi Rd, 57001 Thessaloniki, Greece
*
Author to whom correspondence should be addressed.
World Electr. Veh. J. 2025, 16(12), 661; https://doi.org/10.3390/wevj16120661 (registering DOI)
Submission received: 29 October 2025 / Revised: 28 November 2025 / Accepted: 1 December 2025 / Published: 6 December 2025
(This article belongs to the Special Issue Zero Emission Buses for Public Transport)

Abstract

This paper develops and applies an ex-ante methodological framework to assess the societal optimisation of eBRT innovations within the Horizon Europe eBRT2030 project, using Multi-Criteria Decision Analysis (MCDA) and the PROMETHEE method. The study evaluates 11 eBRT innovations to be deployed in five demonstration sites in Europe and one in Colombia. Twenty social parameters, including 10 risks and 10 benefits, were weighted and scored through expert and stakeholder engagement, to calculate the Societal Optimisation Index (SOI). Positive SOI values indicate that societal benefits outweigh risks, and negative values indicate the opposite, while close-to-zero values indicate socially neutral or ambiguous options requiring case-specific judgement. The results indicate that innovations such as Adaptive Fleet Scheduling and Planning, Intelligent Driver Support Systems, and IoT Monitoring Platforms provide strong societal benefits with manageable risks, while charging-related innovations are associated with social concerns. The study emphasises the importance of social impact assessment prior to implementing innovations, to enable inclusive decision-making for policymakers and transport planners and enable the development of socially optimised eBRT systems. Embedding experts’ perspectives and social criteria ensures that technological innovations are aligned with societal needs, assisting the transition towards more equitable, low-carbon transport systems.

1. Introduction

1.1. Objectives

Urban transport systems are increasingly overwhelmed by growing private car ownership, environmental degradation and safety concerns. Expanding road infrastructure has proven to be a short-term solution providing only temporary congestion relief, as it quickly becomes saturated with new private cars [1,2]. Meanwhile, the transport sector is the biggest contributor to greenhouse gas (GHG) emissions in the European Union (EU). In 2022, transport accounted for 29% of the total emissions, with road transport alone being responsible for 21% [3,4]. Urbanisation, increasing population density and car-oriented culture exacerbate emissions, air and noise pollution and land fragmentation [5]. These trends are threatening the European Green Deal’s target of 90% reduction in transport-related emissions by 2050 [6,7].
Public Transport (PT) has traditionally been considered the backbone of sustainable mobility, and its promotion has been and still remains one of the top EU priorities [6,8,9]. Among the “strong cards” of PT towards decongestion, decarbonisation and urban space transformation, are cost competitiveness and intermodal integration, both key aspects in encouraging modal shifts from private cars [10]. By further considering the enhanced service quality offered by mass rapid transit systems—such as Bus Rapid Transit (BRT)—and the ongoing electrification of public transport fleets, the modal shift potential and decarbonisation capabilities of public transport are significantly amplified, primarily due to reduced travel times, improved reliability, lower operational emissions, and increased user attractiveness [11,12].
Indeed, Bus Rapid Transit (BRT) systems have emerged as cost-effective solutions to address urban mobility challenges and, as of 2025, BRTs operate in over 190 cities worldwide, with the total length of all operational corridors reaching approximately 5917 km (figures based on the most recent statistics available, accessed in September 2025) [13,14,15]. By typically comprising modern, high-capacity buses operating at higher speeds (up to 60 km/h average operating speed) and frequencies on an exclusive right-of-way, BRT systems have the ability to adapt to increasing transport demand and social needs, especially when compared to similar systems in terms of operating infrastructure, light rail and metro [16,17,18]. Fleet electrification, namely electrified BRTs (eBRTs), further strengthens the environmental benefits by reducing emissions compared to internal combustion engine buses, while enabling PT sustainability [19]. A significant advantage of BRT systems is their deployment cost and fast implementation time. Compared to other mass transit options, BRT systems offer significant cost advantages, making them attractive for cities with limited resources. Indicatively, constructing 1 km of BRT infrastructure costs approximately 50% less than a light rail system [20].
Despite the several positive social externalities of PT, its planning and design have relied and still rely on operational, economic and environmental aspects [21,22], with many transport megaprojects overemphasising engineering and economic considerations, often at the expense of societal factors [23].
In the case of electric PT systems, such as electric Bus Rapid Transit (eBRT) services, the relevant operational and infrastructural elements, such as power supply, charging methods and energy storage, are added to the appraisal equation [24,25], yet wider social and equity goals are overlooked.
The objective of this paper is to integrate social considerations into the planning and design of eBRT innovations. The research expands the scope of social impact assessments beyond commonly studied aspects such as equity and accessibility, ensuring a more comprehensive evaluation of eBRT innovations. The innovations under study are currently being implemented in five real-world demonstration sites across Europe and one in Colombia as part of the “European Bus Rapid Transit of 2030: electrified, automated, connected (eBRT2030)” Horizon Europe project (Project number: 101095882, Topic: HORIZON-CL5-2022-D5-01-10). The current work relies on a Multi-Criteria Decision Analysis (MCDA) approach, leading to the calculation of the Societal Optimisation Index (SOI) for each innovation.

1.2. Societal Considerations in Public Transport Appraisal

As flagged by UITP [26] (p. 2), “hardly any sector has so many positive externalities” as the PT sector. Time and cost savings, access to jobs, services and locations, environmental quality, opportunities for social interaction, and reduction in transport poverty are few among a wide list of societal impacts. The link between PT and multiple sustainable policy objectives and its effectiveness in responding to numerous societal challenges is widely recognised [27,28,29]. Yet, negative impacts, such as displacement and exclusion of people from opportunities [30], should not be disregarded, either [31].
Cost–Benefit Analysis (CBA), first introduced for a railway project in the 19th century [32], is one of the most widely used and rigorous decision-making and evaluation tools. CBA quantifies the advantages (benefits) and disadvantages (costs) of a project or policy action in monetary terms [33]. The CBA encompasses various methodological approaches, such as Cost–Effectiveness Analysis (CEA)—which compares alternatives delivering a common outcome but does not aggregate multiple heterogeneous effects; Welfare-Economic Analysis—which assesses monetised and income effects but faces the same monetisation and distribution challenges as CEA [34]; and Cost–Utility Analysis—in which outcomes are expressed in a single metric. When the CBA replaces costs and benefits with societal costs and benefits, we refer to it as the “social CBA” [35].
The CBA has traditionally been applied, as an ex-ante technique, to the appraisal of PT projects [32,36,37,38]. However, monetising social effects such as congestion, health, and other transport innovation costs and benefits is often uncertain or contested [38]. CBA is also insufficient to address conflicting or diverse aspects effectively [39], while additional complexity in the analysis is added when both costs and benefits must be adjusted to base-year values [40].
While CBA remains a valuable tool for informed decision-making in PT investments, increasing attention has been given to its inability to consider wider social and environmental impacts and their relevant costs [41,42]. This was found to be labelled as “incomplete cost–incomplete benefit” analysis [35]. Modifications or alternatives to CBA, to focus more on equity, gender and environmental aspects, have been proposed [38], and several studies have incorporated social elements, such as accessibility, affordability and equity [30,43,44], often interlinked with the term “social capital”. This is associated with one’s benefits gained from the community [45,46], subjectively experienced aspects (passengers’ experience) [47,48] including crowding relief [49], and social choice context, where overall positive and negative environmental impacts of transport interventions/projects are considered together in a public context [50].
In several of these cases, BRT systems are explicitly featured [43,44,51]. Nonetheless, this pool of research often focuses narrowly on specific determinants [52], and although social aspects such as equity and accessibility are studied in more depth, broader social dimensions remain unexplored [53,54,55]. Socially sensitive planning, implementation, monitoring and evaluation foster wider acceptance of implemented policies, strategies and interventions, increasing the feeling of ownership, and consequently triggering sustainable behaviour [56]. Although the identification, analysis and distinction between social, environmental and economic impacts is often challenging, the absence of social considerations in transport assessments would suggest that economic and environmental impacts are the only ones that exist.
Having identified the limitations of the CBA method in accounting for broader social and environmental objectives—which are often incommensurable and incomparable—as well as the inherent limitations of existing studies that incorporate social elements without capturing the full scope of societal impacts, participatory Multi-Criteria Analysis (MCA) or Multi-Criteria Decision Analysis (MCDA) approaches have gained prominence. These approaches enable wider actor views to be expressed and incorporate multiple criteria, both quantitative and qualitative, monetary and non-monetary [35,57]. The MCDA places decision-makers at the centre of the process by incorporating subjective information on their preferences [58,59]. It can be used as a ranking problem-solving tool, where options are ranked from best to worst, using a Likert scale, and as a problem description tool, to illustrate heterogeneous option results [60]. MCDA is increasingly applied in transport-related decision-making processes, providing several key advantages, including [58]:
  • the inclusion of multiple, and often conflicting, objectives and stakeholders’ perspectives, thus enabling more comprehensive, transparent and defensible decisions;
  • the organisation, management and simplification of the substantial amount of technical data typically encountered in transport-related analysis; and
  • the full control and adjustment of the process: scores and weights are assigned according to established methodologies and values can be validated against alternative information sources, thus allowing for revisions.

2. Materials and Methods

This study proposes an MCDA method for an ex-ante evaluation of eBRT innovations, leading to the calculation of the Social Optimization Index (SOI). The MCDA approach serves the paper’s objectives as follows:
  • Retains criterion-level meaning without monetisation;
  • Reflects stakeholder preferences through weights and thresholds; and
  • Produces decision-ready rankings and trade-off views.
The MCDA approach evaluates the social impacts associated with the innovations, providing structured methods for decision-making that account for diverse societal preferences. Moreover, the research expands the scope of social impact assessments beyond commonly studied aspects, such as equity and accessibility, ensuring a more comprehensive evaluation of eBRT innovations.
There are several methods available to determine the weights in the MCDA approach, such as AHP, Fuzzy AHP, the entropy method, the Preference Ranking Organisation Method (PROMETHEE), the Analytic Network Process and the Best-Worst Method [61]. The method selection depends on the study requirements, constraints and objectives [62].
The PROMETHEE method, developed by Brans, Mareschal and Vincke [63,64], was selected as the most appropriate to evaluate the societal effectiveness of the eBRT innovations to be implemented, as it:
  • Compares alternatives pairwise on each criterion;
  • Translates performance differences into preference degrees;
  • Aggregates these preferences by stakeholder weights into an overall index; and
  • Produces positive (Phi+), negative (Phi) and net (Phi) preference flows that yield a complete ranking (PROMETHEE II), with GAIA visualisations to support trade-off interpretation [65].
In this work, PROMETHEE is implemented in Visual PROMETHEE 1.4. The net flow (Phi) is interpreted as the SOI. The usual (Type I) preference function was adopted for all criteria, which is appropriate for discrete ordinal ratings, as those in the present study. The PROMETHEE input data consist of uniformly scaled expert scores; thus, no indifference (q) or preference (p) thresholds and no sigma parameters were applied, and no additional data normalisation was required. All criteria were treated as benefit-type attributes, meaning that higher scores represent more favourable assessments. Therefore, no inversion or cost-type transformation is necessary. The only parameter variation across criteria was the expert-defined weight, which was incorporated directly into the multicriteria aggregation step.

3. Results

The PROMETHEE method was utilised to form and implement the methodological framework for calculating the SOI of the eBRT2030 project innovations. The framework is based on a stepwise approach, including the following steps:
  • Step 1. Criteria Selection: Development of a preliminary list of social risks and benefits related to the eBRT2030 project innovations and validation/finalisation of the list through the project-partner engagement.
  • Step 2. Parameters Weighting: Assignment of weights to each parameter, i.e., risks and benefits, through experts’ engagement.
  • Step 3. Parameters Scoring: Rating of the risks and benefits through a multi-stakeholder engagement approach.
  • Step 4. MCDA Ranking Innovations according to their SOI: Running the MCDA for ranking the different innovations according to their SOI.

3.1. Criteria Selection

The first step of the methodological framework involves the social evaluation criteria identification for the eBRT2030 innovations. The eBRT2030 project develops several innovations in eBRT systems, enabling their application in five European urban contexts, i.e., Barcelona (Spain), Amsterdam (Netherlands), Athens (Greece), Prague (Czech Republic) and Rimini (Italy); one international demonstration in Bogotá (Columbia); and three small scale replications. These innovations range from those in vehicles and their charging systems to the development of tools and services for automation, energy management and increased connectivity. Table 1 presents the European eBRT2030 innovations, and the innovation categories as defined within the project, along with a short description and the pilot city in which they will be implemented.
Initially, a preliminary list of social risks and benefits associated with each innovation was developed, identifying 11 social risks and 11 social benefits. This list was circulated among the 45 eBRT2030 project beneficiaries for validation. During the validation process, certain risks and benefits were excluded from the list, due to insufficient relevance to the innovations, whereas new risks and benefits were proposed, ensuring a comprehensive and contextually relevant set of evaluation parameters. The finalised list included 10 social risks and 10 social benefits, for a total of 20 social parameters. These parameters were categorised into clusters based on their thematic fields for further analysis. It should also be mentioned that only the European partners participated in the weighting and scoring process. Therefore, the findings primarily reflect European socio-economic and cultural contexts.

3.2. Parameters Weighting

In the second step of the framework, a group of experts from the Advisory Board (AB) and the Social Sciences and Humanities (SSH) community was invited to assign weights to the social risk and benefit parameters. These experts represent a mix of academia, research institutions, PT operators and industry partners, and were selected for their domain of knowledge and expertise in sustainable mobility and the innovations under assessment. The weighting process evaluated the importance and influence of each parameter in the social effectiveness of eBRT systems. Table 2 lists the finalised social risk and benefit parameters, while also detailing their correlation with the eBRT2030 innovations and the average weights assigned by the experts.

3.3. Parameters Scoring

The third step of the methodological framework was the application of the PROMETHEE methodology to rank the social risks and benefits of the eBRT2030 innovations. The project beneficiaries were asked to score these parameters using a 6-point Likert scale, assigning a negligible, small, or large preference degree, i.e., an integer value between 0 and 5 to each parameter, where 0 denoted no perceived social impact or “not applicable”, 1–2 a low impact, 3 a moderate impact, 4 a high impact and 5 a very high impact. Therefore, higher values systematically represent more intense perceived social risks or benefits for the corresponding parameter [66].
The social risks and benefits matrix was distributed to all the project partners for scoring. A total of 14 partners participated in the evaluation process, including PT authorities, operators, industry partners, universities and research institutions from European countries. This diverse group of evaluators ensured that the scoring process included various perspectives from public, private and research sectors, needs and backgrounds. The experts were the most relevant and qualified in their field and had a clear understanding of the innovations being assessed. The methodology allowed the collection of a wide range of personal preferences from evaluators from different countries, organisations and professional expertise. This diversity strengthened the evaluation robustness and ensured that the scoring evaluation process captured a broad spectrum of societal perspectives and requirements.
The parameter scores, along with the average weights, as presented in the previous section, were imported to the Visual PROMETHEE 1.4 software for ranking.

3.4. MCDA Ranking Innovations According to SOI

The PROMETHEE methodology is used to rank the eBRT2030 innovations based on their combined effect on the “social risks and benefits” preference degree. For each criterion, PROMETHEE transforms the performance difference between alternatives into a preference degree using criterion-appropriate functions and then aggregates them according to stakeholder-defined weights. From these, PROMETHEE derives the positive flow, Phi+ (how much an innovation outperforms others), and Phi (how much it is outperformed). The difference between them, the net flow (Phi), gives the complete ranking of alternatives (PROMETHEE II). The net flow for each innovation α is then calculated as in (1) [64]:
Phi(a) = [1/(n − 1)] × Σb[π(a,b) − π(b,a)]
where Phi(a): the score of item a, n: the total number of items compared, Σb: the sum of all items b of the comparison set (i.e., b = 1 to b = n, excluding a), π(a,b): the probability item α wins against item b, and π(b,a): the probability item b wins against item α.
In this study, the net flow is interpreted as the SOI: positive values mean societal benefits outweigh risks, and negative values mean the opposite. Values close to zero are interpreted as socially neutral, as those innovations neither clearly outperform nor underperform the others in social terms. Therefore, they require further context-specific judgement and complementary appraisal rather than automatic approval or rejection. The ranking results are presented in Table 3 below.
The results show that positive SOI values (Phi) reflect innovations where societal benefits outweigh risks, while negative values highlight cases where risks dominate. The Adaptive Fleet Scheduling and Planning Tool (C3) ranks highest, with a Phi value of 0.12, indicating strong societal contribution, particularly in improving eBRT service punctuality and reliability by optimising fleet operations in real-time, minimising emissions, and enhancing user communication through real-time updates on service disruptions or delays. The PROMETHEE analysis identifies C3 as the most significant innovation in improving operational efficiency and user satisfaction, key elements of a socially optimised eBRT system. The Intelligent Driver Support and Safety Systems (A2) innovation is the second most influential in creating socially optimised eBRT systems, with a Phi value of 0.11. Innovation A2′s high ranking is due to its social effectiveness in enhancing driver and road user safety. Features such as docking assistance, assisted braking and blind spot monitoring address critical safety concerns, making a significant contribution to the societal acceptability of eBRT systems. The IoT Monitoring Platform with Connected ITS Systems (C1), which ranked next with a Phi-value of 0.09, facilitates predictive maintenance, monitors energy consumption and optimises operations through a 5G-based IoT platform, significantly contributing to achieving societal effectiveness.
Contrastingly, the Bi-directional Modular Charging Systems for Bus-to-Grid Services (B1) ranks lowest, with a negative Phi value of −0.14. The analysis indicates that the societal risks associated with B1, such as safety concerns and challenges in aligning with safety standards, outweigh its societal benefits. Similarly, the Hybrid Charging System with Stationary Battery Buffer (B2) records a Phi value of −0.10. Although the innovation manages and optimises grid limitations and enhances energy efficiency, risks such as increased waste production significantly limit its societal effectiveness. The Optimised Connected Vehicle Digital Twin and Monitoring System (A3) and the Mobility Hub Charging System (B3) record almost equal negative values, around −0.75, suggesting the need for improvements to address their societal impacts, particularly in terms of inclusivity, access and integration.
Innovations C2, A4, A1 and B4 have Phi values that fluctuate around 0.05 and −0.05, indicating moderate to low societal impacts. Although they provide technical and operational advantages, their contribution to social risks and benefits is limited. C2 and A4, with positive Phi values, show a stronger connection with societal benefits. Conversely, A1 and B4, with lower or negative Phi values, highlight the need for further refinement to enhance their societal relevance. These innovations, while important in specific contexts, should be secondary priorities in comparison to those with higher absolute Phi values to achieve societal optimisation of eBRT systems.
The findings on the charging-related innovations, i.e., B1, B2, B3 and C2, should also be interpreted considering the advances in intelligent and data-driven charging optimisation. Mahmud et al. [67] propose a dynamic pricing framework that integrates short-term charging-demand forecasting with deep reinforcement learning for real-time electric vehicle charging price optimisation, achieving both reduced load variance and improved revenue performance. Such AI-based approaches provide a technological basis for enhancing the operational performance of concepts similar to B1 and B2 by enabling more grid-friendly, cost-efficient and responsive charging strategies. When combined with the societal optimisation perspective adopted in this paper, these models can support charging innovations that are not only technically efficient, but also better aligned with social objectives such as grid stability, affordability and reliability.

3.5. Quadrant Analysis of the Innovations

While the Phi-based ranking (Table 3) reports the net societal preference (benefits minus risks), the quadrant analysis adds a two-dimensional view by considering societal benefits (Phi+) and societal risks (Phi) simultaneously. In Figure 1, the x-axis represents Phi+ (positive contribution), and the y-axis represents Phi (negative impacts). The vertical (Phi+ = 0.294) and horizontal (Phi = 0.296) dashed reference lines correspond to the sample means, which define the four quadrants: high/low benefits and high/low risks. All values are unitless PROMETHEE flows derived from the weighted MCDA model. As shown in Figure 1, four groups emerge:
  • Quadrant I (high benefits, high risks): B3 (Mobility Hub Charging System) combines above-average benefits (Phi+ = 0.296) with comparatively high risks (Phi = 0.370), yielding a negative net flow (Phi = −0.074). Despite its lower overall rank, its position indicates optimisation potential, as targeted mitigation of the dominant risks could shift B3 towards Quadrant IV.
  • Quadrant II (low benefits, high risks): B1, B2, A3 and B4 exhibit below-average benefits and above-average risks, consistent with their negative SOI values. For example, B1 (Bi-directional Modular Charging/B2G) records the lowest net flow (Phi = −0.140) due to safety, standards-alignment and integration concerns, while B2 (Hybrid Charging with Stationary Buffer) is penalised by environmental burdens (e.g., added components/waste) despite grid-management advantages. Innovations in this quadrant are the least favourable for near-term deployment and require substantial redesign or risk mitigation measures.
  • Quadrant III (low benefits, low risks): A4 and A1 lie below both means, indicating modest societal salience and comparatively limited risks. A1 (Predictive Maintenance & SoH) sits close to the Phi+ threshold (Phi+ = 0.293), while A4 (Advanced Energy & Thermal Management) is similarly near the boundary (Phi+ = 0.292). These are secondary priorities unless strategic dependencies justify earlier implementation.
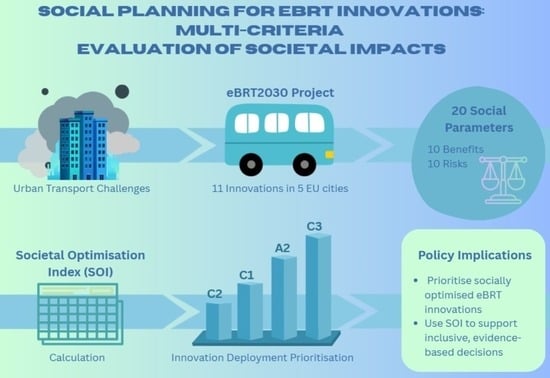
  • Quadrant IV (high benefits, low risks): C3, A2, C1 and C2 combine above-average benefits with below-average risks and represent the most socially optimised set. C3 (Adaptive Fleet Scheduling & Planning) anchors this group with the highest Phi+ (=0.383) and low Phi (=0.260), followed by A2 (Driver Support & Safety) and C1 (IoT/Connected ITS). These are near-term deployment candidates given their favourable benefit–risk profiles.

3.6. PROMETHEE GAIA Web Diagram

To complement the PROMETHEE ranking and the quadrant analysis, the Geometrical Analysis for Interactive Aid (GAIA) Web diagrams visualise how the top-ranked innovations perform across all social risk and benefit parameters. In GAIA, each blue axis represents a parameter; the Preference Indicator (PI) vector in green shows the weighted consensus direction of expert preferences. Parameters whose axes lie closest to the PI vector contribute most to the net preference, and an innovation that extends its profile towards the PI vector tends to align with the most valued criteria. GAIA supports the interpretation; the rankings themselves derive from the numerical flows Phi, Phi+ and Phi.
In the GAIA Web Diagram of innovation C3—Adaptive Fleet Scheduling and Planning Tool Innovation (Figure 2), the PI vector illustrated in green reflects the ideal direction of the experts’ preference, as defined by the weighted combination of all criteria. The axes that lie closest to the PI vector are the parameters that influence the innovation’s net preference score the most. Specifically, the axes BEN1.1 (Improved working conditions) and BEN3.1 (Enhanced safety for eBRT passengers and road users) are highly aligned with the PI vector, indicating that C3 performs exceptionally well on these key benefit criteria. Additionally, RISK6.1 (Limitations of the local electricity distribution network) and RISK4.1 (Increased waste production) are also located near the PI vector. This does not imply that C3 performs poorly in these risk dimensions, rather that C3 appears to manage the specific risks effectively compared to other innovations. The close directional alignment of C3’s grey performance area with the PI vector confirms that this innovation is strongly oriented towards the criteria most valued by experts.
The GAIA Web Diagram of innovation A2 (Intelligent Driver Support and Safety Systems) (Figure 3) shows a broader grey performance area, also extending in the direction of the PI vector. This suggests that A2 performs well across a wider range of criteria, particularly BEN1.1 (Improved working conditions) and BEN3.1 (Enhanced safety for eBRT passengers and road users), which are again aligned with the PI vector. Moreover, A2’s performance area is visibly larger than that of C3, and close to several key axes. At first glance, this could suggest a stronger societal performance. However, GAIA diagrams must be interpreted with caution; the size or shape of the grey performance area does not represent the magnitude of an innovation’s performance, nor does it influence the PROMETHEE ranking. The GAIA map is an interpretive visual tool, while the actual ranking is determined solely by the numerical preference flows (Phi, Phi+, Phi).
Although A2 is a strong performer in societal optimisation, the PROMETHEE results indicate that C3 slightly outperforms it due to a higher Phi+ (benefits) score, while both innovations show comparable Phi (risks) values. This means that C3 achieves a more efficient alignment with the criteria that carry the greatest importance in the societal evaluation.

3.7. Sensitivity Analysis

To assess the robustness of the SOI ranking, a weight-level sensitivity analysis was carried out using the Visual Stability Intervals procedure in Visual PROMETHEE 1.4 [68]. This procedure computes, for each parameter (i.e., risk and benefit), the range of admissible weight variation within which the innovation ranking remains unchanged. In the software, parameters’ weights are expressed as normalised shares of the total weight used in the PROMETHEE aggregation. These shares are proportional to the expert-elicited AB and SSH weights (as reported in Table 2), but are not numerically identical, as they are rescaled within the software. The analysis focused on the benefit parameters with the highest AB and SSH weights (B1.1, B2.1, B3.1, B5.1, B6.1) and the highest-weighted social risks (R2.3, R4.2, R5.1, R6.1), which also emerge as prominent in the GAIA analysis. Table 4 presents, for this subset of key social criteria, (i) the original AB and SSH expert weight, (ii) the corresponding normalised base weight used in the PROMETHEE runs, (iii) the Weight Stability Interval (WSI) and (iv) the resulting bandwidth, defined as the difference between the upper and lower WSI bounds.
Most of the parameters display relatively narrow bands, meaning that WSIs display limited distance between their lower and upper limits. In these cases, the innovation ranking is somewhat sensitive to variations in the weights of these parameters but remains unchanged as long as the weights fluctuate within the WSI range. Under these conditions, innovations C3, A2, C1 and C2 consistently appear as the most socially favourable options, whereas B1 and B2 remain at the bottom of the ordering. For instance, B5.1 (Improved service punctuality and reliability) remains stable for normalised weights between 2.63% and 5.40% (band 2.77 percentage points, base 5%), B2.1 (Increased passenger comfort) for 5.08–7.44% (band 2.36, base 7%), B3.1 (Enhanced safety for passengers and road users) for 0.00–3.69% (band 3.69, base 3%) and B6.1 (Increased resilience in unpredictable situations) for 1.43–4.81% (band 3.38, base 4%). On the risk side, a similar pattern emerges from R5.1 (Reduced service availability and reliability due to IoT failures or cyber threats) remains stable for 5.39–8.37% (band 2.98, base 6%) and R4.2 (Negative impacts on public space from charging infrastructure) for 3.51–6.10% (band 2.59, base 6%).
Some parameters show comparatively wider bands, indicating that the innovation ranking is even less sensitive to variations in their relative importance. This is particularly the case for R2.3 (Inequitable access to real-time information), which is stable for weights between 4.30% and 10.73% (band 6.43, base 5%), and B1.1 (Improved working conditions for drivers, operators and maintenance staff), which remains stable for 0.04–4.74% (band 4.43, base 4%). R6.1 (Limitations of the local electricity distribution network) also exhibits a substantive band, remaining stable between 0.34% and 5.88% (band 5.54, base 5%). These results suggest that even significant changes in the perceived importance of improved working conditions, grid-related risks or information equity do not immediately overturn the SOI ranking. Only when these weights are pushed well beyond the expert-elicited values do rank reversals begin to appear among some mid-ranked innovations.
Overall, the sensitivity analysis indicates that the proposed MCDA/PROMETHEE framework is locally robust to realistic variations in stakeholder preferences. Within the empirically plausible ranges defined by the expert panel, the SOI ranking is not driven by a single fragile weight configuration. The group of high-performing innovations (C3, A2, C1, C2) and the least favourable charging-related options (B1, B2) remain consistently identified. At the same time, the stability intervals highlight that social criteria such as working conditions, information equity and grid-related risks could, under substantial shifts in policy priorities, legitimately influence the relative position of specific innovations. This behaviour is desirable in a participatory decision-support context, as it preserves robustness while making it explicit where value judgements matter most.

4. Discussion

Transport policy must deliver systems that are environmentally sustainable, socially inclusive, economically viable and safe. Yet, planning practice often foregrounds engineering and cost metrics while underplaying societal effects. This paper addresses that gap with an ex-ante framework for assessing the societal optimisation of eBRT innovations, using MCDA/PROMETHEE to compute a Societal Optimisation Index (SOI) from the preference flows (Phi, Phi+, Phi). The goal is not to replace cost–benefit evaluations, but rather to supplement them and further support decision-making processes.
Applied to the eBRT2030 innovations, the results show clear differentiation in social performance. Innovations that enhance service reliability, safety and user experience tend to perform strongly, whereas innovations involving infrastructure, grid integration, or charging systems score lower due to their associated risks. High performing innovations, such as C3 (Adaptive Fleet Scheduling and Planning), A2 (Intelligent Driver Support and Safety System) and C1 (IoT Monitoring Platform), rank at the top, driven by direct and visible social benefits with comparatively manageable risks. Innovation C3 improves punctuality, reliability and working conditions—benefits that are highly valued by both experts and users. Innovation A2 scores high due to its contribution to safety, a criterion consistently weighed as critical. Similarly, C1 enhances system oversight and preventive maintenance, supporting smoother service operation and delivery.
In contrast, lower-ranked innovations—like B1 (Bi-directional Modular Charging (B2G), B2 (Hybrid Charging with Stationary Buffer) and A3 (Optimised Connected Vehicle Digital Twin and Monitoring System)—are characterised by higher infrastructural implications and are associated with higher societal risks; for example, safety, environmental burdens and integration, which outweigh their benefits. Charging-related and grid-interactive systems carry risks related to urban space use and energy demand, risks that were assigned substantial weights by experts. These innovations also tend to produce benefits that are less visible to passengers. For example, B1 yields environmental advantages, yet its perceived safety concerns outweigh those benefits. Similarly, A3 brings value to daily operations and the eBRT system’s resiliency, but introduces skill gap concerns.
Additionally, the sensitivity analysis conducted using PROMETHEE Weight Stability Intervals confirms that the SOI-based ranking is locally robust to plausible variations in stakeholder preferences. Across the admissible weight ranges for the most influential social risks and benefits, the group of high-performing innovations (C3, A2, C1, C2) and the least favourable (B1, B2, A3, B4) remains unchanged, while rank reversals occur only for some mid-ranked alternatives under substantial shifts in criterion importance. This finding reinforces the validity of the proposed prioritisation logic, while also highlighting where changes in policy priorities could legitimately influence implementation choices.
To facilitate the translation of the results into actionable planning insights, a brief prioritisation logic can be established based on the PROMETHEE quadrant analysis. The quadrant analysis clarifies trade-offs by separating benefits (Phi+) from risks (Phi). Innovations in Quadrant IV (C3, A2, C1, C2) combine high societal benefits with low societal risks and therefore represent the most suitable options for early deployment. These innovations improve punctuality, safety and operational efficiency and require only routine integration measures. By contrast, innovations located in Quadrant II (B1, B2, A3, B4), characterised by low benefits and comparatively high risks, should not be implemented without significant enabling conditions. These include compliance with safety standards, alignment with distribution system operator planning, thorough cybersecurity assessments and robust waste minimisation strategies. Measures in Quadrant I (i.e., B3) offer moderate benefits but face elevated risks, suggesting that targeted mitigation—rather than full redesign—could shift them towards a more favourable quadrant. Quadrant III innovations (A1, A4) are low-risk but also low-impact and may be implemented where operational dependencies justify their integration.
To provide practical guidance for policymakers and transport authorities, Table 5 summarises the top mitigation or enabling actions required for each innovation, supporting informed, stepwise implementation strategies aligned with the societal optimisation results. It should be noted that the proposed mitigation actions in Table 5 were derived directly from the social risk parameters linked to each innovation (see Table 2), their position in the quadrant analysis, and their functional role within the system, ensuring that each action responds to clearly identified societal risks and real-world implementation needs.
It is noteworthy that the Horizon Europe eBRT2030 project is currently ongoing, and the deployment of the evaluated innovations has not yet been initiated. Thus, a key limitation of this study is that it cannot yet assess how the findings have influenced policy and decision-making in demo cities. This analysis can only be conducted after the project′s completion, when real-world implementation data becomes available.
In conclusion, this research underscores the critical role of incorporating societal considerations into the planning and evaluation of transport innovations. By employing a structured and comprehensive approach, where societal feedback is actively integrated, the study provides actionable insights for policymakers, transport planners and stakeholders. The findings advocate an iterative and inclusive approach to assess the social impact of transport innovations. This ensures that eBRT systems not only achieve operational and environmental objectives, but also deliver meaningful benefits to communities, fostering wider acceptance and long-term sustainability. The proposed framework sets a precedent for embedding ex-ante societal assessments in transport planning, contributing to the broader goals of sustainable and socially responsive mobility systems.

Limitations and Further Research

The study offers a comprehensive approach to evaluating the societal optimisation of the eBRT innovations; however, some limitations should be acknowledged before applying the framework to other contexts.
Although the PROMETHEE-MCDA approach supports decision-makers in determining a preference ordering of a finite set of options, it has inherent pitfalls. The subjectivity of the stakeholders’ judgement means that the weight and score assignment depend heavily on the players’ priorities, objectives and needs, as they may interpret the social impact differently, potentially introducing bias [69]. Future research should explore the effect of participatory extension beyond multidisciplinary professionals to include eBRT users, citizen groups, investors, operators and government parties [70,71]. This broader engagement could produce different weightings and potential shifts in rankings [72,73]. Thus, the current framework should be understood as producing compromise rankings that balance multiple criteria, rather than the best possible outcome for any single stakeholder group.
In a similar vein, it should be mentioned that the criteria selection and the scoring parameters used in this study were derived exclusively from experts and stakeholders associated with the five European demonstration sites. Consequently, the resulting SOI reflects European socio-economic and cultural contexts and should not be assumed transferable to non-European settings.
The deterministic nature of the MCDA, which assumes fixed weights and scores, overlooks critical uncertainties in stakeholders’ preferences. This simplification limits the method’s ability to accommodate the variability of preferences, which are often heterogenous, arbitrary and non-consensus [74]. By aggregating diverse and often conflicting objectives into a single Societal Optimisation Index (SOI), important trade-offs may be obscured, and minority stakeholder concerns marginalised. Failing to manage these uncertainties could lead to compounded uncertainty in analysis and decision outcomes [75].
The present framework treats each innovation separately, assuming additive effects while excluding interactions between options. However, parallel deployment of multiple innovations might operate synergistically or antagonistically, generating social risks or benefits that would not arise if they were implemented alone. Future research should explore these interdependencies and system-level dynamics to provide a more realistic reflection of societal optimisation outcomes.
Finally, due to the ex-ante assessment feature of this study, our findings reflect hypothetical social impacts rather than realised outcomes, limiting the generalisability to large-scale operational contexts. Therefore, longitudinal studies tracking actual implementation and societal outcomes are essential to evaluate whether predicted impacts materialise in practice. This connection will be further explored in our future research, once post-implementation evidence becomes available, allowing us to compare predicted societal impacts with observed or perceived outcomes. Such a revision plan will rely on an ex-post social index analysis conducted per innovation, which, in turn, will be based on measurable KPIs defined in the project’s impact assessment framework (i.e., KPIs used for reliability, safety, physical and information accessibility, overall passenger satisfaction with security/comfort/safety, etc.). Comparisons via rank correlation and qualitative analysis will allow us to assess the predictive validity of the SOI model and refine our framework where needed.

Author Contributions

M.M.: conceptualization, methodology, software, formal analysis, resources, supervision, project administration, funding acquisition. I.S.A.: investigation, data curation, writing—original draft, visualisation, preparation, validation, formal analysis, writing—review and editing. M.C.: investigation, writing—review and editing. All authors have read and agreed to the published version of the manuscript.

Funding

This work has received funding from the European Union’s Horizon Europe research and innovation programme under Grant Agreement No. 101095882 (eBRT2030—European Bus Rapid Transit of 2030: electrified, automated, connected). The APC was funded by the same grant.

Data Availability Statement

The datasets presented in this article are not publicly available due to GDPR principles applied. They consist of expert-elicited MCDA scoring matrices generated within the Horizon Europe eBRT2030 project and contain potentially identifiable information.

Acknowledgments

The authors acknowledge the support of the Horizon Europe project eBRT2030–European Bus Rapid Transit of 2030: electrified, automated, connected (Grant Agreement No. 101095882), whose consortium partners contributed essential technical insights and data for the development and validation of the methodological framework. The authors further thank the Advisory Board (AB), the Social Sciences and Humanities (SSH) experts and all project beneficiaries who participated in the scoring exercise and provided valuable practical knowledge from real-world transport operations.

Conflicts of Interest

The authors declare no conflicts of interest.

Abbreviations

The following abbreviations are used in this manuscript:
GHGGreenhouse Gas
EUEuropean Union
PTPublic Transport
BRTBus Rapid Transit
ITSIntelligent Transport System
GPSGlobal Positioning System
eBRTelectrified-Bus Rapid Transit
LoSLevel of Service
MCAMulti-Criteria Analysis
MCDAMulti- Criteria Decision Analysis
SOISocietal Optimisation Index
CBACost–Benefit Analysis
CEACost–Effectiveness Analysis
PROMETHEEPreference Ranking Organisation Method
ABAdvisory Board
SSHSocial Sciences and Humanities
GAIAGeometrical Analysis for Interactive Aid
PIPreference Indicator
WSIVisual Stability Interval

References

  1. Anupriya, P.; Bansal, D.J.; Graham, D.J. Congestion in cities: Can road capacity expansions provide a solution? Transp. Res. Part A Policy Pract. 2023, 174, 103109. [Google Scholar] [CrossRef]
  2. Bucsky, P.; Juhász, M. Long-term evidence on induced traffic: A case study on the relationship between road traffic and capacity of Budapest bridges. Transp. Res. Part A Policy Pract. 2022, 157, 244–257. [Google Scholar] [CrossRef]
  3. European Environment Agency (EEA). Greenhouse Gas Emissions from Transport in Europe. Available online: https://www.eea.europa.eu/en/analysis/indicators/greenhouse-gas-emissions-from-transport?activeAccordion= (accessed on 27 October 2025).
  4. European Environment Agency (EEA). Transport and Mobility—In-Depth Topics. Available online: https://www.eea.europa.eu/en/topics/in-depth/transport-and-mobility (accessed on 27 October 2025).
  5. Khurshid, A.; Khan, K.; Chen, Y.; Cifuentes-Faura, J. Do green transport and mitigation technologies drive OECD countries to sustainable path? Transp. Res. Part D Transp. Environ. 2023, 118, 103611. [Google Scholar] [CrossRef]
  6. European Commission. The European Green Deal: Communication from the Commission; European Commission: Brussels, Belgium, 2019.
  7. European Commission. The Transport and Mobility Sector—Factsheet. Available online: https://ec.europa.eu/commission/presscorner/api/files/attachment/867229/Factsheet%20-%20The%20Transport%20and%20Mobility%20Sector.pdf (accessed on 27 October 2025).
  8. European Commission. Sustainable and Smart Mobility Strategy—Putting European Transport on Track for the Future: Communication from the commission; European Commission: Brussels, Belgium, 2020.
  9. European Commission. The New EU Urban Mobility Framework. Communication from the Commission; European Commission: Brussels, Belgium, 2021.
  10. Loder, A.; Cantner, F.; Adenaw, L.; Nachtigall, N.; Ziegler, D.; Ziegler, F.; Siewert, M.B.; Wurster, S.; Goerg, S.; Lienkamp, M. Observing Germany’s nationwide public transport fare policy experiment “9-Euro-Ticket”—Empirical findings from a panel study. Case Stud. Transp. Policy 2024, 15, 100987. [Google Scholar] [CrossRef]
  11. Cervero, R. The Transit Metropolis—A Global Inquiry; Island Press: Washington, DC, USA, 1998; pp. 1–300. [Google Scholar]
  12. Lajunen, A.; Lipman, T. Lifecycle cost assessment and carbon dioxide emissions of diesel, natural gas, hybrid electric, fuel cell hybrid and electric transit buses. Energy 2016, 106, 329–342. [Google Scholar] [CrossRef]
  13. Jarzab, J.T.; Lightbody, J.; Maeda, E. Characteristics of Bus Rapid Transit Projects: An Overview. J. Public Transp. 2002, 5, 31–46. [Google Scholar] [CrossRef]
  14. Volvo Research and Education Foundations (VREF); International Association of Public Transport (UITP); BRT+ Centre of Excellence. Transforming Cities with Bus Rapid Transit (BRT) Systems—How to Integrate BRT? UITP: Brussels, Belgium, 2019; Available online: https://www.uitp.org/wp-content/uploads/sites/7/2025/04/BRT_ENG_Web.pdf (accessed on 27 October 2025).
  15. BRTdata.org. Panorama per Country. Available online: https://brtdata.org (accessed on 15 September 2025).
  16. Deng, T.; Nelson, J.D. Bus Rapid Transit implementation in Beijing: An evaluation of performance and impacts. Res. Transp. Econ. 2013, 39, 108–113. [Google Scholar] [CrossRef]
  17. Wright, L.; Hook, W. Bus Rapid Transit Planning Guide; Institute for Transportation & Development Policy (ITDP): New York, NY, USA, 2007; pp. 1–350. [Google Scholar]
  18. Hensher, D.A.; Golob, T.F. Bus rapid transit systems: A comparative assessment. Transport 2008, 35, 501–518. [Google Scholar] [CrossRef]
  19. Du, H.; Kommalapati, R.R. Environmental sustainability of public transportation fleet replacement with electric buses in Houston, a megacity in the USA. Int. J. Sustain. Eng. 2021, 14, 1858–1870. [Google Scholar] [CrossRef]
  20. Chatman, D.; Rayle, L.; Palacios, M.S.; Cervero, R. Sustainable and Equitable Transportation in Latin America, Asia and Africa: The Challenges of Integrating BRT and Private Transit Services; UC Berkeley Center for Future Urban Transport, Institute of Transportation Studies, University of California: Berkeley, CA, USA, 2019; pp. 1–75. [Google Scholar]
  21. Hrelja, R.; Levin, L.; Camporeale, R. Handling social considerations and the needs of different groups in public transport planning: A review of definitions, methods, and knowledge gaps. Eur. Transp. Res. Rev. 2024, 16, 5. [Google Scholar] [CrossRef]
  22. Jones, P.; Lucas, K. The social consequences of transport decision-making: Clarifying concepts, synthesizing knowledge and assessing implications. J. Transp. Geogr. 2012, 21, 4–16. [Google Scholar] [CrossRef]
  23. Mottee, L.K.; Arts, J.; Vanclay, F.; Howitt, R.; Miller, F. Limitations of technical approaches to transport planning practice in two cases: Social issues as a critical component of urban project. Plan. Theory Pract. 2019, 21, 39–57. [Google Scholar] [CrossRef]
  24. Naranjo, W.; Camargo, L.E.M.; Pereda, J.E.; Cortes, C. Design of electric buses of rapid transit using hybrid energy storage and local traffic parameters. IEEE Trans. Veh. Technol. 2016, 66, 5551–5563. [Google Scholar] [CrossRef]
  25. Rios, M.A.; Ramos, G.A.; Zambrano, S. Simulation of the power supply for a flash charging eBRT system. In Proceedings of the 2015 IEEE Workshop on Power Electronics and Power Quality Applications (PEPQA), Bogota, CO, USA, 25–26 June 2015; pp. 1–6. [Google Scholar] [CrossRef]
  26. International Association of Public Transport (UITP). Local Public Transport in the EU—Public Transport Sector Priorities for the Legislative Term 2024–2029; UITP: Brussels, Belgium, 2024. [Google Scholar]
  27. Miller, P.; de Barros, A.G.; Kattan, L.; Wirasinghe, S.C. Public transportation and sustainability: A review. Sustain. Urban Transp. Syst. 2006, 20, 1076–1083. [Google Scholar] [CrossRef]
  28. Tiwari, G.; Phillip, C. Development of public transport systems in small cities: A roadmap for achieving sustainable development goal indicator 11.2. IATSS Res. 2021, 45, 31–38. [Google Scholar] [CrossRef]
  29. van Burgsteden, M.; Grigolon, M.; Geurs, K. Improving community wellbeing through transport policy: A literature review and theoretical framework, based on the Capability Approach. Transp. Rev. 2024, 44, 1161–1186. [Google Scholar] [CrossRef]
  30. Niehaus, M.; Galilea, P.; Hurtubia, R. Accessibility and Equity: An Approach for Wider Transport Project Assessment in Chile. Res. Transp. Econ. 2016, 59, 412–422. [Google Scholar] [CrossRef]
  31. Lucas, K. A new evolution for transport related social exclusion research? J. Transp. Geogr. 2019, 81, 102529. [Google Scholar] [CrossRef]
  32. Dupuit, J. On the measurement of the utility of public works. Ann. Ponts Chaussées 1844, 2, 83–110. [Google Scholar]
  33. Eliasson, J.; Lundberg, M. Do cost–benefit analyses influence transport investment decisions? Experiences from the Swedish Transport Investment Plan 2010–21. Transp. Rev. 2012, 32, 29–48. [Google Scholar] [CrossRef]
  34. Povellato, A.; Bosello, F.; Giupponi, C. Cost-effectiveness of greenhouse gases mitigation measures in the European agro-forestry sector: A literature survey. Environ. Sci. Policy 2007, 10, 474–490. [Google Scholar] [CrossRef]
  35. Hickman, R.; Dean, M. Incomplete Cost—Incomplete Benefit Analysis in Transport Appraisal. Transp. Rev. 2018, 38, 689–709. [Google Scholar] [CrossRef]
  36. Mackie, P.; Worsley, T.; Eliasson, J. Transport Appraisal Revisited. Res. Transp. Econ. 2014, 47, 3–18. [Google Scholar] [CrossRef]
  37. Fearnley, N.; Veisten, K. Cost-Benefit Appraisal of Universal Design in Public Transport and Walking/Cycling Infrastructure. In Studies in Health Technology and Informatics; IOS Press: Amsterdam, The Netherlands, 2024; ISBN 978-1-64368-552-6. [Google Scholar] [CrossRef]
  38. Song, Y.; Whitney, W.; Zhang, W.C.B.; Caulfield, B.; Martinez-Covarrubias, J. Sustainable transport appraisal: A literature review and implications for policy makers. In Transport Transitions: Advancing Sustainable and Inclusive Mobility, Proceedings of the 10th TRA Conference, Dublin, Ireland, 15–18 April 2024; Springer Nature: Cham, Switzerland, 2025; Volume 2: Sustainable Transport Development, pp. 627–632. [Google Scholar]
  39. Barfod, M.B.; Salling, K.B. A new composite decision support framework for strategic and sustainable transport appraisals. Transp. Res. Part A Policy Pract. 2015, 72, 1–15. [Google Scholar] [CrossRef]
  40. Browne, D.; Ryan, L. Comparative analysis of evaluation techniques for transport policies. Environ. Impact Assess. Rev. 2011, 31, 226–233. [Google Scholar] [CrossRef]
  41. Mulley, C.; Weisbrod, G. Workshop 8 Report: The Wider Economic, Social and Environmental Impacts of Public Transport Investment. Res. Transp. Econ. 2016, 59, 397–400. [Google Scholar] [CrossRef]
  42. Annema, J.A.; Koopmans, C.; Van Wee, B. Evaluating Transport Infrastructure Investments: The Dutch Experience with a Standardized Approach. Transp. Rev. 2007, 27, 125–150. [Google Scholar] [CrossRef]
  43. Venter, C. Assessing the potential of bus rapid transit-led network restructuring for enhancing affordable access to employment —The case of Johannesburg’s Corridors of Freedom. Res. Transp. Econ. 2016, 59, 441–449. [Google Scholar] [CrossRef]
  44. Bocarejo, J.P.S.; Oviedo, D.R.H. Transport accessibility and social inequities: A tool for identification of mobility needs and evaluation of transport investments. J. Transp. Geogr. 2012, 24, 142–154. [Google Scholar] [CrossRef]
  45. Utsunomiya, K. Social Capital and Local Public Transportation in Japan. Res. Transp. Econ. 2016, 59, 434–440. [Google Scholar] [CrossRef]
  46. Stanley, J.; Stanley, J. Improving Appraisal Methodology for Land Use Transport Measures to Reduce Risk of Social Exclusion. Sustainability 2023, 15, 11902. [Google Scholar] [CrossRef]
  47. Carse, A. Assessment of Transport Quality of Life as an Alternative Transport Appraisal Technique. J. Transp. Geogr. 2011, 19, 1037–1045. [Google Scholar] [CrossRef]
  48. Tricker, R.C. Assessing Cumulative Environmental Effects from Major Public Transport Projects. Transp. Policy 2007, 14, 293–305. [Google Scholar] [CrossRef]
  49. van Oort, N.; Yap, M. Chapter Six—Innovations in the appraisal of public transport projects. In Advances in Transport Policy and Planning; Mouter, N., Ed.; Academic Press: Cambridge, MA, USA, 2021; Volume 7, pp. 127–164. [Google Scholar] [CrossRef]
  50. Mouter, N.; Cabral, M.O.; Dekker, T.; Van Cranenburgh, S. The value of travel time, noise pollution, recreation and biodiversity: A social choice valuation perspective. Res. Transp. Econ. 2019, 76, 100733. [Google Scholar] [CrossRef]
  51. Tiwari, G.; Jain, D. Accessibility and safety indicators for all road users: Case study Delhi BRT. J. Transp. Geogr. 2012, 22, 87–97. [Google Scholar] [CrossRef]
  52. Geurs, K.T.; Boon, W.; van Wee, B. Social impacts of transport: Literature review and the state of practice of transport appraisal in the Netherlands and the United Kingdom. Transp. Rev. 2009, 29, 69–90. [Google Scholar] [CrossRef]
  53. Cao, X.; Chen, H.; Liang, F.; Wang, W. Measurement and spatial differentiation characteristics of transit equity: A case study of Guangzhou, China. Sustainability 2018, 10, 1069. [Google Scholar] [CrossRef]
  54. Asgharpour, S.; Allahyari, A.; Mohammadi, M.; Mohammadian, R.; Mohammadian, A.; Abraham, C. Investigating equity of public transit accessibility: Comparison of accessibility among disadvantaged groups in Cook County, IL. In Proceedings of the International Conference on Transportation and Development 2023: Transportation Planning, Operations, and Transit, Austin, TX, USA, 14–17 June 2023; ASCE: Reston, VA, USA, 2023. [Google Scholar] [CrossRef]
  55. Verlinghieri, E.; Schwanen, T. Transport and mobility justice: Evolving discussions. J. Transp. Geogr. 2020, 87, 102798. [Google Scholar] [CrossRef]
  56. Hay, A.; Meredith, K.; Vickerman, R. The Impact of the Channel Tunnel on Kent and Relationships with Nord-Pas de Calais; Centre for European, Regional and Transport Economics: Canterbury, UK, 2004. [Google Scholar]
  57. Dean, M.; Hickman, R.; Chen, C.-L. Testing the Application of Participatory MCA: The Case of the South Fylde Line. Transp. Policy 2019, 73, 62–70. [Google Scholar] [CrossRef]
  58. Morfoulaki, M.; Papathanasiou, J. Use of PROMETHEE MCDA Method for Ranking Alternative Measures of Sustainable Urban Mobility Planning. Mathematics 2021, 9, 602. [Google Scholar] [CrossRef]
  59. Basbas, S.; Makridakis, C.M. A Review of the Contribution of Multi-Criteria Analysis to the Evaluation Process of Transportation Projects. Int. J. SDP 2007, 2, 387–407. [Google Scholar] [CrossRef]
  60. Ishizaka, A.; Nemery, P. Multi-Criteria Decision Analysis: Methods and Software; Wiley: Chichester, UK, 2013. [Google Scholar] [CrossRef]
  61. Camargo Perez, J.; Carrillo, M.H.; Montoya-Torres, J.R. Multi-criteria approaches for urban passenger transport systems: A literature review. Ann. Oper. Res. 2015, 226, 69–87. [Google Scholar] [CrossRef]
  62. Singh, M.; Pant, M. A review of selected weighting methods in MCDM with a case study. Int. J. Syst. Assur. Eng. Manag. 2021, 12, 126–144. [Google Scholar] [CrossRef]
  63. Brans, J.P.; Mareschal, B.; Vincke, P. PROMETHEE: A new family of outranking methods in MCDM. In Operational Research84 (IFORS’84); Brans, J.P., Ed.; Springer: Berlin/Heidelberg, Germany, 1984; pp. 477–490. [Google Scholar]
  64. Brans, J.P.; Vincke, P.; Mareschal, B. How to select and how to rank projects: The PROMETHEE method. Eur. J. Oper. Res. 1986, 14, 228–238. [Google Scholar] [CrossRef]
  65. Papathanasiou, J.; Ploskas, N. PROMETHEE. In Multiple Criteria Decision Aid; Springer: Cham, Switzerland, 2018; pp. 115–134. [Google Scholar] [CrossRef]
  66. Blouchoutzi, A.; Manou, D.; Papathanasiou, J. A PROMETHEE MCDM application in social inclusion: The case of foreign-born population in the EU. Syst. Pract. Soc. Sci. 2021, 9, 45. [Google Scholar] [CrossRef]
  67. Mahmud, M.; Abedin, T.; Rahman, M.M.; Shoishob, S.A.; Kiong, T.S.; Nur-E-Alam, M. Integrating demand forecasting and deep reinforcement learning for real-time electric vehicle charging price optimization. Util. Policy 2025, 96, 102038. [Google Scholar] [CrossRef]
  68. Doan, N.A.V.; De Smet, Y. An Alternative Weight Sensitivity Analysis for PROMETHEE II Rankings. Omega 2018, 80, 166–174. [Google Scholar] [CrossRef]
  69. Marttunen, M.; Belton, V.; Lienert, J. Are objectives hierarchy related biases observed in practice? A meta-analysis of environmental and energy applications of Multi-Criteria Decision Analysis. Eur. J. Oper. Res. 2018, 265, 178–194. [Google Scholar] [CrossRef]
  70. Barfod, M.B. Supporting sustainable transport appraisals using stakeholder involvement and MCDA. Transport 2018, 33, 1052–1066. [Google Scholar] [CrossRef]
  71. Dean, M. Multi-criteria analysis. In Advances in Transport Policy and Planning; Academic Press: Cambridge, MA, USA, 2020; Volume 6, pp. 165–224. [Google Scholar] [CrossRef]
  72. Hobbs, B.; Meier, P. Energy Decisions and the Environment: A Guide to the Use of Multicriteria Methods; Kluwer Academic Publishers: Massachusetts, MA, USA, 2020. [Google Scholar] [CrossRef]
  73. Jensen, A.V.; Barfod, M.B.; Leleur, S. Estimating the robustness of composite CBA and MCA assessments by variation of criteria importance order. In New State of MCDM in the 21st Century; Springer: Berlin/Heidelberg, Germany, 2009; pp. 59–66. [Google Scholar] [CrossRef]
  74. Mousseau, V.; Figueira, J.; Dias, L.; Gomes da Silva, C.; Climaco, J. Resolving inconsistencies among constraints on the parameters of an MCDA model. Eur. J. Oper. Res. 2003, 147, 72–93. [Google Scholar] [CrossRef]
  75. Dorini, G.; Kapelan, Z.; Azapagic, A. Managing uncertainty in multiple-criteria decision making related to sustainability assessment. Clean Technol. Environ. Policy 2011, 13, 133–139. [Google Scholar] [CrossRef]
Figure 1. Quadrant Analysis of eBRT2030 innovations based on PROMETHEE Phi and Phi+.
Wevj 16 00661 g001
Figure 2. GAIA Web Diagram of the social parameter of innovation C3.
Wevj 16 00661 g002
Figure 3. GAIA Web Diagram of the social parameter of innovation A2.
Wevj 16 00661 g003
Table 1. List of the eBRT2030 innovations and their categorisation.
IDInnovation NameDescriptionPilot City
Category A: Vehicle systems
A1Predictive Maintenance Strategies & Battery State-of-Health EstimationForecasting electric bus component health (i.e., the battery), through big data analysis.Barcelona,
Rimini
A2Intelligent Driver Support and Safety SystemsEnhances driver safety using cameras and radar systems to provide real-time data on road conditions, including features such as docking assistance, assisted braking, blind spot monitoring, narrow navigation assistance, automated traffic signal control and zone management.Barcelona,
Rimini
A3Optimised Connected Vehicle Digital Twin and Monitoring System Digital twin replicating both transport and power supply operations (aids intelligent operator assistance, autonomous navigation and lifetime testing). Athens
A4Advanced Energy and Thermal Management Optimises battery usage and vehicle energy consumption, including heating, ventilation and air conditioning management under all conditions. Amsterdam, Prague
Category B: eBRT charging infrastructure and depot
B1 Bi-directional Modular Charging Systems for Bus-to-Grid Services Enables buses to supply energy back to the grid, stabilising energy supply and reducing peak loads. Barcelona
B2 Hybrid Charging System with Stationary Battery Buffer Combines grid connection with energy storage, enabling charging from stationary buffer or grid, managing grid limitations and optimising operations.Amsterdam
B3 Mobility Hub Charging System Integrates charging infrastructure into mobility hubs, facilitating shared use among various electric modes. Rimini
B4 In-Motion (Hybrid) Charging Systems Utilises overhead contact lines for charging, reducing the need for depot chargers. Athens, Prague
Rimini
Category C: Automation, management and IoT connectivity systems
C1 IoT Monitoring Platform with Connected ITS Systems 5G-based IoT platform for monitoring vehicles and charging infrastructure, enabling condition monitoring, predictive maintenance and optimised energy consumption. Barcelona, Amsterdam, Athens,
Prague, Rimini
C2 Efficient, Integrated, and Smart Charging Management Systems Smart charging strategies to reduce costs, battery wear and grid utilisation while considering passenger demand variations and weather conditions. Barcelona, Amsterdam, Prague
C3 Adaptive Fleet Scheduling and Planning Tool AI-based adaptive scheduling using real-time parameters to optimise fleet operations, reduce costs and minimise emissions. Provides real-time updates to users about service changes, delays and disturbances. Athens,
Rimini
Table 2. Social risk and benefit weights and correlation with the eBRT2030 innovations.
IDRisk Parameter DescriptionRelated INNOWeight (%)
Cluster R1: Skill gaps, job uncertainty and labour disputes
R1.1 Skill gaps that should be addressed in a short time period. A2, A3 10.00
Cluster R2: Reduced access, complexity and inequality
R2.1 Limited individual access to charging infrastructure in stations/hubs due to increased demand. B3 4.65
R2.2 Unequal access to charging payment options, potentially excluding individuals unfamiliar with digital payment systems. B3 6.66
R2.3 Inequitable access to real-time eBRT information if reliant on smartphone apps. C3 10.11
Cluster R3: Safety, security and data privacy risks
R3.1 Data privacy vulnerabilities from cyber threats targeting the eBRT system. A2, C1, C3 8.73
R3.2 Safety risks due to non-compliance with electrical safety standards (i.e., insulation and grounding, fire prevention). B1, B3, B4 7.27
Cluster R4: Environmental and urban landscape impacts
R4.1 Increased waste production due to frequent replacement of bus components, such as batteries. A2, B2 5.27
R4.2 Negative impacts on public space due to eBRT charging infrastructure (i.e., conflicts for land use or aesthetic issues when installing charging infrastructures and pantographs). B4 11.97
Cluster R5: Service reliability challenges
R5.1 Reduced service availability and reliability due to IoT failures or cyber threats. C1, C2, C3 18.40
Cluster R6: Power supply instability
R6.1 Limitations of the local electricity distribution network due to the high-power demand of eBRT operations, especially in areas where grid capacity has not been upgraded or coordinated with the distribution system operator. B3, B4 17.00
Risks Weight Total =100
IDBenefit Parameter DescriptionRelated INNOWeight (%)
Cluster B1: Enhanced efficiency and comfort of professionals
B1.1 Improved working conditions for drivers, operators and maintenance staff through optimised monitoring, intelligent driver support, safety systems and advanced battery maintenance strategies.A1, A2, A3
C1, C2, C3
11.00
Cluster B.2 Improved user access and experience
B2.1 Increased passenger comfort with reduced vibrations, quieter journeys and better in-vehicle temperature control.A4 16.33
B2.2 Enhanced real-time information for passengers, both pre-trip and during travel.C3 4.67
B2.3 Improved access to multimodal interchanges integrating shared and active mobility options.A2 7.00
Cluster B3: Enhanced safety for all road users
B3.1 Enhanced safety for passengers and road users (in-vehicle, embarkation/disembarkation)A2 10.00
Cluster B4: Positive impacts on environment/city landscape/land use
B4.1 Reduced waste production from the eBRT bus and its components (i.e., batteries).A1, Β4, C2 5.74
B4.2 Improved energy efficiency/energy savings during eBRT operation.B1, B2 7.17
B4.3 Optimised public space usage for charging infrastructure and system operations.B3, B4 5.50
Cluster B5: Improved service reliability
B5.1 Improved eBRT service punctuality and reliability.C3 20.00
Cluster B6: Increased eBRT system resilience
B6.1 Increased eBRT resilience in unpredictive situations.A3 12.60
Benefits Weight Total =100
Table 3. Ranking the innovations according to the “social risks and benefits” preference degrees.
RankIDInnovation NamePhiPhi+Phi
1 C3 Adaptive Fleet Scheduling and Planning Tool 0.1229 0.3826 0.2597
2 A2 Intelligent Driver Support and Safety Systems 0.1149 0.3730 0.2581
3 C1 IoT Monitoring Platform with Connected ITS Systems 0.0888 0.3606 0.2718
4 C2 Efficient, Integrated, and Smart Charging Management Systems 0.0529 0.3153 0.2624
5 A4 Advanced Energy and Thermal Management 0.0381 0.2920 0.2538
6 A1 Predictive Maintenance Strategies & Battery State-of-Health Estimation 0.0036 0.2934 0.2899
7 B4 In-Motion (Hybrid) Charging Systems −0.0518 0.2621 0.3139
8 B3 Mobility Hub Charging System −0.0742 0.2962 0.3703
9 A3 Optimised Connected Vehicle Digital Twin and Monitoring System −0.0756 0.2413 0.3170
10 B2 Hybrid Charging System with Stationary Battery Buffer −0.1027 0.2308 0.3336
11 B1 Bi-directional Modular Charging Systems for Bus-to-Grid Services −0.1398 0.1862 0.3260
Table 4. Weight Stability Intervals for key social risk and benefit parameters.
IDParameter DescriptionExpert Weight (%)Normalised Weight (%)WSI (%)Range
Risks
R5.1 Reduced service availability and reliability due to IoT failures or cyber threats. 18.406[5.39, 8.37]2.98
R6.1 Limitations of the local electricity distribution network due to the high-power demand of eBRT operations, especially in areas where grid capacity has not been upgraded or coordinated with the distribution system operator. 17.005[0.34, 5.88]5.54
R4.2 Negative impacts on public space due to charging infrastructure (i.e., conflicts for land use or aesthetic issues when installing charging infrastructures and pantographs). 11.976[3.51, 6.10]2.59
R2.3 Inequitable access to real-time information if reliant on smartphone apps. 10.115[4.30, 10.73]6.43
Benefits
B5.1 Improved service punctuality and reliability. 20.005[2.63, 5.40]2.77
B2.1 Increased passenger comfort with reduced vibrations, more quiet journeys and better in-vehicle temperature control. 16.337[5.08, 7.44]2.36
B6.1 Increased resilience in unpredictive situations. 12.604[1.43, 4.81]3.38
B1.1 Improved working conditions for drivers, operators and maintenance staff through optimised monitoring, intelligent driver support, safety systems and advanced battery maintenance strategies. 11.004[0.04, 4.74]4.43
B3.1 Enhanced safety for passengers and road users (in-vehicle, embarkation/disembarkation) 10.003[0.00, 3.69]3.69
Table 5. Recommended prioritisation and key mitigation actions for each innovation.
IDInnovation NamePriority LevelEnabling Action
Quadrant IV
C3Adaptive Fleet Scheduling and Planning ToolHighIntegration with existing ITS; data governance; staff training in real-time operations
A2Advanced Energy and Thermal Management HighDriver training; validation with safety authorities; alignment with road safety protocols
C1IoT Monitoring Platform with Connected ITS SystemsHighCybersecurity hardening; resilient communication network; data protection compliance
C2Efficient, Integrated, and Smart Charging Management Systems HighCoordination with distribution system operators; real-time load balancing; integration with depot operations
Quadrant III
A4Advanced Energy and Thermal Management MediumBattery system monitoring; compatibility checks with vehicle platforms
A1Predictive Maintenance Strategies & Battery State-of-Health EstimationMediumSensor data quality; operator training; integration with existing maintenance cycles
Quadrant I
B3Mobility Hub Charging System MediumLand-use planning; user accessibility design; mitigation of public space impact
Quadrant II
B1Bi-directional Modular Charging Systems for Bus-to-Grid Services LowElectrical safety standards compliance; infrastructure alignment with distribution system operator; visual/aesthetic impact mitigation
B2Hybrid Charging System with Stationary Battery Buffer LowValidation with system operators; data models standardisation; cybersecurity certification
A3Optimised Connected Vehicle Digital Twin and Monitoring System LowWaste management strategy; battery lifecycle planning; fire-safety assessments
B4In-Motion (Hybrid) Charging Systems LowSafety certification; grid impact investigation; coordination with distribution system operator for bidirectional flow
Disclaimer/Publisher’s Note: The statements, opinions and data contained in all publications are solely those of the individual author(s) and contributor(s) and not of MDPI and/or the editor(s). MDPI and/or the editor(s) disclaim responsibility for any injury to people or property resulting from any ideas, methods, instructions or products referred to in the content.

