Abstract
Direct current fast charging is a necessary element of the transition to electric vehicles (EVs). Regulatory complexity, capital requirements, and challenging business models hinder charging infrastructure deployment, so focusing on the efficient use of such infrastructure is of paramount importance. A tool to improve this efficiency is an incentive to terminate charging events when charging power drops, the vehicle state of charge rises above some value, or time plugged in exceeds a threshold. A timeseries charging demand model was built based on observed EV population and charging behavior. This was used to explore these three incentive trigger metrics across a range of plausible values, to find their relative impacts on the vehicles charging, those waiting in line to access a cordset, and charging site operators. Results indicate that basing such a trigger on charging power would have little impact if the threshold power is low enough to accommodate older, slower-charging vehicles, but that more restrictive limits based on state of charge or charging duration can decrease wait times, increase vehicle throughput, and increase total energy sales for cordsets serving more than 1000 EVs per year.
1. Introduction
1.1. Background
A total of 195 nations have agreed to reduce greenhouse gas emissions within the framework of the Paris Agreement [1]. Transportation electrification in general, and the adoption of private passenger electric vehicles (EVs), in particular, are accepted and common mechanisms that contribute to achieving this goal in the transportation sector [2,3]. For this reason, as well as rapid advancements in technology, convenience, and market segment representation, EVs are in a period of rapid growth. This is true of vehicle registrations (a proxy for in-service fraction), estimated at about 1 in 20 (5%) worldwide by the end of 2024 [4], and more dramatically in new vehicles sales, of which EVs represented more than one in every five (22%) globally in 2024 [5].
The adoption of EVs cannot happen in isolation, however. Just as the adoption of gasoline fueled vehicles expanded in concert with the distribution of gasoline [6], to be a complete transportation system, EVs require the existence of charging infrastructure. Direct current fast charging (DCFC) is equipment that can deliver a significant charge to an EV at powers of up to 360 kW or more [7]. This means that vehicles able to accept such charging power could recover much of their usable range in a span of tens of minutes. DCFC infrastructure is considered critical to the widespread adoption of EVs as a comprehensive substitute for gasoline vehicles [8,9]. Research has demonstrated this relationship between infrastructure and EV adoption both by way of stated preference surveys of potential EV buyers [10], and through observation of EV adoption as a function of existing infrastructure in 30 countries [11].
Such infrastructure is a ‘rival good’, meaning that when being used by one EV, it is not available to another EV [12]. This is a dynamic time, as the number of EVs on the roads is increasing rapidly, and the number of DCFC sites to serve that population (and the power offered at each) are likewise growing rapidly [8]. Fundamentally, the ratio between the population of EVs and the amount of charging infrastructure determines the level of service that those EVs receive, with both the duration of charging events (a function of charger power, battery size, and desired range increase) and queuing to access a cordset (a function of that EV vs. DCFC ratio) as quantifiable metrics of the level of service. In the evolution of DCFC buildout and EV adoption, the need for efficient use of the DCFC infrastructure becomes paramount.
The definition of efficient use of limited ‘rival’ charging resources can be related to the way an individual EV charges. As a battery charges and its voltage increases, non-reversible reactions can cause permanent damage such as capacity loss [13,14]. To minimize this risk of excessive voltage, the charging current, and thus charging power, is reduced along some mapped curve in response to voltage and temperature limits [15]. Practically, this means that the longer a vehicle charges, the less power it can absorb, and the less use it can make of the DCFC infrastructure. This can be somewhat mitigated by having multiple power-sharing cordsets [7]; however, such sharing is limited in practice, and in technical resolution.
This gradual reduction in charging power (kW) as time passes on the charger (minutes) and the state of charge (SoC) of the battery increases (%), suggests the efficiency of the use of a DCFC could be improved if vehicles terminate charging events before they otherwise might have, so that other EVs waiting to access the cordset can begin charging. The purpose of this paper is to explore the potential impacts of incentive structures that achieve this. Based on a model for the time-varying demand for charging, sequences of charging events are constructed with and without an ‘unplug incentive’, which we envision as a significant step change in the cost of charging. The unplug incentive is triggered by one of (1) falling charging power, (2) rising battery SoC, or (3) rising charging event duration. Outcomes related to queue wait times, vehicle throughput, and energy sales are produced by the model, and are used to compare the impacts of different unplug incentive triggers.
1.2. Literature Review
With the rapid expansion of private and public EV fleets around the world, and the corresponding need for widespread deployment of charging infrastructure to support their use [16,17], there is a great deal of interest in ensuring infrastructure investment can provide the most charging service to the most EV drivers [18]. EVs being left in place, occupying a parking location when charging has concluded or tapered to very low power is one of the most preventable risks to this system efficiency.
The idea of cost signals influencing the behavior of EV drivers at chargers is widely explored in the literature. A fundamental observational study of the effect of different tariff structures showed that, when contrasted to EV drivers’ behavior at a free charger, a flat rate fee ($ per charging session) encouraged prolonged occupancy of the cordset and charge to higher ending SoC [19]. The consequence of this behavior being reduced energy throughput at the charger, as more time is spent at reduced charging power and high SoC. This is an undesirable outcome for the DCFC operator and those drivers queueing to charge.
Sutton et al. [20] investigate strategies in effect at workplaces to reduce congestion at business-owned chargers, recognizing that doing so improves the level of service provided by a given infrastructure to a given EV population. The strategies they report on include per session, per kWh, and per hour fees, but there is little discussion of the relative output metrics of these approaches. A session time limit with a ‘penalty fee’ is discussed, and drivers report high compliance levels, though due to low typical penalty levels for AC charging (5–19 kW charging), little concern was expressed about occasionally running into the penalty [20].
A large body of charging scheduling research focuses on minimizing negative impacts of high-power charging to the grid operator, or minimizing electric utility costs to DCFC site owners. Variable electricity costs have been explored as a means to better integrate EV charging into peak load-sensitive grids by Limmer [21]. Various parameters relevant to the users and the owner of a DCFC situated ‘behind the meter’ at commercial and industrial sites were investigated by Kucuksari and Erdogan under various infrastructure and tariff models [22]. Their work shows that higher-power chargers lead to lower capacity factor (termed ‘utilization factor’ in [23]) and higher overall costs until the population of EVs and demand for charging drives the utilization factor above ~15%. They further point out that ignoring demand charges (electricity charges associated with peak power draw in the host building) can cause DCFC use to result in dramatic increases in operating costs.
Another widespread approach to minimizing peak electrical loads is a Time Of Use tariff, under which the per-kWh cost of electricity increases during a daily scheduled peak period. Cao et al. [24] investigate site cost optimization in a regulated electric utility, and find they can reduce costs by ~40–50% through active charger management. Further work on providing grid services by modulation charging behavior was performed by [25]. As with the present study, they assume immediate behavioral response to pricing stimulus. The objective function in that work is not related to DCFC site operator outcomes or quality-of-service, but to the stability of grid voltage within a distribution network.
Where grid capacity is low (or by extension, where demand charges are high), research by Singh et al. examines the potential of pairing DCFC hubs with distributed renewable generation and storage, which can be cost-effective additions in certain scenarios [26]. Finally, an early study by Ban et al. [27] considers wait times and station throughput as outputs, and define charging rate tariffs to stimulate the behavior of charging plug-in hybrid electric vehicles, but prioritize grid stability and utility services as primary objectives, and imagine drivers as apparently willing to join queues 10-cars-deep, which may reflect the sparse infrastructure of the time.
A study by Roni et al. of carshare fleet vehicles more reflective of the modern infrastructural context finds that time-charging, rather than waiting to charge, dominates the total ‘downtime’ of shared vehicles when they cannot provide transportation services [28]. They investigate the impact of increasing the supply of DCFCs (or the ratio of DCFC infrastructure to EV population) as a tool to reduce EV downtime, but do not examine incentive structures for the efficient use of the infrastructure. A similar remedy to extensive queuing is taken by Wolbertus et al., who assume that charging choices relate to the vehicle charging alone, ignoring other factors (such as other users) at the site, such that the role of the site operator only relates to decisions about further infrastructure investment [12].
In a related study, Ucer et al. [29] examine average charging event wait time as a function of total infrastructure investment, looking at charging sites with different cordset counts and DCFC power ratings. Another such study by Liu et al., focusing on New York City, evaluates the impact on various quality-of-service metrics of additional DCFC infrastructure investment, and finds that further investment at locations with a high utilization ratio (termed ‘occupancy’ in [23]) is likely to have more impact than one focusing on time spent waiting to access a charger [30]. Neither of these studies consider the prospect of impacting owner behavior or infrastructure utilization efficiency through incentives.
A study of a dynamic demand-responsive pricing scheme in southern California finds that wait times can be reduced by 26%, while increasing user cost (and operator revenue) by 5.8% [31]. This study is more similar in its analysis to our research, but employs an absolute and unerring knowledge of the length of the queue at each cordset. This assumption may not be unreasonable, as user behavior and/or technological solutions to provide this information are conceivable, but are not established technology.
A similar real-time knowledge of EVs queuing to charge is assumed by Tan et al. [32]. They minimize time spent waiting for access to a cordset by way of a Fairness Index evaluating the needs of, and burdens upon, those in the queue. They find that this may also improve cost efficiency of an EV charging station, where such costs include a fee for having vehicles wait to access a cordset. They employ a combination of information streams that may not be reliable in the real world, including online scheduling, charging queue priority assignment, and cooperative scheduling.
The practical implementation of the kind of incentive structure envisioned in this paper already exists in the market. Tesla Motors Inc. is a major EV manufacturer and DCFC infrastructure operator [33]. They have had an ‘Idle Fee’ in use at their DCFC network since 2016 [34], implemented to encourage Tesla drivers to vacate the parking spaces intended for charging vehicles. This ‘Idle Fee’ is only applied after the charging session terminates, but the intent of ensuring vehicle turnover or cordset throughput is consistent with this theme. Electrify America is another major charging infrastructure operator in North America, and has gone a step further; at some congested sites, Electrify America applies a maximum allowable SoC of 85% to reduce charging hub congestion [35,36]. Their implementation simply terminates the charging session (rather than, for instance, charging a higher rate) and starts a 10 min countdown (grace period) before their own ‘Idle Fee’ is applied. In the context of modern, high-power charging infrastructure, an additional 10 min wait is significant.
1.3. Structure of Paper and Novelty
In Section 2 of this paper, the construction of the charging demand model is presented, including subsections describing (Section 2.1) the specific questions being investigated and the scope of the investigation, (Section 2.2) the model construction and the modeling variables, and (Section 2.3) the timestep operation of the model. In Section 3, a description of the source data and model inputs is given, including (Section 3.1) the probability of an EV arriving at a site seeking charging, (Section 3.2) how the distribution of EV types with different batteries is represented, (Section 3.3) the respective charging curves (power vs. energy level) of different EV battery types, (Section 3.4) the distribution of starting and intended ending states of charge, (Section 3.5) the chances that an arriving EV will abandon its charge attempt due to a queue, and (Section 3.6) a brief model validation and exposition of the variables being tracked. The results are presented in Section 4, including subsections concerning (Section 4.1) the frequency and nature of early terminations, (Section 4.2) the occupancy of the cordset and whether arriving EVs abandon their charging attempts, (Section 4.3) the number of EVs served and the amount of energy sold, (Section 4.4) impacts on average time spent waiting to charge, and (Section 4.5) a compound metric combining the most unambiguously beneficial and undesirable metrics. Section 5 contains a discussion of key results and the limitations of the model, including (Section 5.1) comparisons and contrasts between the impacts of the three different trigger metrics, (Section 5.2) non-technical considerations that might impact the choice of metric, (Section 5.3) the possible importance of smart solutions, and (Section 5.4) considerations on the generalizability of this work. Finally, Section 6 contains a recapitulation of the research and possible policy implications of the findings.
In contrasting the literature review and the examples of existing throughput mechanisms by Tesla and Electrify America to the structure of this paper, the novel contributions are apparent. The principal contribution is an investigation of triggering the unplug incentive (or effectively ‘session termination’) on three different metrics: charging power (kW), SoC (%), and session duration (minutes). Furthermore, each of these trigger metrics is evaluated over a parameter space judged to be the likely extent possible given the state of DCFC and EV charging technology. Finally, these results are made highly generalizable by applying them over a wide range of site popularities, which represents any feasible ratios of demand for charging vs. cordset count. By exploring outcomes of relevance to EV drivers and site operators, this work, hopefully, can serve a wide audience.
2. Modeling and Methods
Though it is untraditional to present methods before data, the structure of this research is such that referring to the model operations (this section) during the discussion of the source data (Section 3) aids clarity.
2.1. Unplug Incentives
The intent of this research is to identify the various effects of unplug incentives for drivers of an EV that is charging, for those waiting in a queue to charge, and for site operators. An unplug incentive, in this context, is a change in the cost of charging, whether assessed by time ($/min), by energy ($/kWh), or using another approach. The unplug incentive is triggered by specific conditions being met and applied to the charging session. In this paper, three unplug incentive triggers are explored, but only apply during ‘peak hours’ of charging demand (Section 3.1). Along with the various unplug incentive structures, a ‘null hypothesis’ of no unplug incentive is evaluated. The three unplug incentive metrics are as follows:
Charging power. As mentioned in the Introduction, charging power (kW) reduces as batteries reach high SoCs. Under a power-triggered unplug incentive, users would face higher costs once the charging rate falls below a specified power (kW). Power limits are attractive from a systems operation point of view because they refer directly to the utilization of the charging infrastructure, where utilization is defined as the ratio of the amount of energy delivered (kWh) to the amount that could be delivered (kWh) in a window of time [23]; i.e., any vehicle charging at low power is by definition only using a fraction of the capability of the DCFC. To ensure access equity, the range of power triggers is informed by the maximum charging power of the lowest-power charging EVs, which is about 50 kW; an unplug incentive trigger value higher than 50 kW would, therefore, always apply to such vehicles. Charging power triggers were investigated between 5 and 70 kW, at 5 kW increments, while the null hypothesis is in effect a trigger at 0 kW. A preferred range (based on the range of vehicles on the road and engineering judgement) was defined between 25 and 45 kW.
Battery SoC. Regardless of the charging power, the purpose of charging an EV is to extend the driving range. In any but the most extreme combination of low EV range and sparse charging infrastructure, a full charge is not necessary to continue driving, and in such an extreme case (needing near 100% SoC to just make it to the destination), it is likely that the driver would be willing to pay extra for that to avoid an intermediate stop. As the battery fills (reaches high SoC), the incremental value of time spent occupying the charger diminishes, while the value of that time to a waiting EV does not. Under an SoC-triggered unplug incentive, users would pay higher rates once their vehicle reaches a specified State of Charge (SoC%). SoC triggers were investigated between 50 and 90%, at 5% SoC increments, in addition to 94 and 97% to better fill the parametric space, while the null hypothesis is in effect a trigger at 100% SoC. A preferred range (based on the observed distribution of ending SoCs of real charging events, Section 3.4) was defined between 70 and 85%.
Charging session duration. Different EVs have different size batteries (kWh), and different charging speeds (kW) across the range of SoCs. These two parameters tend to be correlated, such that vehicles with big batteries can charge at higher power than vehicles with small batteries. A charging duration-triggered unplug incentive would apply after an EV has been charging for a specified duration (minutes), meaning that larger-battery EVs will generally be able to onboard more energy than smaller-battery EVs. Charging session duration triggers were investigated between 2 and 53 min, at 3 min increments, while the included null hypothesis is in effect a trigger at ∞ minutes. A preferred range (based on personal experience and engineering judgement) was defined between 10 and 20 min. This range would provide 29–58 kWh at 175 kW, but only the fastest charging EVs with very low starting SoCs would be able to charge that fast.
In all cases, the model assumes that EVs will cease charging as soon as the unplug incentive is applied, unless the SoC is <20% (a combination of conditions that should rarely occur). While this is clearly not what would happen in the real world, where some fraction of EV owners will be cost-insensitive due to wealth, range anxiety, or will simply be inattentive to the rate change, it serves two purposes: First, it identifies an upper bound of the possible impact of the unplug incentive, which is good for determining total potential impacts. Second, as long as the unplug incentive rates are equivalent in the three cases, it gives a clear indication of relative impacts and trends when comparing the three trigger metrics.
2.2. Model and Variable Description
To evaluate the impact of EVs being incentivized to disconnect from the cordset and thereby free it for use by another user, a timeseries model of DCFC use was created in Matlab. The longitudinal scope of the model is a four (4)-year simulation of a single cordset, and the model operates on a 1 min timestep. This 4 year run of the model is repeated for each scenario, where a scenario is defined by the relative site popularity and the unplug incentive trigger. As the model runs through the years, a variety of parameters are tracked. Some of these are timeseries vectors with a length corresponding to ~200,000 min in the four years. These are indicated throughout this document with a ‘t’ subscript. Others are vehicle-based vectors, with a length corresponding to the number of vehicles that arrive at the site in each scenario. These are indicated with a ‘n’ subscript:
- Arrivalt of vehicles, an incrementing integer is assigned to the appropriate location within a timeseries vector. The integer value is the number of vehicles that have arrived up to that point in time, while the location within the timeseries corresponds to the time of arrival.
- Abandon charging; If a vehicle arrives and the cordset is occupied, there is a chance (described in Section 3.5) that it will abandon this attempt and move on to some other charger or destination (termed ‘balking’ in [29,37]). This is an incrementing integer.
- Starting SoCn, Ending SoCn, and Battery Typen are three vectors each having a length corresponding to the arrival number, such that they grow throughout the modeled year. Each arriving vehicle is probabilistically assigned a battery type and a starting and ending SoC, based on observed distributions of those parameters.
- Duration is an integer variable tracking the number of minutes from the start of each charging session. It resets with each new session.
- Queue is tracked in a vector of varying length. The arrival number of each new vehicle is appended to the end of the vector, while that of a vehicle concluding its charging session and departing is deleted from the front. All vehicles at the site are listed in the Queue, including the one charging. (While including the charging vehicle in the Queue may not align intuitively with the meaning of the word, it simplifies coding).
- Queue Lengtht is a timeseries vector tracking how many vehicles are at this site, including the one charging.
- Session Count is an integer that increases when a vehicle in the Queue connects to the cordset and starts charging.
- Occupiedt is a timeseries logic-valued vector, simply indicating whether a vehicle is at the cordset at each point in time.
- SoCt and Powert are timeseries vectors that reflect the interaction between the cordset and the sequence of charging vehicles. They both have a default value of zero (0). When a vehicle is charging, SoCt is the state of charge of the charging vehicle, and Powert is the charging power in kW, which is the lesser of the cordset power limit (175 kW) or the value corresponding to the SoC and the charging curve of that battery type.
- Forced Off is an incrementing 1 × 2 vector that tracks the number of instances of the unplug incentive being invoked. When it is invoked and there is another vehicle waiting in the Queue, the first value, termed ‘beneficial’, is increased. If there are no vehicles waiting in the Queue, the second value, termed ‘needless’, is increased.
2.3. Timeseries Model
The model operates on a 1 min timestep for the duration of four years. In each timestep, conditions are evaluated for four (4) possible actions, described in this section. Note that variable names described in Section 2.2 are indicated in bold/italicized text:
- The Arrival of an EV seeking charging:
- This is evaluated probabilistically based on the hour of the day and the day type (weekday or weekend day). These probabilities, observed from source data (see Section 3.1), are multiplied by a range of factors between 0 and 16 to produce representations of different site popularities between 0 and ~23,000 EVs seeking charging per year. Site popularity for each multiplication factor is defined as the number of vehicles found to arrive at the site per year at the end of the model run (i.e., the site popularity is observational, not prescriptive).
- When a vehicle arrives, its Battery Typen, Starting SoCn, and intended Ending SoCn are assigned probabilistically, based on observed data and expectations of future market evolution (see Section 3.3 and Section 3.4).
- Based on the Starting SoCn and the length of the Queue, the arriving EV ‘decides’ to either join the Queue, or if the Queue is too long, to Abandon the attempt (see Section 3.5). Any vehicle arriving with less than 20% Starting SoCn will not Abandon.
- Any vehicle that does not Abandon joins the Queue (even if it is the only vehicle present).
- A vehicle from the Queue starts charging:
- If there is one or more vehicles in the Queue, and the cordset has not been Occupiedt for 3 or more minutes (a number chosen based on observations of lag between charging events, described in greater detail in [23]), then the first vehicle in the Queue starts charging.
- Increment Session Count by one.
- Charging is taking place:
- If the cordset is Occupiedt by a vehicle, charging is occurring.
- The Powert of charge is the lesser of that allowable by the charger (set to 175 kW in this model), and the power allowable by the battery, which is a function of the Battery Typen and the SoCt (see Section 3.2).
- Update the battery’s SoCt for this timestep based on the value of SoCt in the previous timestep, the Battery Typen capacity, and the charging Powert in this timestep.
- A vehicle terminates its charging session and leaves:
- Compare SoCt vs. this vehicle’s intended Ending SoCn or
- Determine if this timestep is one of the ‘peak hours’ (see Section 3.1), and one of either Powert vs. trigger power limit, SoCt vs. trigger SoC limit, or the Duration of this session vs. trigger duration limit. A vehicle with a SoCt of less than 20% in this timestep will not terminate early.
- If any of these apply, remove this vehicle’s Arrival number from position 1 of the Queue, and increment the count of either ‘needless’ or ‘beneficial’ Forced Off events, depending on whether there is another vehicle waiting in the Queue or not.
3. Data Sources and Observed EV Characteristics and Behavior
Source data used to build the charging demand model and EV driver behavior models came from Nova Scotia’s provincial utility, Nova Scotia Power Inc. (NSPI), which operates a network of twelve 50 kW chargers around the province of Nova Scotia, on the east coast of Canada. The training dataset consists of individual charging event records, where each event is described by parameters such as start/end time (hh:mm:ss), start/end SoC (%), and energy delivered (kWh). This dataset is described in greater detail in previous work [23,38]. Compared to [38], this project includes an additional year of data, with a last charging record on 1 April 2025. The scope of the training data was defined as the most recent three (3) years and includes ~52,300 charging events across the 12 sites.
3.1. Probability of an EV Arriving
The first question answered by the NSPI data was how to construct a sequence of EVs arriving at a charging site. The method needs to be adjustable to represent various degrees of site popularity. Site popularity in this context means the number of EVs that arrive at a site seeking charging in a year. To answer this question, observed charging event start times were differentiated by starting hour, and whether they were on weekdays or weekend days. The average number of sessions per site starting each hour in the NSPI training data is shown in Figure 1. Note that this curve has been adjusted to compensate for charging events missing due to the equipment being inoperable and for event starts that were delayed due to a queue. These adjustments are described in greater detail in [38], though the change was minimal.
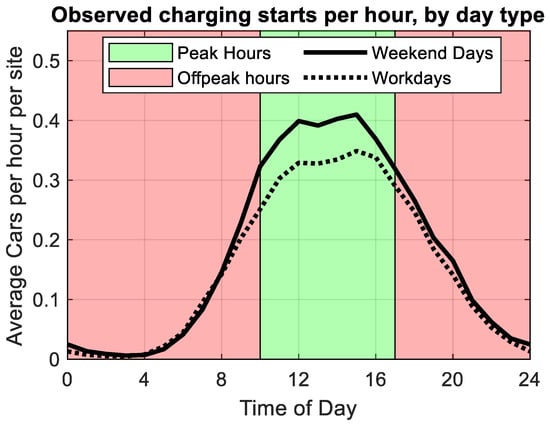
Figure 1.
Observational frequency of charging events starting per hour from NSPI network of 12 chargers in Nova Scotia. Weekdays and weekend days are differentiated to reflect different weekend travel patterns.
Figure 1 shows that the frequency of charging event starts falls away to almost zero overnight between 24 h and 5 h, and rises to a broad afternoon peak spanning 12 h to 15 h. Though we use a slightly different metric, the curve shown in Figure 1 is consistent with previously modeled and observed cordset occupancy over time [28,39,40], though exhibiting more than ten times (10×) the per-cordset per-hour event start probability found in a 2019–2020 study in Germany [41], or in Seattle, USA in 2014 [28]. It should be mentioned that the values shown in Figure 1 (e.g., 0.4 charging event starts per hour per site) are not a measure of absolute demand for charging, but a measure of the ratio of the demand for charging with the supply of chargers; If a second, identical charger were installed next to this one, the frequency of its use would (presumably) be halved.
In addition to the specific hourly curve (black lines), the hours between 10 h and 17 h are identified as ‘peak hours’, when the demand for charging is at its highest (greater than ~80% of the maximum). These peak demand hours define times when the unplug incentives may be applied in the model, i.e., during the overnight ‘non-peak’ hours of 17 h–10 h, vehicles charge to whatever Ending SoCn they were assigned at arrival (see Section 3.4). (Exploration of the definition of ‘peak hours’ not shown in this paper indicates that the more specific and tailored the tariff can be, the better).
Figure 1 also shows that there is a ~20% variation in demand for fast charging between weekdays (dashed line) and weekend days (solid line). Demand for travel has been observed to increase significantly on weekend days (or non-workdays) [39], as the difference between workday commuting and weekend travel materially impact vehicle use. Note that this ratio refers to a network of DCFCs designed to enable highway travel, and the inverse pattern (higher weekday utilization) was observed in parking garages at CalTech (university) and JPL (industrial) campuses [42].
During the peak hours of a weekend, Figure 1 indicates that ~0.4 EVs arrive per hour at each of the 12 NSPI source data sites. The scope of this investigation multiplies this frequency by a range of 0 to 16, so in the maximum site popularity investigated, an average of ~6.5 EVs will arrive at each cordset each hour during weekend peak hours (one every ~9 minutes).
Note that there is an additional timescale of variation, other than the hourly and weekly variations indicated in Figure 1. In the source data, there is a significant seasonal variability in charging demand, which is discussed in [38], such that a peak season between 10 July and 20 August shows roughly twice the hourly event starts of an off-peak season between 1 December and 20 May. This seasonality was not included in this modeling to improve its generalizability.
3.2. Representative Charging Curves
The diversity of EVs on the road in Nova Scotia was assessed through Nova Scotia EV registration data, available on the provincial government’s data portal [43]. Battery charging curves of 69 distinct models of EVs represented in Nova Scotia were collected from online sources and cataloged [44,45,46]. A charging curve is a map of how much power (kW) a battery can absorb as a function of its energy level (kWh). The 69 observed charging curves were grouped into nine (9) characteristic curves by their energy capacity (kWh) and peak charging power (kW). Note that while energy capacity (peak kWh) and charging power (peak kW) tend to be correlated, there can be significant variation in charging speed even among batteries of the same capacity, related to chemistry [47], battery management, and thermal management [48].
The nine representative charging curves are shown in Figure 2 as thick lines. The 69 charging curves reflecting the diversity of observed EVs are shown as dotted lines with colors coded to the representative lines that they inform. The representative batteries are described in the legend by their peak capacity (kWh) and whether they have a ‘high peak’ charging rate, meaning a peak charging rate as high or higher than the next larger size battery.
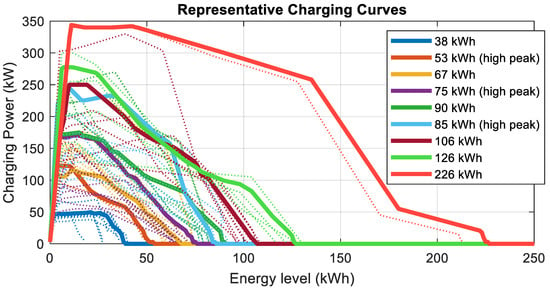
Figure 2.
Nine (9) representative charging curves of batteries sizes with nominal energy capacities and either displaying a high charge rate peak or not. Dotted lines are disaggregated curves of all observed EVs.
Figure 2 shows a wide range of observed vehicle battery capacities (x-axis values where the charging curves reach zero (0) kW). Also evident is the correlation between higher energy capacity and higher charging power capability. The exceptions to this correlation are also emphasized in the frequency of charging curves crossing each other.
3.3. Battery Type
When an EV arrives at the charger, it is assigned a Starting and Ending SoCn, and a Battery Typen. Table 1 shows the relative frequencies of each of the battery types observed in the source data. To reflect trends in the EV market towards larger vehicles with more range, a ‘Group Growth’ adjustment was applied to the observed populations, shown in the fourth column of Table 1. The number of small-battery EVs was reduced and the number of large-battery EVs was increased to reflect this trend. The final distribution used in the model to assign a Battery Typen to each Arriving EV is shown in the last column of Table 1.

Table 1.
Nine representative battery types, with their relative probability of arriving to charge.
3.4. Charging Needs of Each Individual Vehicle
The charging needs of each Arriving vehicle are, operationally speaking, a function of its Starting and Ending SoCn and its Battery Typen. When the difference between Starting and Ending SoCn (each represented by a unitless fraction) is multiplied by the capacity of the battery (kWh), it yields the quantity of energy that the Arriving vehicle desires. The source data include starting and ending SoCs for most charging events, along with kWh delivered, yielding battery capacity. These states are mapped below in Figure 3, where the x-axis location denotes the starting SoC, the y-axis location denotes the ending SoC, and the pixel color denotes the relative frequency of that starting/ending SoC pair. Single-attribute distributions are included as ancillary graphs on the x-axis (starting SoC) and y-axis (ending SoC). No absolute values are given to the frequency scales depicted in Figure 3, as it is only the relative frequencies that are of interest.
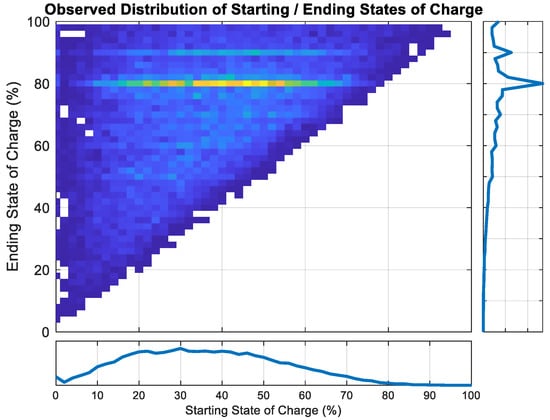
Figure 3.
Observed distribution of starting and ending states of charge at DC fast chargers.
Note that in developing the data for Figure 3, two quality control measures were implemented:
- (i).
- Data suspected of reflecting a Plug-in Hybrid Electric Vehicle were excluded. These were identified by a small battery (less than 45 kWh), and in isolation, had a high prevalence of starting SoC values very near 0%. Such vehicles have generators/range extenders, and are able to completely deplete their batteries with no negative operational impacts. It was surmised that while such small-battery vehicles might charge at relatively low cost, low-power 50 kW units used as source data would be unlikely to charge at the higher-power, higher-cost 175 kW units being modeled, due to the inability of most hybrid models to make use of such high powers.
- (ii).
- Charging events of vehicles with a computed battery capacity > 95 kWh were excluded. Such vehicles, charging on NSPI’s 50 kW chargers, would be most likely to charge the minimum amount possible to reach another destination, i.e., a 50 kW charger would take 1 h or more to significantly charge a 100+ kWh battery. It was deemed that user behavior of such vehicles at a 50 kW charger would be materially different from their behavior at the 175 kW chargers modeled in this study. Such vehicles, in isolation, showed a tendency to have an ending SoC relatively close to their starting SoC, indicating frustration with relatively slow charging.
Figure 3 shows a number of interesting trends. One is that very few EVs arrive with less than ~5% starting SoC. This is intuitive, as doing so exacerbates the risk of vehicle shutdown in a remote location (especially because of the highway-focused locations of the NSPI charging network). It is also worth observing that relatively few charging sessions added less than 10% SoC (as can be seen from the dark blue (low frequency) values forming a buffer around the x = y diagonal). Those that do may have simply been plugged in incidentally during a roadside stop for other purposes, or just for testing the functionality of the DCFC during maintenance or driver exploration. That behavior is evidenced by the presence of charging events starting at >80% SoC, which are extremely unlikely to represent a stop where charging is the primary purpose. Such charging events may correspond to ‘opportunity charging’, identified by [49].
The most interesting feature of Figure 3 are the heavy ‘ridges’ at the 80% and 90% ending SoC (y-axis value) marks. These ridges, and the spikes in the corresponding ancillary ending SoC frequency plot, indicate that users are preferentially ending their charging sessions on round percentage numbers. This may be attributed to two factors. One possibility is that they have default maximum SoC controls set to those values to reduce degradation of the battery and did not override them for their enroute charging. The second is that those waiting to continue their trip intentionally select a round number as their target SoC and preferentially charge to that point. Whatever the reason, it seems reasonable that it should apply to the modeled charging scenarios.
We have found little similar data in the literature. A study in Shanghai, China, found that EV drivers tend to recharge when they have 75–100 km of remaining range [40]. In Figure 3, there is no narrowly identifiable ‘typical’ starting SoC, though 15–50% make up the bulk of the distribution. We note that there is no direct translation from SoC to driving range, due to different battery sizes and vehicle efficiencies.
3.5. Abandoning This Charger for Another Due to Queue
One of the behavioral variables in the charging demand model relates to the actions of the driver of an EV seeking charging when arriving at a charging site to find that a queue exists. Sometimes the EV will have sufficient remaining battery range to get to another charging site, so joining the queue and committing to waiting an unknown amount of time is not always necessary. The decision to abandon ‘this’ charger and drive to an alternative location (termed ‘balking’ in [31,37]), is presumably a function of the number of cars in the queue. The probability of an Arriving EV abandoning as a function of queue length, which is based on our personal experience and engineering judgment, is shown in Figure 4.
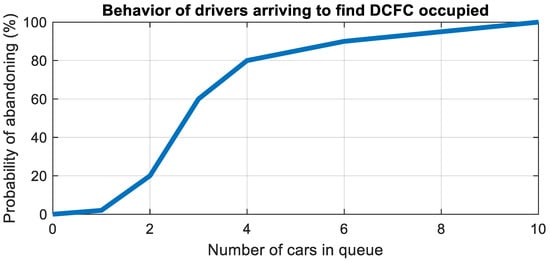
Figure 4.
Proscriptive model of the behavior of EVs drivers seeking charging, when there is a queue at the charging site.
The curve shown in Figure 4 is used to probabilistically determine whether an arriving EV seeking charging will stay and join the queue, or abandon this charger for some other destination. If the Starting SoCn is below 20% (regardless of battery size/type or queue length), the session will not be abandoned.
In reality, the curve of abandon probability is sensitive to both charger power (and thus expected average charging session Duration, so the cost in time of staying and waiting), the range autonomy of the EV in question (and thus its ability to get to an alternative destination) and to the geographic density of alternative charging locations (and thus the cost in time, route diversion, or range anxiety of proceeding to some alternative charging location). None of those factors are included in the model. Note that this curve, which impacts all of the outputs of the model, is not informed by extensive literature, relying instead on the personal experience and engineering judgement of the authors. We also note that results are sensitive to this curve; the more ‘aggressive’ the abandonment curve (the higher the probability of abandonment assigned to a given queue length), the more impactful any unplug incentive will be in all metrics.
3.6. Model Validation
A 90 min sample timeseries between 12:30 and 14:00 of 3 May of several model variables is plotted below in Figure 5. The top plot shows the Powert output of the cordset, the middle plot shows the SoCt of six (6) sequential vehicles, and the bottom plot shows Queue Lengtht, (which includes the vehicle charging). In the model scenario plotted, the unplug incentive triggers at a SoCt exceeding 65%, which is indicated by a dashed black line in the SoCt (middle) plot. Also shown are green vertical lines indicating the arrival of EVs seeking charging, of which there are seven (7) within the span shown, and red vertical lines indicate the departure of EVs after charging is terminated, of which there are five (5).
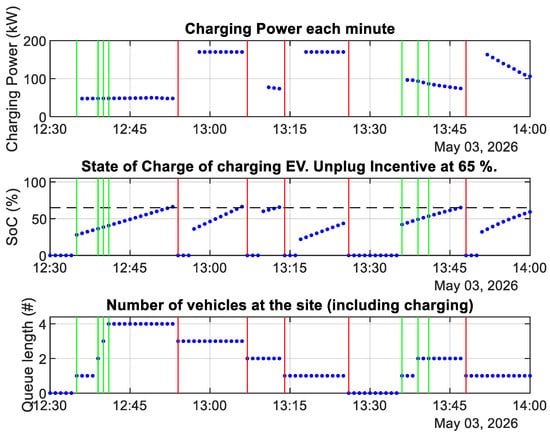
Figure 5.
Model validation plot of charging power (top), battery SoC (middle) and Queue Length (bottom). Vehicle arrivals are indicated by green lines. Vehicle departures are indicated by red lines. The unplug incentive in this scenario is triggered by a 65% SoC.
At the start of the timeseries in Figure 5, there are no vehicles at the site, so Powert (top plot), SoCt (middle plot), and Queue Lengtht (bottom plot) all have a value of zero (0). When the first vehicle arrives (leftmost vertical green line), the Queue Lengtht (bottom plot) jumps to one (1) and the vehicle charging session starts by recognizing its Starting SoCn of 28%. It starts charging at 47.5 kW (top plot), indicating that it is a small-battery vehicle. Note that Powert must correspond to a difference between two values of SoCt, so a Powert value does not appear until one minute after arrival, and represents the average power of the preceding minute.
A few minutes later, three more EVs arrive in quick succession. They all join the Queue, increasing the Queue Lengtht (bottom plot) to four, but their arrival has no impact on the ongoing charging event.
At 12:53, the charging vehicle exceeds 65% SoCt, and so terminates its session (leftmost red line, middle plot), and the Queue Lengtht (bottom plot) decrements to three (3). It takes three minutes for one vehicle to vacate the cordset and parking space and another to connect and start charging, so between 12:53 and 12:56, the SoCt and Powert return to zero. After this changeover, the second session begins at 36% SoCt and 170 kW charging Powert, indicating a larger-battery vehicle. At 13:06, this second vehicle exceeds 65% SoC, and so terminates its session. The third charging session is similar, though brief due to the third vehicle starting at 60% SoCt and only charging for four minutes. The fourth charging session, spanning 13:17 to 13:25, is the first in Figure 5 not to face the unplug incentive, as its Ending SoCn is only 44%, well below the 65% SoC trigger threshold. With that, the first four vehicles have all been served, and the Queue Lengtht (bottom plot) returns to zero once again.
Between 13:36 and 13:41 three more vehicles arrive (rightmost cluster of green lines). The third to arrive, ‘seeing’ that there are already two vehicles in the Queue, abandons its session so the Queue Lengtht only increments for the first two of those three. This action has a 15% chance of occurring (Section 3.5).
4. Results
The model tracks a number of variables of interest to those using the charger, those in the queue, the operator of the charging network, and the electric utility supplying energy to the network. Key results are presented in this section in sequence. In each figure in this section, three plots investigate unplug incentives triggered by, as follows:
- Charging Power (left plots), under which a user would disconnect once the charging rate falls below a specified power (kW). Increasing the power limit (moving up in the plot) reflects a more restrictive tariff, while the null hypothesis is reflected at y = 0 kW.
- Battery SoC (middle plots), under which a user would disconnect once their vehicle reaches a specified SoC (%). A lower maximum SoC threshold value (moving down in the plot) produces a more restrictive tariff, while the null hypothesis is reflected at y = 100% SoC.
- Charging session Duration (right plots), under which a user would disconnect after charging for a specified charging Duration (minutes). A lower threshold value (moving down in the plot) produces a more restrictive tariff, while the null hypothesis is reflected at y = ∞ minutes. For plotting purposes, the y-axis value of the null hypothesis is 70 min.
All three of these plots show the investigated range of EVs seeking charging, i.e., site popularity, on the x-axis, and the range of values of the trigger metric on the y-axis, with labeled isometric contour lines indicating the output value being investigated across that parametric space. Note that these isometric contours may be linearly or non-linearly distributed, as is appropriate to best show the surface. In each case, the preferred range of the trigger (discussed in Section 2.1) is shown as a green band. Recall that we assume a 100%, immediate compliance with this incentive structure unless SoCt < 20% (i.e., everyone unplugs immediately upon crossing the trigger threshold), so all results indicate the upper bound of deviation from the null hypothesis, with real-world human behavior presumably reflecting less than 100% compliance.
4.1. Sessions Terminations Due to Disconnect Incentive
The most direct impact of incenting EVs to disconnect in certain conditions (and 100% response rate) is that some quantity of charging events terminate before reaching the desired ending SoC. The ‘natural’ point of termination is determined based on observed start and end states of charge as described in Section 3.4. Figure 6 shows the number of sessions terminated early to avoid paying the unplug incentive tariff, for each trigger and threshold.
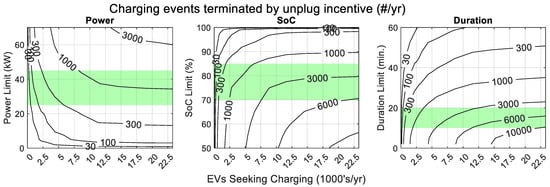
Figure 6.
Number of charging sessions terminated before reaching the user’s target ending SoC, due to an unplug incentive rate that is triggered by charging Power (left), SoC (middle), or session Duration (right).
Figure 6 shows that early terminations are, as we would expect, more frequent, as the limits become more restrictive (higher-power limit, left plot, lower SoC limit, middle plot, or lower session duration, right plot), and more frequent as the number of EVs seeking charging increases (moving to the right across each plot). Also illustrated in Figure 6 is the fact that low-frequency events in a stochastic model such as this are subject to some ‘noise’, characterized by the zigzag of the 30 and 100 early termination lines. Separate runs of the model produce different, though characteristically similar noise. Where the output metrics reach large values, this ‘noise’ is no longer identifiable.
The fewest early terminations for a given site popularity, within the preferred range of trigger values (green bands), are due to Powert limits. This may be partly due to the relatively small fraction of EVs that are impacted by a 45 kW limit (see Figure 2), which was set to accommodate older, slower-charging EVs. Considerably more occur for the preferred SoCt limits, and more again occur due to preferred Durationn limits. Few EVs in the modeled fleet would be able to charge at the full 175 kW for 20 min, so these durations represent less charging than they might without that context. More broadly, the most restrictive Powert limitation (45 kW threshold) produces a result similar to the least restrictive SoCt limit (85%), or a Durationn limit of ~30 min, considerably outside the preferred Durationn range.
Of course, not all early terminations are equal in their impact on stakeholders. If there are multiple EVs in the Queue, then an early termination is a desirable outcome for those waiting to charge, and could improve site utilization and/or average user convenience. In contrast, if no-one is waiting, an early termination can be considered a ‘false positive’ and is an undesirable outcome for all parties. Figure 7 shows the number of charging events beneficially terminated when a waiting EV was present. This is a desirable outcome, so for any x-axis value (site popularity), a higher number is preferable. To emphasize this, a blue line has been drawn through the highest trigger value for each site popularity, with blue squares showing the underlying parametric grid points. In each case, the preferred range of the trigger (discussed in Section 2.1) is shown as a band of green.
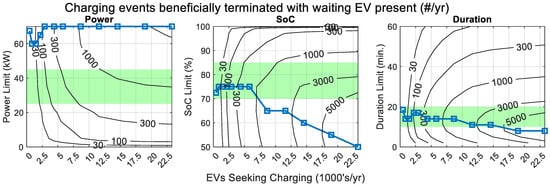
Figure 7.
The number of charging sessions beneficially terminated when another car was waiting, triggered by charging Power (left), SoC (middle), or session Duration (right).
Figure 7 shows some interesting effects. First, when a charging Powert limit is used as the metric for the unplug incentive (left plot), the optimum threshold level exceeds the preferred range, though the impact of threshold on beneficial early terminations is modest for sites below 4000 EVs seeking charging per year. In contrast, if SoCt is used as the trigger (middle plot), an optimum value of 70–75% for low-popularity sites produces the greatest number of beneficial terminations, but this number falls progressively for higher-popularity sites. Similarly, if Durationn is the trigger (right plot), an optimum can be seen at ~17 min Durationn limit, falling below ~10 min for sites seeing 15,000 EVs seeking charging per year.
The counterpoint to desirable early terminations is needless early terminations, when there were no EVs waiting to begin charging. The number of such undesirable ‘false positive’ events are shown in Figure 8, (and again show significant ‘noise’ associated with the stochastic model).
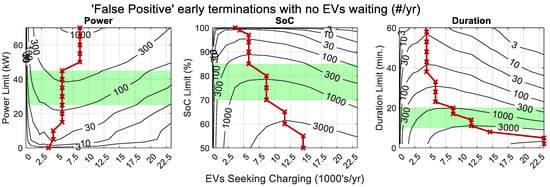
Figure 8.
The number of charging sessions needlessly terminated with no queue present, triggered by charging Power (left), SoC (middle), or session Duration (right).
In all cases, Figure 8 shows the number of false positive early terminations increases as the metric becomes more restrictive (higher minimum Powert, left, lower maximum SoCt, middle, or lower session Durationn, right). Interestingly, it also shows that for most unplug incentive triggers, there is a number of vehicles seeking charging (x-axis value) that maximizes the number of false positives. A dark red line has been drawn between the worst site popularities for each trigger threshold. This number is ~6000 EVs seeking charging per year within the preferred range of Powert triggers, 6000–7000 in the preferred range of SoCt triggers, and 8000–11,000 in the preferred range of Durationn triggers. Below those site popularities, the lower overall number of charging events reduces the number of false positives, while above it, it becomes more likely that when an early termination occurs there is another vehicle waiting to charge, removing it from the ‘false positive’ category. As before, the preferred range of the trigger (discussed in Section 2.1) is shown as a band of green.
The ratio of the number of beneficial early terminations (from Figure 7) to needless early terminations (from Figure 8) is of interest to the net benefit conferred by an unplug incentive tariff. This ratio is mapped in Figure 9, where a higher ‘beneficial / needless’ ratio indicates a better outcome. The value of one (equal numbers of beneficial and needless terminations) is highlighted in black. Note that the null hypothesis values in all cases are zero (0) early terminations (all vehicles reach their target ending SOC), so this quotient is undefined, and the plots cannot cover the full parametric space. The preferred range of the trigger (discussed in Section 2.1) is shown as a band of green.
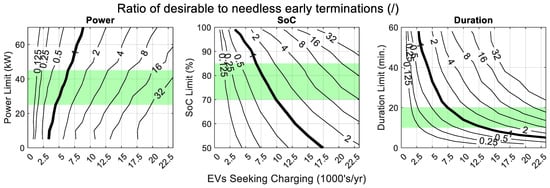
Figure 9.
The ratio of beneficial to needless early session terminations, triggered by charging Power (left), SoC (middle), or session Duration (right).
Figure 9 shows that the ratio of beneficial to needless early session terminations can be improved in all cases by setting less restrictive triggers (lower minimum charging Powert, higher maximum SoCt, or longer maximum session Durationn). Another important observation is that, in all cases, for sites with modest popularity, the ratio is <1, meaning there will be more ‘false positive’ early terminations than desirable ones, a situation likely to aggravate users. The threshold of this ratio is ~5000–7000/yr in the preferred range for the Powert trigger (left plot), 6000–10,000/yr in the preferred range of the SoCt triggers (middle plot), and 7000–12,500/yr in the preferred range for the Durationn trigger (right plot).
4.2. Occupancy and Abandonment
Any early termination (Figure 6) must have an impact on site occupancy, which is defined here as the fraction of time during the simulated year that the cordset was occupied and an EV was charging. Note that from a site operator perspective, occupancy increase is most likely a benefit, unless a slower-charging EV is occupying the site and causing a faster-charging EV to Abandon. In contrast, from the perspective of any vehicle driver, high occupancy is a negative, as it increases the chances of having to wait to charge. Occupancy is investigated as a function of the three possible unplug incentive trigger metrics in Figure 10. (Note that these values do not include any of the modeled 3 min changeover period between one charging vehicle and the next, so could be interpreted as a slight under-representation). Green bands show the preferred range of each metric.
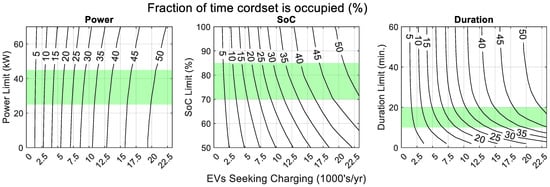
Figure 10.
The fraction of time the cordset is occupied, based on unplug incentives triggered by charging Power (left), SoC (middle), or session Duration (right).
Figure 10 shows that in all cases, more restrictive unplug incentive triggers (higher minimum Powert, lower allowable SoCt, or lower allowable session Durationn) result in lower occupancy, which is not specifically their intent. The increase in occupancy is minimal for Powert limitations across the whole parametric space. Considerably more variation is seen in SoCt-triggered terminations, and more again for Durationn triggers. This is consistent with the varying number of charging sessions terminating early in these three cases (Figure 6).
In the operation of the model, one of the direct impacts of cordset occupancy (Figure 10) is abandonment by EVs seeking charging (refer to Section 3.5). Any vehicle abandoning a charging attempt is bad not only for that driver whose desire to charge was thwarted but is also bad for the site operator, as it is a customer not served and energy not sold. The fraction of EVs that arrive at a site who Abandon due to the occupancy of the cordset and/or the length of the queue is shown in Figure 11.
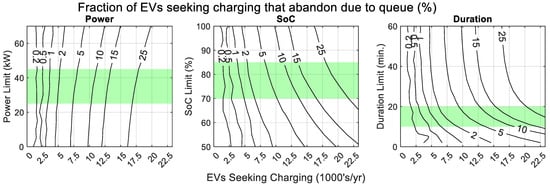
Figure 11.
The frequency of EVs seeking charging that abandon due to queue, based on unplug incentives triggered by charging Power (left), SoC (middle), or session Duration (right).
Figure 11 confirms that the more restrictive the unplug incentive trigger, the fewer arriving EVs abandon. This is consistent with the occupancy (Figure 10) and the mechanism of arriving EVs choosing to abandon. Further, Figure 11 is consistent with previous results, indicating that the most restrictive preferred Powert trigger (45 kW) has a similar impact to the least restrictive preferred SoCt trigger, or a Durationn trigger of about 30 min, less restrictive than the preferred range. Specifically, the charging Powert-triggered unplug incentive (left plot) are associated with a higher number of abandoned charging attempts than the SoCt- or Durationn-triggered unplug incentive, and are also more stable across the range of preferred values, shown in green bands.
4.3. Energy Sales
EVs that do not abandon their attempt due to a queue only leave after a charging session. (No provision is made in the model for those in the Queue to change their minds and abandon after first queuing, termed ‘reneging’ in [37] and elsewhere). For the charging network operator, the bottom line rests with the financial performance. Carrying fixed costs like maintenance, network fees, insurance, etc. means that the more electricity they can sell, the more those costs can be spread out. Figure 12 shows the total energy sales, in MWh per year, based on the three unplug incentive trigger metrics. Note that a local maximum exists within the parametric scope for many site popularities. As before, such a maximum is indicated with a blue line, with blue squares showing the underlying parametric grid points. Green bands indicate the preferred range of each trigger metric.
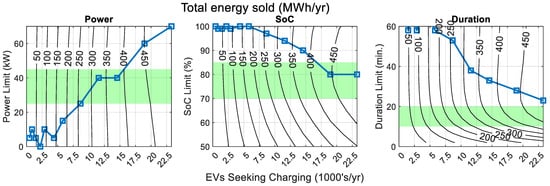
Figure 12.
The total energy sold through the cordset, based on unplug incentives triggered by charging Power (left), SoC (middle), or session Duration (right).
Figure 12 shows trends that mirror those in many of the previous figures. First, the differences in total annual energy sales across the preferred range of Powert limit (left plot, green band) are negligible for a given site popularity. Within the preferred range of SoCt limits (middle plot, green band), more variability is seen, while across the preferred range of Durationn limits (right plot, green band), there is considerable reduction in total energy sales. Less restrictive unplug incentive triggers increased sales through most of the range of site popularities examined, though as sites become very popular (>~5000 EVs per year), energy sales may improve slightly due to unplug incentives. We note that the 85% SoC limit being used by Electrify America [36] would have minimal impact on sales at 175 kW DCFCs at any but the most popular sites modeled.
An interesting comparison can be made between Figure 12 and the recommendation by [23] that their metric ‘utilization factor’ (effectively a load factor for a DCFC) should be limited to 10%. A 10% utilization factor would correspond to ~153 MWh sold per year (175 kW × 10% × 8760 h/yr). This implies that beyond site popularities of ~5000 EVs seeking charging per year, quality-of-service impacts become problematic, while an unplug incentive, at least one triggered by SoC or Duration, can delay this threshold to a somewhat higher site popularity. This analysis further shows that beyond just a few thousand EVs seeking charging per year, an unplug incentive will likely increase energy sales. The ideal restrictiveness of that incentive increases with popularity.
In any event, the bulk of the negative impact of a too-restrictive unplug incentive on energy sales seems to happen when SoCt-based triggers are more restrictive than 80% or Durationn-based triggers are more restrictive than 15 min. For scale, the highest observed annual energy delivery by cordsets in Germany in 2020, including cordsets with higher power capabilities than those modeled here, was less than 100 MWh [41], so the higher popularity end of these plots may represent a dramatic underinvestment in charging infrastructure, though it is the case that there are more EVs capable of charging at higher powers, for longer, in 2025 than there were in 2020.
4.4. User Experience—Wait Times
Returning to undesirable outcomes, needless terminations (when there is no vehicle waiting that benefits from the plug being vacated) were investigated in Figure 8 and termed ‘false positive’ interventions. The best analogy for a ‘false negative’ in this context could be the persistent presence of vehicles waiting to access the cordset, i.e., while there exists an intervention to minimize the need for waiting, and there is a waiting vehicle that would benefit, or that intervention is not being deployed (or not being deployed aggressively enough). In Figure 13, the total time spent waiting to access the cordset has been divided by the number of charging sessions to show the average wait time. This is the average amount of time EVs spend waiting to access a charging site throughout the year, not including the time they spend charging, and not counting EVs that abandoned their charging attempt.
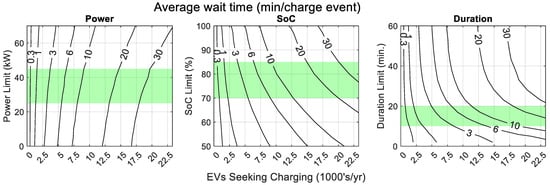
Figure 13.
The average time spent waiting to charge, based on unplug incentives triggered by charging Power (left), SoC (middle), or session Duration (right).
If a proscriptive maximum average wait time were to be set at six (6) minutes, Figure 13 suggests that for site popularities above ~6500 EVs per year, a Powert limit would need to be so high that the slowest charging class of vehicles would be unable to charge at all except by paying the unplug incentive rate. For sites that serve ~9000 EVs per year, either an SoCt limit below the minimum of the preferred range (green bands) of 70%, or a Durationn limit of 17 min or less would be necessary to keep average wait times down. We note that in contrast to its minimal impact on energy sales, the 85% SoC limit being used by Electrify America [36] would have a noticeable impact on average wait times, though their implementation is not as direct as that used in this model.
4.5. Compound Metric
As a final analysis in this section, Figure 14 shows a hybrid metric that is intended to compare the most desirable outcomes against the most undesirable ones. To do this, the quantity of energy sold (Figure 12) is multiplied by the number of EVs served. This composite ‘desirable’ value is divided by a composite ‘undesirable’ value consisting of the number of needless early session terminations (Figure 8) multiplied by the total amount of time spent queuing. The results are shown in Figure 14. It should be noted that both the selection of these four (4) metrics and the relative weighting (all equal in their native units) included in this compound metric may not be those of any specific stakeholder. Note also that as in Figure 8, because there are no early terminations in the null hypothesis (i.e., 0 kW Powert limit, 100% SoCt limit, or 70 min Durationn limit), the values there are undefined.
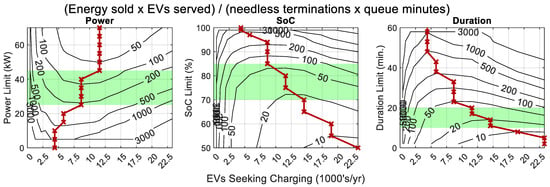
Figure 14.
The ratio of positive metrics (energy sold and EVs served) to negative metrics (‘false positive’ early terminations and minutes of queuing), based on unplug incentives triggered by charging Power (left), SoC (middle), or session Duration (right).
Figure 14 maps the ratio of desirable metrics to undesirable metrics, so a higher value is better. Examining first within each trigger metric, they indicate that better outcomes result from less restrictive trigger limits, i.e., lower minimum Powert, higher maximum SoCt, or longer maximum charging Durationn all increase the value of this hybrid metric for any site popularity. Comparing between trigger metrics, the hybrid metric has a higher range of values for Powert limits than for SoCt limits, which are higher than those for Durationn limits, within the respective preferred ranges (green bands). This is consistent with previous findings that the preferred Powert limits are less restrictive than the preferred SoCt limits, while the preferred Durationn limits are the most restrictive. More interestingly, there is a site popularity that provides the best outcomes, highlighted in dark red. This appears at about 8000–11000 EVs seeking charging per year for Powert limits, 8000–14,000 per year for preferred SoCt limits, and 11,000–15,000 within the preferred range of Durationn limits.
5. Discussion
5.1. Comparisons of Different Trigger Metrics’ Preferred Ranges
The ‘preferred’ range of the various trigger metrics was established primarily from personal experience and engineering judgment, though the Power metric was informed by the limitations of existing older EVs. Little thought was given to the equivalence or relative restrictiveness of these three preferred ranges prior to the formal analysis. Upon inspection, the most restrictive preferred Power trigger (45 kW) is similar in most output metrics to the least restrictive thresholds in the ‘preferred’ range of the SoC (85%), and outside the preferred range of Duration unplug incentives, being similar to a Duration limit of about 30 min, i.e., the preferred SoC limits are functionally more restrictive than Power limits, and Duration limits are still more restrictive.
This is a significant result given that the preferred Power range cannot be raised (made more restrictive) without fully excluding some EVs on the road. If a 45 kW charging Power unplug incentive threshold is insufficient to an operator’s site throughput objectives, using SoC or Duration may be a more equitable way to achieve a more aggressive goal; i.e., while an unplug incentive triggered by charging Power has some advantages, it is constrained from an equity lens by the existence of older, smaller, or slower-charging EVs.
This fact could be seen as an argument for multiple DCFC chargers having different power levels at charging sites; e.g., first generation DCFC infrastructure providing a maximum of 50–60 kW and having an unplug incentive at a far lower Power values should be retained to equitably serve older, slower-charging vehicles, while newer, higher-power infrastructure could serve, and have unplug incentives tailored to, EVs that can charge at higher power. This policy could be supported by site expansions that use higher-power equipment by simply retaining, rather than replacing, the older, lower-power units. However, this approach is in conflict with the desire to keep uniformity of equipment for both the user experience as well as maintenance consistency, spare parts, and repair times.
Alternatively, SoC or charging Duration limits can serve the entire EV population even with more restrictive unplug incentive thresholds and are therefore to some degree ‘future proofed’ against evolving EV technology.
5.2. Non-Technical Considerations on the Selection of a Trigger Metric
The three proposed trigger metrics may not be equally accessible to a non-technical population of EV drivers. Most notably, Duration on plug, measured in minutes, is a very straightforward concept, and everyone should have the tools and technical sophistication to keep track of the amount of time that has passed since they started charging, especially with a simple on-screen display of time. In contrast, both SoC and charging Power may require a (albeit relatively modest) level of technical sophistication. Specifically, SoC and Power metric require access to information that is monitored and tracked by the vehicle/DCFC, and while such information is routinely part of an EV ‘app’, it may not be something that drivers are familiar and comfortable with. This risk is illustrated by the fact that many vehicle manufacturers have struggled to properly educate vehicle drivers as to the reasoning behind not fully charging to 100% SoC every charge, which is a recommendation made in the name of reducing battery capacity degradation.
Duration limits may therefore be appealing to a general audience, but have two distinct disadvantages. The first is that it may be disproportionately restrictive on vehicles with larger batteries, or at least those with larger batteries relative to their charging rates or the Power capabilities of the DCFC. The second possible disadvantage is that it may be hard to enforce. If the trigger duration is reached, the charging vehicle could simply be unplugged and plugged back in, possibly even using a separate account/credit card, or user ID, depending on how enforcement is managed. This would presumably initiate a new session and reset the duration clock. This suggests that if Duration limits are the preferred unplug incentive trigger, an ID tied to the vehicle management system or some hardware address that cannot be falsified or replicated should be used to define charging sessions.
Power limits, as has been discussed, will have highly varied impacts on different EVs. Most significantly, older, slower-charging EVs will be disadvantaged relative to newer, faster-charging EVs by any power limit. The magnitude of this effect can be seen in Figure 2, which shows the charging power (kW) vs. the state of energy (kWh). Any given charging Power limit could produce a range of energy levels across as much as a factor of five (5) between the smallest and largest classes of vehicles. This energy impact would, in turn, impact the ability of such vehicles to reach further destinations or alternative charging sites.
SoC limits face a similar criticisms; shorter-range EVs, regardless of their charging Power, may have a diminished ability to reach their next destination without paying the unplug incentive price and charging to an SoC above the trigger threshold, i.e., insofar as energy level (effectively SoC multiplied by battery capacity) correlates to EV driving range, an SoC limit confers a driving range proportional to battery capacity (kWh). This effect is likely mitigated (but not fully addressed) by the correlation between battery size and EV energy efficiency. Of course, to avoid being stranded, the unplug incentive rate is presumably set at a price that the driver of any such vehicle in need of extra energy would be willing to pay.
5.3. Smart Solutions
All of the results presented in this paper would change if reliable queue information was available, and the unplug incentive could be applied based on that knowledge in real-time. In such a scenario, the ‘false positive’ early terminated (Figure 8) could be eliminated. Such a system could potentially be no more complicated than a low-frame-rate camera feeding pictures of the parking area around the cordset to a simple image processor, or a ‘check in’ procedure via an app or a kiosk that queuing drivers are asked to perform when arriving at the site. This seems like it could be implemented at low cost, or at least relative to the cost of the rest of the DCFC infrastructure but is not as of yet widely commercialized.
Of course, such a ‘smart’ solution based on real-time information would have its own set of ‘false positive’ and ‘false negative’ risks. An image-based system would be subject to ‘false positive’ errors due to the presence of non-EVs (or any vehicle not seeking charging). Meanwhile, a ‘false negative’ would result from someone new to the system failing to check in to the queue. In addition, it could complicate the charging experience for the vehicle owner, as the fee structure for charging could effectively change during the charging event if a second vehicle arrives mid-charge (including arriving once the trigger threshold has already been reached).
5.4. Generalizability of These Findings
No seasonal variability was included in this model; however, many jurisdictions, including Nova Scotia, Canada, where the source data for the hourly and weekday/weekend charging demand variability were collected, do have significant charging seasonality. This is discussed by the authors in previous work [38]. If significant seasonality is present in the demand for charging, outcomes will be time-weighted averages of the various site popularities. The non-linear nature of many of the outcomes mapped in the Results section will mean that a ‘driving season’ could have an impact disproportionate to its duration, depending on the metric of interest.
Another factor impacting the generalizability of these findings is the distribution of EV batteries, which changes from one EV market to another. This distribution is also likely to change through time due to new technology and consumer preference. For example, the distribution in Figure 2 and Table 1 represents a very different population than some other works. A Chinese study [40] divides 3777 unique EVs participating in their study into five classes, the largest of which has 48.3 kWh of battery capacity, which is the smallest of the nine representative batteries used here. This difference will materially impact the time each vehicle spends charging, even if the smaller batteries do not impact the power (kW) with which vehicle can charge.
6. Conclusions and Policy Implications
A charging demand model was constructed from observed charge start frequencies to inform a 1 min timestep model of charging events over a 1 year modeled period. A virtual fleet of vehicles was also constructed based on observed vehicle types, represented as nine characteristic battery charging curves and capacities. When a vehicle is charging during peak hours, it is subject to an unplug incentive based on one of the following: (i) charging power (kW) falling below a threshold, (ii) battery SoC rising above a limit, or (iii) charging event duration exceeding a certain time.
From this timeseries model, the impacts of a range of trigger thresholds are compared as they relate to user experience while waiting to charge, while charging, or to site operator outcomes such as utilization and energy throughput. One principal conclusion is that unplug incentives based on charging power have limited impact if they are designed to allow for the charging of smaller, slower-charging EVs. If site popularity is such that those modest interventions are insufficient, SoC or duration-based thresholds are likely a more equitable solution. Second, unplug incentives can increase the total energy sales (kWh) through a cordset for any but the most infrequently attended charging sites. They can also increase site throughput and decrease wait times, likely improving customer satisfaction.
Author Contributions
Conceptualization, N.J. and N.P.; methodology, N.P., N.J.; software, N.P.; validation, N.P., L.S.; formal analysis, N.P.; investigation, N.P. and L.S.; resources, L.S.; data curation, L.S.; writing—original draft preparation, N.P.; writing—review and editing, N.P., N.J. and L.S.; visualization, N.P. and N.J.; supervision, L.S.; project administration, L.S.; funding acquisition, L.S. All authors have read and agreed to the published version of the manuscript.
Funding
This research was conducted as part of a larger project in collaboration with Halifax Regional Municipality (HRM), with funding support from HRM and from the Nova Scotia Department of Energy (then called Nova Scotia Department of Natural Resources and Renewables).
Data Availability Statement
All data used in this study are either from cited online sources, or were shared under NDA and cannot be distributed.
Acknowledgments
We extend our thanks to Nova Scotia Power Inc. for sharing the DCFC data. In addition, we acknowledge the support of the Natural Sciences and Engineering Research Council of Canada (NSERC), funding reference number 555306.
Conflicts of Interest
The authors declare that there are no conflicts of interest other than that as EV drivers, they wish there for there to be more comprehensive and higher-power EV charging infrastructure. The funders had no role in the design of the study; in the collection, analyses, or interpretation of data; in the writing of the manuscript; or in the decision to publish the results.
References
- UNFCCC. The Paris Agreement. Available online: https://unfccc.int/process-and-meetings/the-paris-agreement (accessed on 26 February 2025).
- McCollum, D.; Krey, V.; Kolp, P.; Nagai, Y.; Riahi, K. Transport electrification: A key element for energy system transformation and climate stabilization. Clim. Change 2014, 123, 651–664. [Google Scholar] [CrossRef]
- Zhang, R.; Fujimori, S. The role of transport electrification in global climate change mitigation scenarios. Environ. Res. Lett. 2020, 15, 034019. [Google Scholar] [CrossRef]
- Ritchie, H. Tracking global data on electric vehicles. Our World in Data. February 2024. Available online: https://ourworldindata.org/electric-car-sales (accessed on 22 July 2025).
- International Energy Agency. Trends in Electric Car Markets—Global EV Outlook 2025—Analysis. Available online: https://www.iea.org/reports/global-ev-outlook-2025/trends-in-electric-car-markets-2 (accessed on 22 July 2025).
- Beckman, T.N. A brief history of the gasoline service station. J. Hist. Res. Mark. 2011, 3, 156–172. [Google Scholar] [CrossRef]
- ABB Inc. Terra 360. 2022. Available online: https://new.abb.com/ev-charging/terra-360 (accessed on 10 November 2025).
- Bräunl, T.; Harries, D.; McHenry, M.; Wager, G. Determining the optimal electric vehicle DC-charging infrastructure for Western Australia. Transp. Res. Part D Transp. Environ. 2020, 84, 102250. [Google Scholar] [CrossRef]
- Sawant, V.; Zambare, P. DC fast charging stations for electric vehicles: A review. Energy Convers. Econ. 2024, 5, 54–71. [Google Scholar] [CrossRef]
- Hardman, S.; Jenn, A.; Tal, G.; Axsen, J.; Beard, G.; Daina, N.; Figenbaum, E.; Jakobsson, N.; Jochem, P.; Kinnear, N.; et al. A review of consumer preferences of and interactions with electric vehicle charging infrastructure. Transp. Res. Part D Transp. Environ. 2018, 62, 508–523. [Google Scholar] [CrossRef]
- Sierzchula, W.; Bakker, S.; Maat, K.; van Wee, B. The influence of financial incentives and other socio-economic factors on electric vehicle adoption. Energy Policy 2014, 68, 183–194. [Google Scholar] [CrossRef]
- Wolbertus, R.; van den Hoed, R.; Kroesen, M.; Chorus, C. Charging infrastructure roll-out strategies for large scale introduction of electric vehicles in urban areas: An agent-based simulation study. Transp. Res. Part A Policy Pract. 2021, 148, 262–285. [Google Scholar] [CrossRef]
- Šimčák, M.; Frivaldský, M. Influence of over-voltage on LiFePO4 cell and its elements of battery equivalent scheme. Transp. Res. Procedia 2023, 74, 870–875. [Google Scholar] [CrossRef]
- Menye, J.S.; Camara, M.-B.; Dakyo, B. Lithium Battery Degradation and Failure Mechanisms: A State-of-the-Art Review. Energies 2025, 18, 342. [Google Scholar] [CrossRef]
- Li, Y.; Li, K.; Xie, Y.; Liu, J.; Fu, C.; Liu, B. Optimized charging of lithium-ion battery for electric vehicles: Adaptive multistage constant current–constant voltage charging strategy. Renew. Energy 2020, 146, 2688–2699. [Google Scholar] [CrossRef]
- Bitencourt, L.; Dias, B.; Soares, T.; Borba, B.; Quirós-Tortós, J.; Costa, V. Understanding Business Models for the Adoption of Electric Vehicles and Charging Stations: Challenges and Opportunities in Brazil. IEEE Access 2023, 11, 63149–63166. [Google Scholar] [CrossRef]
- Feng, J.; Khan, A.M. Accelerating urban road transportation electrification: Planning, technology, economic and implementation factors in converting gas stations into fast charging stations. Energy Syst. 2024, 1–32. [Google Scholar] [CrossRef]
- Pearre, N.S.; Swan, L.G.; Burbidge, E.; Balloch, S.; Horrocks, L.; Piper, B.; Anctil, J. Regional Electric Vehicle Fast Charging Network Design Using Common Public Data. World Electr. Veh. J. 2022, 13, 212. [Google Scholar] [CrossRef]
- Motoaki, Y.; Shirk, M.G. Consumer behavioral adaption in EV fast charging through pricing. Energy Policy 2017, 108, 178–183. [Google Scholar] [CrossRef]
- Sutton, K.; Hardman, S.; Tal, G. Strategies to Reduce Congestion and Increase Access to Electric Vehicle Charging Stations at Workplaces. April 2022. Available online: https://escholarship.org/uc/item/2345r48k (accessed on 28 July 2025).
- Limmer, S. Dynamic Pricing for Electric Vehicle Charging—A Literature Review. Energies 2019, 12, 3574. [Google Scholar] [CrossRef]
- Kucuksari, S.; Erdogan, N. Cost Analysis of DCFC Fast Charging Station Power Rates for Workplace Charging. In Proceedings of the 2022 IEEE Power & Energy Society Innovative Smart Grid Technologies Conference (ISGT), New Orleans, LA, USA, 24–28 April 2022; pp. 1–5. [Google Scholar] [CrossRef]
- Pearre, N.S.; Swan, L.G. Observational Evaluation of the Maximum Practical Utilization of Electric Vehicle DCFC Infrastructure. World Electr. Veh. J. 2022, 13, 190. [Google Scholar] [CrossRef]
- Cao, Y.; Tang, S.; Li, C.; Zhang, P.; Tan, Y.; Zhang, Z.; Li, J. An Optimized EV Charging Model Considering TOU Price and SOC Curve. IEEE Trans. Smart Grid 2012, 3, 388–393. [Google Scholar] [CrossRef]
- Dong, X.; Mu, Y.; Xu, X.; Jia, H.; Wu, J.; Yu, X.; Qi, Y. A charging pricing strategy of electric vehicle fast charging stations for the voltage control of electricity distribution networks. Appl. Energy 2018, 225, 857–868. [Google Scholar] [CrossRef]
- Singh, G.; D’Arpino, M.; Goveas, T. A Techno-Economic Assessment of DC Fast-Charging Stations with Storage, Renewable Resources and Low-Power Grid Connection. Energies 2024, 17, 4012. [Google Scholar] [CrossRef]
- Ban, D.; Michailidis, G.; Devetsikiotis, M. Demand response control for PHEV charging stations by dynamic price adjustments. In Proceedings of the 2012 IEEE PES Innovative Smart Grid Technologies (ISGT), Washington, DC, USA, 16–20 January 2012; pp. 1–8. [Google Scholar] [CrossRef]
- Roni, M.S.; Yi, Z.; Smart, J.G. Optimal charging management and infrastructure planning for free-floating shared electric vehicles. Transp. Res. Part D Transp. Environ. 2019, 76, 155–175. [Google Scholar] [CrossRef]
- Ucer, E.; Koyuncu, I.; Kisacikoglu, M.C.; Yavuz, M.; Meintz, A.; Rames, C. Modeling and Analysis of a Fast Charging Station and Evaluation of Service Quality for Electric Vehicles. IEEE Trans. Transp. Electrif. 2019, 5, 215–225. [Google Scholar] [CrossRef]
- Liu, B.; Pantelidis, T.P.; Tam, S.; Chow, J.Y.J. An electric vehicle charging station access equilibrium model with M/D/C queueing. Int. J. Sustain. Transp. 2023, 17, 228–244. [Google Scholar] [CrossRef]
- Yang, D.; Sarma, N.J.S.; Hyland, M.F.; Jayakrishnan, R. Dynamic modeling and real-time management of a system of EV fast-charging stations. Transp. Res. Part C Emerg. Technol. 2021, 128, 103186. [Google Scholar] [CrossRef]
- Tan, M.; Ren, Y.; Pan, R.; Wang, L.; Chen, J. Fair and Efficient Electric Vehicle Charging Scheduling Optimization Considering the Maximum Individual Waiting Time and Operating Cost. IEEE Trans. Veh. Technol. 2023, 72, 9808–9820. [Google Scholar] [CrossRef]
- Tesla. Tesla Find Us. Available online: https://www.tesla.com/en_ca/findus? (accessed on 27 September 2024).
- Lambert, F. Tesla Introduces $0.40/Minute Idle Fee for Superchargers to Incentivise Owners to Move When Charging is Over. Electrek. Available online: https://electrek.co/2016/12/16/tesla-supercharger-idle-fees/ (accessed on 11 August 2025).
- Electrify America. Congestion Reduction Effort. Available online: https://www.electrifyamerica.com/soc-pilot/ (accessed on 16 July 2025).
- Lewis, M. A New Electrify America Pilot Will Limit EVs to 85% State of Charge. Electrek. Available online: https://electrek.co/2024/07/08/electrify-america-pilot-state-of-charge-85-percent/ (accessed on 11 August 2025).
- Chattopadhyay, A.; Kar, S. IDEAS: Information-Driven EV Admission in Charging Station Considering User Impatience to Improve QoS and Station Utilization. arXiv 2024, arXiv:2403.06223. [Google Scholar] [CrossRef]
- Jayanath, N.; Pearre, N.S.; Swan, L.G. Geographic Factors Impacting the Demand for Public EV Charging: An Observational Study. World Electr. Veh. J. 2024, 15, 445. [Google Scholar] [CrossRef]
- Pearre, N.S. Location, Duration, and Power; How Americans’ Driving Habits and Charging Infrastructure Inform Vehicle-Grid Interactions. University of Delaware. 2013. Available online: https://www.proquest.com/docview/1511453581?pq-origsite=gscholar&fromopenview=true (accessed on 10 November 2025).
- Li, Z.; Xu, Z.; Chen, Z.; Xie, C.; Chen, G.; Zhong, M. An empirical analysis of electric vehicles ’ charging patterns. Transp. Res. Part D Transp. Environ. 2023, 117, 103651. [Google Scholar] [CrossRef]
- Hecht, C.; Figgener, J.; Sauer, D.U. Analysis of electric vehicle charging station usage and profitability in Germany based on empirical data. iScience 2022, 25, 105634. [Google Scholar] [CrossRef]
- Lee, Z.J.; Li, T.; Low, S.H. ACN-Data: Analysis and Applications of an Open EV Charging Dataset. In Proceedings of the Tenth ACM International Conference on Future Energy Systems, Phoenix, AZ, USA, 25–28 June 2019; ACM: New York, NY, USA, 2019; pp. 139–149. [Google Scholar] [CrossRef]
- Nova Scotia. Electric Vehicle Registration Data|Open Data. Available online: https://data.novascotia.ca/Permits-and-Licensing/Electric-Vehicle-Registration-Data/avxy-ifhs/about_data (accessed on 27 August 2024).
- EVKX.net. EV Models. Available online: https://evkx.net/models/ (accessed on 16 July 2025).
- Fastned. Ultrarapid Charging Stations for Electric Vehicles. Available online: https://www.fastnedcharging.com/en (accessed on 16 July 2025).
- C. Electrique Inc. The Electric Circuit. Available online: http://lecircuitelectrique.com/en/charging/ (accessed on 16 July 2025).
- Cai, W.; Yao, Y.-X.; Zhu, G.-L.; Yan, C.; Jiang, L.-L.; He, C.; Huang, J.-Q.; Zhang, Q. A review on energy chemistry of fast-charging anodes. Chem. Soc. Rev. 2020, 49, 3806–3833. [Google Scholar] [CrossRef]
- Gregory, M. High Power Lithium Ion Battery Characterization. Master’s thesis, Dalhousie University, Halifax, NS, Canada, 2024. [Google Scholar]
- Helmus, J.R.; Lees, M.H.; van den Hoed, R. A data driven typology of electric vehicle user types and charging sessions. Transp. Res. Part C Emerg. Technol. 2020, 115, 102637. [Google Scholar] [CrossRef]
Disclaimer/Publisher’s Note: The statements, opinions and data contained in all publications are solely those of the individual author(s) and contributor(s) and not of MDPI and/or the editor(s). MDPI and/or the editor(s) disclaim responsibility for any injury to people or property resulting from any ideas, methods, instructions or products referred to in the content. |
© 2025 by the authors. Published by MDPI on behalf of the World Electric Vehicle Association. Licensee MDPI, Basel, Switzerland. This article is an open access article distributed under the terms and conditions of the Creative Commons Attribution (CC BY) license (https://creativecommons.org/licenses/by/4.0/).