Abstract
A radical transformation of the transport industry is required in order to achieve a fossil-fuel-free vehicle fleet and reach the greenhouse gas emissions goals. Electrification plays a crucial role in this radical process. An electric road system (ERS) is a road that supplies power to electric vehicles as they drive on it, offering numerous advantages. These include an extended driving range, decreased reliance on batteries, and increased flexibility and convenience for drivers, eliminating the need to stop for recharging. This paper highlights the transformative potential of ERS in revolutionizing the land transport sector. Through thorough testing with a conductive ERS demonstrator, the viability of the presented technology is validated. Essential aspects like power transfer, efficiency, safety, and environmental impact showcase ERS’s adaptability and scalability across diverse vehicle types. This study recommends widespread ERS support for battery electric vehicles, emphasizing the route toward a sustainable future.
1. Introduction
The decarbonization of road transport is a fundamental step toward significant reductions in global CO2 emissions. The electrification of road transport is a promising path toward CO2 reduction [1]. This electrification of road vehicles is however challenging from several viewpoints. The electric traction system (electric machine and corresponding inverter, excluding the battery) is an improvement compared to combustion-based propulsion, since an electric traction system is significantly smaller, lighter, and more efficient than the corresponding combustion-based traction system. The challenge lies in how the energy is transferred to and stored onboard a battery electric vehicle (BEV).
The electric energy can be transferred in three different ways:
- The onboard battery energy storage can be filled via the direct transfer of electric energy, called charging. The charging rate is constrained by the capacity of the battery to receive power. Modern full-electric-vehicle batteries are designed to store large amounts of energy, enabling faster charging. Fast charging, exemplified by the Kia EV6 [2], can achieve partial recharging from 10% to 80% in about 20 min. Extended charging times, such as during night-time, result in lower charging rates.
- An alternative is to replace an empty battery with a full one, called battery swapping. There are several automotive OEMs for both commercial vehicles and private cars, like the Chinese car OEM NIO [3], that are designed for systematic battery replacement in just a few minutes in dedicated battery-swapping stations. The empty battery is then recharged in the battery swapping station at a lower charge rate than demanded at a fast charging station.
- A continuous supply of electric energy can be provided at least for parts of a travelled distance on a public road. This kind of energy transfer can be referred to as an “electric road system” (ERS), which partly replaces the role of fast charging. While on an ERS, energy can be provided for both propulsion of the vehicle and charging an onboard battery. The need for onboard energy storage is reduced. As presented in [4], even with fractional deployments of an ERS on a main road system, the battery capacity installed in the majority of BEVs can be reduced by 50–70%.
1.1. Electric Roads
An electric road refers to a road that includes some kind of technology that facilitates electric energy transfer from the road to the vehicles driving on it. The energy transfer can be made in a conductive way, meaning that some kind of sliding contacts are used, as used in trains, trams, and trolleybuses. Energy transfer can also occur inductively utilizing a high-frequency magnetic field connecting a transmitting component, typically located just beneath the road surface, and a receiving component installed in vehicles, usually beneath the vehicle body. The company Electreon [5] manufactures an example of this technology. This paper focuses on ERSs in the form of conductive ERSs.
Conductive ERSs exist in at least three different forms:
- Siemens eHighway [6] is an example of conductive transfer from above the vehicle via catenary lines. This technology is derived from train technology and is only designed to supply power to electric trucks. The catenary lines are located on a highway in Germany and was first commissioned using an electric truck in 2017.
- Honda has introduced a conductive transfer system from the side of the road [7]. With this technology, the vehicle connects to a continuous, parallel, two-pole supply on the side of the road via an arm extended from the side of the vehicle. Honda has developed a demonstrator ERS based on this technology located on a racing track. The system has demonstrated exceptional performance, effectively transferring power exceeding 450 kW at speeds of 150 km/h.
- There are multiple companies that have built ERS demonstrators using conductive transfer from the road surface, for instance, Alstom [8], Elways [9], and Elonroad [10]. For this type of conductive ERS technology, a mechanical arm or mechatronic device establishes a connection with a continuous, parallel, two-pole supply located in the road. Both Alstom and Elways have tested their own versions of this technology with electric trucks in enclosed environments. Elonroad has tested this technology on a public road using an electric bus, a passenger car, and a resistive load.
To validate the viability of conductive ERSs, this paper reports on experiences with commissioning an ERS demonstrator with different road vehicles drawing power from it.
1.2. Aspects of Different Charging Technologies
As outlined in [1], a fast-charging-based road transport system requires a ratio of 1:100 or denser of fast charging stations for BEV passenger cars. In Sweden, with about 5 million cars [11], this corresponds to about 50,000 fast charging spots distributed along approximately 15,000 km of national and European roads. This results in at least 100 fast chargers every 30 km on average across Sweden. Along traffic-intense roads, where an even greater demand is expected, even more fast chargers will be needed.
Meeting the increasing demand for a high ratio of fast chargers to BEVs, coupled with a lower overall vehicle count, presents a similar challenge in allocating fast chargers for commercial vehicles. Modeling indicates that with the implementation of an ERS for road transport, approximately 3000 to 4000 km out of the total 15,000 km of national and European roads would require ERS coverage [12]. This coverage would facilitate “non-stop” travel across the country, with vehicles needing 50–70% less battery capacity than a fast-charger-based system.
These conclusions highlight two challenges with electromobility: (I) a huge number of fast charging stations is needed in a fast-charging-based system; (II) by deploying ERS technology on a wide scale, the abundant requirement of fast chargers can be diminished and the amount and size of BEV batteries can be reduced significantly.
1.3. Related CO2 Emissions
Figure 1 illustrates the CO2 emissions originating from both the manufacturing and driving phases of passenger cars, local distribution trucks, and long-haul trucks in Sweden. The analysis considers a fully electrified vehicle fleet, comparing a fast-charger-based system (left bar) with an ERS-based system (right bar) in terms of required battery amount. Note that the CO2 emissions from driving various vehicle types (depicted in the yellow field) remain constant for both types of charging infrastructure. The CO2 emissions from driving were calculated using the CO2 emissions related to electricity production from [13] and consumption per vehicle from [4].
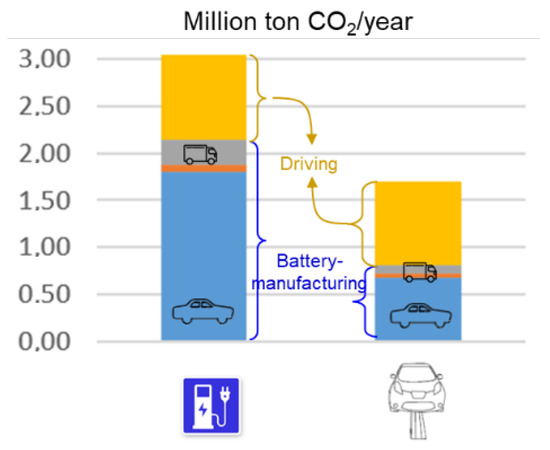
Figure 1.
CO2 emissions from BEVs with a full electrification of cars and two types of trucks in Sweden using either a fast-charger based system (left bar) or an ERS-based system (right bar).
However, the CO2 emissions related to battery manufacturing (indicated by the blue field for passenger cars, gray for long-haul trucks, and orange for local distribution trucks) are non-negligible compared to the emissions from driving, regardless of the charging infrastructure. Moreover, employing an ERS significantly reduces the CO2 emissions from battery manufacturing. The calculation of battery manufacturing emissions involved several steps:
- Determination of the distribution of vehicle types and their quantities in Sweden based on data from [11].
- Assumption of battery sizes: 30 kWh for passenger cars, 200 kWh for local distribution trucks, and 250 kWh for long-haul trucks [1].
- Computation of battery amounts for a fast-charger-based system compared to an ERS-based system, relying on [4].
- Adoption of an assumed emissions factor of 60 kg CO2/kWh related to battery production [14].
In conclusion, the figure highlights that the CO2 emissions from battery manufacturing are dominated by passenger car batteries and that the selection of charging technology significantly impacts CO2 emissions, indirectly via the reduced battery need.
2. Materials and Methods
This paper presents a conductive electric road demonstrator built by the company Elonroad [10], located on a public road in an urban environment in Lund, Sweden, that has been used to assess the potential of the presented electric road technology. The project related to the demonstrator is known as the Evolution Road project [15], which consists of partners from industry, academia, as well as the public sector in Sweden, and is funded by the Swedish Transport Administration. Since the project started in 2019, a number of aspects related to the technology has been tested encompassing the electric power transfer to the installation and build procedures. In this paper, results and experiences from the project concerning the following areas are presented:
- Electric power transfer;
- Efficiency calculations;
- Electrical safety;
- Mechanical safety *;
- Electromagnetic compatibility (EMC) *;
- Acoustic tests *;
- Environmental perspective *.
Areas labeled with an asterisk provide a concise overview of the gained experiences and results and are presented in Section 2.3, Section 2.4 and Section 2.5.
2.1. The Electric Road Demonstrator
The conductive electric road demonstrator consists of a transformer, a rectifier, and a segmented conductive electric rail with a total length of 850 m embedded in the top layer of the road surface, as presented in Figure 2. In the following subsection, each subsystem of the demonstrator is presented.
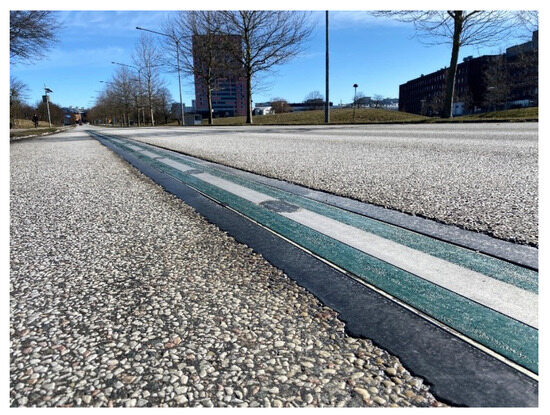
Figure 2.
The ERS demonstrator.
2.1.1. Alternating Short-Segmented Electric Road
The electric road presented in this paper is a form of conductive electric road known as an alternating short-segmented electric road (ASSE). This means that the short segments (1 m long) are arranged so that, as illustrated in Figure 3, every other short segment (dark grey) is permanently connected to 0 V DC, and the remaining short segments can be connected to either 0 V DC or 650 V DC by means of solid-state switches integrated in the road. To mitigate the risks associated with hazardous voltage levels, a short segment is activated with 650 V DC only when a vehicle is positioned on top of it. As a convenience and safety measure, each short segment is equipped with LEDs to indicate the activation status of 650 V DC. The activation of short segments is facilitated through wireless communication between the vehicle and ERS.
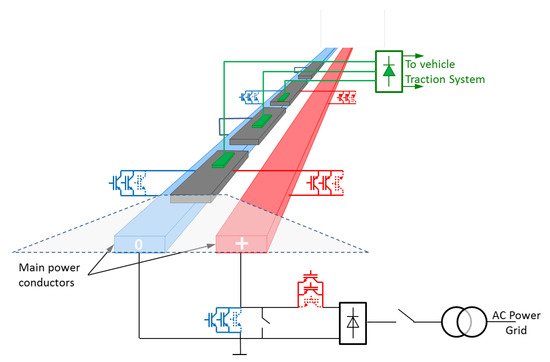
Figure 3.
Overview of the basic principle of a conductive ERS taken from [16]. All elements in green are placed onboard the vehicle and represent the interface toward the electric road. The rest of the vehicle is not shown for clarity.
The ASSE is rectangular in cross-section and built in 10 m sections that are integrated in a groove in the road and secured by a bitumen mass, as presented in Figure 4. A 40 cm wide and 6 cm deep groove is milled in the top layer of the road. The 10 m sections are then placed in the groove hanging on bars, thus are level with the surrounding asphalt. The remaining space is filled with a bitumen mass that fixes the rail to the road and the bars are removed. The whole process is fast and has no negative impact on the underlying layers of the road body. Once installed, the visual impact of the road is very limited, as shown in Figure 2. However, more knowledge and research are required regarding the rectifier station installations and cable installation between the rectifier station and the electric road, as these installations are expected to be more time-consuming and labor-intensive than the installation of the electric road.
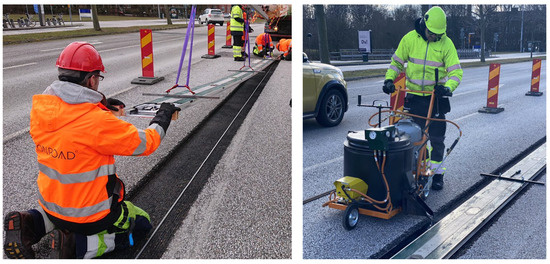
Figure 4.
(Left): Installation of a 10 m section of ASSE into a groove. (Right): Moulding a 10 m section of ASSE into a groove in the road.
The presented ERS technology does not only supply vehicles with power but also offers control over both charge access as well as billing data for the charging vehicles. In addition, the LEDs in the ASSE offer additional safety services such as alerts of traffic accidents and risks of traffic congestion.
2.1.2. The Rectifier Station
A 6-pulse passive rectifier (bottom right in Figure 3) is used to provide 650 V DC to the two internal main power conductors (illustrated in blue and red) in the ASSE. The demonstrator is connected to a 400 V grid; therefore, a 400 kVA 400/450 V transformer is used to achieve a mean three-phase rectified voltage of 650 V DC. In addition to the rectifier and the transformer, the rectifier station also contains solid-state switches (used to connect and disconnect the electric road) and computers that can handle billing and data as well as survey and control the short segments and their corresponding LEDs in the road.
2.1.3. The Power Receiver in the Vehicle—The “Pick-Up”
In order to ensure a smooth power transfer between the ASSE and the vehicle, at least three sliding contacts are required (illustrated in green in Figure 3). The device containing the sliding contacts, presented in Figure 5, is referred to as the “pick-up”. The pick-up is a mechatronic device equipped with sensors that automatically ensure contact with the ASSE as it has the capability to lower, raise, and move the sliding contacts laterally. Additionally, it can exert a specific contact force on the contacts. As the pick-up adjusts its position automatically, limited input or attention is required from the driver.
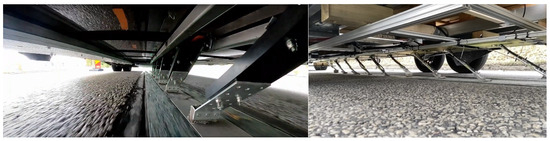
Figure 5.
Two different types of pick-ups mounted on different vehicles providing contact between ASSE and vehicle.
As a vehicle drives along the ERS and draws power, the sliding contact points alternate between short segments that are connected to either 650 V DC or 0 V DC. As a consequence, an onboard rectifier is required as the voltage perceived by the vehicle has an alternating voltage polarity from the pick-up. In addition to the onboard rectifier, a DC/DC converter is required onboard the vehicle for two reasons: (I) to match the voltage level of the high-voltage battery with the ERS supply and (II) to provide galvanic isolation between the ERS supply and the traction voltage system (TVS) of the BEV.
As roads are subjected to harsh weather conditions, the contact surface can be wet, icy, or even covered in snow. In addition, small pebbles as well as sand can accumulate on the contact surface. To mitigate the risk of poor contact during cold conditions, the project has successfully used a snow plough to clear the contact surface. Small objects, such as sand or pebbles, are cleared by the pickup due to the nature of the sliding contact. However, small objects have the potential to lift the sliding contact, posing a risk of breaking the current path to the rectifier and potentially causing an arc.
To address this issue concerning poor contact, two measures have proved effective during the project: (I) dividing one sliding contact into several smaller contacts arranged in parallel and (II) incorporating more than three sliding contacts per vehicle. Both of these strategies provide alternative paths for the pick-up currents, mitigating the risk of arcing. Although the pick-up has performed well during the project, with an efficiency well over 97% (as shown in Section 3.2), little is known of its performance in terms of losses at higher speeds. In addition, service intervals and maintenance costs related to the pick-up are hitherto unknown.
2.2. Electric Power Transfer and Efficiency Calculations
In this project, three different vehicles draw power from the electric road: an electric bus, a passenger car, and a resistive load mounted on a trailer. In Figure 6, the interfaces where voltage and current are measured in the demonstrator are depicted as follows: A—grid, B—after the transformer, C—after the rectifier in the rectifier station, and E—after the rectifier in the vehicle. These measurements serve as the basis for calculating power, losses, and efficiency at these interfaces. A full description of the measurement system is presented in [17].
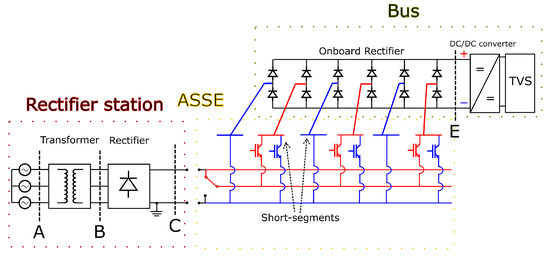
Figure 6.
An overview of the measurement interfaces of the ERS demonstrator and the electric bus. Red elements represent 650 V DC and blue represent 0 V DC.
2.3. Safety
There are many safety aspects to consider related to conductive ERS technology. The following issues are considered in this paper:
- The two main areas of electrical safety in a conductive ERS are related to the risk of touch events related to hazardous voltages. This means that there should be no risk related to touching the electric road or a vehicle that is connected to an electric road.
- Firstly, touch protection of the ASSE is accomplished by the design, as the outer exterior of the ASSE is grounded to 0 V potential in the rectifier station. In addition, short segments are only activated with hazardous voltage levels of 650 V DC when a vehicle is located over it; otherwise, they remain at safe ground potential of 0 V, as presented in Section 2.1.1.
- Secondly, the high-voltage battery, ERS supply voltage, and corresponding TVS in the vehicle are galvanically isolated from the chassis to prevent hazardous touch currents from flowing through a person’s body (standing on conductive ground) when touching the vehicle’s chassis. Figure 7 presents the basic concept of an isolation fault between the positive high-voltage pole of the ERS supply and the vehicle’s chassis while a human body is in contact with the vehicle’s chassis and ground. This event causes current to flow through the human body to ground and back to the rectifier station.
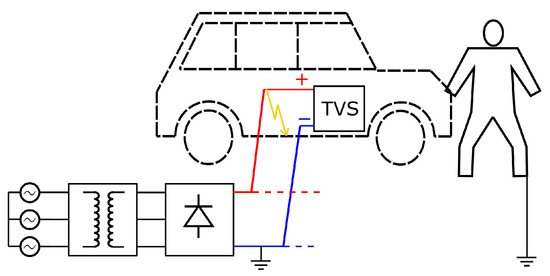 Figure 7. Conceptual overview of the electric safety issue of touch current when a vehicle is drawing power from the ERS and a human body is connected to the vehicle’s chassis. Red elements represent 650 V DC and blue represent 0 V DC.
 - However, to mitigate this risk, the vehicle is equipped with an isolation fault monitoring system. The isolation fault monitoring system is designed to ensure that the impedance between the high-voltage poles in the TVS and the chassis is unaltered and kept in the magnitude of M. If an isolation fault occurs (meaning that the impedance is instantly drastically reduced), the intended isolation fault monitoring system is triggered and disconnects the high-voltage battery from the TVS as well as the vehicle from the ERS supply.
- In order to gain a greater understanding of this phenomenon, measurements of touch currents were obtained when a human model, defined according to standard [18], is connected to the electric bus chassis while the bus was drawing power from the ERS. No isolation faults were present in the bus or the ERS demonstrator during these measurements. A 4444 Picoscope [19] was used to measure the voltage over the human model in order to assess the magnitude of touch current, as outlined in the related standards [18,20]. The results of these measurements are presented in Section 3.3 in this paper.
- Mechanical safety refers to the road friction on the short segments of an ASSE, which, as a conductive ground-based technology, can cause poor friction compared to the adjacent friction on the original road. To mitigate this risk, a pattern is engraved in the short segments that is small enough to not interfere with the sliding contacts but provide enough grip to the rubber in the wheels. Throughout the project, a number of friction test have been conducted by two different parties, Ramboll consultancy and The Swedish National Road and Transport Research Institute (VTI). All tests concluded that the ASSE fulfilled the friction requirements for public roads in Sweden.
- Electromagnetic compatibility (EMC) is briefly mentioned in this paper as the ERS must comply with standards concerning radiated emissions. However, as there are no specific standards concerning ERSs, measurements were conducted based on best practices concerning EMC as well as standards addressing similar infrastructure, for instance, railways, tramways, and trolleybuses. Three different organizations conducted measurements at different occasions: Research Institute of Sweden (RISE), Swedish Defence Materiel Administration (FMV), and Department of Biomedical Engineering, LTH, Faculty of Engineering. Measurements of radiated emissions, while the bus is drawing power from the demonstrator ERS, identified peaks across a broad spectrum of frequencies. To investigate this issue, further measurements are planned to be conducted in a laboratory environment, aiming to mitigate the uncertainties associated with background emissions.
2.4. Acoustic Tests
There are many aspects to consider in an ERS, for instance, the issue of noise pollution. In order to assess the impact of the sliding contacts concerning noise, acoustic tests were performed with the ERS demonstrator. The tests were performed according to ECE-R51 [21] with the electric bus on the ERS demonstrator. The tests were performed at night time in order to reduce the influence of background noise. The bus drove at different speeds with the pick-up lowered and raised for each speed as to determine the impact of the sliding contact. Initial results showed no significant increase in noise emissions with the pick-up connected to the ASSE.
2.5. Environmental Perspective
As ERSs have the benefit of reducing CO2 emissions by allowing BEVs to have smaller batteries, this paper also briefly addresses the environmental perspective of recycling the ERS. As the ERS demonstrator is still in commission, the process of recycling is in a preliminary phase. However, initial measures of recycling subsystems and parts of the ERS have thus far produced promising results. The project is presently assessing the economic benefits of recycling, with more detailed information forthcoming. However, it is evident that recycling the entire system post use poses no practical challenges, and the metal value of the components far surpasses the recycling costs.
A primary motivation behind the project is the need to lower the overall need for batteries in a future, mostly for BEVs. A compelling argument for ERS-based infrastructure capable of serving all BEV types lies in the fact that approximately 90% of the batteries in existing and future vehicles are and will be in smaller vehicles, with about 10% in heavy duty trucks (HDTs) [1]. Infrastructure that only services HDTs would have a comparatively minor impact on the environmental footprint of battery production and the complexity of recycling batteries. In conclusion, from an environmental standpoint, comprehensive support for all BEV types is recommended.
3. Results
3.1. Electric Power Transfer
Two types of electric power transfer tests are presented in this paper: (I) two vehicles (a passenger car and the electric bus) are drawing power from the ERS demonstrator simultaneously, see Figure 8 (left), and (II) a resistive load mounted on a trailer, see Figure 8 (right), draws a power of 280 kW at a speed of 80 km/h.
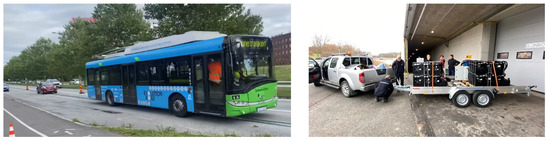
Figure 8.
(Left): An electric bus and a passenger car drawing power from the ERS demonstrator simultaneously. (Right): The trailer designed to draw 300 kW.
The two-vehicle test showed that the road was able to provide individual supply to several vehicles. In Figure 9, the total drawn power in interface C (interfaces defined in Section 2.2) is presented while a passenger car (a Nissan Leaf) and an electric bus (Solaris Trollino 15) draw power from 140 m of electric road. The measurements were sampled at 200 kHz using LEM sensors. The full measurement system is presented in [17].
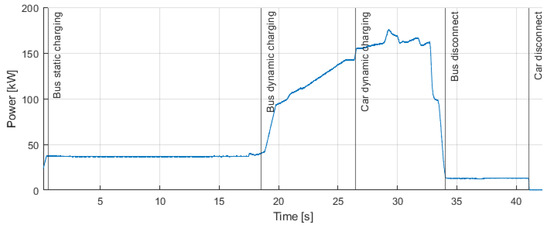
Figure 9.
Bus and passenger car drawing power from the ERS demonstrator.
At 0.5 s, static charging is initiated, and the bus is standing still while charging from the ERS demonstrator and drew a power of 37 kW. During static charging, the drawn power is limited to approximately 40 kW to avoid the risk of overheating the contact points in the pick-up. As the bus starts to drive, at 18.5 s, the drawn power to the battery increases from 37 kW to roughly 80 kW. As dynamic charging commences, the bus accelerates, and the total drawn power in interface C increases. While the bus is accelerating, the passenger car starts to draw 13 kW dynamically (located behind the electric bus) at 26.5 s; consequently, the total drawn power is instantly increased from 142 kW to 155 kW. At 32.5 s, the bus reaches a top speed of approximately 20km/h, and, at 33 s, the bus starts to brake until it disconnects from the electric road at 34 s. At 41 s, the passenger car drives off the electric road and disconnects.
Throughout this charging event, the onboard DC/DC converter in the passenger car is configured to draw 13 kW. Due to the low state of charge (SoC) in the car’s high-voltage battery, the entire 13 kW is allocated to the battery circuit, where it is distributed between the battery and the electric traction system. Since the DC/DC converter sets a limit on the drawn power from the ERS demonstrator, the drawn power remains constant regardless of whether the passenger car is charging statically or dynamically.
In Figure 10, measurements of the drawn power and speed from the ERS demonstrator are presented from interface C (power on left y–axis, and speed on right y–axis) with the trailer acting as the vehicle load. These measurements were obtained using the Elonroads internal measurement system sampled at approximately 1 kHz. After 0.9 s, the trailer connects to the first ASSE section and draws a power of 280 kW. As different versions of the 10 m sections of ASSE were used during this measuring event, the first ASSE 10 m sections that the trailer connected to were not equipped with sensors to measure speed. Consequently, the speed of the trailer was unknown until 1.3 s when the trailer made contact with a 10 m section of ASSE that could provide speed measurements. When speed measurements were available at 1.3 s, the trailer had a speed of 75 km/h and reached a speed of 80 km/h at 2.5 s. After 3 s, the car that was pulling the trailer started to break and reached a speed of 13 km/h after 6.5 s. The trailer disconnected from the ASSE at 8.1 s, and the power was 0 kW at this time. The trailer came to a complete stop after 8.6 s.
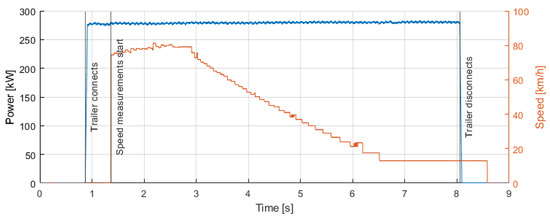
Figure 10.
Trailer drawing power from the ERS demonstrator. The left y–axis shows the drawn power (blue line), and right y–axis shows the speed of the trailer (orange line).
As presented in Figure 10, the ERS demonstrator is able to provide a continuous power of 280 kW with no disruption between 0.9 and 8.1 s at speeds up to 80 km/h. This verifies that the presented ERS technology is capable of providing high power levels at high speeds resembling highway conditions for trucks. This high power level of 280 kW is mainly intended for heavy trucks and not expected to be drawn by cars that are expected to draw up to 50 kW from the ERS. Although the ERS demonstrator is designed to provide 300 kW of power, tests have shown that the installed transformer in the rectifier station is slightly undersized. Consequently, the transformer restricts the trailer from drawing power at these levels.
3.2. Efficiency Calculations Based on Tests
To evaluate the efficiency between the grid and the vehicle for the showcased ERS technology, a charging event was conducted wherein the electric bus draws power from the ERS demonstrator. Figure 6, previously introduced in Section 2.2, presents an overview of the ERS demonstrator and the electric bus with the corresponding measurement interfaces (A–E), where current and voltage are used to calculate the losses and efficiency for the ERS demonstrator. Interface A–C represents the losses in the transformer and the rectifier, and interface C–E represents the losses in the underground cable to the ASSE, the ASSE, the sliding contact, and the onboard rectifier.
In Figure 11, a charging event with 140 m of electric road and the electric bus drawing power from it is presented. In the upper plot, losses (left y–axis) and drawn power (right y–axis) at interfaces A–C, C–E, and A–E are presented with a moving average filter with a time constant of 50 ms; in the lower plot, the efficiency (left y–axis) and drawn power (right y–axis) at interfaces A–C, C–E, and A–E are presented with a moving average filter with a time constant of 250 ms. Losses and efficiencies were calculated based on measurements of voltage and current using the measurement system presented in [17].
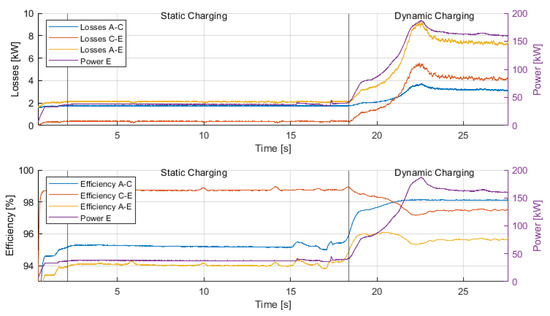
Figure 11.
Power (right y–axis), losses (upper plot, left y–axis), and efficiency (lower plot, left y–axis) when the bus is drawing power from the ERS demonstrator.
At 2 s, the bus is at standstill and draws 39 kW from the electric road. The drawn power, supplied to the battery during static charging, is limited to 39 kW in order to avoid overheating the contact points in the pick-up. After 18 s, the bus starts to accelerate and dynamic charging is initiated. Consequently, the previous power limit to the battery increases from 39 kW to 79 kW at 19 s. Simultaneously, the drawn power required for propulsion increases as the bus accelerates, reaching a peak power of 187 kW at 22.5 s. By 25 s, the bus has attained its final speed of 40 km/h, and at 27 s, the drawn power reduces as the bus starts to cruise at 40 km/h.
During static charging, the loss in the ERS demonstrator from grid to vehicle (interface A–E, upper plot) is 2.1 kW, which corresponds to an efficiency of 94% (interface A–E, lower plot). A total of 1.7 kW of these losses occur in the rectifier station (interface A–C, upper plot), which results in a efficiency of 95% for the rectifier station. The corresponding loss in the ASSE and up to the BEV DC/DC converter (interface C–E, upper plot) is 0.4 kW, which results in a efficiency of 98.7%. During dynamic charging, the total losses in the ERS demonstrator (interface A–E, upper plot) at peak power (187 kW at 22.5 s) is 9 kW, which results in a total efficiency of 95.4% (interface A–E, lower plot). The losses in the rectifier station are now 3.6 kW (interface A–C, upper plot) and that in the ASSE up to the DC/DC converter in the BEV (interface C–E, upper plot) reaches 5.4 kW. Although the losses increase at peak power, and generally during dynamic charging, the efficiency for the rectifier station (interface A–C, lower plot) increases to 98.1%, and the efficiency for the ASSE and up to DC/DC converter in the BEV decreases to 97.2%. After peak power at 22.5 s, the efficiency for the ASSE and the vehicle (interface C–E) increases to 97.4%.
To conclude, from Figure 11, it is clear that the presented conductive ERS technology offers great efficiency performance. For the ASSE and the vehicle (interface C–E), an efficiency between 97.2 and 98.7% shows great promise for the presented ERS technology as high efficiency is crucial for ERS deployment on a wide scale.
However, it is also evident that the efficiency performance is dependent on the power drawn by the vehicles. During static charging, the efficiency for the rectifier station is lower than during dynamic charging. This is because the relatively constant magnetization losses cause the efficiency of the 400 kVA transformer in the rectifier station to increase with increasing load. At lower loads (around 40 kW in this case), the no-load losses in the transformer are high compared to the load-losses, which results in a low efficiency for the transformer. This indicates that the transformer choice in conjunction with drawn power load from the ERS are important factors for the efficiency of the presented ERS technology.
During static charging, the losses in the ASSE and in the vehicle are smaller than during dynamic charging, which is due two main reasons: (I) The resistive losses in the system increase with the square of the drawn current. Hence, a higher drawn power results in higher losses, as seen in Figure 11 when dynamic charging commences. (II) During dynamic charging, the contact resistance in the sliding contact between the pick-up and short segment increases. As a result, the resistive losses in the system at interface C-E increase as both the resistance and the drawn current increase, which leads to an overall reduction in efficiency.
3.3. Electrical Safety Test—Touch Current
For a conductive ERS, the issue of electrical safety is critical. One of the most important safety aspects is the issue of touch current related to the vehicle’s chassis, meaning that there should be no safety risks of touching an electric vehicle’s chassis while it is charging on an electric road. In order to assess the electrical safety aspect of touch current, measurements were conducted on the ERS demonstrator with a model of a human body connected to electric bus chassis while the bus was drawing power from the demonstrator.
In Figure 12, the measurement setup for the touch current tests is presented, where a human model is connected between a BEV chassis and ground while the BEV is drawing power from an electric road. The human model (defined in [18]) comprised a resistor Rs (1.5 k), connected in parallel with a capacitor Cs (0.22 nF), which was connected in series with the resistor Rb (0.5 k). Resistor Rs and Cs correspond to the impedance of a human body’s skin, while resistor Rb corresponds to the impedance of a human body excluding the skin. The voltage Vb over resistor Rb was measured in order to assess the current that flows through the human model when connected to the vehicle’s chassis.
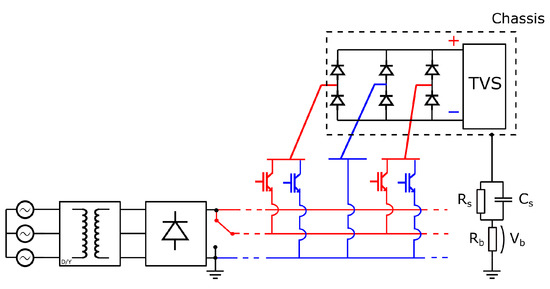
Figure 12.
Overview of the measurement setup related to touch current when a human model is connected between a BEV chassis and the ground while the BEV is drawing power from an ERS. Red elements represent 650 V DC and blue represent 0 V DC.
Figure 13 presents measurements of the voltage Vb and current through the human model Ib when the electric bus is charging on 80 m of electric road with a human model connected between its chassis and ground. The upper plot shows the voltage Vb, and the lower plot shows the current Ib. In both plots, the unfiltered value (left y–axis) as well as a moving root mean square (RMS) value (right y–axis) with a time constant of 100 ms are shown. The relevant levels of touch current are presented as RMS values in the relevant standards [18,20]. Although the high-voltage system of the bus is isolated from the chassis, there is a current that flows through the human body to the ground when the bus is drawing power from the ERS demonstrator. This is caused by inadvertent capacitive coupling (also known as-parasitic capacitance) between the high-voltage poles of the TVS and the bus chassis. As presented in [22], the greatest impact on the voltage Vb is the parasitic capacitance between the output of the converters in the TVS and the bus chassis, for instance, the output of the onboard high voltage battery charger and the traction inverter, see Figure 14. Therefore, the magnitude of touch current is greatly related to which subsystems and corresponding converters are active in the TVS during charging.
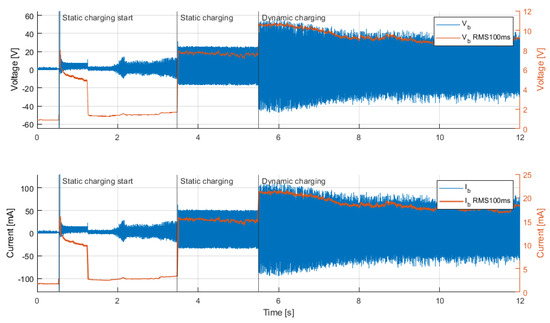
Figure 13.
Measurements of the human model connected between the bus chassis and the ground. Upper plot: Blue lines represents the unfiltered voltage Vb (left y–axis) and red (right y–axis) with a moving RMS filter of 100 ms. Lower plot: Blue lines represents the unfiltered current Ib (left y–axis) and red (right y–axis) with a moving RMS filter of 100 ms.
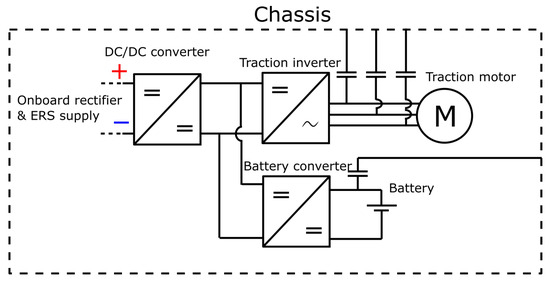
Figure 14.
An overview of the bus’s TVS that illustrates the inadvertent capacitive coupling between the output of the onboard converters and the bus’s chassis.
In Figure 13, between 0.5 s and 3.5 s, the onboard charger starts its sequence to initiate static charging from the ERS demonstrator. After 3.5 s, the bus draws 38 kW of power from the electric road statically, and the RMS of Vb and Ib reaches values of 7.7 V and 15.6 mA, respectively. As dynamic charging starts at 5.5 s, the traction inverter starts to draw power from the ERS, and the current through the capacitive coupling between the output of the traction inverter and bus’s chassis, see Figure 14, increases the RMS of Vb to 10.6 V and of Ib to 21.2 mA in Figure 13.
The presented measurements show that the BEVs that charge from an ERS must account for this parasitic capacitance in their onboard converters. Despite the observed touch current values exceeding the recommendations specified by relevant standards [18,20], these findings do not implicate an inherent fault in the presented ERS technology. Two primary factors account for this discrepancy. Firstly, the particular electric bus that was used for the measurements lacked complete double isolation between the TVS and chassis, a feature now considered standard in modern BEVs. Single isolation elevates the risk of isolation faults and the occurrence of parasitic capacitance. Secondly, the electric bus does not have a fully functioning isolation fault monitoring system that is adapted for the presented conductive ERS technology. Finally, it is probable that mitigating the touch current issues associated with this phenomenon could be achieved through measures such as (I) using an isolated DC/DC converter or (II) minimizing the parasitic capacitances during the vehicle’s design phase.
4. Discussion
Electrifying road transport demands strategic choices, where ERS emerges as a transformative solution, mitigating both infrastructure demands and environmental footprint. The showcased ERS demonstrator, along with its corresponding installation, commissioning, and comprehensive testing within the Evolution Road project, not only validates and establishes the viability of the presented conductive ERS technology but also confirms the feasibility of the overall concept of ERS. This paper explores various aspects and presents tests essential for the widespread deployment of ERS, including electric power transfer, efficiency evaluation, electrical and mechanical safety, acoustic emissions, EMC, and environmental considerations.
The electric power transfer tests showed the presented ERS technology’s capability of supplying power to two vehicles simultaneously and showcasing its suitability for highway implementation by using a trailer equipped with a resistive load. While the drawn power was constrained to 280 kW, the limitations were not attributed to the design of the ERS demonstrator but rather to the transformer in the rectifier station. Also, power levels exceeding 300 kW are only considered for HDTs, whereas passenger cars are expected to draw power in the range of 50 kW. Given the aforementioned distribution between passenger cars and HDTs, these expected power levels pose no threat to an ERS’s power capabilities. These results reinforce the ERS technology’s adaptability and scalability for various vehicle types and power requirements with no implications.
The ERS demonstrator’s performance in terms of efficiency further showcases the potential of this ERS technology for wide deployment. An efficiency of over 97% at power levels of over 150 kW during dynamic charging between rectifier station and onboard DC/DC converter in the vehicle, see Figure 11 interface C–E, is a noteworthy achievement. Although these results are impressive, the efficiency performance of the presented technology under high-speed conditions, involving more challenging contact scenarios on rough terrain with dirt, leaves, and snow, is hitherto unknown. At higher speeds, it is anticipated that the pick-up may introduce risks in terms of reliable functionality due to poor contact performance. However, the pick-up design is still in its early stages, and preliminary designs and tests have indicated substantial potential for improvement.
Ensuring electrical safety is paramount for conductive ERSs. This paper presents the critical concern of touch current related to the vehicle’s chassis during charging. Touch current measurements, conducted with a human model connected to an electric bus’s chassis drawing power from the ERS demonstrator, revealed inadvertent capacitive coupling issues. The voltage and current through the human model were assessed during charging, highlighting the impact of parasitic capacitance between the output of the onboard converters in the bus TVS and the bus’s chassis.
Despite touch current values exceeding recommended standards, it was clarified that this does not inherently condemn ERS technology. Limitations in the tested electric bus, lacking complete double isolation between the TVS and chassis, and the absence of a fully functioning isolation fault monitoring system contribute to the observed touch current values. Mitigation strategies, such as employing an isolated DC/DC converter or minimizing the parasitic capacitances between the output of the onboard converters and chassis during vehicle design, are proposed to address touch current concerns effectively.
Although the suggested solutions will be the subject of further work and their effectiveness is unknown, their impact and cost on vehicle design is expected to be minor. While the phenomenon of capacitive coupling between the output of the onboard converters and chassis is a novel consideration for conductive ERS safety, capacitive coupling between the chassis and TVS is a well-known phenomenon, as it is considered in various standards [23]. Given the automotive industry’s existing familiarity with and management of such issues, the incorporation of these mitigating strategies is not anticipated to yield significant implications for overall vehicle design and cost.
Despite the promising potential of ERS as a charging infrastructure, three significant challenges remain unresolved: Firstly, for widespread deployment of ERSs, it is imperative to establish common regulations and standardization on an international scale, ensuring the implementation of compatible systems that facilitate international transport. The second challenge concerns financing and business models during both deployment and operation. The responsibility for conducting and financing the deployment and operation of ERS remains uncertain, whether it should be undertaken by governments, companies, or private vehicle owners. Thirdly, in connection with operational concerns, the matter of maintenance and its associated costs remains unknown.
Throughout the year, the demonstrator has remained active and operational, enduring various harsh weather conditions, but not without maintenance work. Although maintenance is expected to be required for ERSs, accurately estimating the actual maintenance needs proves challenging due to the experiences gained from the demonstrator. This difficulty arises partly from reduced traffic volumes and partly from the experimental nature of the installation. Given the absence of a fully operational conductive ERS on public roads, additional knowledge regarding maintenance and associated costs is essential.
However, as this paper focused on technical issues related to ERSs, these three challenges are beyond the scope of this paper. Nevertheless, addressing these challenges is pivotal for achieving widespread deployment of ERSs.
5. Conclusions
The Evolution Road project illuminates the transformative potential of ERS in reshaping the land transport sector. Extensive testing has revealed ERS as a solution that effectively balances charging infrastructure needs with environmental concerns. While challenges related to regulation, operation, maintenance, financing, and business models remain, the adaptability of the ERS across various vehicles highlights its viability and scalability. To ensure an environmentally sustainable future, it is imperative to advocate for the comprehensive support of all types of BEVs through ERS integration. Future endeavors involve refining efficiency, addressing touch current concerns, and advancing societal integration for widespread ERS adoption.
Author Contributions
Conceptualization, M.A. and D.W.; methodology, M.A. and D.W.; software, D.W.; validation, D.W.; formal analysis, D.W.; investigation, D.W.; resources, M.A.; data curation, D.W.; writing, D.W.; writing—review and editing, D.W. and M.A.; supervision, M.A.; project administration, D.W. and M.A.; funding acquisition, M.A. All authors have read and agreed to the published version of the manuscript.
Funding
This research and the Evolution Road project were funded by the Swedish Transport Administration.
Institutional Review Board Statement
Not applicable.
Informed Consent Statement
Not applicable.
Data Availability Statement
Data available on request due to restrictions. The data presented in this study are available on request from the corresponding author. The data are not publicly available due to nondisclosure agreements within the Evolution Road project.
Acknowledgments
The authors express gratitude for the assistance and direction provided by various project members, notably Anna Wilkens at Innovation Skåne for her involvement and contribution to the first draft and outline of this paper. Special acknowledgment is extended to Johan Gran from the Department of Biomedical Engineering, LTH, Faculty of Engineering at Lund University for his valuable feedback on the EMC results.
Conflicts of Interest
The authors declare no conflicts of interest.
References
- IEA—International Energy Agency. “Global EV Outlook 2023”. Available online: https://www.iea.org/reports/global-ev-outlook-2023 (accessed on 1 February 2024).
- KIA. Available online: https://www.kia.com/ (accessed on 1 February 2024).
- NIO. Available online: https://www.nio.com/ (accessed on 1 February 2024).
- Márquez-Fernández, F.J.; Bischoff, J.; Domingues-Olavarría, G.; Alaküla, M. Assessment of future EV charging infrastructure scenarios for long-distance transport in Sweden. IEEE Trans. Transp. Electrif. 2021, 8, 615–626. [Google Scholar] [CrossRef]
- Electreon Website. Available online: https://www.electreon.com/ (accessed on 1 February 2024).
- Boltze, M. eHighway—An Infrastructure for Sustainable Road Freight Transport. In Proceedings of the CIGOS 2019, Innovation for Sustainable Infrastructure; Springer: Singapore, 2020; pp. 35–44. [Google Scholar]
- Tajima, T. Study of 450-kW Conductive ERS at 150km/h. In Proceedings of the 3rd Electric Road Systems Conference, Frankfurt am Main, Germany, 7–8 May 2019; pp. 1–7. [Google Scholar]
- Veyrunes, P.; Duprat, P.; Hourtane, J.L. Ground-level feeding systems from rail to road. In Proceedings of the 2017 IEEE Transportation Electrification Conference and Expo, Asia-Pacific (ITEC Asia-Pacific), Harbin, China, 7–10 August 2017; pp. 1–4. [Google Scholar] [CrossRef]
- Elways AB Website. Available online: http://elways.se/ (accessed on 1 February 2024).
- Elonroad AB Website. Available online: http://elonroad.com/ (accessed on 1 February 2024).
- The Swedish Transport Agency. Available online: https://www.transportstyrelsen.se/sv/vagtrafik/statistik/Fordonsstatistik/ (accessed on 1 February 2024). (In Swedish).
- Rogstadius, J. Interaction Effects between Battery Electric Trucks, Electric Road Systems and Static Charging Infrastructure; Technical Report; RISE Research Institutes of Sweden AB: Gothenburg, Sweden, 2022; Available online: http://www.diva-portal.org/smash/get/diva2:1712747/FULLTEXT03.pdf (accessed on 1 February 2024). (In Swedish)
- Statista. Available online: https://www.statista.com/statistics/1290491/carbon-intensity-power-sector-sweden/ (accessed on 1 February 2024).
- MIT Climate Portal. Available online: https://climate.mit.edu/ask-mit/how-much-co2-emitted-manufacturing-batteries (accessed on 1 February 2024).
- The Evolution Road Project Website. Available online: https://www.evolutionroad.se/en/ (accessed on 1 February 2024).
- Abrahamsson, P. Thermal Management of Conductive Electric Road Systems. Ph.D. Thesis, Division of Industrial Electrical Engineering and Automation, Lund University, Lund, Sweden, 2020. [Google Scholar]
- Wenander, D.; Abrahamsson, P.; Márquez-Fernández, F.J.; Alaküla, M. Measuring electric properties of a conductive electric road. In Proceedings of the 2021 AEIT International Conference on Electrical and Electronic Technologies for Automotive (AEIT AUTOMOTIVE), Torino, Italy, 17–19 November 2021; pp. 1–6. [Google Scholar] [CrossRef]
- IEC 60990; Methods of Measurement of Touch Current and Protective Conductor Current. IEC: Geneva, Switzerland, 2016.
- Picotech Website. Available online: https://www.picotech.com/download/datasheets/picoscope-4444-data-sheet.pdf (accessed on 1 February 2024).
- IEC 60479; Effects of Current on Human Beings and Livestock. IEC: Geneva, Switzerland, 2018.
- Regulation No 244 51 of the Economic Commission for Europe of the United Nations (ECE-R51). Available online: https://eur-lex.europa.eu/legal-content/EN/TXT/PDF/?uri=CELEX:42018X0798&rid=8#:~:text=This%20Regulation%20contains%20provisions%20on,normal%20driving%20in%20urban%20traffic (accessed on 1 February 2024).
- Wenander, D.; Márquez-Fernández, F.J.; Alaküla, M. Modelling Electric Transients in a Conductive Electric Road System. In Proceedings of the 2023 AEIT International Annual Conference (AEIT), Rome, Italy, 5–7 October 2023; pp. 1–6. [Google Scholar] [CrossRef]
- ISO 6469-3:2021; Electrically Propelled Road Vehicles—Safety Specifications—Part 3: Electrical Safety. ISO: Geneva, Switzerland, 2021.
Disclaimer/Publisher’s Note: The statements, opinions and data contained in all publications are solely those of the individual author(s) and contributor(s) and not of MDPI and/or the editor(s). MDPI and/or the editor(s) disclaim responsibility for any injury to people or property resulting from any ideas, methods, instructions or products referred to in the content. |
© 2024 by the authors. Licensee MDPI, Basel, Switzerland. This article is an open access article distributed under the terms and conditions of the Creative Commons Attribution (CC BY) license (https://creativecommons.org/licenses/by/4.0/).