1. Introduction
Environmental and legislational demands associated with the reduction of greenhouse gases (GHG) is encouraging the automotive industry to move from internal combustion engine (ICE) propulsion to zero tailpipe emission (ZTE) systems. Battery electric and hydrogen fuel cell (FC) technologies have been recognized as having the most potential for automotive ZTE systems [
1,
2,
3]. The remaining challenges preventing wider commercial adoption of battery electric vehicles (BEVs) include the insufficient range, dependency on charging infrastructure, overall vehicle efficiency, limited raw materials and recycling. Additionally, fuel cell electric vehicle (FCEV) challenges include hydrogen fueling infrastructures, vehicle cost and vehicle design to reduce risks associated with accidents.
The current solutions for extending the range of BEVs include increasing battery size and hybridizing other propulsions to the BEV, such as range extending electric vehicles (REEVs) based on petrol engine (PHEV) or fuel cell systems (FCEV).
The aim of this paper is twofold. First, to review the current challenges and opportunities associated with ZTE, and second, to exploit the review to justify the design of a novel demountable intelligent hydrogen fuel cell range extender for BEVs.
The remainder of this paper is organized as follows.
Section 2 reviews the environmental and political background of the low carbon vehicles (LCVs) with a focus on ZTE vehicle technologies.
Section 3 and
Section 4 will discuss the current status of BEVs and FCEVs to demonstrate their advantages over internal combustion engine vehicles (ICEVs) and other alternative technologies.
Section 5 will introduce the intelligent demountable hybridization method between the BEV and hydrogen fuel cell technology for passenger vehicles to maximize the advantages of both BEVs and FCEVs and minimize current challenges of the two technologies and bridge the gaps of speeding replacements in ICEVs. Based on the challenges of current BEVs and FCEVs, the paper will discuss the potential of the intelligent demountable hydrogen fuel cell range extender for BEVs to solve the problems, improve the efficiency and reduce costs for BEV.
2. Changes in the Vehicle Fleet
From the beginning of the 21st century, an increasing number of countries and regions have regarded the challenges of road transport air pollution and energy shortages as strategic issues. In order to deal with these issues, a number of countries have put in place policies supported by appropriate legislation. For example, within the EU, the current regulatory requirement for a fleet average GHG emission of all new vehicles is 95 g CO
2 per kilometer by 2021, which is a decrease by more than 40% compared to the 2007 target [
2]. Further, some countries with leading technology and markets in the automotive technology have introduced policies that pledge to remove ICEVs from the vehicle fleet, see
Table 1.
Aside from policy and legalization, national governments from key regions of the world economy and those contributing significant GHG emissions have incentivized the purchase of cleaner vehicles and the charging infrastructures. For example, the US, EU, Japan and China have introduced grants for the purchase of LCVs, including BEVs and FCEVs [
5,
6,
7,
8,
9].
Technical Roadmaps and Industrial Revolution
Environmental issues and policy are driving a technological revolution in the automotive industry. In the long-term, current ICEVs will be replaced by LCVs, especially those that are ZTE capable. Technology roadmaps have been published by countries around the world to consolidate the role that policy and technology play in the development of the automotive electrification revolution. The majority of these roadmaps (including those from the European Road Transport Research Advisory Council (ERTRAC), the Advance Propulsion Centre UK Ltd. (APCUK) and China’s Society of Automotive Engineers (SAE) regard BEVs and FCEVs as future market solutions, which are ZTE vehicles with zero GHG emissions in the Tank-to-Wheel (TTW) stage [
1,
3,
10]. These roadmaps show that the full commercialization of BEVs and FCEVs is decades away. The roadmaps link limitations of technology, infrastructure and associated business models with policy instruments in delivering a product that is competitive to replace ICEVs. Currently, BEVs’ main limitations are vehicle range (with the consideration of the cost, efficiency and battery energy density), infrastructure and raw material availability. For FCEVs, significant challenges include hydrogen production, distribution and cost [
1,
3].
3. Current Status of Battery Electric Vehicles (BEVs)
BEVs are recognized as a potential ZTE automotive solution in the future, which exhibits high powertrain energy efficiency and low running costs compared to other LCV technologies such as hydrogen fuel cell and petrol hybrid vehicles [
11]. However, current BEV limitations include range, cost/efficiency with the consideration on the vehicle sizing as well as the dependency on the charging infrastructure. The following subsections review the current status of BEVs to justify their advantages and limitations in terms of technical and associated business perspectives.
3.1. Range Limitation
The most significant challenge of current BEVs is their limited range compared to ICEV average levels, as shown in
Table 2 based on the New European Driving Cycle (NEDC) and real world range.
The range setting of BEVs should consider the average driving distance, household vehicle ownership and the percentage of household vehicles used for long-distance journeys. The average daily driving distance in European countries is from 25 miles (UK) to 50 miles (Poland) [
17]. In addition, only 19% of vehicles are used frequently to take long-distance trips, but as many as 81% of cars are used for long distance trips. This means that most of the cars will do long distance trips but infrequently [
18]. This is supported by current travel mode behaviors where more than 60% of people prefer to travel by road vehicles for long-distance journeys (over 250 miles). The survey also indicates that only 35% of the families have more than one car to meet the demands of all ranges of their trips [
19]. The conflict between travel demand and daily use cannot be settled with the same electric vehicle (EV). As a result, the range demand of the BEV cannot be ignored. Since the battery pack is the only energy storage device (ESD) of a BEV, the method used to increase the range is to increase the battery size and improve battery performance. Designing large battery packs to fulfil BEVs’ long distances trip requirements will lead to a higher than necessary use of resources and associated cost for most journeys. It is not efficient to oversize all BEVs to provide equivalent ranges to ICEVs.
3.2. Battery Characteristics
Battery performance is one of the most significant features of the BEV;
Table 3 presents five alternative battery technologies. Lead acid batteries, nickel batteries and lithium batteries are current commercial solutions. Metal-air batteries and sodium-sulphur batteries are potential candidates for use in future EVs [
20,
21,
22,
23,
24,
25].
The main factors to evaluate battery performance include specific energy (Wh/kg), energy density (Wh/L) and specific power (W/kg). In the automotive industry, the consideration of ESD also contains life cycle, energy efficiency and production cost. The Ni-MH and Li-ion batteries are widely used in electric vehicles (including BEVs and hybrid vehicles) due to their higher performance compared to other types. The Ni-MH battery is mostly used in hybrid electric vehicles (HEVs) such as the Toyota Prius HEV. Li-ion batteries are widely used as the primary ESD in pure BEVs, such as the Nissan Leaf and VW e-Golf [
11]. Li-ion batteries are currently offering the best compromise in terms of energy density, lifecycle and cost. This has led to a widespread adoption which has driven its cost down, strengthening its market dominance for the present and the short-term future. However, compared to ICE and FC propulsion, the performance of Li-ion batteries is limited.
Table 4 presents a performance comparison of ICE, FC and battery; the data for BEVs includes battery management and cooling systems. The BEV’s main advantage is its higher average energy conversion efficiency compared to ICEs and FCs. The benefits of a lower power plant and auxiliary weight is negated by a much higher energy storage system weight. However, the effective energy density and specific energy/power density are not in the same order of magnitude.
The battery performance and BEV range are affected by temperature. The range of Renault ZOE BEV was found to decreases by 56 miles (32%) when temperature decreased from 15 °C to −15 °C, see
Table 5.
According to a report by the Global EV Outlook 2018, the top ten BEV sales (in thousands) by countries in 2017 are China (579), USA (198), Norway (62), Germany (54), Japan (54), UK (47), France (34), Sweden (20), Canada (16) and Netherlands (11) [
27]. Most of these countries are located in the mid-high latitudes of the Northern Hemisphere, and the temperature usually drops under 0 °C in the winter, which means the BEV range in winter is a significant issue.
As a result, increases of the stored energy in BEVs will lead to higher growth in vehicle size, and the performance of the BEV in terms of range is influenced by the temperature.
3.3. Battery Raw Material Limitation
The mass demand for BEV sales and range extension to replace current ICEVs will lead to a significant growth in raw material usage. The materials involved in battery manufacture includes manganese, nickel, lithium and cobalt. Manganese and nickel have large scale reserves, mature supply chains and only 0.4% of the global nickel demand is for battery use [
28]. They are therefore not expected to be strongly impacted by demand growth for batteries. Lithium and cobalt, which are used in lithium batteries, have a significantly greater influence on the global EV market, with batteries representing about 6% of the total demand for cobalt and 9% of the total demand for lithium in 2017 [
28].
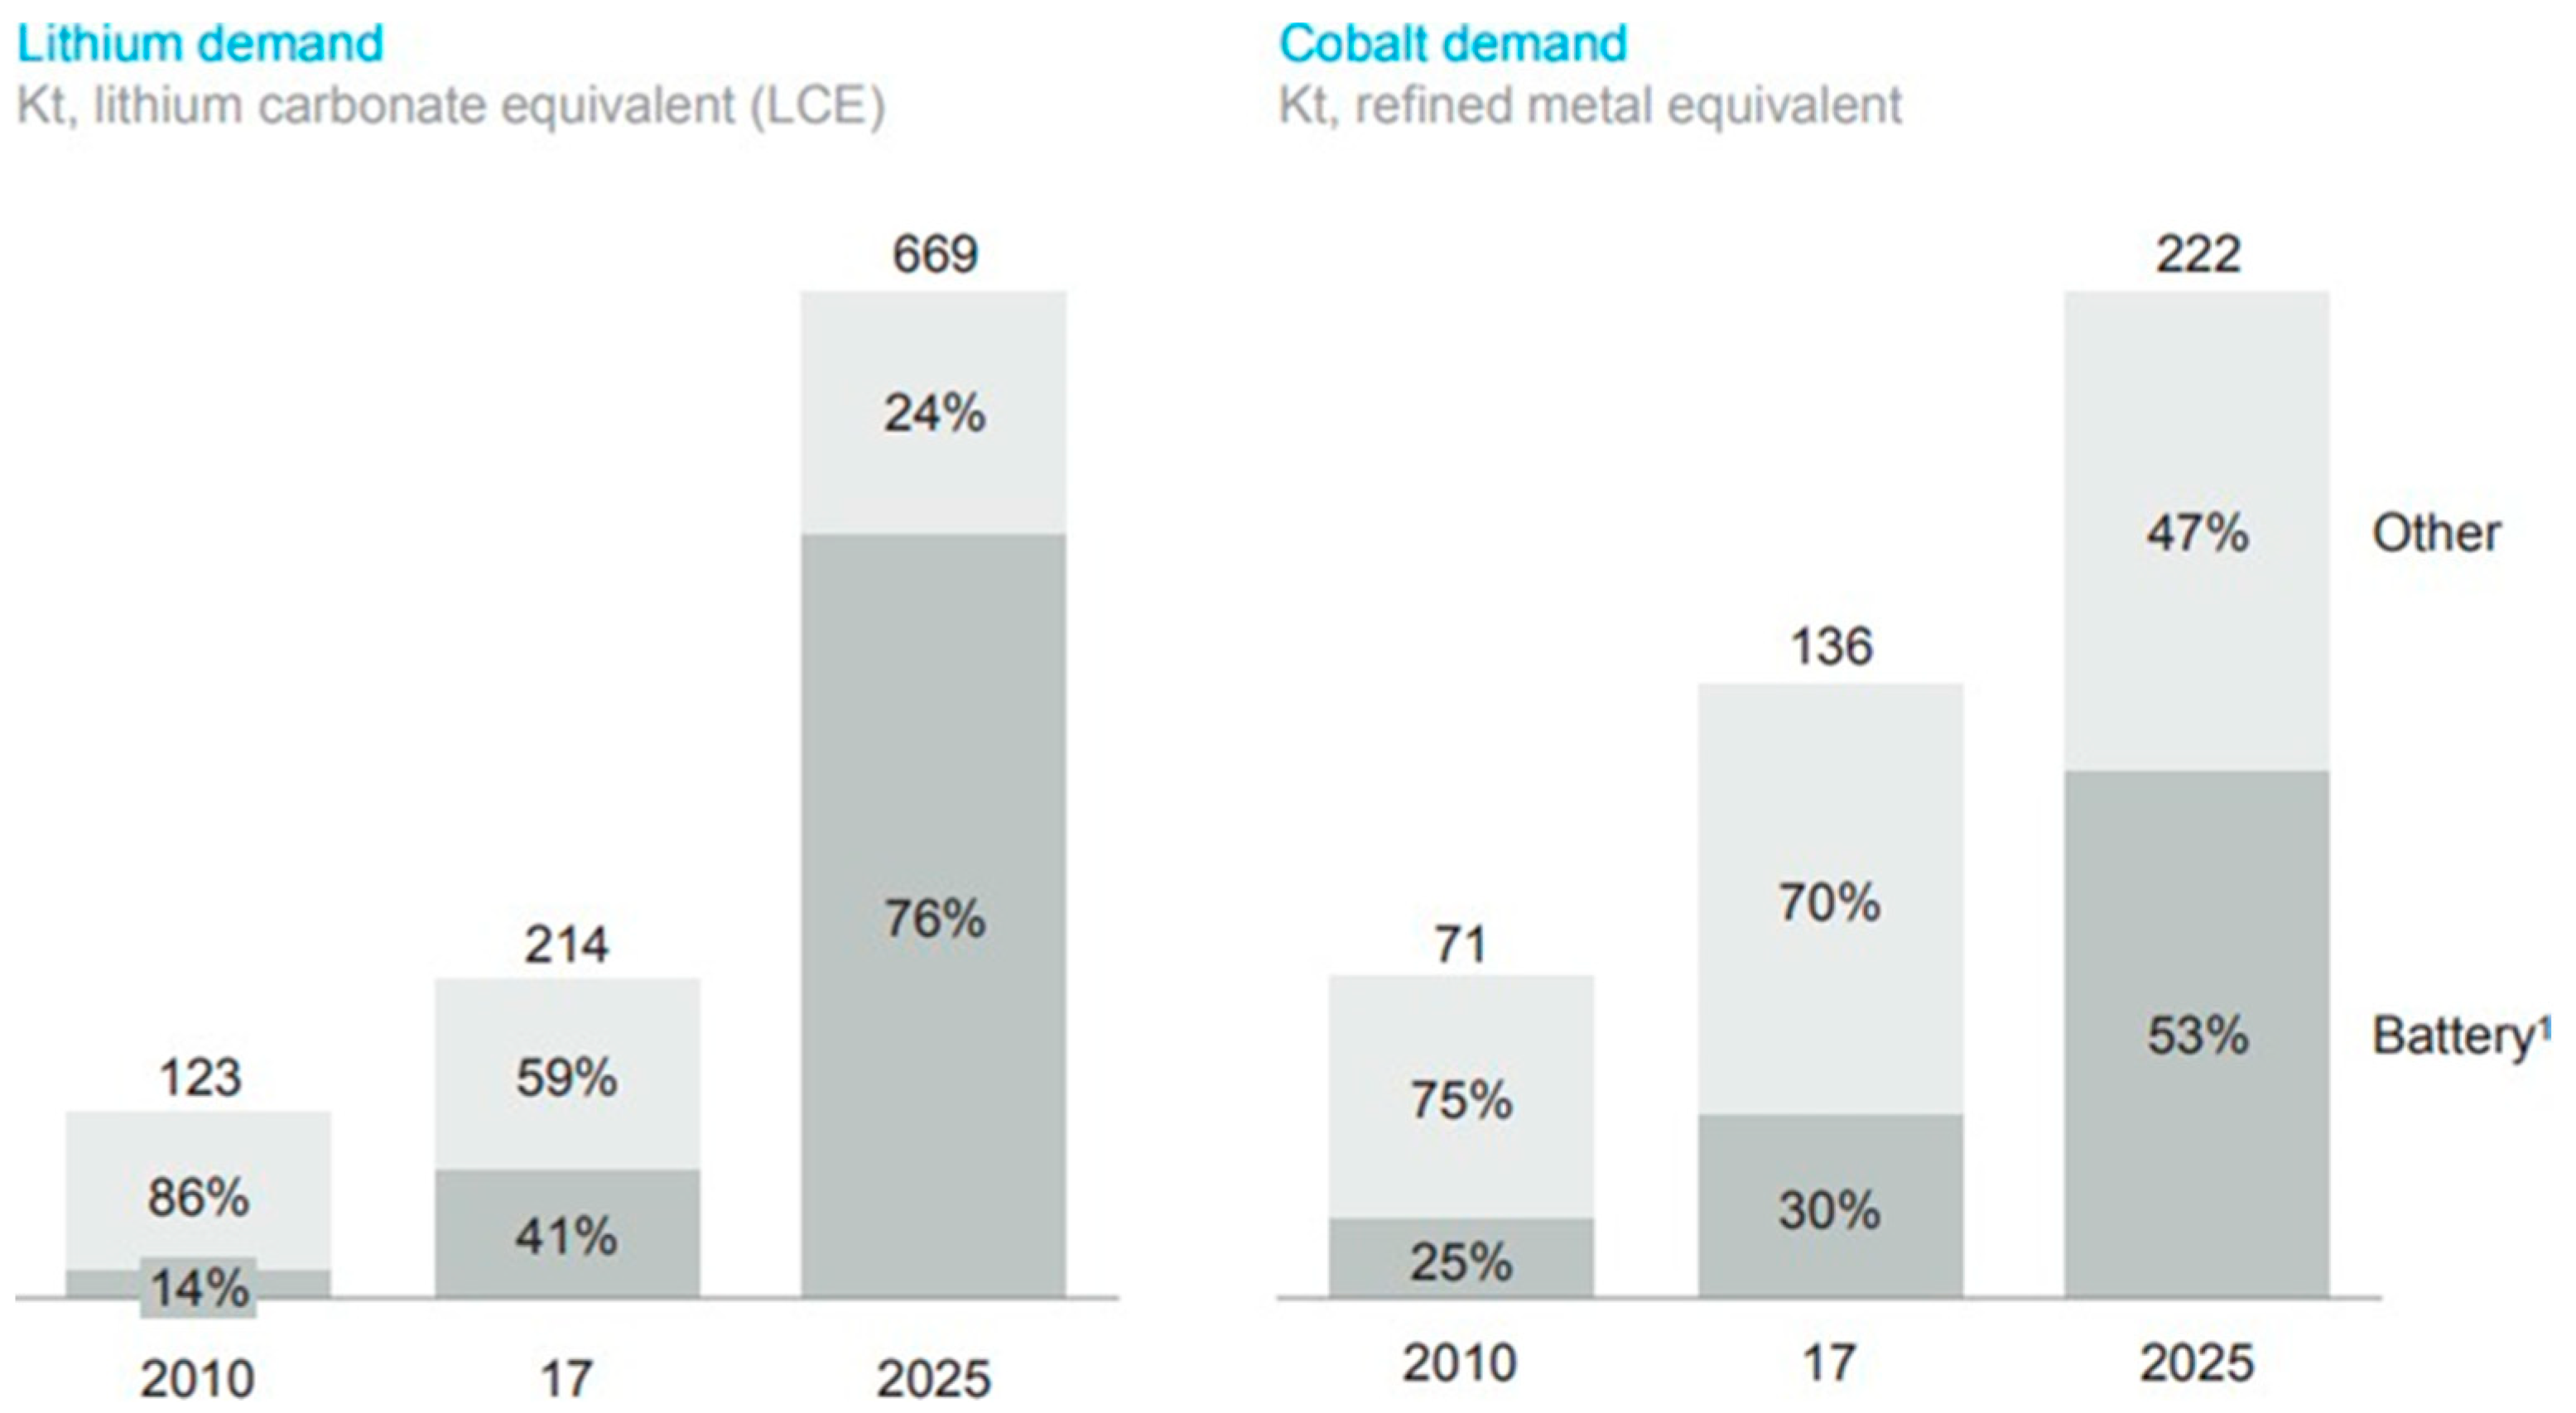
It is predicted that lithium-ion batteries will remain the market leader for the next twenty years in [
27]. Therefore, even if Li-Air or sulphur batteries overtake the lithium-ion battery in the future, raw materials such as lithium and cobalt will be essential. The availability of resources for the manufacturing of lithium-ion cells is an important topic for the continuing development of electric vehicles. Two key elements of material availability are the material market distribution and the industrial structure [
29]. According to McKinsey (
Figure 1) [
30], the battery market for lithium has almost trebled between 2010 and 2017. It is expected to represent more than three-quarters of overall production by 2025. There is a potential discrepancy between the demand and resource for the amounts of lithium required to feed the expansion of EVs. The latter is envisaged to require 1 Mt/year after 2026, whilst current resources are estimated to be between 19.2 Mt and 71.3 Mt [
31].
Despite this gap between supply and demand, some authors believe that the increased demand for Lithium should not become an obstacle in the future due to the presence of untapped reserves. However, commercially viable means to exploit oceanic lithium are yet to be developed and terrestrial stocks have limited extraction capacity. Further, restricted geographic resource distribution has geostrategic implications [
28]. In particular, the lithium supply relies on a minority of countries and companies. China, Chile and Australia occupy 85% of the global production market, and only four companies—Talison, Sociedad Química y Minera (SQM) de Chile, Albemarle, and and Livent Corp. (formerly FMC Lithium)—supply the majority of mining exports [
30].
Although lithium is widely used in EV batteries, cobalt availability is believed to be more critical due to its geographical distribution and geostrategical implications. Global Energy Metals Corp has predicted that 75% of all lithium batteries will contain cobalt by 2020 and above half of the cobalt demand will be driven by batteries [
32]. The percentage of cobalt production used for battery manufacturing has so far increased at a much slower rate. It is however expected to grow significantly, reaching more than 50% of cobalt production by 2025. The growing demand for rechargeable batteries and a low volume of cobalt production has caused the cobalt price to quadruple from 2016 to 2018 [
33]. Cobalt is mostly a by-product from mining nickel and copper. Therefore, cobalt production is not expected to be able to meet market demand. According to Macquarie Research, a global production shortfall of approximately 6.4% equivalent to 7194 t is expected in 2020 [
34].
A method to alleviate supply issues is to develop lithium-ion battery remanufacturing and recycling to form a cost-effective supply chain for the electric vehicle battery industry [
28,
35,
36,
37], as well as other modes of electric mobility. Lithium battery recycling is a long-term strategy to mitigate the magnitude of material shortages. However, less than 3% of lithium batteries are currently recycled, and less than 1% of lithium is reused in new products [
38,
39,
40]. This is firstly due to the recycling technologies lagging behind lithium battery technologies [
41]. Secondly, policy and regulations for lithium battery recycling are not adapted. Therefore, the industry is focusing more on cobalt as opposed to lithium due to its high value [
28,
41].
Battery manufacturers, raw material producers and the recycling industry are making a strenuous effort to alleviate the expected raw material crisis. The expected improvements in design, materials, manufacturing and recycling should decrease in raw material usage. Battery end users should also consider the battery capacity requirements for most common journeys; therefore reducing battery size is a possible solution for material saving. Raw material shortages could not threaten the EV market as long as battery size is not increasing continuously in an attempt to replicate ICEV range, when most journeys require significantly smaller ranges. Alternative solutions should be developed to cater for infrequent longer journeys or adapted to specific vehicles designed for longer journeys.
3.4. BEV Efficiency and Cost
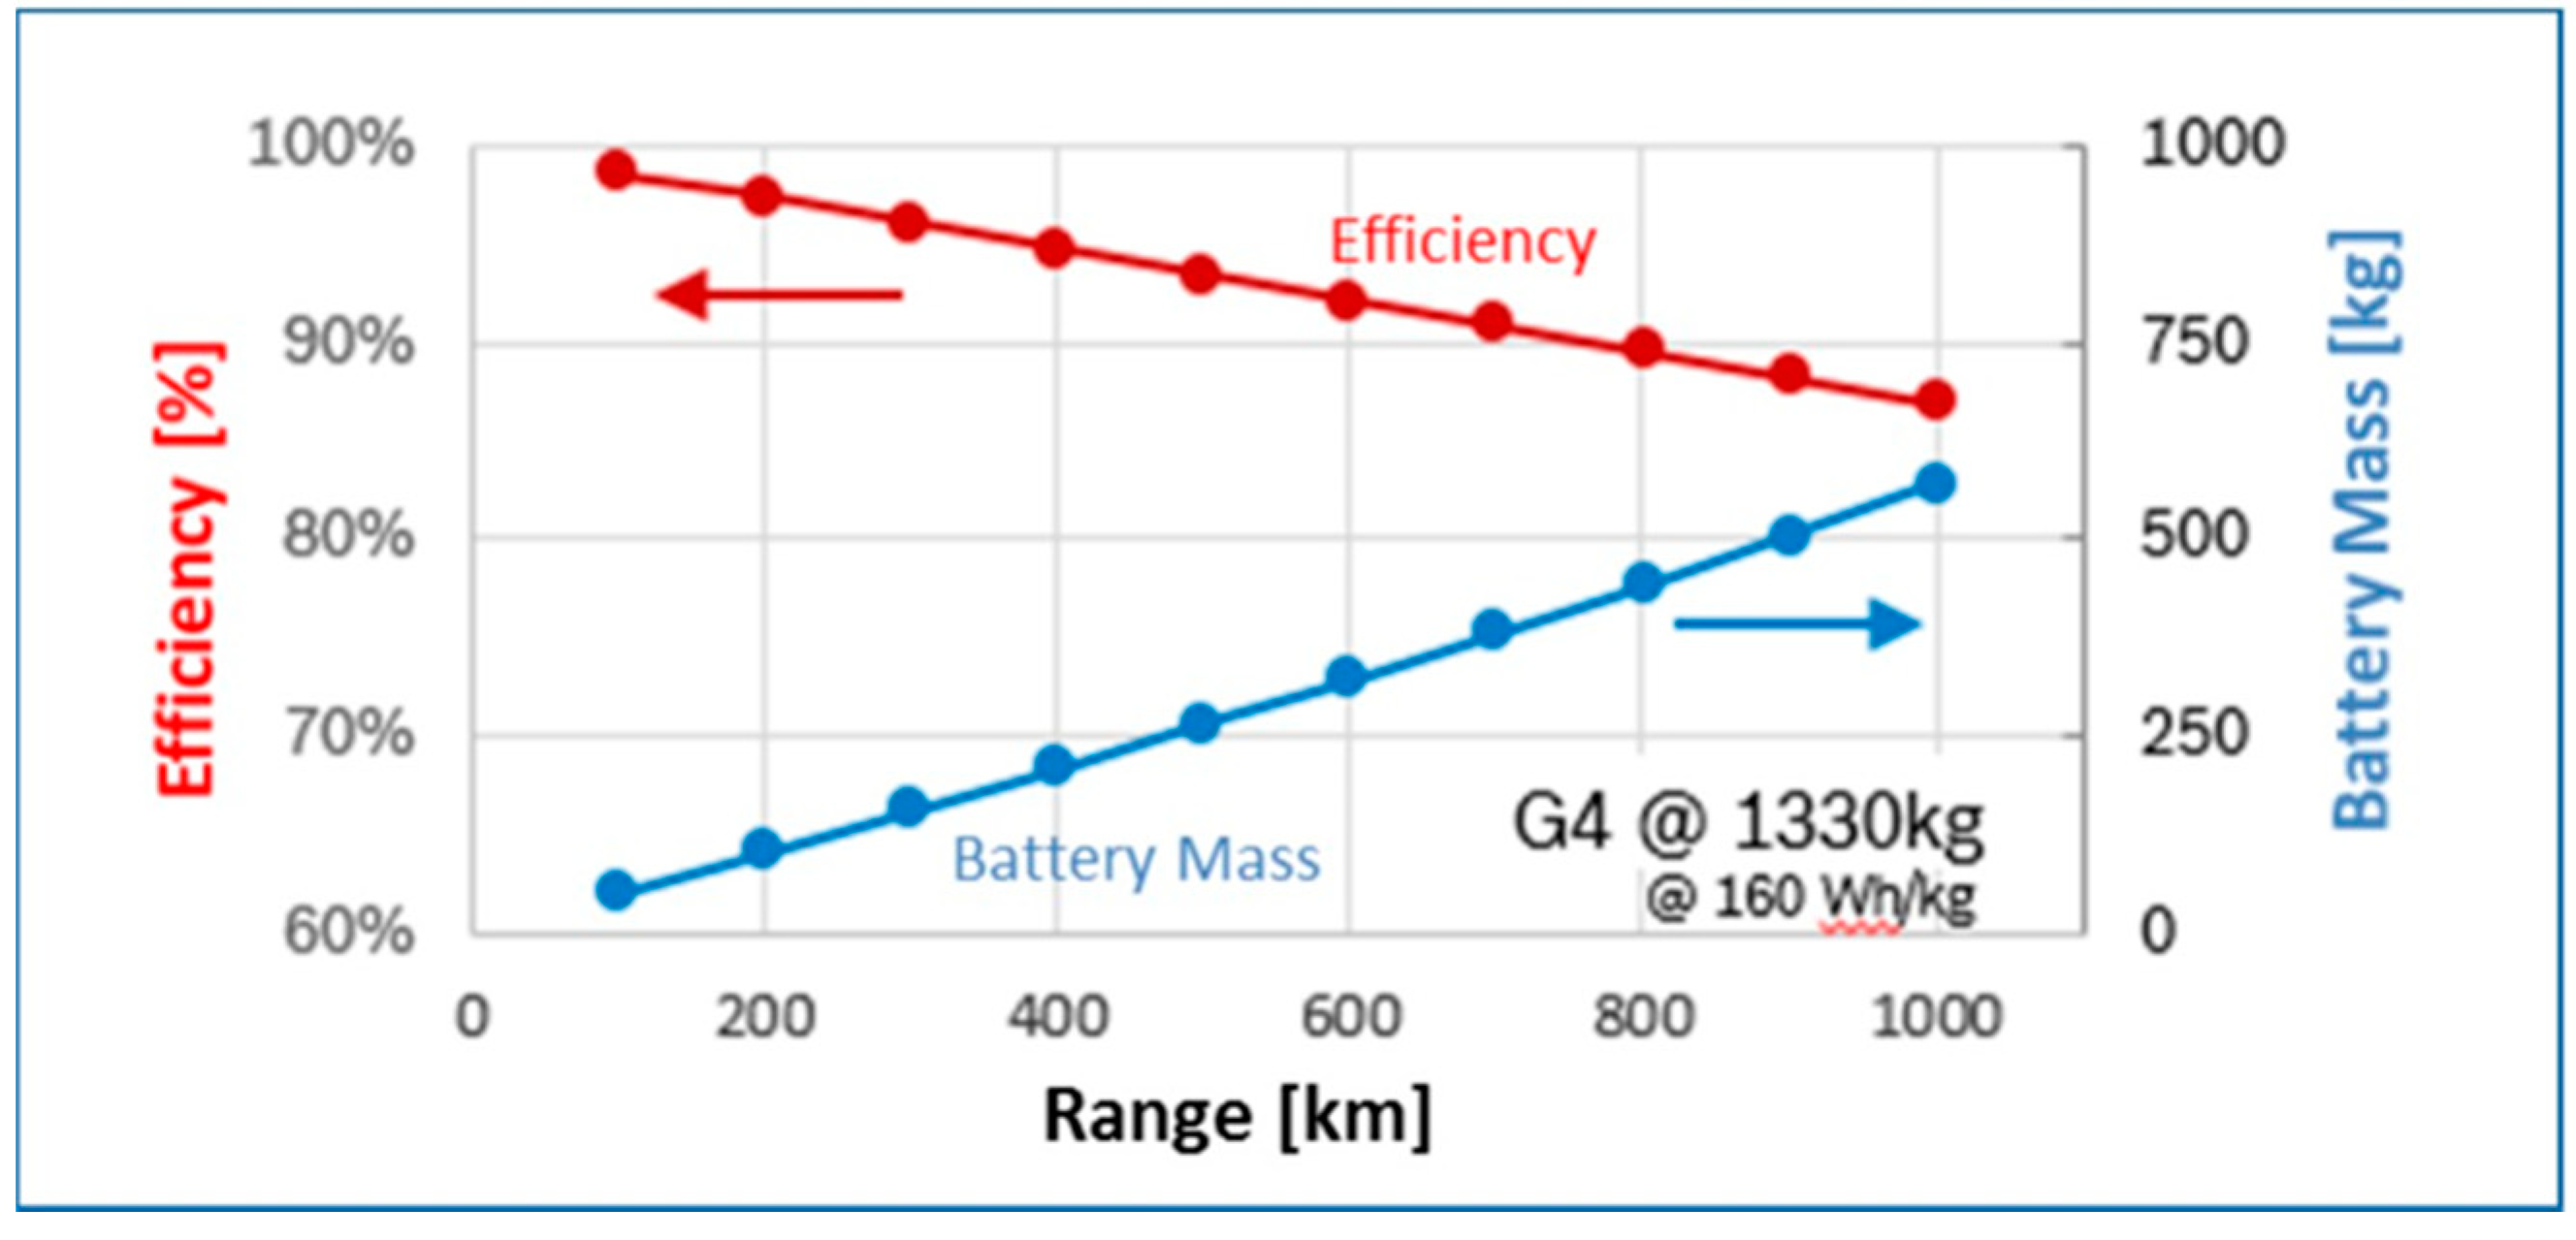
BEVs have powertrains with high energy conversion efficiencies compared to ICE vehicles. However, the current trend of oversizing batteries to increase vehicle range to become equivalent to ICEVs results in battery size and overall vehicle weight increases. This results in higher energy requirements to move the same vehicle and therefore decreases the vehicle’s overall Well-to-Wheel (WTW) energy efficiency, see
Figure 2.
Simultaneous increases in battery size and reductions in overall vehicle WTW energy efficiency and material consumption are increasing both the manufacturing and running costs of BEVs. Brennan and Barder found in 2016 that the average manufacturing cost of a mid-size BEV is £14,000 more than ICEVs, with the cost of the battery pack being one of the main costs [
42], see
Table 2.
Incentives from governments have helped balance the significant price difference between EVs and ICEVs. In addition, changes in customer behaviors and motivations and the impact of the diesel gate have resulted in increased sales. In particular, registrations of BEVs more than doubled in 2017, whilst they only increased by 7% between 2015 and 2016 [
43,
44,
45,
46,
47,
48,
49,
50]. The ICEV cost-effectiveness (high performance-price ratio) is still slightly higher than BEVs [
44]. ICEV’s cost-effectiveness is reliant on the oil price, and uncertainty associated with the latter can potentially make this highly variable.
Today, BEV prices are higher than ICEVs for an equivalent model. However, in certain conditions, such as suitable subsidies, appropriate length of ownership and refueling costs, the lifetime costs of EVs are competitive when compared to ICEVs [
51,
52]. For example, the Toyota Prius is London’s favorite private hire car, with twice as many than the second-place vehicle which is the Ford Galaxy [
53].
According to the 2017 APCUK Roadmap from British Automotive Council, future BEVs need to be ‘tailored for usage’ [
1]. This means that the range and size of BEVs should be adapted to demands and applications. This could avoid oversizing the BEV that would otherwise result in increased manufacturing and running costs and purchase prices. Appropriate vehicle and battery sizing will decrease the demand for the limited raw materials. Based on the National Travel Survey England 2018 by the Department for Transport, the average annual driving range in the UK is 6580 miles in 2017, which equals to around 25 miles per day [
19]. Hence, tailored BEVs will mostly be small- or medium-sized vehicles, and they will rely more on charging infrastructure.
3.5. BEV Infrastructure Dependency and Availability
Limited by vehicle efficiency, costs and raw materials, future BEVs require a reduction in battery size, and this will lead to a range decrease. As a result, the charging frequency will increase, and this will make BEVs depend more on charging infrastructure.
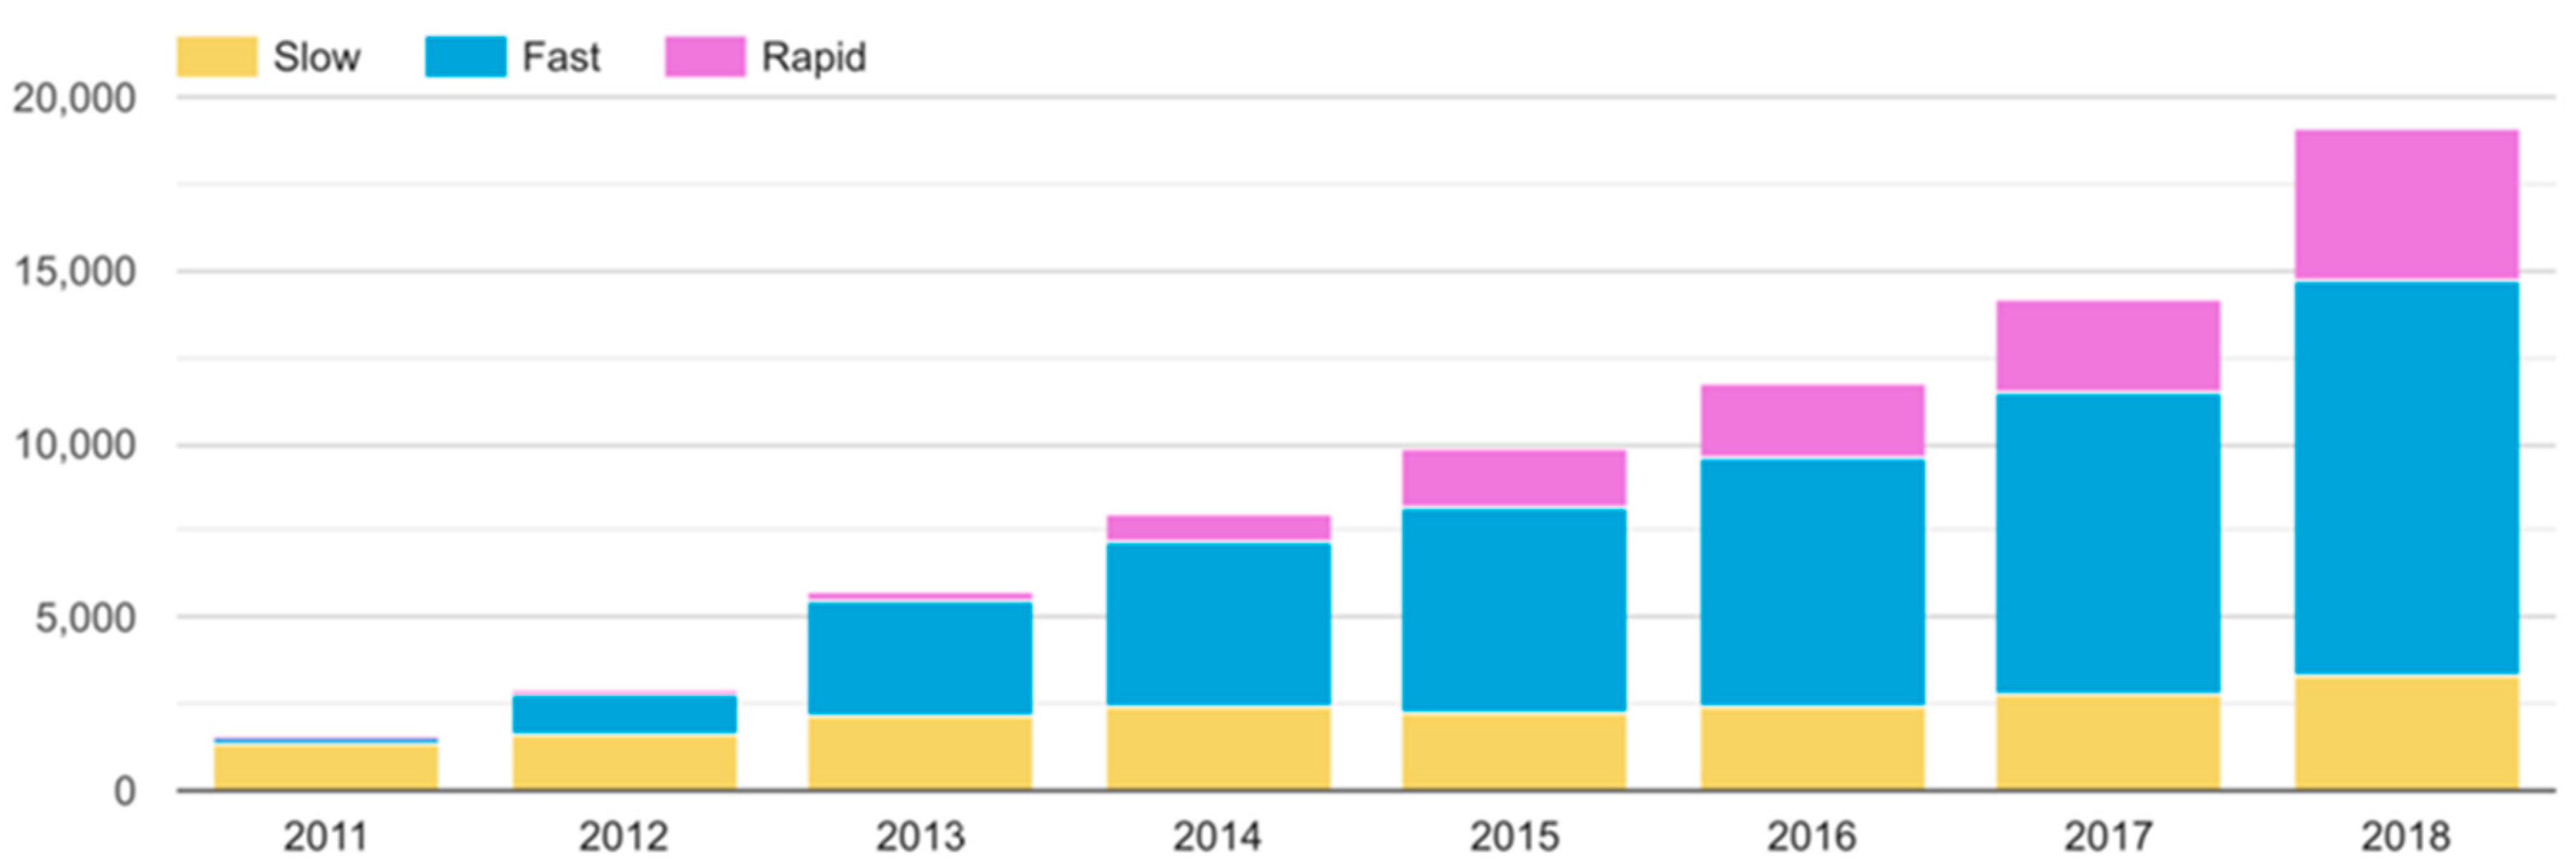
Table 2 presents the charging time using home and fast charging facilities for popular BEVs. Most current BEVs require more than five hours when using home charging, and when using public fast-charging infrastructures, the charging speed is much higher but still over 30 min, which is not comparable to the refueling speed of ICEVs and FCEVs. Thus, to fully commercialize and replace current ICEVs, the demands of BEV charging infrastructure will much higher than current petrol stations. The growth in the speed of BEV charging infrastructures has been fast in the past few years, due to increasing ownership of BEVs and governmental efforts.
Figure 3 presents the amount of total charging connector changes in the UK from 2011 to 2018.
The “slow” chargers are most 3 kW normal home chargers, “fast” chargers are more than 7 kW chargers including household and public facilities, and rapid chargers are most public specific vehicle charging points. The latest data from the UK ZAP-MAP, a UK-wide map of charging points, indicates that the total number of public points is 1481, the amount of rapid charging devices is 2162 and the total number of rapid charging connectors are 4973. There were 45 new rapid charging devices installed in the last 30 days in the UK [
54]. It seems that the growth of charging infrastructure is fast, but the total amount of public charging points is still incomparable with petrol stations. As the Department of Energy and Climate Change claimed in 2012, the distance between each petrol station in the UK is shorter than 10 min driving [
55]. Hence, charging infrastructure construction will be a long-term project which will require decades to reach the current petrol infrastructure level. The rapid growth of BEV charging infrastructure will also lead the electricity demand increases and actions are required from the National Grid System [
56].
3.6. Summary
BEVs have advantages in energy efficiency and higher environmental performance compared to ICEVs and ICE-based HEVs, and are recognized as one of the future road vehicle solutions with the most potential. In order to meet the requirements of peoples’ vehicle demands and reach the target goals to replace current ICEVs, BEVs will need to increase their range and reduce their cost. However, limited by battery performance and main raw material resources, increasing the battery amount for range extension will decrease vehicle efficiency, and lead to growth in both manufacturing and running costs. Another method to realize future BEVs as “tailored for usage” will not be easy to achieve since more than 65% of families own only one vehicle which is expected to fulfil any length of road journey demands. Moreover, the “tailored for usage” BEVs, which are mostly small/medium-sized vehicles, will depend more on infrastructure, but the amount of charging facilities will not reach the level of the current petrol stations in a short period.
Similar to BEVs, as another future vehicle solution, FCEVs have advantages compared to ICEVs and other competitive vehicles, and limitations in both technical and associated business aspects.
4. Current Status of FCEVs
Similar to BEVs, FCEVs are identified as a future option to reduce the dependence on foreign oil significantly and to lower harmful emissions that contribute to climate change. As another future solution, compared with BEVs, FCEVs has advantages such as an extended range, quicker refueling speeds and less environmental impacts, but similarly have limitations on costs and infrastructure.
4.1. Performance and Cost of the Current FCEV Fleet
FCEVs use hydrogen as the power source, where the hydrogen fuel cell supplies the appropriate voltage to the battery or the power system. There are some competing energy storage technologies for use in FCEVs.
Table 6 shows an overview of the latest situation for energy storage technologies of fuel cells. The advantages and disadvantages of various fuel cell technologies, such as electro-chemical, chemical and electric, are examined for different kinds of fuel cell vehicles.
The most popular fuel cell technologies are Direct Methanol Fuel Cells (DMFC), Proton Exchange Membrane Fuel Cells (PEMFC), Alkaline electrolyte Fuel Cells (AFC), Phosphoric Acid Fuel Cells (PAFC), Molten Carbonate Fuel Cell (MCFC) and Solid Oxide Fuel Cells (SOFC). The PEMFCs, AFCs and direct methanol have advantages such as portability and miniaturization. PAFCs and SOFCs are suitable for medium and large power generation, as well as combined heat and power. MCFCs are suitable for large scale energy generation [
25]. The technology with ideal characteristics for road vehicle applications is PEMFC. It has high overall efficiency, quick start-up, low-temperature operation, zero emission, a long lifetime, simple design, small volume, less weight and non-corrosive features [
60,
61]. However, the costs of the proton exchange membrane and the platinum catalyst are prohibitively high. Researchers and automotive manufacturers are continuing to optimize fuel cells. For example, the Toyota Mirai™ fuel stack not only reduced volume by 43% and weight by 48%, but also improved power delivery by 26% compared with the 2008 model of fuel stacks [
62]. Due to the developmental potential of fuel cell for portable applications, transportation applications and stationary applications, the fuel cell could become an environmentally-friendly, economically-competitive energy storage device for the future market [
59].
Table 7 presents the comparison of FCEVs with ICEVs, BEVs and HEVs in different perspectives.
In terms of vehicle range, the FCEV has longer a range than the BEV and a similar range in comparison to conventional vehicles, but with the development of fuel cell technology and due to the high energy density of hydrogen, it is not hard to increase range and this will not lead to oversizing and significant mass increases. For example, Toyota have targeted a 620 mile driving range with a fuel cell concept car which can offer more than 50% of the drive range of the current Toyota Mirai™ FCEV [
63].
In the customer’s view, the purchase price of FCEVs are much higher than other vehicles. This is related to the production/sales volume, since the current number of FCEVs is incomparable with other types of vehicles. The running costs of FCEVs and BEVs are currently much lower than ICEVs as taxes are not added to the hydrogen fuel and electricity for charging. However, FCEVs’ operating costs are still expected to remain lower than ICEVs, even if taxes were to be added for fuel and electricity charging.
4.2. Hydrogen and Infrastructure Limitation
The refueling speed of FCEVs is similar to ICEVs which only takes about a few minutes. The most significant problem for fuel cell vehicles is a lack of hydrogen refueling stations. In total, there were 330 stations around the world and only 15 fueling stations in the UK [
64]. John Hayes, the UK Transport Minister, said the government knows that the main obstacle to hydrogen fuel cell electric vehicles is refueling infrastructure, and a new £23 million fund has been announced by the government to boost the development of hydrogen vehicles and the required infrastructure [
65]. This move shows the ambition of the UK government to achieve zero-emissions for every new car by 2040. Following this help from government, Burgh stated that this incentive program would attract more investment and encourage further development of hydrogen-powered vehicles and infrastructure [
65].
The increase in hydrogen refueling stations is significantly increasing the demand for hydrogen. The latter requires a significant growth of hydrogen production and a vast distribution network. The remainder of this sections addresses both issues:
• Hydrogen production
Although hydrogen is abundant on earth, it cannot be obtained directly, unlike oil and gas. There are many ways to produce hydrogen. Natural gas reforming is the most common processes used to create hydrogen. Steam reforming and partial oxidation methods can produce hydrogen from methane. Low-cost natural gas reforming can provide hydrogen for FCEVs and other applications such as electric power grids [
66]. Usually, industries use the natural gas reforming method to produce hydrogen and CO
2. Due to the unwanted release of CO
2 into the air, the hydrogen resulting from this production method is called “grey hydrogen” [
67]. With a long-term view, the usage of oil and gas will be replaced by solar power and wind power to generate hydrogen. This type of hydrogen is often called “green hydrogen”. A technology called Carbon Capture and Storage can capture almost 90% of the CO
2 by-product during the industrial process, preventing most of the CO
2 from entering the atmosphere [
68]. This type of hydrogen is called “blue hydrogen”. New techniques to produce hydrogen will be implemented, such as photocatalytic water splitting and high-temperature water electrolysis by nuclear technology. Once these methods become reliable and efficient, the whole production chain will exclude the use of carbon-based energy.
• Hydrogen storage and distribution
The high-pressure gaseous hydrogen storage method is the most widely used in the world. This method is suitable for vehicles because of its light weight and low cost. Liquid hydrogen storage results in evaporation of 2–3% of hydrogen every day [
69]. Materials-based storage methods need a reduction in cost and improvements in capacity to meet future demands. Hence, for vehicular applications, compressed gas storage has two ways it can be improved to meet ongoing demand. One way is to change the composition and structure of the hydrogen that is stored in the tank, such as a combination of liquid hydrogen and cryogenic hydrogen. The other way is to improve the structure inside the tank [
69].
Hydrogen delivery problems are closely linked to hydrogen storage technology. Currently, hydrogen gas is usually stored in a high-pressure tank and delivered by trucks, gaseous tube trailers and railway. Liquid hydrogen is bulk-stored in low-temperature adiabatic tanks and delivered by planes, trucks, ships and railway. It is straightforward to deliver solid hydrogen; however, the efficiency of transportation is less than 1% due to the heavy weight [
70].
4.3. Summary
FCEV advantages include range (compared with BEVs), overall efficiency, running cost and zero tailpipe emission (compared to other ICEVs and HEVs). FCEV limitations include the limited hydrogen infrastructure and distribution network as well as a high purchase cost. FCEVs can meet the requirements of daily use and travel demand in the future. FCEVs are currently an integral part of the hydrogen economy could supplement it or be restricted by this relation. For now, the high cost of the fuel cell system, the shortage of infrastructures and the immaturity of the hydrogen economy all limit the development of FCEVs. Hence, a transition solution is required for bridging the gap between today’s and future BEVs and FCEVs. The next section proposes a solution to bridge this gap.
5. Intelligent Fuel Cell Range Extender
The previous sections have highlighted the challenges faced by BEVs and FCEVs. The gap needed to be filled to achieve full commercialization includes the limited range of BEVs (with consideration of cost, efficiency and raw material shortage), infrastructure availability and battery lifespan. FCEVs require a substantial increase in hydrogen infrastructure and a reduction in vehicle cost. To overcome these limitations, a novel demountable hybridization method for BEVs based on a demountable fuel cell range extender is introduced in this section. The conceptual framework of the intelligent fuel cell range extender is first described. Then, the intelligent FC range extender potentials will be presented in relation to the aforementioned challenges in terms of range extension, infrastructure dependency reduction, raw material saving, cost, efficiency improvement, and battery lifespan extension for BEVs as well as infrastructure utilization increases for the FC technology.
5.1. Description of Intelligent FC Range Extender
The proposed demountable intelligent fuel cell range extender aims to bridge the gap between the current ZET vehicle technology with its deficient supporting infrastructure and full BEV and FCEV commercialization with a level of infrastructure equivalent to that offered to ICEVs with current petrol stations.
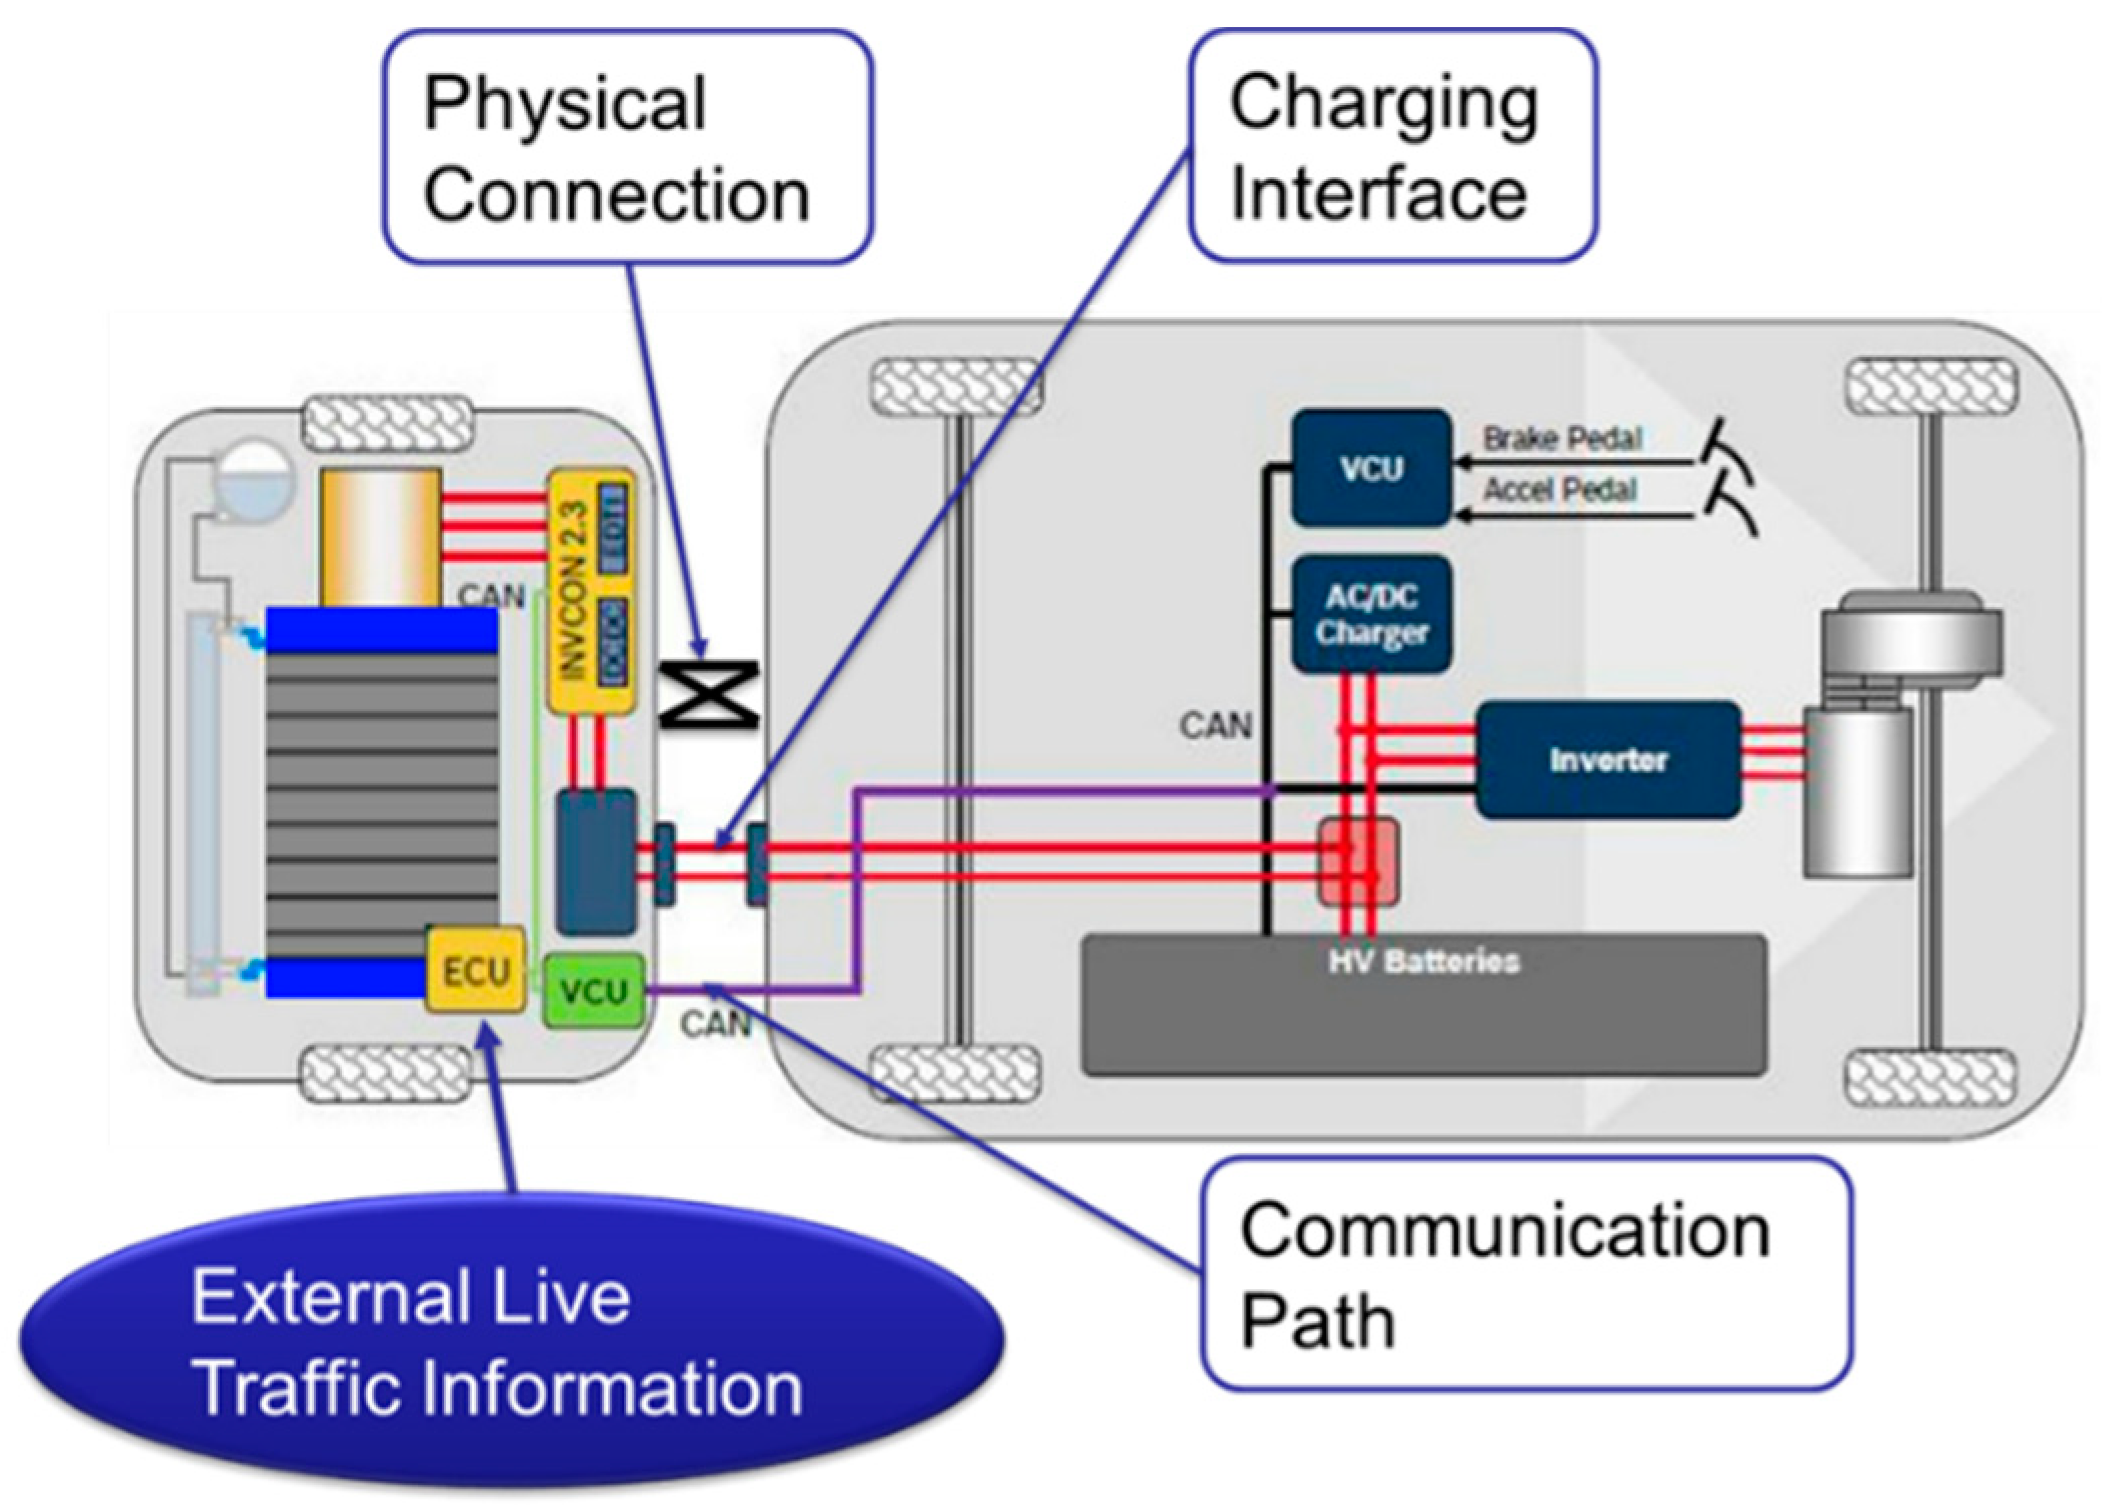
The intelligent fuel cell range extender is designed to use a demountable fuel cell system to charge the BEV in both running and parking conditions. The connection system allows the range extender to plug-in charge the vehicle with a communication bus with the vehicle control unit (VCU) of the BEV enabling appropriate load management.
Figure 4 shows the conceptual framework of this intelligent hydrogen fuel cell range extender system. This range extender contains a hydrogen tank as the energy storage, a PEMFC stack as a power generator with its control, cooling and communication systems. It has a physical connection component, charging interface and communication path to connect the range extender with the BEV.
The electronic control unit (ECU) of the range extender will refer to external traffic information (infrastructure availability, traffic flow congestions and GPS information), environmental conditions (temperature and humidity) and internal data from the BEV (SoC, battery health and route planning) to determine the most appropriate charging method to efficiently provide range extension as well as avoiding over-discharge, reducing the environmental effects and extending battery lifespan for the BEV.
Based on the system cost data from Microcab Ltd. in Coventry University, the cost of this demountable fuel cell range extender mainly comes from the 3.3 kW PEMFC system (£10,000), 1.8 kg 350 bar hydrogen tank (£6500), and a 250 kg load trailer (£200) [
71]. Thus, the total cost of this fuel cell range extender is around £16,700.
Based on the demands of current BEV market and the cost consideration on fuel cell system, the ideal marketing strategy of this demountable intelligent fuel cell range extender is ‘Rent & Drop’. This strategy can increase the utilization of fuel cell power units, which is the most expensive component compared to installing a fixed fuel cell system into a BEV. This will enable the owners to select their vehicle range based on typical usage as opposed to infrequent long-distance trips, thereby minimizing cost and maximizing usability.
5.2. Potentials of Intelligent FC Range Extender
Based on the previous review and discussion, the main challenges for current BEVs and FCEVs are range limitations, infrastructure availability, raw material shortages, limited lifecycles, cost and efficiency. The potentials of this intelligent fuel cell range extender will be discussed based on these aforementioned challenges.
5.2.1. Range Extension
The most significant challenge for current BEVs is their limited range compared to the average ICEV level. The first and most important feature of this fuel cell range extender is to enable BEVs to perform long-distance journeys. The energy density by weight of hydrogen fuel is 33.3 kWh/kg [
72]; the average efficiency of the PEMFC stack is 50.5%. The charging efficiency of the current BEV is 87%. Based on
Figure 2, the efficiency of the BEV will drop by 5% while the mass increases to 250 kg, which is the total mass of this range extender based on the combined weight of its components [
11]. Thus, the electricity provided by the range extender to the BEV is around 14 kWh per kilogram of hydrogen fuel.
Based on the vehicle parameters presented in
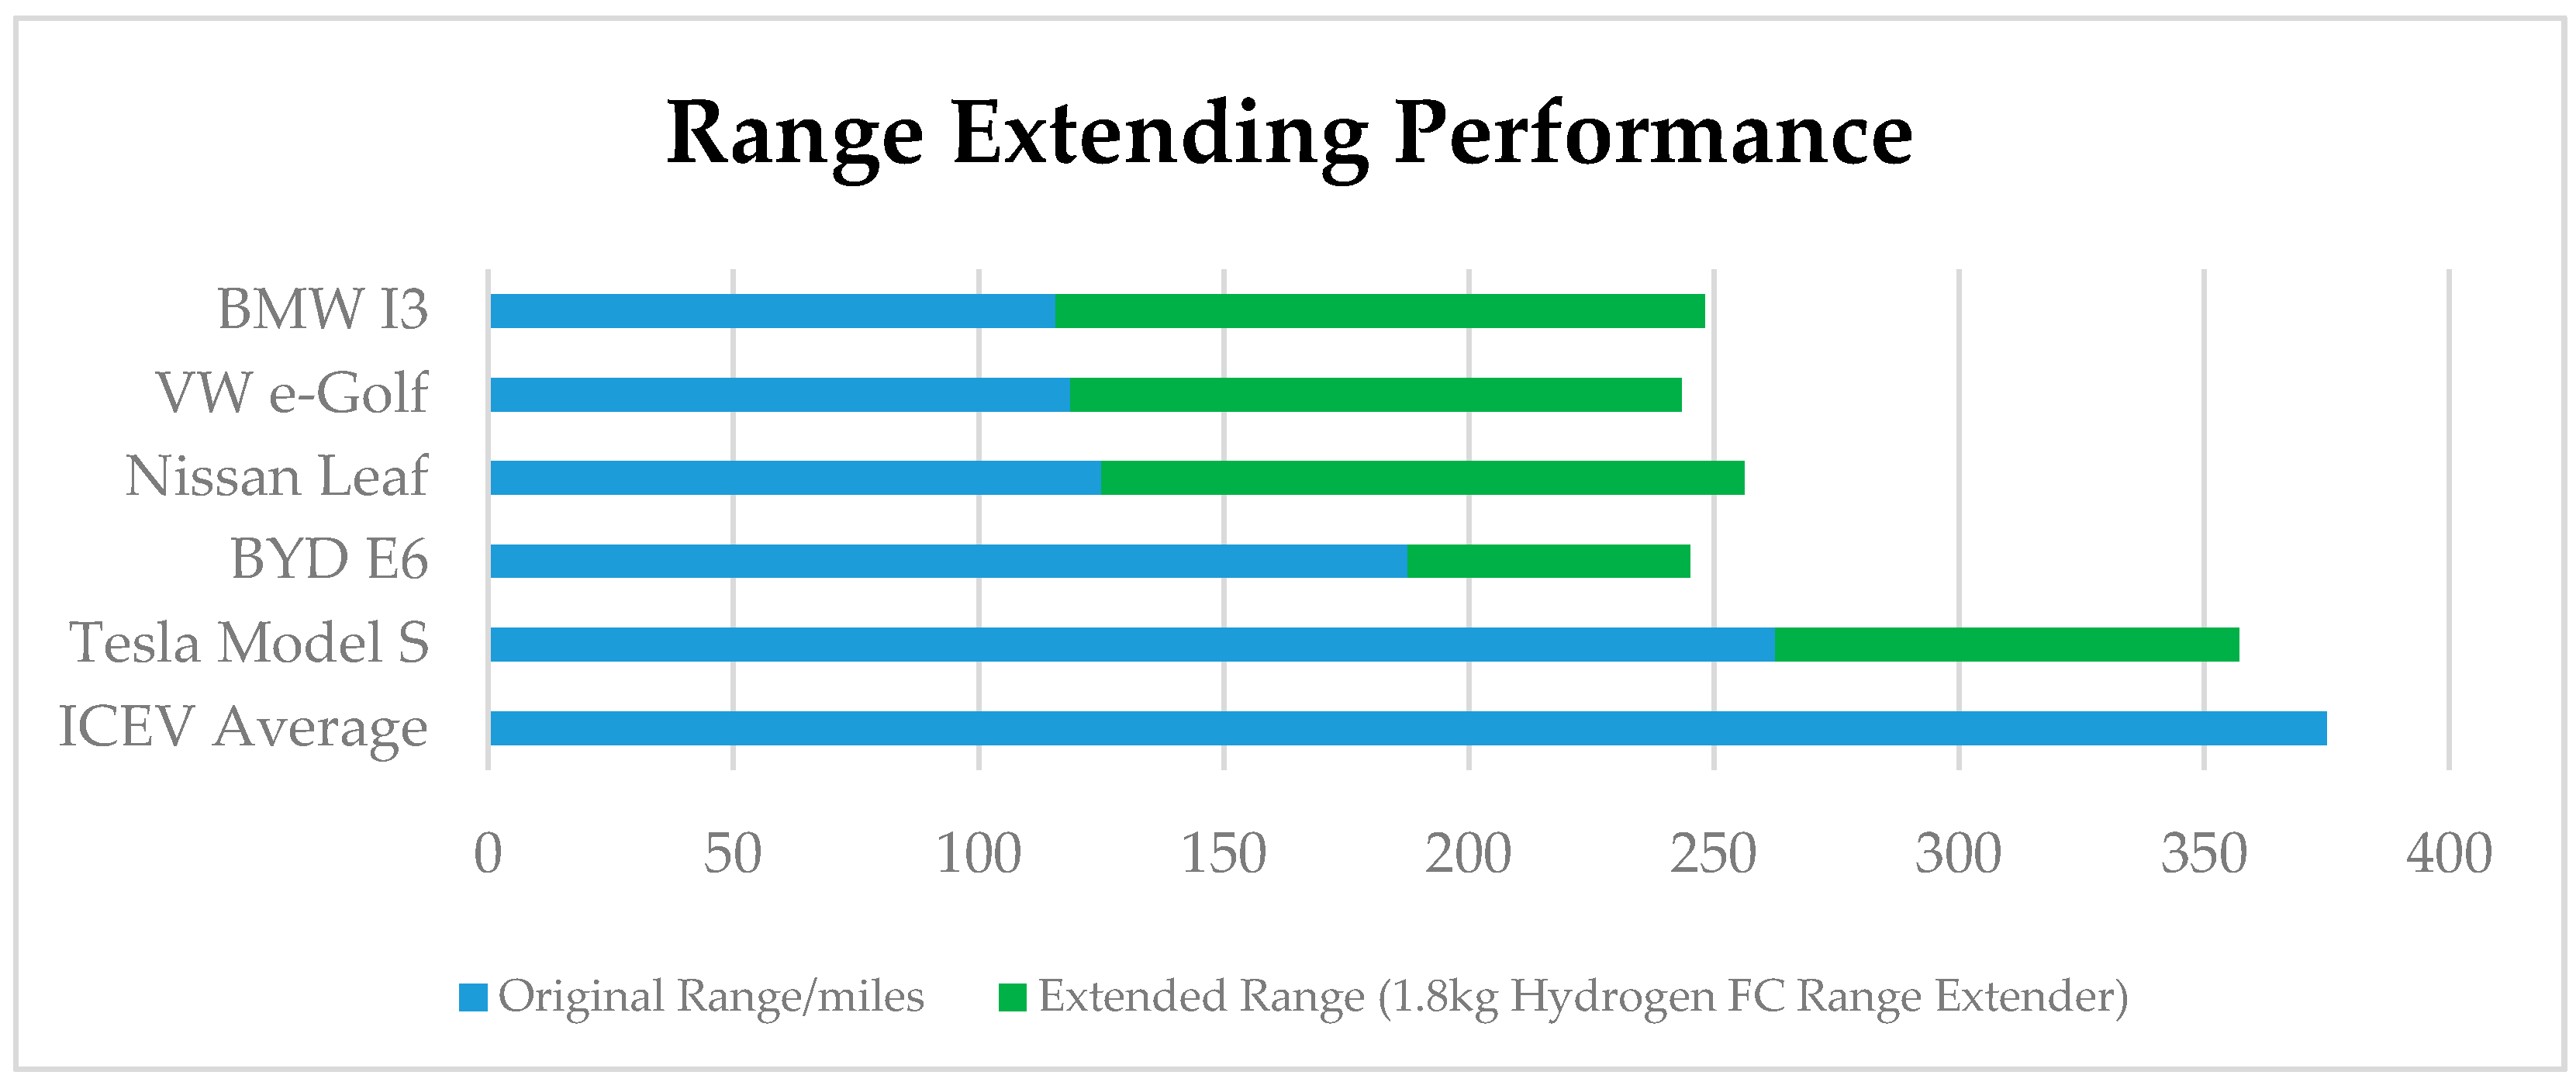
Table 8, the estimated ability of the fuel cell range extender is illustrated in
Figure 5.
As
Figure 5 shows, when the FC range extender is sized with a 1.8 kg hydrogen tank, more than 30% of the range can be extended for large BEVs and 50% for small BEVs. The average range after the extension is around 250 miles which makes BEVs suitable for many long-distance journeys.
5.2.2. Infrastructure Dependency and Utilization
The second potential of this range extender is to reduce the dependency on charging infrastructure and increase the utilization of hydrogen refueling infrastructure. The charging and refueling method for the BEV with the range extender can be flexible and fast due to the contemplated “rent & drop” marketing model.
Since the demountable design allows the BEV to “charge everywhere”, the charging time for BEVs can be saved and avoid queueing or looking for charging positions in peak travel periods, reducing the time wasted on charging.
It can produce a more flexible charging method. In the first stage, before the full commercialization of hydrogen fueling stations, users can rent and replace it quickly. In the second stage, when the number of hydrogen fueling stations are acceptable, drivers can have a fast self-refueling.
In the long-term, adding the range extender can potentially reduce the pressure on the National Grid System in terms of electricity consumption by providing an alternative to charging facilities requiring high power. The replacement of current ICEVs by BEVs has been regarded as an inevitable trend; however, the full commercialization of the BEV and its charging infrastructure will lead to an enormous impact on the National Grid System. As the annual power demand prediction from the UK National Grid, the power demand of BEVs will be around 45 TWh in 2050, representing around 10% of the power demand of the whole country. Moreover, as the number of electric vehicles increases, the peak demand for electricity is one of the challenges that needs to be met. For example, the consumer power scenario suggests that by 2050, electric vehicles will generate an additional 18 GW of demand, equivalent to an additional 30% of today’s peak demand [
56]. The National Grid Group has directed that the peak power demand issue can be alleviated by regulating electricity tariffs for different periods to encourage BEV owners to charge vehicles in the off-peak time period.
Based on the review of current hydrogen fueling stations and information from automotive roadmaps around the world, it is clear that the limited amount of the hydrogen refueling stations has significantly affected the commercialization of FCEVs. Governments around the world are planning to build the stations at much quicker pace than before. However, the full commercialization of FCEVs is still decades away [
2,
8]. This means that before FCEVs become widely used, there will be thousands of hydrogen stations under low utilization conditions and operating at a loss (compared with the utility of current petrol stations and charging stations). Given the significant average annual maintenance cost of a hydrogen station of £71,000 [
73] there will be a significant waste if the utilization of hydrogen stations is qualified in the early years before the number of FCEVs reaches the expected level. Therefore, commercializing the proposed BEVs range extender will increase the overall hydrogen economy efficiency and reduce losses for early hydrogen fueling stations. The adoption of a ‘rent & drop’ marketing model should improve the management of the distribution of the hydrogen refueling process by centralizing re-fueling to maximize the utilization of local hydrogen stations.
5.2.3. Raw Material Saving
The rapid growth of the BEV ownership will lead a shortage of raw materials, see
Section 3.4. The most important raw materials for batteries used in BEV are lithium and cobalt. However, since the automotive market is enormous and growing every year, there are concerns regarding the availability of raw materials to meet the increased demand.
The proven reserved for lithium and cobalt was estimated in 2017 to be 15.5 million tons and 7 million tons, respectively [
74]. Currently, a Tesla Model 3 car is equipped with Panasonic lithium battery using 90 g.(kW.h)
−1 of lithium and 85 g.(kW.h)
−1 of cobalt, adding up to 4.7 kg lithium and 4.5 kg cobalt [
75]. Assuming that the total number of vehicles will be two billion in 2035 and that the BEV market share will be 21% [
76], the demand for raw materials is likely to exceed production capabilities.
As a result, shortages of lithium and cobalt are expected when current ICEVs are planned to be replaced by BEVs. The intelligent fuel cell range extender could provide an alternative solution to increasing battery size to improve the BEV range. Battery sizing based on most common trip will reduce battery size, decreasing the usage of raw materials.
5.2.4. Cost and Efficiency Improvement
Based on the findings described in
Section 3.1, designing BEVs to have similar ranges to ICEVs would require a large battery pack which will lead to significant increases in the purchasing and running costs due to the limited performance and price of current batteries. The use of most vehicles to perform some long-distance travel means that there is currently a need to cater for these occasional long-distance trips. Increasing the vehicle battery size being the most inefficient manner to address this issue, manufacturers are investigating the most appropriate range to design their batteries. Some researchers believe that the range extended electric vehicle (REEV) which reduce (or balance) the size of battery pack and fuel cell system can minimize the cost and reach the demand of vehicle range [
77,
78,
79]. Compared with this REEV solution, the demountable design provides the most significant advantages of this demountable intelligent range extender including the fixed-cost reduction and centralization refueling. The demountable design provides a more flexible and cost-effective option for BEV owners as they can purchase a cost effective and appropriately sized BEV for ordinary urban usages and rent this extender for occasional long-distance trips. Also, from the manufacturer’s perspective, the ‘rent & drop’ strategy will reduce the manufacturing cost compared to the fixed-installation of the fuel cell in the REEV solution. The demountable fuel cell range extender will be able to serve more vehicles and their occasional demands. The ‘sharing model’ can avoid wastes in manufacturing costs, purchasing price and running costs and increase the utilization of hydrogen infrastructure. It could also bridge the gap in being “tailored for application” for the current BEV [
1].
5.2.5. Battery Lifespan Extension
The deep discharge of the battery pack can reduce the stability of the battery pack. The cobalt-based lithium battery lifecycle is decreased by the reduction of the SoC. The battery lifespan will be decreased by 50% if the depth of discharge (DoD) reaches 80% (20% SoC) [
80]. The control unit of this fuel cell range extender can determine the charging time and output based on the SoC and temperature of the vehicle to keep the SoC in the most efficient and healthiest level. This can help the BEV extend the battery lifespan. The performance of the lithium battery is limited by the operational temperature [
81]. In a low-temperature environment, the fuel cell power unit in this range extender can provide enough electricity while the battery performance is affected by weather and avoid damage to the battery lifespan caused by repeatedly deep discharges.
6. Conclusions
There is currently a political and ideological desire to move from internal combustion engines to electric vehicles, to reduce emissions and therefore pollution at the point of use. The current challenges to realizing this goal include the race to larger battery packs, resource and raw material potential shortages, battery technology limitations and limited infrastructure to support a large fleet of BEVs. There is therefore a gap between the political will and achievable BEV fleet increases.
This paper has proposed a new trailer-based intelligent fuel cell range extender to bridge this gap. The applicability, effectiveness and efficiency of the solution has been justified based on a review of the current issues and solutions associated with the range limitations suffered by battery operated vehicles (BEVs). The proposed 1.8 kg fuel cell tank can extend the range of small and large BEVs by more than 50% and 25%, respectively, to achieve ranges between 250 and 350 km. The trailer-based demountable design reduces dependency on charging infrastructure and increases refueling station utilization efficiently by centralization refueling. The ability to add range extension on demand enables manufacturers to reduce battery pack sizes for BEVs, helping reduce the pressure on raw materials and need for recycling.
Designing a BEV for the most common journeys, in contrast to designing for maximum expected range, reduces the overall cost and increases BEV efficiency. It provides additional usability, due to the flexibility to rent this range extender for occasional long-distance journeys. The ability to recharge or maintain the battery charge within conservative SoC limits can help maintain battery health and minimize the detrimental impacts of external environmental conditions.
In addition to the aforementioned benefits to BEVs, the proposed approach can also benefit FCEVs. It can, in the short term, rationalize infrastructure development, hydrogen production, distribution and reduce cost. This intelligent fuel cell range extender could support the development of BEVs and FCEVs for zero TTW emissions and bridge the gap between current and future automotive market demands.
Author Contributions
Conceptualization, D.W., J.R. and J.S.; Methodology, D.W. and J.R.; Investigation, J.R. and D.W.; Formal analysis, D.W. and J.R.; Resources, D.W. and J.R.; Data curation, D.W., J.R.; Writing – original draft preparation, D.W., J.R., H.D., J.S. and O.H.; Writing—review and editing, O.H., H.D. and J.S.; Supervision, H.D., O.H. and J.S.
Funding
This research received no external funding.
Acknowledgments
This work was supported by the Institute of Future Transport and Cities and Microcab Ltd., Coventry University, UK.
Conflicts of Interest
The authors declare no conflict of interest of the manuscript.
References
- Automotive Council UK. Product Roadmap 2017: Passenger Car. Available online: https://www.automotivecouncil.co.uk/wp-content/uploads/sites/13/2017/09/Passenger-Car_.jpg (accessed on 28 December 2017).
- European Commission. Proposal for Post-2020 CO2 Targets for Cars and Vans. Available online: https://ec.europa.eu/clima/policies/transport/vehicles/proposal_en (accessed on 22 March 2018).
- SAE Technology Roadmap for Energy Saving and New Energy Vehicles; China Machine Press: Beijing, China, 2016; pp. 47–53.
- Petroff, A. These Countries Want to Ban Gas and Diesel Cars. Available online: https://money.cnn.com/2017/09/11/autos/countries-banning-diesel-gas-cars/index.html (accessed on 10 September 2018).
- International Energy Agency (IEA). United States—Policies and Legislation. Available online: http://www.ieahev.org/by-country/united-states-policy-and-legislation/ (accessed on 1 October 2018).
- European Commission. Open Data Portal for the European Structural Investment Funds. Network Infrastructure in Transport and Energy. Available online: https://cohesiondata.ec.europa.eu/themes/7 (accessed on 19 October 2017).
- UK GOVERNMENT WEBSITE. Low-Emission Vehicles Eligible for a Plug-in Grant. Available online: https://www.gov.uk/plug-in-car-van-grants (accessed on 10 September 2018).
- The Government of Japan. Tokyo Aims to Realize “Hydrogen Society” by 2020. Available online: https://www.japan.go.jp/tomodachi/2016/spring2016/tokyo_realize_hydrogen_by_2020.html (accessed on 17 August 2018).
- Ministry of Finance of the People’s Republic of China Notice on Adjusting the Financial Subsidy Policy for the Promotion and Application of New Energy Vehicles. Available online: http://www.mof.gov.cn/gp/xxgkml/jjjss/201612/t20161230_2512230.html (accessed on 9 August 2018).
- ERTRAC. ERTRAC Roadmaps. Available online: https://www.ertrac.org/index.php?page=ertrac-roadmap (accessed on 2 July 2018).
- Pollet, B.; Staffell, I.; Shang, J. Current status of hybrid, battery and fuel cell electric vehicles: From electrochemistry to market prospects. Electrochim. Acta 2012, 84, 235–249. [Google Scholar] [CrossRef]
- RENAULT 250 Miles (NEDC)* Driving Range. Available online: https://www.renault.co.uk/vehicles/new-vehicles/zoe-250/driving range.html/ (accessed on 19 September 2018).
- Volkswagen UK. Volkswagen Electric & Hybrid Car Technology. Available online: https://www.volkswagen.co.uk/electric-hybrid/ (accessed on 12 January 2019).
- BMW BMW i3 and i3s | New Vehicles | BMW UK. Available online: https://www.bmw.co.uk/bmw-cars/bmw-i/2018-i3-and-i3s?gclid=Cj0KCQiArenfBRCoARIsAFc1FqforYlMbfaw-eV39IF4OF2A0fQ6X-dhPtKoXphBnmmUAunbUk9eF2QaAiNnEALw_wcB&gclsrc=aw.ds/ (accessed on 7 January 2019).
- Nissan Nissan LEAF—Top Selling Electric Vehicule in Europe 2018 | Nissan. Available online: https://www.nissan.co.uk/vehicles/new-vehicles/leaf.html/ (accessed on 10 January 2019).
- TESLA Model S | Tesla UK. Available online: https://www.tesla.com/en_GB/models/ (accessed on 9 January 2019).
- European Commission EUROPA. Driving and Parking Patterns of European Car Drivers—A Mobility Survey. Available online: https://setis.ec.europa.eu/related-jrc-activities/jrc-setis-reports/driving-and-parking-patterns-of-european-car-drivers (accessed on 20 July 2018).
- TNS SOFRES EP TENDER. Available online: https://tbb.innoenergy.com/wp-content/uploads/2015/11/EP-Tender.pdf (accessed on 13 January 2017).
- Department for Transport GOV UK National Travel Survey: England 2017. Available online: https://assets.publishing.service.gov.uk/government/uploads/system/uploads/attachment_data/file/729521/national-travel-survey-2017.pdf (accessed on 17 January 2019).
- Tie, S.; Tan, C. A review of energy sources and energy management system in electric vehicles. Renew. Sustain. Energy Rev. 2013, 20, 82–102. [Google Scholar] [CrossRef]
- Westbrook, M. The Electric and Hybrid Electric Car; Institution of Electrical Engineers: London, UK, 2001; pp. 87–99. [Google Scholar]
- Mikkelsen, K. Design and Evaluation of Hybrid Energy Storage Systems for Electric Powertrains, 1st ed.; University of Waterloo: Waterloo, ON, Canada, 2010. [Google Scholar]
- Jaguemont, J.; Boulon, L.; Dubé, Y. A comprehensive review of Lithium-ion batteries used in hybrid and electric vehicles at cold temperatures. Appl. Energy 2016, 164, 99–114. [Google Scholar] [CrossRef]
- Ren, G.; Ma, G.; Cong, N. Review of electrical energy storage system for vehicular applications. Renew. Sustain. Energy Rev. 2015, 41, 225–236. [Google Scholar] [CrossRef]
- Das, H.; Tan, C.; Tatim, A. Fuel cell hybrid electric vehicles: A review on power conditioning units and topologies. Renew. Sustain. Energy Rev. 2017, 76, 268–291. [Google Scholar] [CrossRef]
- Renault ZOE | Electric | Renault UK. Available online: https://www.renault.co.uk/vehicles/new-vehicles/zoe/motor.html (accessed on 10 January 2019).
- International Energy Agency. Global EV Outlook 2018. Available online: https://www.iea.org/gevo2018/ (accessed on 19 January 2019).
- King, S.; Boxall, N. Lithium battery recycling in Australia: Defining the status and identifying opportunities for the development of a new industry. J. Clean. Prod. 2019, 215, 1279–1287. [Google Scholar] [CrossRef]
- Grosjean, C.; Miranda, P.; Perrin, M.; Poggi, P. Assessment of world Lithium resources and consequences of their geographic distribution on the expected development of the electric vehicle industry. Renew. Sustain. Energy Rev. 2012, 16, 1735–1744. [Google Scholar] [CrossRef]
- McKinsey Metals & Mining. Available online: https://www.mckinsey.com/~/media/mckinsey/industries/metals and mining/our insights/lithium and cobalt a tale of two commodities/lithium-and-cobalt-a-tale-of-two-commodities.ashx (accessed on 16 January 2019).
- Oliveira, L.; Messagie, M.; Rangaraju, S.; Sanfelix, J.; Hernandez Rivas, M.; Van Mierlo, J. Key issues of Lithium-ion batteries—From resource depletion to environmental performance indicators. J. Clean. Prod. 2015, 108, 354–362. [Google Scholar] [CrossRef]
- Global Energy Metals Cobalt Demand. Available online: https://www.globalenergymetals.com/Cobalt/Cobalt-demand/ (accessed on 28 September 2018).
- InfoMine 5 Year Cobalt Prices and Price Charts. Available online: http://www.infomine.com/investment/metal-prices/Cobalt/5-year/ (accessed on 15 January 2019).
- Macquarie Research Commodities Comment. The 2017 Battery Metal Story Might Well Be Cobalt. Available online: https://www.metalicity.com.au/sites/metalicity.com.au/files/files/MacquarieCommoditiesComment%20Feb%202017.pdf (accessed on 12 May 2018).
- Mohr, S.; Mudd, G.; Giurco, D. Lithium Resources and Production: Critical Assessment and Global Projections. Minerals 2012, 2, 65–84. [Google Scholar] [CrossRef]
- Gu, X.; Ieromonachou, P.; Zhou, L.; Tseng, M. Developing pricing strategy to optimise total profits in an electric vehicle battery closed loop supply chain. J. Clean. Prod. 2018, 203, 376–385. [Google Scholar] [CrossRef]
- Li, L.; Dababneh, F.; Zhao, J. Cost-effective supply chain for electric vehicle battery remanufacturing. Appl. Energy 2019, 226, 277–286. [Google Scholar] [CrossRef]
- Vikström, H.; Davidsson, S.; Höök, M. Lithium availability and future production outlooks. Appl. Energy 2013, 110, 252–266. [Google Scholar] [CrossRef]
- Wang, X.; Gaustad, G.; Babbitt, C.W.; Bailey, C.; Ganter, M.J.; Landi, B.J. Economic and environmental characterization of an evolving Li-ion battery waste stream. J. Environ. Manag. 2014, 135, 126–134. [Google Scholar] [CrossRef] [PubMed]
- Swain, B. Recovery and recycling of Lithium: A review. Sep. Purif. Technol. 2017, 172, 388–403. [Google Scholar] [CrossRef]
- Huang, B.; Pan, Z.; Su, X.; An, L. Recycling of Lithium-ion batteries: Recent advances and perspectives. J. Power Sources 2018, 399, 274–286. [Google Scholar] [CrossRef]
- Brennan, J.; Barder, T. Battery Electric Vehicles vs. Internal Combustion Engine Vehicles. Available online: http://www.adlittle.com/en/insights/viewpoints/battery-electric-vehicles-vs-internal-combustion-engine-vehicles (accessed on 12 July 2018).
- Al-Alawi, B.; Bradley, T. Total cost of ownership, payback, and consumer preference modeling of plug-in hybrid electric vehicles. Appl. Energy 2013, 103, 488–506. [Google Scholar] [CrossRef]
- Noori, M.; Gardner, S.; Tatari, O. Electric vehicle cost, emissions, and water footprint in the United States: Development of a regional optimization model. Energy 2015, 89, 610–625. [Google Scholar] [CrossRef]
- Hutchinson, T.; Burgess, S.; Herrmann, G. Current hybrid-electric powertrain architectures: Applying empirical design data to life cycle assessment and whole-life cost analysis. Appl. Energy 2014, 119, 314–329. [Google Scholar] [CrossRef]
- Wu, G.; Inderbitzin, A.; Bening, C. Total cost of ownership of electric vehicles compared to conventional vehicles: A probabilistic analysis and projection across market segments. Energy Policy 2015, 80, 196–214. [Google Scholar] [CrossRef]
- Kate, P.; Tate, J.; Wadud, Z.; Nellthorp, J. Total cost of ownership and market share for hybrid and electric vehicles in the UK, US and Japan. Appl. Energy 2018, 209, 108–119. [Google Scholar]
- Bundesregierung Weitere Steuervorteile für Elektroautos. Available online: https://www.bundesregierung.de/Content/DE/Artikel/2016/05/2016-05-18-elektromobilitaet.html;jsessionid=4800885F4CF543C627A4132F978A0B08.s2t2 (accessed on 11 June 2018).
- Bubeck, S.; Tomaschek, J.; Fahl, U. Perspectives of electric mobility: Total cost of ownership of electric vehicles in Germany. Transp. Policy 2016, 50, 63–77. [Google Scholar] [CrossRef]
- Kane, M. Plug-In Electric Car Sales More Than Doubled in Germany in 2017. Available online: https://insideevs.com/plug-in-electric-car-sales-more-than-doubled-in-2017/ (accessed on 2 January 2019).
- Hagman, J.; Ritzén, S.; Janhager Stier, J.; Susilo, Y. Total cost of ownership and its potential implications for battery electric vehicle diffusion. Res. Transp. Bus. Manag. 2016, 18, 11–17. [Google Scholar] [CrossRef]
- Roth, M. Lifetime costs, life cycle emissions, and consumer choice for conventional, hybrid, and electric vehicles. In Proceedings of the 94th Transportation Research Board Annual Meeting, Washington, DC, USA, 11–15 January 2015. [Google Scholar]
- Ottocar Revealed! London’s Top 5 Most Popular PCO Cars. Available online: http://www.ottocar.co.uk/blog/londons-top-10-popular-pco-cars/ (accessed on 25 December 2018).
- Zap-Map How Many Charge Points Are There in the UK 2018. Available online: https://www.zap-map.com/statistics// (accessed on 20 May 2019).
- The Department of Energy and Climate Change (DECC) ‘Big fall’ in UK Petrol Stations. Available online: http://www.bbc.co.uk/news/business-20791871/ (accessed on 11 May 2017).
- National Grid Group. National Grid Electric Dreams: The Future for EVs. Available online: https://www.nationalgrid.com/group/case-studies/electric-dreams-future-evs (accessed on 17 September 2018).
- Mekhilef, S.; Saidur, R.; Safari, A. Comparative study of different fuel cell technologies. Renew. Sustain. Energy Rev. 2012, 16, 981–989. [Google Scholar] [CrossRef]
- Elmer, T.; Worall, M.; Wu, S.; Riffat, S. Fuel cell technology for domestic built environment applications: State of-the-art review. Renew. Sustain. Energy Rev. 2015, 42, 913–931. [Google Scholar] [CrossRef]
- Sharaf, O.; Orhan, M. An overview of fuel cell technology: Fundamentals and applications. Renew. Sustain. Energy Rev. 2014, 32, 810–853. [Google Scholar] [CrossRef]
- Gencoglu, M.; Ural, Z. Design of a PEM fuel cell system for residential application. Int. J. Hydrogen Energy 2009, 34, 5242–5248. [Google Scholar] [CrossRef]
- Bromaghim, G.; Gibeault, K.; Serfass, J.; Serfass, P.; Wagner, E. Hydrogen and Fuel Cells: The U.S. Market Report, 1st ed.; National Hydrogen Association: Washington, DC, USA, 2010. [Google Scholar]
- Hunt, J. Toyota Fuelling the Future. Available online: http://www.climate-change-solutions.co.uk/wp-content/uploads/2017/03/JonHunttransportHFC2017.pdf/ (accessed on 23 April 2018).
- BLOOMBERG. Available online: https://www.japantimes.co.jp/news/2017/10/18/business/corporate-business/toyota-targets-1000-km-driving-range-fuel-cell-concept-car/#.XIopaEJKiUk (accessed on 16 March 2019).
- IEA International Energy Agency. Hydrogen Tracking Clean Energy Progress. Available online: https://www.iea.org/tcep/energyintegration/hydrogen/ (accessed on 22 January 2019).
- Hayes, J. CBE MP £23 Million Boost for Hydrogen-Powered Vehicles and Infrastructure. Available online: https://www.gov.uk/government/news/23-million-boost-for-hydrogen-powered-vehicles-and-infrastructure (accessed on 4 July 2018).
- EERE. Hydrogen Production: Natural Gas Reforming. Available online: https://www.energy.gov/eere/fuelcells/hydrogen-production-natural-gas-reforming (accessed on 9 January 2019).
- GasTerra. Available online: https://www.gasterra.nl/en/news/hydrogen-and-ccs-a-smart-combination (accessed on 16 March 2019).
- CCSa. Available online: http://www.ccsassociation.org/what-is-ccs/ (accessed on 16 March 2019).
- Satyapal, S.; Petrovic, J.; Read, C.; Thomas, G.; Ordaz, G. The U.S. Department of Energy’s National Hydrogen Storage Project: Progress towards meeting hydrogen-powered vehicle requirements. Catal. Today 2007, 120, 246–256. [Google Scholar] [CrossRef]
- Jia, T.; Wang, Y.; LI, Z. The Research of Status of Hydrogen Energy Development; School of Auto and Transport Tianjin University of Technology and Education: Tianjin, China, 2019. [Google Scholar]
- Height, B. Mesh Side Kit for Brenderup 1205s Trailers. Available online: https://www.tridenttowing.co.uk/trailers-c1/trailer-options-accessories-c101/brenderup-trailers-options-and-accessories-c174/brenderup-1205s-trailer-complete-mesh-side-kit-450mm-height-p10676/s10676?utm_source=google&utm_medium=cpc&utm_term=brenderup-1205s-trailer-complete-mesh-side-kit-450mm-height-429658&utm_campaign=product%2Blisting%2Bads&gclid=CjwKCAjwm-fkBRBBEiwA966fZGs_5damjvAZZfNS8C3oOrRWXXSYmqwJCMw-kLKwSF6-IlXTocXo7hoCPOcQAvD_BwE (accessed on 22 March 2019).
- Hypertextbook Energy Density of Hydrogen—The Physics Factbook. Available online: https://hypertextbook.com/facts/2005/MichelleFung.shtml (accessed on 12 May 2017).
- Cornish, J. Hydrogen Fueling Station Cost Reduction Study. Available online: https://www.osti.gov/servlets/purl/1120569 (accessed on 16 July 2018).
- US Geological Survey Global Cobalt Reserves by Country 2017 | Statistic. Available online: https://www.statista.com/statistics/264930/global-Cobalt-reserves/ (accessed on 23 August 2018).
- Intelligence, M.B. Panasonic Reduces Tesla’s Cobalt Consumption by 60% in 6 Years. Available online: https://www.benchmarkminerals.com/panasonic-reduces-teslas-Cobalt-consumption-by-60-in-6-years/ (accessed on 28 December 2018).
- Osborne, J. Electric Car Forecast Predicts 21% Market Share by 2035. Available online: https://www.chron.com/business/energy/article/Electric-car-forecast-predicts-21-market-share-11745799.php (accessed on 2 February 2019).
- Aharon, I.; Shmilovitz, D.; Kuperman, A. Multimode power processing interface for fuel cell range extender in battery powered vehicle. Appl. Energy 2017, 204, 572–581. [Google Scholar] [CrossRef]
- Zeng, T.; Zhang, C.; Hu, M.; Chen, Y.; Yuan, C.; Chen, J.; Zhou, A. Modelling and predicting energy consumption of a range extender fuel cell hybrid vehicle. Energy 2018, 165, 187–197. [Google Scholar] [CrossRef]
- Fernández, R.; Cilleruelo, F.; Martínez, I. A new approach to battery powered electric vehicles: A hydrogen fuel-cell-based range extender system. Int. J. Hydrogen Energy 2016, 41, 4808–4819. [Google Scholar] [CrossRef]
- Battery University. How to Prolong Lithium-Based Batteries. Available online: https://batteryuniversity.com/learn/article/how_to_prolong_Lithium_based_batteries (accessed on 1 January 2019).
- Panasonic NCR 18650. Available online: https://engineering.tamu.edu/media/4247819/ds-battery-panasonic-18650ncr.pdf (accessed on 11 November 2018).
© 2019 by the authors. Licensee MDPI, Basel, Switzerland. This article is an open access article distributed under the terms and conditions of the Creative Commons Attribution (CC BY) license (http://creativecommons.org/licenses/by/4.0/).


