Abstract
Against the backdrop of global warming, extreme heat events have become increasingly frequent and persistent across Chinese cities, posing severe threats to public health, industrial safety, and urban operations. Enhancing urban climate adaptation through the development of green infrastructure has therefore emerged as a critical governance priority. As a major national initiative promoting urban forest development and ecological civilization, the National Forest City Policy offers a potentially important pathway for mitigating extreme heat, yet its climate adaptation effects remain insufficiently examined through rigorous empirical evidence. This study takes the implementation of the National Forest City Policy as an exogenous policy shock to urban greening and employs panel data from Chinese 243 prefecture-level cities from 2000 to 2023 to conduct a difference-in-differences model, supplemented by an event-study approach, to identify the policy’s impact on annual extreme heat days. The empirical findings indicate that, after controlling for a series of socioeconomic characteristics, the National Forest City Policy significantly reduces the number of extreme heat days experienced by cities each year. Further mechanism analysis reveals that the National Forest City Policy’s mitigation effect is more pronounced in cities with higher Green Coverage Rate, Urban Climate Conditions, and Urban Green Space Quality. By evaluating the environmental impacts of the National Forest City Policy from a climate adaptation perspective, this study enriches the literature on urban forest development and extreme climate events, and provides empirical evidence and policy insights for enhancing urban climate resilience and optimizing greening strategies under China’s “dual-carbon” goals and a warming climate.
1. Introduction
Over the past several decades, global climate warming has continued to intensify, leading to a worldwide rise in the frequency, duration, and spatial extent of extreme heat (EH) events [1,2,3]. China, as one of the regions most sensitive to climate change, has experienced increasingly frequent summer heatwaves. Combined with rapid urbanization-characterized by the expansion of impervious surfaces, restricted ventilation conditions, and high population concentration-cities have become the primary hotspots for EH risks [4,5]. Heatwaves pose severe threats to public health, heighten the burden on urban healthcare systems, increase energy demand, compromise the safe operation of infrastructure, and generate multiple adverse impacts on economic activities and social stability [6]. In the context of climate change, mitigating urban EH risks and enhancing climate resilience have become urgent priorities in China’s urban governance agenda. Nature-based solutions (NbS) have emerged as an important pathway for addressing urban climate risks in recent years. Among them, urban forest development-through shading, evapotranspiration, and improvements to land-surface characteristics-provides a suite of ecological regulatory functions that can effectively alleviate urban heat island effects and reduce extreme temperatures [7]. Since 2004, China has launched the National Forest City initiative to promote urban forest development by establishing construction standards, implementing evaluation and designation procedures, and building long-term supervision mechanisms. The National Forest City Policy (NFCP) aims to develop an integrated urban–rural ecological network centered on forests and trees, emphasizing large-scale greening, improved urban green-space structure, and enhanced forest quality and ecological functions. Beyond improving environmental quality and living conditions, the policy is designed to reshape urban spatial and ecological patterns to provide stronger climate regulation capacity and mitigate EH in urban areas.
Although a substantial body of ecological, geographical, and remote-sensing research has confirmed the cooling effects of urban green spaces and urban forests—particularly their roles in mitigating urban heat islands and regulating urban temperatures—existing studies have primarily focused on parks, small-scale green patches, or localized greening interventions [8,9]. Empirical evidence remains limited regarding whether the NFCP—a nationwide and systematic urban greening policy—can moderate EH conditions, especially when evaluated using large-scale datasets and rigorous causal identification strategies. Moreover, the literature on the NFCP has largely centered on forest coverage, greening levels, air quality improvement, and ecosystem service enhancement, while insufficient attention has been paid to its potential function as a climate adaptation policy capable of alleviating EH. This leaves a clear research gap concerning its temperature-moderating effects under intensifying climate risks. Against this backdrop, this study treats the staggered designation of NFCP as an exogenous policy shock and employs panel data from Chinese prefecture-level cities from 2000 to 2023 to construct a difference-in-differences (DID) model that identifies the policy’s impact on urban EH days. An event-study approach is further integrated to examine the temporal evolution of policy effects. In addition, this study investigates the underlying mechanisms through which urban forest development may influence EH, focusing on Green Coverage Rate (GCR), Urban Climate Conditions (UCC), and Urban Green Space Quality (UGQ). Finally, heterogeneity analyses are conducted based on cities’ resource endowment, industrial foundation, and administrative hierarchy to uncover contextual variations in the effectiveness of the NFCP.
This study aims to systematically evaluate the empirical effects of the NFCP on mitigating extreme urban heat from a climate adaptation perspective, thereby addressing the lack of policy-level empirical evidence on temperature regulation in the existing literature. The contributions of this study are twofold. First, this study extends the empirical literature on urban greening policies and climate adaptation by shifting the analytical focus from localized and fragmented greening interventions to a nationwide, institutionalized urban forest policy. While existing studies have primarily examined the cooling effects of parks, scattered green spaces, or site-specific greening projects, relatively little attention has been paid to the role of large-scale, policy-driven urban forest development in addressing extreme climate risks. By treating the NFCP as an exogenous policy shock, this study provides systematic quasi-experimental evidence on how coordinated urban forest planning contributes to the mitigation of EH, thereby advancing research at the intersection of urban forest governance and climate adaptation. Second, this study moves beyond an analytical framework centered solely on average treatment effects and further examines the conditions under which the NFCP exerts differentiated impacts. By developing a moderating analysis based on GCR, UCC, and UGQ, the study identifies the important roles of baseline ecological conditions and climatic stress in shaping policy effectiveness. The results indicate that green policies do not generate uniform climate adaptation benefits across cities; rather, their impacts are strongly context-dependent, providing new empirical evidence on the heterogeneous effects of urban forest policies.
The remainder of the paper is organized as follows. Section 2 reviews the policy background and develops the testable hypotheses. Section 3 details the data and empirical strategy. Section 4 reports the empirical findings. Section 5 examines heterogeneity in the estimated effects across different types of cities. Section 6 concludes with a discussion of the main findings and their policy implications.
2. Policy Background and Research Hypotheses
2.1. Policy Background
The NFCP is a key institutional arrangement for advancing ecological civilization and promoting a green transition in China’s urban development [10,11]. Its core objective is to build stable and healthy urban ecosystems—rooted in forests, trees, and other natural elements—to improve urban environmental quality, enhance livability, and strengthen cities’ capacity to cope with climate change and environmental risks. Since its launch in 2004, the policy has gradually developed a mature system of implementation, evaluation, and long-term supervision, becoming a distinctive hallmark of China’s urban ecological governance. The introduction of the NFCP is closely linked to the ecological pressures brought about by rapid urbanization. For many years, Chinese cities faced issues such as insufficient green space and fragmented urban forests, making it difficult to meet residents’ growing demand for a high-quality ecological environment. To shift from a “brick-and-mortar” model of urban development to a “green-oriented” one, the National Afforestation Committee and former State Forestry Administration launched the initiative in 2004. Since then, regulatory documents like the Evaluation Indicators for National Forest Cities and the Administrative Measures for National Forest Cities (Trial) have been issued to clarify goals, procedural requirements, and evaluation criteria for urban forest development. Built on these foundations, the initiative has evolved into a systematic model incorporating voluntary application, planning, construction, supervision, acceptance, evaluation, official designation, and dynamic post-award management. This framework supports the coordinated development of urban–rural ecological space and the green transition of Chinese cities.
The NFCP emphasizes the creation of an ecological network dominated by forests and trees at the municipal scale. By integrating various ecological spaces—such as forests, wetlands, parks, and green corridors—the policy aims to establish a comprehensive urban forest system. Unlike traditional “urban greening projects,” it focuses more on urban–rural integration, spatial planning, and ecological functions. The policy promotes holistic protection and coordinated management of ecosystems, including mountains, rivers, and grasslands, to form a functional and connected natural urban matrix that strengthens both ecosystem quality and ecological service provision. This policy is not merely for expanding green areas, but represents a comprehensive governance system that includes spatial planning, forest management, ecological restoration, and cultural development. At the institutional level, the Evaluation Indicators for National Forest Cities (GB/T 37342–2019) provides an assessment framework across four categories: urban forest networks, forest health, ecological culture, and forest management. The evaluation includes indicators such as forest coverage, GCR in built-up areas, urban park green space, forest health, ecological corridor construction, and public participation. This balanced framework offers measurable, actionable guidelines for urban forest development. In terms of implementation, the NFCP combines local planning with national-level evaluation and accreditation. Local governments prepare construction plans for green-space expansion, forest quality improvement, wetland restoration, and the establishment of green corridors. The national forestry authority organizes expert reviews and on-site inspections. As the initiative has become institutionalized, many regions have integrated National Forest City development into ecological civilization assessments, making it a key component of master plans and ecological restoration strategies, leading to its widespread adoption and sustained intensity across China.
In nearly two decades, the NFCP has evolved from a greening initiative into a comprehensive urban ecological governance system, expanding urban forests, strengthening ecological networks, and improving ecosystem functions. These efforts have not only enhanced urban environmental quality but also played a crucial role in shaping more resilient and sustainable urban landscapes.
2.2. Research Hypothesis
2.2.1. Direct Effect
A substantial body of research in ecology and urban climatology demonstrates that urban forests play a crucial role in regulating urban thermal environments and mitigating heat island effects, which are exacerbated by urbanization and climate change. Urban forests mitigate heat through various biophysical mechanisms, including shading, evapotranspiration, alteration of surface energy balance, and optimization of urban spatial structures, which collectively buffer the impacts of EH events.
Firstly, tree canopies block incoming solar radiation, reducing the amount of heat absorbed by urban surfaces and lowering peak land surface temperatures, especially during hot periods of the day. Simultaneously, plant evapotranspiration consumes latent heat, cooling local air temperatures. This natural cooling effect is one of the most direct, cost-effective, and sustainable ways to mitigate extreme heat, particularly during heatwaves [12,13]. Furthermore, expanding urban forests and green spaces reduces impervious surfaces—such as concrete and asphalt—that absorb and retain heat. By increasing permeable surfaces and vegetation, urban forests decrease the city’s heat storage capacity and mitigate nighttime heat retention, which amplifies the effects of extreme heat. This reduction in heat retention is especially crucial in combating “day-night compounded” extreme heat, where prolonged high temperatures occur due to daytime heat absorption and insufficient nighttime cooling [14]. In addition to these direct cooling effects, continuous networks of urban forests and green spaces can act as “ecological cold sources” and “ventilation corridors.” These green infrastructures enhance intra-urban airflow, promoting the circulation of cooler air and heat dissipation. By connecting fragmented green patches, the NFCP fosters a more integrated and effective system for heat dissipation, helping to mitigate the impacts of urban heat islands [15,16].
Building on these foundations, the NFCP supports large-scale afforestation, green-space expansion, improvements in vegetation health, and the creation of blue-green networks to alter urban surface properties and ecological structures. By prioritizing increases in forest coverage, GCR in built-up areas, and per capita park space, the policy enhances urban microclimate regulation capacity. Moreover, the policy aims to create integrated ecological corridors, riparian green belts, and suburban parks to improve shading and evapotranspiration potential at the city scale, strengthening urban resilience to extreme heat. Improved forest quality and vegetation maintenance ensure that urban forests maintain strong cooling effects even during heatwaves. Existing studies indicate that well-connected, large-scale green space systems exhibit stronger temperature regulation effects compared to fragmented green patches, particularly in suppressing heat island intensity and reducing the frequency and severity of extreme heat events. Strategic green space design and placement ensure that cooling benefits are evenly distributed, improving the overall efficacy of urban greening efforts [17,18]. Based on these theoretical foundations, this study proposes Research Hypothesis 1:
H1:
The NFCP contributes to the mitigation of EH.
2.2.2. Indirect Effects
As a key institutional arrangement for strengthening urban green infrastructure, the NFCP may influence EH not only through its overall effect but also through heterogeneous impacts shaped by differing urban characteristics. During policy implementation, certain ecological and climatic conditions may not directly determine the outcome variable itself, yet they can moderate the strength of the relationship between the policy intervention and the resulting temperature response. To capture this potential moderating mechanism, this study incorporates three ecological dimensions—GCR, UCC, and UGQ—to examine whether these factors adjust the effectiveness of the NFCP in mitigating EH.
GCR is a fundamental indicator of a city’s ecological foundation. Its level not only directly shapes the urban thermal environment but may also systematically moderate the effectiveness of the NFCP in alleviating EH. According to the theory of urban ecosystem services, the microclimate regulation functions provided by urban green spaces become significantly effective only when ecological conditions exceed certain thresholds [19]. Thus, in cities with higher levels of GCR, afforestation and greening initiatives promoted by the NFCP are more readily integrated into existing green-space networks, generating scale effects and reinforcing cooling through the superposition of cold islands. These dynamics enhance the policy’s capacity to mitigate EH. From a biophysical perspective, the cooling effect of green spaces primarily relies on two processes: shading and evapotranspiration [20]. However, the operation of these mechanisms exhibits strong “scale dependence”: small, fragmented, or isolated green patches struggle to produce stable microclimate regulation. Consequently, in cities with low GCR, the greening projects implemented under the NFCP tend to be dispersed and insufficient to establish coherent ecological functions, resulting in limited cooling impact. Conversely, in cities with high GCR, newly added green spaces are more likely to integrate with the existing ecological structure, forming spatially connected and functionally complementary green networks. This integration significantly enhances microclimate regulation capacity and amplifies the cooling benefits of the NFCP.
Under global climate change, cities face markedly different levels of heat exposure. Cities located in inland, humid–hot, or arid–hot regions typically experience more annual high-temperature days and more frequent EH events. In such contexts of elevated climatic stress, both the adaptive capacity of cities and the intensity of policy responses become especially critical. As an external environmental condition, urban climate severity may therefore moderate the effect of the NFCP on EH mitigation, following a “climate exposure–policy adaptation intensity” pathway. According to climate adaptation theory, stronger external climatic pressures induce more proactive adaptation actions from governments and residents alike [21]. In cities where EH occurs frequently, the NFCP tends to receive stronger policy support, greater fiscal investment, and broader public cooperation, which enables higher standards of green-space planning and denser forest construction. These efforts enhance the cooling functions of urban vegetation—including evapotranspirative cooling, increased surface albedo, and enhanced thermal buffering—ultimately leading to a more pronounced reduction in EH events [12]. In other words, cities under greater climatic risk obtain higher “marginal adaptation benefits” from the policy. At the same time, high climatic stress amplifies the marginal effectiveness of ecosystem services. For example, prior studies have shown that the cooling effect per unit of green space is more substantial in cities with higher background temperatures [22]. This implies that the same level of greening investment yields more significant cooling in hotter cities. Thus, UCC not only reflect the external risk environment but also heighten the necessity and visibility of green-space-based interventions.
UGQ is a crucial indicator of the functional capacity of green infrastructure, playing a key role in mitigating EH events. Although expanding green-space area is one of the core objectives of the NFCP, area alone does not fully capture the adaptive climate benefits of green spaces. Green spaces with different levels of ecological quality vary significantly in their cooling, evapotranspiration, carbon sequestration, and other ecosystem services. Thus, green-space quality may substantially moderate the policy’s climate mitigation effectiveness. From an ecological standpoint, high-quality green spaces typically feature richer vegetation structures, greater canopy density, and stronger ecological connectivity—characteristics that collectively enhance evapotranspirative cooling and thermal regulation [12]. Previous studies have shown that green spaces with complex vegetation structures and high coverage can effectively reduce local land surface temperatures by increasing water vapor exchange and providing greater shading [23]. Therefore, in cities with higher green-space quality, the cooling benefits brought about by NFCP-induced green expansion are more likely to emerge and remain sustainable over time. From a spatial governance perspective, high-quality green spaces are often associated with more standardized urban planning, stronger maintenance regimes, and more rigorous ecological performance assessments. This implies greater enforcement capacity and better implementation of NFCP directives. High-quality green space entails not only larger area but also improved management, accessibility, and ecological continuity, enabling the ecosystem services they provide to exert more direct and stronger effects in mitigating EH. Based on the above analysis, this study proposes the following hypothesis:
H2:
The effectiveness of the NFCP in mitigating EH increases with higher levels of GCR, more intense UCC, and better UGQ.
3. Research Design
3.1. Model
The DID model is a widely used causal identification tool in econometrics. It enables researchers to infer policy impacts in the absence of randomized experiments by comparing changes in outcomes between the treatment and control groups before and after policy implementation. By simultaneously controlling for time-invariant differences across cities and common temporal shocks shared by all cities, DID effectively mitigates potential confounding factors under certain conditions and has therefore been extensively applied in policy evaluation and the social sciences [24,25,26]. The conventional DID framework assumes that all treated units are exposed to the policy at the same point in time. However, the NFCP features a distinct “multi-cohort, staggered adoption” pattern, in which different cities receive designation in different years. As a result, the timing of policy activation is not uniform across cities. Using a single-period DID in this context would fail to exploit the temporal heterogeneity of the policy and could lead to biased estimates of the treatment effect. To address this issue, this study adopts a staggered (multiple-time-period) DID framework, extending the traditional model to accommodate policies implemented in multiple years. In such settings, treated units differ not only cross-sectionally but also in the timing of treatment, making it necessary to identify how policy effects evolve dynamically across different adoption cohorts. Accordingly, we treat the staggered designation of NFCP as an externally assigned quasi-natural experiment and construct a multi-period DID model based on a city–year panel dataset to estimate the impact of the NFCP on EH. The empirical specification is as follows [27]:
In model (1), Yit is the dependent variable, representing the number of EH days in city i during year t. Treatedi is the treatment-group indicator, which equals 1 if city i belongs to the treatment group and 0 if it belongs to the control group. Postit is the post-treatment dummy variable, which equals 1 if city i is subject to the NFCP in year t, and 0 otherwise. Controls denotes the set of control variables used in this study. , and represent the city fixed effects, year fixed effects, and the random error term, respectively.
3.2. Variable Description and Data Sources
3.2.1. Explained Variable
To evaluate the climate adaptation effects of the NFCP in mitigating urban EH risks, this study adopts the annual number of extreme high temperature days as the sole core dependent variable. EH events represent the most direct and significant manifestation of climate change-induced urban thermal risks, and their frequency provides an accurate reflection of a city’s exposure to heat-related health threats, energy stress, and intensified urban heat island effects [28,29]. Therefore, the number of extreme high temperature days serves as a key indicator for assessing improvements in the urban thermal environment [30]. According to the standard meteorological definition used by China’s meteorological authorities, a day is classified as a “high temperature day” if the daily maximum temperature reaches or exceeds 35 °C. Based on this criterion, this study compiles daily meteorological records for each city and sums all days in a given year that meet the high-temperature threshold to obtain the number of extreme high temperature days (EHdays) for each city. The construction process is defined as follows [31]:
In this formulation, EHdaysit denotes the number of extreme high-temperature days in city i during year t. MaxTempitd represents the maximum daily temperature of city i on day d in year t. I(·) is an indicator function that takes the value of 1 when the specified condition is satisfied and 0 otherwise. This indicator has two main advantages. First, the number of extreme high-temperature days captures the frequency of heat events, offering a more accurate representation of the abruptness and severity of EH than a simple annual average temperature. Second, it is directly linked to the mechanisms through which high temperatures affect public health, energy demand, infrastructure safety, and urban heat island intensity, providing strong policy relevance and interpretability.
3.2.2. Explanatory Variable
NFCP: The National Forest City initiative is characterized by a staggered designation process, whereby cities receive official recognition in different years [32,33]. This feature provides clear temporal variation that is well suited for identifying policy effects. In the empirical setting, this study determines the year in which each city was formally conferred the title of National Forest City based on the annual announcements issued by the National Forestry and Grassland Administration. For any given city, the year of designation and all subsequent years are treated as the policy implementation period, whereas all years prior to designation are regarded as the pre-policy period. Accordingly, a binary policy variable is constructed to indicate whether city i in year t is exposed to the NFCP.
3.2.3. Control Variables
To accurately estimate the impact of the NFCP on EH days, this study incorporates a set of control variables to mitigate potential confounding effects. Specifically, the controls include industrial structure (is1), measured by the share of the tertiary sector in GDP, which reflects the modernization level of the urban economic structure; labor force structure (is2), represented by the proportion of employment in the tertiary sector, capturing changes in the labor market; land economic density (ea), defined as the ratio of regional GDP to land area, indicating land-use efficiency and the degree of urbanization; population density (pd), measured as the number of permanent residents per square kilometer, representing urban crowding and the potential intensity of the heat island effect; economic growth rate (gdpg), which reflects regional economic performance and indirectly affects infrastructure development and climate adaptation capacity; fiscal expenditure intensity (fis), measured by the ratio of local fiscal expenditure to GDP, capturing the extent of government investment in urban greening and climate adaptation; and financial development level (fin), defined as the ratio of bank loans to deposits, indicating capital liquidity and the ability to support infrastructure investment. Together, these variables help control for differences in economic development, urban scale, fiscal capacity, and financial activity, thereby ensuring a more accurate identification of the policy effect of the National Forest City initiative. The definition of the main variables in this paper is shown in Table 1.

Table 1.
Variable Definitions.
3.2.4. Mechanism Variables
To more comprehensively evaluate the mitigating effects of the NFCP on EH, this study incorporates several moderating variables in addition to the core policy variable. These moderators help reveal how different urban characteristics condition the policy’s effectiveness, thereby capturing the heterogeneity of policy impacts across cities. Specifically, GCR, UCC, and UGQ may all influence the strength of the NFCP’s cooling effect.
GCR is a key indicator of the health of the urban ecological environment, generally referring to the proportion of green areas—such as parks, forests, and grasslands—within a city’s built-up area [34]. Higher levels of GCR typically indicate more abundant green infrastructure, which can effectively regulate urban microclimates, reduce heat island intensity, and alleviate EH events. In this study, the greening coverage ratio of built-up areas is used as a proxy for GCR.
UCC, particularly annual average temperature, represent an important determinant of the urban thermal environment [35]. Cities with higher background temperatures often face more severe heat island effects and more frequent EH events, resulting in stronger demand for green infrastructure and potentially greater temperature-mitigation benefits from the NFCP. Conversely, in cities with cooler climates and fewer EH events, the policy’s cooling effect may be weaker. Annual average temperature therefore serves as a key indicator for assessing the moderating role of climate conditions in shaping NFCP effectiveness across different climatic contexts.
UGQ goes beyond the mere quantity of green space and encompasses multiple dimensions, including ecological functionality, plant species diversity, and vegetation health [36]. High-quality green spaces typically exhibit stronger ecological regulatory capacities—such as higher leaf area index (LAI) and greater evapotranspiration potential—which can effectively reduce surface temperatures and mitigate EH. In contrast, green spaces with poor vegetation health or low biodiversity may occupy large areas but provide limited cooling benefits. Given the multidimensional and largely unobservable nature of UGQ at the city level, this study employs the Normalized Difference Vegetation Index (NDVI) as a proxy measure for UGQ. NDVI captures vegetation density, coverage, and physiological vigor, and has been widely used in remote-sensing-based studies to assess urban ecological conditions and vegetation quality. The NDVI data used in this study are obtained from publicly available satellite-based remote sensing products. For each city and year, NDVI values are extracted from the underlying raster data and aggregated by calculating the annual average NDVI within the urban built-up area. These city-level NDVI averages are then used to construct the UGQ indicator reported in Table 2 and employed in the subsequent empirical analyses. It should be noted that NDVI does not measure specific landscape attributes directly, but serves as a consistent and reproducible proxy for overall urban UGQ by reflecting spatial and temporal variations in vegetation health and density across cities. This approach allows for meaningful cross-city and intertemporal comparisons in a large-sample panel setting.
Table 2.
Matching Test Results.
3.2.5. Data Cleaning and Sources
The panel data used in this study consist primarily of the dependent variable, the key explanatory variable, the mechanism variables, and a set of control variables. These data are sourced from a variety of channels, including statistical yearbooks, meteorological datasets, and remote sensing products. During the data-cleaning process, an initial assessment of data completeness was conducted. Cities with severe missingness in consecutive years—such as those exhibiting high rates of missing values for key variables or substantial disruptions in their time series—were removed to ensure the stability of the panel structure and the reliability of the estimation results. For observations with only minor missing values, appropriate imputation methods were applied; specifically, linear interpolation was used for annual data to preserve continuity and maintain smooth temporal trends. Prior to merging the datasets, all variables underwent standardization procedures, including the harmonization of city names, verification of time dimensions, and spatial coordinate alignment, to ensure accurate correspondence across data sources.
The data used in this study consist of four main components. First, the dependent variable, the number of EH days, is derived from daily maximum temperature records provided by the China Meteorological Administration, based on which the annual count of EH days is calculated by the authors. Second, the key explanatory variable, the NFCP, is obtained from the annual designation announcements released by the National Forestry and Grassland Administration. Third, the mechanism variables include GCR in built-up areas, sourced from the China Urban Statistical Yearbook, urban mean temperature, obtained from the National Centers for Environmental Information of the National Oceanic and Atmospheric Administration (NOAA), and the NDVI vegetation index, extracted from MODIS remote sensing products. Fourth, the control variables are collected from the China Statistical Yearbook, the China Urban Statistical Yearbook, and various local statistical yearbooks, and include indicators such as industrial structure, labor structure, land economic density, population density, economic growth rate, fiscal expenditure intensity, and financial development level. By integrating data from multiple sources and conducting systematic data cleaning, this study constructs a high-quality panel dataset covering a large number of cities over multiple years, which provides a robust foundation for the subsequent empirical analysis. Table 3 presents the descriptive statistics of the main variables used in this study.
Table 3.
Descriptive Statistics.
Table 4 presents the pairwise Pearson correlation coefficients among the dependent variable, the policy variable, and the main control variables. Overall, the correlations are generally modest in magnitude, and no pairwise correlation exceeds conventional thresholds that would raise concerns about multicollinearity. This suggests that the explanatory variables capture distinct dimensions and that multicollinearity is unlikely to bias the regression estimates. Table 4 reports the variance inflation factor (VIF) diagnostics for the explanatory variables. All VIF values are well below conventional thresholds, with a mean VIF of 1.29, indicating that multicollinearity is not a concern in the regression analysis. This suggests that the explanatory variables capture distinct dimensions and that the estimated coefficients are unlikely to be distorted by collinearity.
Table 4.
Pairwise Correlation Matrix of Main Variables and Variance Inflation Factor (VIF) Diagnostics.
4. Empirical Analysis
4.1. Benchmark Regression Analysis
Table 5 reports the baseline regression results for the impact of the NFCP on EH mitigation. Across all model specifications, the estimated coefficients of the core explanatory variable NFCP are consistently negative and statistically significant in most cases, indicating that the policy effectively reduces the number of EH days in cities. In the most basic specification (column 1), the coefficient of NFCP is −2.496 and significant at the 5 percent level, providing preliminary evidence that the implementation of the policy is associated with a decline in EH days. After controlling for city fixed effects (column 2), the policy coefficient increases in magnitude to −3.324 and becomes significant at the 1 percent level, suggesting that the policy effect becomes stronger once unobserved time-invariant city characteristics are taken into account. Column 3 excludes control variables but retains both city and year fixed effects. NFCP remains negative and statistically significant, confirming the robustness of the policy effect. Column 4 incorporates the full set of control variables together with two-way fixed effects, yielding a coefficient of −2.996, which remains significant at the 1 percent level. This suggests that the NFCP reduces the number of EH days by approximately three days per year, demonstrating a stable and persistent effect. Furthermore, column 5 applies clustered robust standard errors at the city level to address potential within-city correlation. The NFCP coefficient remains significant at the 5 percent level and is nearly identical in magnitude, further strengthening the credibility of the findings. Overall, regardless of whether control variables are included, whether fixed effects are specified, or whether standard errors are clustered at the city level, the sign and statistical significance of the NFCP coefficient remain highly consistent. These results indicate that the NFCP significantly mitigates EH under various model settings. Accordingly, Research Hypothesis 1 is supported.
Table 5.
Baseline Regression Results.
4.2. Parallel Trend Test
Before identifying the causal effect of the NFCP on EH days using the multi-period DID framework, a key prerequisite is that the treatment and control groups share a common trend prior to policy implementation—that is, the parallel trends assumption must hold [26,37]. To examine this assumption, this study applies the event-study estimation method based on the imputation approach proposed by Borusyak et al. (2024) [38], and estimates the dynamic effects of the policy before and after implementation. The resulting coefficients are plotted in Figure 1. In the figure, the red dots on the left represent the pre-treatment coefficients. It can be observed that during the approximately ten periods prior to policy implementation, the estimated coefficients fluctuate closely around zero, with confidence intervals largely crossing zero and showing no systematic upward or downward trend. This indicates that, before the NFCP was implemented, the treated and control cities exhibited essentially parallel evolution in EH days, without any diverging trends. Therefore, the parallel trends assumption receives empirical support. In contrast, the blue dots on the right illustrate the dynamic post-treatment effects, which are significantly negative and increasingly pronounced over time, indicating that the NFCP’s mitigating effect on EH strengthens progressively after implementation. However, this part reflects the identification of policy effects and is distinct from the purpose of testing the parallel trends assumption—the key lies in the stability of the pre-treatment coefficients. In sum, based on the dynamic estimates from the event-study analysis, the implementation of the NFCP did not alter the relative trends between the treatment and control groups prior to treatment. Thus, the parallel trends assumption is clearly supported by the data.
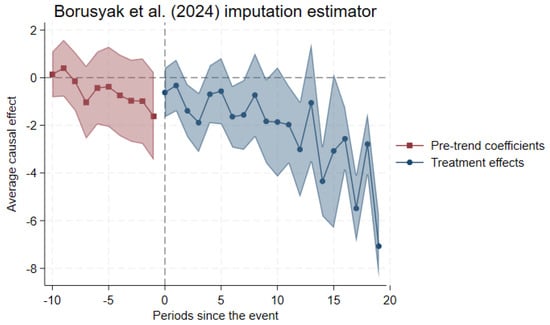
Figure 1.
Parallel Trend Test Results [38].
4.3. Robustness Test
4.3.1. Placebo Test
A placebo test is widely used to assess the robustness of DID estimations and to rule out spurious causal relationships. The core idea is straightforward: if the impact of the NFCP is truly causal, then artificially assigning “fake policy treatments” should not yield statistically significant effects. Conversely, if randomized pseudo-policy shocks generate significant coefficients, this would suggest potential identification bias or omitted variable interference in the model [39]. Therefore, the placebo test simulates a counterfactual world in which no real policy exists, examining whether the DID model erroneously detects a “false policy effect,” thereby enhancing confidence in the validity of the actual estimates. In implementation, this study conducts a placebo test using a random permutation approach. The procedure includes the following steps. First, the actual implementation years of the NFCP are randomly reassigned across sample cities, and this process is repeated 1000 times to ensure that the placebo distribution is statistically representative. Second, for each randomized assignment, a DID regression is re-estimated and the resulting “pseudo-policy effect” is recorded. Third, all 1000 estimated coefficients are aggregated to generate the placebo distribution, and a kernel density plot is drawn to visualize the range of effect sizes produced under randomized policy assignment. Finally, by comparing the true policy coefficient with the placebo distribution, we assess whether the real effect significantly deviates from what would be expected by chance.
The criterion for passing the placebo test is that the true policy effect must lie outside the tail region of the placebo distribution, typically beyond the 95% or 99% confidence interval. If so, the difference between the real effect and the randomly generated effects is statistically significant, indicating that the observed policy impact cannot be attributed to random noise. Figure 2 presents the kernel density distribution of the placebo estimates. The red density curve, derived from 1000 random permutations, exhibits a symmetric distribution highly concentrated around zero, suggesting that randomly assigning policy years does not produce systematic or significant “false effects.” In contrast, the vertical line representing the true policy effect lies clearly outside the support of the placebo distribution, with no overlap with the dense red region, demonstrating that the actual NFCP effect is far stronger than any effect generated by random assignment. In conclusion, the placebo test is successfully passed, further confirming that the DID results in this study are robust and possess credible causal interpretability.
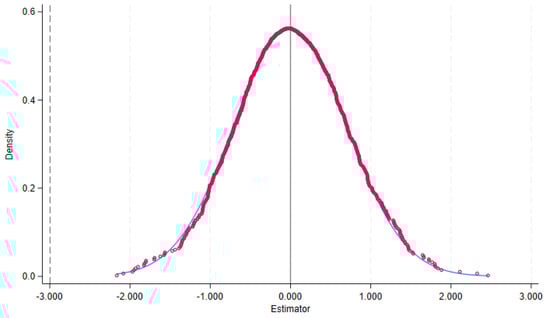
Figure 2.
Placebo Test Results.
4.3.2. PSM-DID
To further mitigate potential biases arising from sample selection, this study employs the Propensity Score Matching (PSM) method to match treated and control cities, ensuring greater comparability between the two groups prior to policy implementation. The matching results are presented in Table 2 and Figure 3.
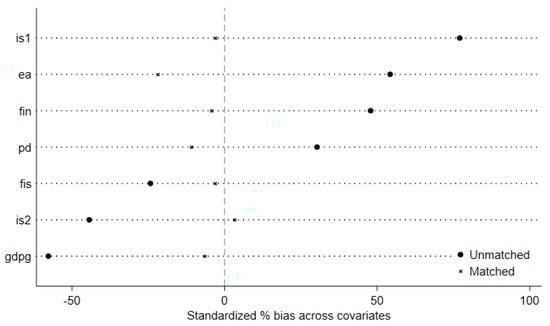
Figure 3.
Results of the Matching Test.
Table 2 reports the mean differences and standardized biases of all control variables between the treated and control groups before and after matching. Prior to matching, substantial disparities exist across multiple covariates. For instance, the standardized biases of industrial structure (is1), labor structure (is2), land economic density (ea), and population density (pd) generally fall within the 30%–80% range, indicating that policy-designated cities differ markedly from non-policy cities in terms of economic structure, demographic characteristics, and other attributes. After conducting one-to-one nearest-neighbor matching, however, the standardized biases of all variables decline significantly to below 10%. Variables such as is1, is2, fis, and fin exhibit reductions in bias exceeding 85%. Moreover, post-matching t-tests fail to reject the null hypothesis of no mean difference, indicating that the covariate balance between treated and control cities has been effectively achieved.
Figure 3 provides additional validation through covariate balance diagnostics. The black solid dots represent the standardized biases before matching, which are widely dispersed and far from zero, reflecting pronounced imbalance. In contrast, the gray “×” markers represent post-matching biases, which cluster closely around zero and show substantial convergence toward balance. Overall, the PSM procedure successfully eliminates systematic differences between the treated and control groups, substantially enhancing sample comparability and providing a reliable basis for the subsequent robustness regressions.
After completing the matching procedure and excluding cities without suitable matches, this study re-estimates the regression using the matched sample. The results are reported in column (1) of Table 6. As shown, the estimated coefficient of the core explanatory variable NFCP is −2.919 and is statistically significant at the 5 percent level. This indicates that even when restricting the analysis to cities with high pre-policy comparability, the NFCP continues to significantly reduce the number of EH days. In other words, after eliminating potential sample selection bias, the central conclusion of this study remains robust.
Table 6.
Robustness Test Result.
4.3.3. Replace Sample Intervals
To further assess the robustness of the findings, this study adjusts the sample period by excluding the early years of observation (2000–2010) and retaining only the data from the period during which the policy was more intensively implemented. This approach aims to eliminate potential sources of bias arising from long-term structural trends in urban climate change, inconsistencies in early statistical practices, or lower measurement accuracy in EH records. The regression results are reported in column (2) of Table 6, where the coefficient for the NFCP is −2.126 and remains significant at the 5 percent level. This indicates that even after removing the early sample years, the policy continues to significantly reduce the number of EH days. Therefore, the core conclusion of this study does not hinge on the specific temporal scope of the data, demonstrating strong robustness.
4.3.4. Changing the Clustering Level
In the baseline regression, this study employs city-level clustered robust standard errors. To examine whether the results are sensitive to the choice of clustering level, the clustering is adjusted from the city level to the province level, and the model is re-estimated. This adjustment accounts for potential issues such as provincial policy spillovers, regional climate correlations, and intra-province error dependence among cities. The regression results are reported in Column (3) of Table 6, where the coefficient of NFCP remains −2.996 and statistically significant at the 5 percent level. This finding indicates that the policy effect remains robust even under the more conservative province-level clustering approach. In other words, after addressing the potential underestimation of standard errors caused by within-province error correlation, the core conclusion of this study continues to hold.
4.4. Mechanism Analysis
To further examine the contextual variation in the effects of the NFCP, this study considers three ecological and urban environmental characteristics—GCR, UCC, and UGQ—as moderating factors. Interaction terms between each of these variables and the policy indicator (NFCP) are constructed to assess whether the policy’s cooling effect differs across cities with varying ecological foundations and climatic conditions. The detailed regression results are reported in Table 7. It should be noted that this analysis is not intended to identify precise causal mechanisms; rather, it empirically examines heterogeneity in the policy’s effects across different ecological and climatic contexts, thereby highlighting the conditional nature of the observed policy impacts.
Table 7.
Mechanism Analysis Results.
4.4.1. Green Coverage Rate
Column (1) of Table 7 reports the moderating effect of GCR. First, the coefficient of NFCP is −1.803, significant at the 5% level, indicating that even without considering the interaction term, the NFCP itself already significantly reduces the number of EH days. The interaction term NFCP × GCR has a coefficient of −1.287, also significant at the 5% level, which implies that as a city’s GCR increases, the negative impact of the NFCP on EH days further strengthens—that is, the better the greening foundation, the stronger the policy’s cooling effect. In addition, the coefficient of GCR alone is 0.512 and significant at the 1% level, suggesting that in the absence of the policy, a simple cross-sectional correlation exists in which higher GCR is associated with more EH days; this result reflects correlation rather than causal impact. Taken together, the significantly negative coefficient of the interaction term provides key evidence for the mechanism: GCR plays a significant amplifying (moderating) role in strengthening the effect of the NFCP on mitigating EH.
4.4.2. Urban Climate Conditions
The moderating effect of UCC, measured by annual mean temperature, is reported in Column (2) of Table 7. The coefficient of NFCP is −2.476 and remains significant at the 5 percent level, indicating that the policy continues to exhibit a notable cooling effect under the baseline setting. The interaction term NFCP × UCC carries a coefficient of −0.214, significant at the 1 percent level, suggesting that in cities with higher annual mean temperatures, the NFCP exerts a stronger mitigating effect on EH days. In other words, the hotter the climate, the greater the marginal impact of the policy. Meanwhile, the coefficient of UCC itself is 0.078 and statistically significant at the 1 percent level, which is consistent with the fact that cities with warmer climates tend to experience more EH days. Overall, the significantly negative coefficient of NFCP × UCC indicates that the climatic environment in which a city is situated amplifies the effectiveness of the NFCP. Greater climatic stress enhances the policy’s capacity to serve as a climate adaptation measure.
4.4.3. Urban Green Space Quality
Column (3) of Table 7 reports the moderating effect of UGQ, measured by the NDVI. The coefficient of NFCP is −1.129 and is significant at the 1% level, further confirming that the NFCP exerts a strong overall mitigating effect on EH. The interaction term NFCP × UGQ has a coefficient of −2.036, which is highly significant at the 1% level and is the largest in absolute value among the three interaction terms. This indicates that as UGQ improves, the NFCP’s effect in reducing EH days becomes substantially stronger. The coefficient of UGQ itself is −0.684 and significant at the 1% level, suggesting that, after controlling for other factors, higher-quality green spaces are associated with fewer EH days—consistent with the theoretical expectation that high-quality vegetation possesses stronger microclimate regulation functions. The significantly negative coefficient of the interaction term further demonstrates that the NFCP mitigates EH in part through the pathway of enhancing UGQ. Overall, these results provide empirical support for Hypothesis 2.
It should be noted that the moderating analysis in this study focuses on ecological and climatic characteristics—namely GCG, UCC, and UGQ—in order to examine how the effects of the NFCP vary across different environmental contexts. While these variables capture key dimensions directly related to urban greening and thermal regulation, they do not exhaust all possible factors that may shape policy effectiveness. Other social, economic, or demographic characteristics—such as income levels, population density, urban form, or residents’ adaptive behaviors—may also influence the magnitude of policy impacts. The omission of these factors implies that the moderating results should be interpreted as context-specific heterogeneity rather than a comprehensive explanation of all underlying mechanisms.
The staggered DID framework adopted in this study is designed to evaluate the average effects of the NFCP across a large and diverse sample of Chinese cities. Differences in baseline green infrastructure and regional climate conditions do not undermine the applicability of the model; rather, they constitute an important source of variation that the analysis explicitly examines through heterogeneity and moderating effects. Nevertheless, the estimated results should be interpreted as context-dependent. The accuracy and magnitude of the estimated policy effects may vary across cities with substantially different levels of green infrastructure or climatic conditions. Accordingly, while the model is well suited for assessing policy outcomes within the heterogeneous urban contexts considered in this study, caution is warranted when extrapolating the findings to urban settings with fundamentally different climatic regimes or institutional environments.
5. Heterogeneity Analysis
To further examine whether the effects of the NFCP vary across different types of cities, this study conducts a heterogeneity analysis from the perspectives of resource endowment, industrial foundations, and urban hierarchy.
5.1. Resource Endowment
To explore heterogeneity from the dimension of resource endowment, this section examines whether the NFCP produces differentiated impacts in resource-based and non–resource-based cities. A city’s dependence on natural resources may substantially shape its economic structure, ecological baseline, and capacity for green space development, thereby influencing the effectiveness of the policy. Following the National Plan for Sustainable Development of Resource-Based Cities (2013–2020) issued by the National Development and Reform Commission, the sample is divided into resource-based and non–resource-based cities, and regressions are conducted separately for each group. The results are reported in Columns (1) and (2) of Table 8. In resource-based cities, the coefficient of NFCP is −0.459 and statistically insignificant. In contrast, in non–resource-based cities, the NFCP coefficient is −4.089 and significant at the 5% level. These findings indicate that the NFCP has a considerably stronger mitigating effect on EH days in non–resource-based cities.
Table 8.
Results of the Heterogeneity Analysis.
This result is consistent with practical reality. Resource-based cities have long relied on resource extraction and heavy industries, which typically result in energy-intensive production, degraded ecological conditions, and limited green infrastructure capacity. Under such constraints, the NFCP may face difficulties in producing noticeable microclimate improvements in the short term. In comparison, non–resource-based cities tend to have more diversified economic structures, better ecological foundations, and more flexible urban spatial configurations, creating more favorable conditions for green space expansion and ecological network construction. Their stronger fiscal capacity and governance performance further facilitate the translation of policy implementation into actual greening improvements and microclimate benefits. Therefore, it is reasonable that the NFCP demonstrates more substantial EH mitigation effects in non–resource-based cities.
5.2. Industrial Foundation
The foundational industrial structure of a city may influence the effectiveness of the NFCP. To examine whether policy impacts differ across industrial contexts, this study follows the official classification of old industrial cities as defined in revitalization plans issued by the National Development and Reform Commission and other ministries (such as the National Plan for the Adjustment and Transformation of Old Industrial Bases). Based on this classification, sample cities are divided into old industrial cities and non–old industrial cities, and regressions are conducted separately for the two groups. The results, presented in Columns (3) and (4) of Table 8, indicate that the coefficient of NFCP is −1.692 in old industrial cities, whereas it reaches −3.462 in non–old industrial cities, with the latter being statistically significant. This suggests that the NFCP has a stronger mitigating effect on EH days in non–old industrial cities compared with old industrial cities.
This difference is well aligned with real-world conditions. Old industrial cities have long relied on heavy industries, including petrochemicals, equipment manufacturing, and energy processing. These cities typically feature a heavy industrial structure, high energy consumption, accumulated pollution, and substantial challenges for ecological restoration. Constrained by historical industrial layouts and extensive industrial land occupation, green space expansion is limited, making it difficult for forest-city construction to produce significant ecological and microclimatic benefits in the short term. In contrast, non–old industrial cities tend to have a lighter and more diversified industrial structure, a stronger ecological foundation, and greater flexibility in land-use. These characteristics provide more space and resources for greening initiatives and ecological restoration. Consequently, the NFCP can more readily translate into substantial green space expansion and enhanced ecosystem services in such cities, thereby exerting a more pronounced mitigating effect on EH.
5.3. City Level
The purpose of categorizing cities by administrative hierarchy is to better capture structural differences across cities in terms of economic development, technological capacity, governance efficiency, and policy implementation intensity. These differences may substantially influence the execution and effectiveness of the NFCP, leading to heterogeneous policy outcomes across city tiers. Accordingly, this study classifies the sample into High-level Cities (including provincial capital and sub-provincial cities) and General Cities, and conducts separate regressions for each group. The regression results, presented in Table 8, show that in the sample of High-level Cities, the coefficient of NFCP is −3.968 and statistically significant. In contrast, for General Cities, the coefficient is −2.081 and fails to reach statistical significance. These findings indicate that the NFCP exhibits a more pronounced mitigating effect on EH days in High-level Cities than in General Cities.
This pattern is grounded in clear real-world conditions. High-level Cities generally possess stronger fiscal capacity, better governance performance, higher planning and implementation capabilities, and more advanced technical conditions. These advantages enable them to conduct large-scale greening projects, improve UGQ, and build ecologically functional green networks more effectively. Consequently, the NFCP is more likely to translate into substantial ecological benefits in these cities. Moreover, High-level Cities often experience more severe urban heat island effects and therefore exhibit stronger demand for urban greening and climate adaptation measures, amplifying the marginal policy effect. In contrast, General Cities tend to face constraints in fiscal resources, technological capacity, and planning enforcement. As a result, the scale of greening and ecological improvements that can be achieved following policy implementation is more limited, making the NFCP’s mitigating effect on EH less pronounced compared with High-level Cities.
6. Conclusions and Policy Recommendations
6.1. Conclusions
Against the backdrop of global warming and increasingly severe urban heat risks, enhancing climate adaptation through urban green infrastructure has become an important policy concern. Using the NFCP as the focus of analysis, this study employs panel data from Chinese prefecture-level cities from 2000 to 2023 and applies a staggered DID model to examine the relationship between the policy and urban EH outcomes. The results indicate that, after controlling for relevant socioeconomic factors, the implementation of the NFCP is statistically associated with a reduction in the annual number of EH days, suggesting that the policy may contribute, to some extent, to mitigating urban heat exposure. The dynamic analysis shows that the estimated effect is not immediate but gradually strengthens and stabilizes over time, a pattern that may be related to the progressive development and maturation of urban forest systems. Mechanism analyses further suggest that GCR, UCC, and UGQ play moderating roles in shaping the observed policy effects. Cities with higher GCR, greater climatic stress, or better UGQ tend to exhibit more pronounced associations between NFCP implementation and reductions in EH days, implying that baseline ecological conditions and local climatic context are important in understanding policy heterogeneity. In addition, heterogeneity analyses indicate that the estimated effects are relatively stronger in non-resource-based cities, non-old-industrial cities, and cities with higher administrative status, highlighting the potential influence of resource endowments, industrial structure, and governance capacity on policy implementation and outcomes. Overall, this study provides empirical evidence from a climate adaptation perspective that contributes to the understanding of the relationship between the NFCP and urban EH.
6.2. Limitations
This study has several limitations. First, the dependent variable—the annual number of days with maximum temperature exceeding 35 °C—captures the frequency of EH events but does not reflect their intensity or duration. Future research could incorporate more comprehensive heat indicators, subject to data availability, to provide a fuller assessment of policy impacts. Second, potential spatial spillover effects are not explicitly modeled. Given the spatial dependence of both EH and urban greening, future studies could employ spatial econometric approaches to examine inter-city spillovers and regional policy interactions. Third, although the NFCP is a multi-dimensional and comprehensive initiative, the empirical analysis primarily identifies its average effect based on whether the policy is implemented, without further distinguishing among specific policy dimensions or implementation intensity. This limits a more granular assessment of the policy’s internal mechanisms. Fourth, while alternative robustness checks based on structural break panel regressions could, in principle, offer additional evidence on policy-induced changes before and after implementation, the staggered nature of the policy adoption across cities makes it difficult to define a common structural break point. As a result, such approaches are not pursued in this study and may be explored in future research.
Future research may further explore the synergistic mechanisms between the NFCP and other urban heat-risk mitigation tools, or incorporate micro-level behavioral data to examine residents’ adaptive responses. It should be noted, however, that the integration of micro-level behavioral data poses both practical and methodological challenges, including data availability and privacy concerns, the difficulty of linking individual behavior to policy exposure, and potential endogeneity and measurement issues. Addressing these challenges would require richer datasets and more refined empirical strategies, but could ultimately provide deeper insights into the micro-foundations of urban climate adaptation and support the development of more effective, climate-resilient cities.
6.3. Policy Recommendations
Based explicitly on the empirical results reported in this study, this section derives policy recommendations aimed at improving the effectiveness of urban greening interventions and enhancing cities’ climate adaptation capacity. Rather than offering general policy advocacy, the recommendations below are directly grounded in the estimated effects, dynamic patterns, and heterogeneity identified in the empirical analysis of the NFCP.
- (1)
- Align urban forest planning with both green coverage expansion and functional quality enhancement. The empirical results show that the mitigating effect of the NFCP on EH days is significantly stronger in cities with higher GCR and better UGQ. This finding implies that expanding green space alone is insufficient to fully realize the climate adaptation potential of urban forests. Accordingly, urban forest planning should simultaneously prioritize increasing green coverage and improving the spatial configuration and ecological functionality of green spaces. In practice, this suggests that greening efforts should be strategically directed toward areas with high heat exposure and dense populations, where marginal cooling benefits are empirically shown to be larger. Measures such as enhancing ecological connectivity, optimizing vegetation structure, and integrating green spaces into a coherent blue–green infrastructure network can help translate green expansion into more effective and sustained heat mitigation, consistent with the moderating mechanisms identified in this study.
- (2)
- Design differentiated fiscal support mechanisms based on climate risk and ecological foundations. The moderating and heterogeneity analyses indicate that the effectiveness of the NFCP varies systematically with local climatic heat stress and baseline ecological conditions. Cities experiencing higher heat stress and possessing weaker green infrastructure tend to exhibit stronger marginal associations between policy implementation and reductions in EH days. This empirical pattern provides direct support for adopting differentiated fiscal strategies rather than uniform funding allocation. Specifically, fiscal transfers and greening-related funding programs may incorporate indicators of climate risk exposure and existing ecological foundations, directing resources toward cities and districts where adaptation returns are empirically higher. Such a targeted approach is more consistent with the study’s findings than across-the-board subsidies and can improve the efficiency of public investment in climate adaptation. It should be emphasized that the policy implications derived from this study are conditional rather than universally applicable. The effectiveness of the NFCP may vary across cities with differing climatic conditions, governance capacities, and stages of urban green development. In particular, cities facing greater heat stress, exhibiting stronger institutional capacity, or possessing relatively solid green infrastructure foundations may be better positioned to translate policy initiatives into tangible climate adaptation outcomes. Accordingly, the empirical evidence suggests that fiscal support for urban greening should be strategically targeted rather than uniformly allocated.
- (3)
- Strengthen governance capacity to support effective policy implementation. The heterogeneity analysis further reveals that the estimated effects of the NFCP are relatively stronger in non-resource-based cities, non-old-industrial cities, and cities with higher administrative status. These results suggest that governance capacity and institutional conditions may play an important role in shaping the translation of policy designation into effective on-the-ground outcomes. Based on this empirical evidence, strengthening governance capacity can be viewed as a complementary condition for realizing the climate adaptation benefits of urban greening policies. In this context, promoting multi-stakeholder collaboration, improving cross-departmental coordination, and mobilizing diversified financing mechanisms may help reduce implementation gaps and enhance policy effectiveness. While these governance-related measures are not directly tested in the empirical models, they follow logically from the observed heterogeneity in policy outcomes across cities with different institutional capacities.
- (4)
- Integrate the NFCP with other urban heat-risk mitigation measures to enhance overall effectiveness. The dynamic analysis shows that the cooling effects associated with the NFCP emerge gradually and stabilize over time, highlighting the long-term and cumulative nature of urban forest development. This temporal pattern implies that the NFCP should not be viewed as a stand-alone solution for urban heat mitigation. Instead, it is more appropriately understood as a structural, long-term adaptation instrument that can be complemented by other short- and medium-term heat-risk mitigation measures, such as heat-resilient urban design, cool roofs and pavements, blue infrastructure, ventilation corridors, and building-level energy-efficiency improvements. Coordinating urban forest development with these measures may generate synergistic effects by combining the sustained ecosystem services of green infrastructure with the more immediate benefits of engineering and technological interventions. This recommendation represents a policy inference grounded in the study’s findings on the cumulative and context-dependent nature of greening effects.
In addition, the NFCP should be viewed as a complementary component within a broader urban heat-risk mitigation toolkit rather than a stand-alone solution. Its long-term ecological cooling effects can be reinforced when combined with other urban heat adaptation measures, such as heat-resilient urban design, cool roofs and pavements, blue infrastructure (e.g., rivers, lakes, and wetlands), ventilation corridors, and building-level energy-efficiency improvements. While engineering and technological interventions often yield relatively rapid but localized cooling benefits, urban forest development provides sustained and system-wide ecosystem services. Coordinating the NFCP with these short-term and sector-specific measures may therefore generate synergistic effects, enhancing overall urban resilience to EH.
Author Contributions
Conceptualization, Y.M. and S.Z.; methodology, Y.M.; software, Y.M.; validation, Y.M., S.Z. and Y.G.; formal analysis, Y.M.; investigation, Y.M.; resources, Y.M.; data curation, Y.M.; writing—original draft preparation, S.Z.; writing—review and editing, S.Z.; visualization, Y.G.; supervision, Y.M.; project administration, Y.M.; funding acquisition, S.Z. All authors have read and agreed to the published version of the manuscript.
Funding
This research received no external funding.
Data Availability Statement
All data used in this study are available from the corresponding author upon request.
Acknowledgments
During the preparation of this manuscript, the author(s) used ChatGPT 4.0 (OpenAI) for language polishing. The authors have reviewed and edited the generated content and take full responsibility for its accuracy and integrity.
Conflicts of Interest
The authors declare no conflicts of interest.
Abbreviations
| National Forest City Policy | NFCP |
| Extreme Heat | EH |
| Green Coverage Rate | GCR |
| Urban Climate Conditions | UCC |
| Urban Green Space Quality | UGQ |
| Difference-in-differences | DID |
References
- Gong, J.; Shi, X.; Wang, C.; Zhang, X. Extreme High Temperatures and Adaptation by Social Dynamics: Theory and Evidence from China. J. Econ. Behav. Organ. 2025, 234, 106989. [Google Scholar] [CrossRef]
- Xu, M.; Zhang, J.; Zhang, Z.; Wang, M.; Chen, H.; Peng, C.; Yu, D.; Zhan, H.; Zhu, Q. Global Responses of Wetland Methane Emissions to Extreme Temperature and Precipitation. Environ. Res. 2024, 252, 118907. [Google Scholar] [CrossRef] [PubMed]
- Zhang, J.; Chen, F. Impact of Extreme High Temperatures on Pollution Emissions of Enterprise: Evidence from China. J. Environ. Manag. 2024, 365, 121493. [Google Scholar] [CrossRef]
- Wei, S.; Li, X.; Wang, K.; Wang, T.; Piao, S. Two Decades of Persistent Greening in China despite 2023 Climate Extremes. Sci. China-Earth Sci. 2025, 68, 1064–1073. [Google Scholar] [CrossRef]
- Yang, Q.; Jiang, C.; Ding, T. Impacts of Extreme-High-Temperature Events on Vegetation in North China. Remote Sens. 2023, 15, 4542. [Google Scholar] [CrossRef]
- Zhang, S.; Zhang, C.; Cai, W.; Bai, Y.; Callaghan, M.; Chang, N.; Chen, B.; Chen, H.; Cheng, L.; Dai, H.; et al. The 2023 China Report of the Lancet Countdown on Health and Climate Change: Taking Stock for a Thriving Future. Lancet Public Health 2023, 8, e978–e995. [Google Scholar] [CrossRef]
- Ramakreshnan, L.; Aghamohammadi, N. The Application of Nature-Based Solutions for Urban Heat Island Mitigation in Asia: Progress, Challenges, and Recommendations. Curr. Environ. Health Rep. 2024, 11, 4–17. [Google Scholar] [CrossRef]
- Knight, T.; Price, S.; Bowler, D.; Hookway, A.; King, S.; Konno, K.; Richter, R.L. How Effective Is ‘Greening’ of Urban Areas in Reducing Human Exposure to Ground-Level Ozone Concentrations, UV Exposure and the ‘Urban Heat Island Effect’? An Updated Systematic Review. Environ. Evid. 2021, 10, 12. [Google Scholar] [CrossRef]
- Shen, W.; Liu, Q.; Ji, M.; He, J.; He, T.; Huang, C. Impacts of Urban Forests and Landscape Characteristics on Land Surface Temperature in Two Urban Agglomeration Areas of China. Sustain. Cities Soc. 2023, 99, 104909. [Google Scholar] [CrossRef]
- Zhang, Z.; Cenci, J.; Zhang, J. Policies for Equity in Access to Urban Green Space: A Spatial Perspective of the Chinese National Forest City Policy. Forests 2024, 15, 608. [Google Scholar] [CrossRef]
- Xia, X.; Hui, Y.; Chen, Y.; Zhang, S. The Role of Urban Forest Policies in Driving Green Innovation: Evidence from Chinese Cities. Forests 2024, 15, 1913. [Google Scholar] [CrossRef]
- Bowler, D.E.; Buyung-Ali, L.; Knight, T.M.; Pullin, A.S. Urban Greening to Cool Towns and Cities: A Systematic Review of the Empirical Evidence. Landsc. Urban Plan. 2010, 97, 147–155. [Google Scholar] [CrossRef]
- Oke, T.R. The Energetic Basis of the Urban Heat Island. Q. J. R. Meteorol. Soc. 1982, 108, 1–24. [Google Scholar] [CrossRef]
- Spronken-Smith, R.A.; Oke, T.R. The Thermal Regime of Urban Parks in Two Cities with Different Summer Climates. Int. J. Remote Sens. 1998, 19, 2085–2104. [Google Scholar] [CrossRef]
- Santamouris, M. Analyzing the Heat Island Magnitude and Characteristics in One Hundred Asian and Australian Cities and Regions. Sci. Total Environ. 2015, 512–513, 582–598. [Google Scholar] [CrossRef]
- Zhao, L.; Lee, X.; Smith, R.B.; Oleson, K. Strong Contributions of Local Background Climate to Urban Heat Islands. Nature 2014, 511, 216–219. [Google Scholar] [CrossRef]
- Li, L.; Zhan, W.; Hu, L.; Chakraborty, T.; Wang, Z.; Fu, P.; Wang, D.; Liao, W.; Huang, F.; Fu, H.; et al. Divergent Urbanization-Induced Impacts on Global Surface Urban Heat Island Trends since 1980s. Remote Sens. Environ. 2023, 295, 113650. [Google Scholar] [CrossRef]
- Peng, S.; Piao, S.; Ciais, P.; Friedlingstein, P.; Ottle, C.; Bréon, F.-M.; Nan, H.; Zhou, L.; Myneni, R.B. Surface Urban Heat Island Across 419 Global Big Cities. Environ. Sci. Technol. 2012, 46, 696–703. [Google Scholar] [CrossRef]
- Bolund, P.; Hunhammar, S. Ecosystem Services in Urban Areas. Ecol. Econ. 1999, 29, 293–301. [Google Scholar] [CrossRef]
- De Pauw, K.; Depauw, L.; Calders, K.; Caluwaerts, S.; Cousins, S.A.O.; De Lombaerde, E.; Diekmann, M.; Frey, D.; Lenoir, J.; Meeussen, C.; et al. Urban Forest Microclimates across Temperate Europe Are Shaped by Deep Edge Effects and Forest Structure. Agric. For. Meteorol. 2023, 341, 109632. [Google Scholar] [CrossRef]
- Smit, B.; Wandel, J. Adaptation, Adaptive Capacity and Vulnerability. Glob. Environ. Change 2006, 16, 282–292. [Google Scholar] [CrossRef]
- Zhou, D.; Zhao, S.; Liu, S.; Zhang, L.; Zhu, C. Surface Urban Heat Island in China’s 32 Major Cities: Spatial Patterns and Drivers. Remote Sens. Environ. 2014, 152, 51–61. [Google Scholar] [CrossRef]
- Gunawardena, K.R.; Wells, M.J.; Kershaw, T. Utilising Green and Bluespace to Mitigate Urban Heat Island Intensity. Sci. Total Environ. 2017, 584–585, 1040–1055. [Google Scholar] [CrossRef]
- Baker, A.C.; Larcker, D.F.; Wang, C.C.Y. How Much Should We Trust Staggered Difference-in-Differences Estimates? J. Financ. Econ. 2022, 144, 370–395. [Google Scholar] [CrossRef]
- Card, D.; Krueger, A.B. Minimum Wages and Employment: A Case Study of the Fast Food Industry in New Jersey and Pennsylvania. Am. Econ. Rev. 1993, 84, 772–793. [Google Scholar]
- Imbens, G.W.; Wooldridge, J.M. Recent Developments in the Econometrics of Program Evaluation. J. Econ. Lit. 2009, 47, 5–86. [Google Scholar] [CrossRef]
- Zhou, Z.; Zhong, S. Impact of Legal Commitments on Carbon Intensity: A Multi-Country Perspective. J. Environ. Manag. 2025, 373, 123696. [Google Scholar] [CrossRef] [PubMed]
- Delgado-Capel, M.J.; Egea-Carinanos, P.; Carinanos, P. Assessing the Relationship between Land Surface Temperature and Composition Elements of Urban Green Spaces during Heat Waves Episodes in Mediterranean Cities. Forests 2024, 15, 463. [Google Scholar] [CrossRef]
- Halecki, W. Beat the Heat: Stay or Stray? Exploring the Connection of Extreme Temperature Events, Green Space, and Impervious Surfaces in European Cities. Forests 2024, 15, 2194. [Google Scholar] [CrossRef]
- Gasser, A.T.; Lanz, B. Countervailing Effects of Extreme Maximum and Minimum Temperature Days on Conflict in Mainland Southeast Asia. Environ. Resour. Econ. 2025, 88, 3805–3839. [Google Scholar] [CrossRef]
- Martins, J.; Fraga, H.; Fonseca, A.; Santos, J.A.; Martins, J.; Fraga, H.; Fonseca, A.; Santos, J.A. Climate Projections for Precipitation and Temperature Indicators in the Douro Wine Region: The Importance of Bias Correction. Agronomy 2021, 11, 990. [Google Scholar] [CrossRef]
- Wang, Y.; Zou, F.; Guo, W.; Lu, W.; Deng, Y. Impact of Forest City Selection on Green Total Factor Productivity in China under the Background of Sustainable Development. Forests 2024, 15, 1064. [Google Scholar] [CrossRef]
- Hu, C.; Chen, J.; Dong, J. Impact of City Forests on Haze Reduction-Implementation of the National Forest City Policy in China. Forests 2023, 14, 703. [Google Scholar] [CrossRef]
- Lin, H.; Li, X.; Lin, H.; Li, X. The Role of Urban Green Spaces in Mitigating the Urban Heat Island Effect: A Systematic Review from the Perspective of Types and Mechanisms. Sustainability 2025, 17, 6132. [Google Scholar] [CrossRef]
- Chen, K.; Boomsma, J.; Holmes, H.A. A Multiscale Analysis of Heatwaves and Urban Heat Islands in the Western U.S. during the Summer of 2021. Sci. Rep. 2023, 13, 9570. [Google Scholar] [CrossRef] [PubMed]
- Upreti, M.; Kumar, A. Evaluating Functional Traits of Urban Green Spaces in Mitigating Land Surface Temperature in Megacities. Discov. Cities 2025, 2, 31. [Google Scholar] [CrossRef]
- Donald, S.G.; Lang, K. Inference with Difference-in-Differences and Other Panel Data. Rev. Econ. Stat. 2007, 89, 221–233. [Google Scholar] [CrossRef]
- Borusyak, K.; Jaravel, X.; Spiess, J. Revisiting Event-Study Designs: Robust and Efficient Estimation. Rev. Econ. Stud. 2024, 91, 3253–3285. [Google Scholar] [CrossRef]
- La Ferrara, E.; Chong, A.; Duryea, S. Soap Operas and Fertility: Evidence from Brazil. Am. Econ. J. Appl. Econ. 2012, 4, 1–31. [Google Scholar] [CrossRef]


Disclaimer/Publisher’s Note: The statements, opinions and data contained in all publications are solely those of the individual author(s) and contributor(s) and not of MDPI and/or the editor(s). MDPI and/or the editor(s) disclaim responsibility for any injury to people or property resulting from any ideas, methods, instructions or products referred to in the content. |
© 2026 by the authors. Licensee MDPI, Basel, Switzerland. This article is an open access article distributed under the terms and conditions of the Creative Commons Attribution (CC BY) license.