Abstract
Understanding the ecological processes that shape spatial patterns across different growth stages is crucial for revealing the mechanisms of species coexistence and community dynamics. This study investigates the spatial patterns and associations between the regeneration layer and the overstory layer in Quercus variabilis forests in northern China. Using spatial point pattern analysis, we analyzed the distribution of 2761 seedlings and 449 adult trees across twelve 20 × 20 m plots. Our results revealed a consistent pattern where seedlings exhibited significant spatial aggregation, best fitted by a simple Thomas process with an average cluster radius of 3.89 m calculated across all plots, while adult trees displayed a complete spatial random distribution. A marked reduction in local density from seedlings to adults, indicated by a self-thinning index greater than 1 in most plots, provided evidence for density-dependent mortality during stand development. However, bivariate analysis detected no significant spatial association or mark correlation between adult trees and seedlings in most plots, suggesting limited interaction between these layers after initial seedling establishment. These findings demonstrate a clear transition from clustered regeneration to randomly distributed adults, which is consistent with the potential roles of dispersal limitation, habitat filtering and competition processes, with implications for the management and conservation of temperate Quercus forest ecosystems.
1. Introduction
One key goal in ecology is to clarify ecological processes shaping the spatial distribution of species in forest communities and thereby explain the mechanisms behind species coexistence and the maintenance of biodiversity [1,2,3,4,5]. To this end, ecologists have proposed numerous theories and hypotheses, such as niche theory, neutral theory and the negative density dependence hypothesis, aiming to explain community assembly and the relative importance of different ecological processes in assembly from multiple perspectives. Niche theory holds that the niche occupied by a species in a community determines how different species coexist stably, and species with too similar resource use patterns cannot achieve stable coexistence [6]. It emphasizes that deterministic processes like habitat filtering and interspecific competition play important roles in community assembly [2]. In contrast, the community assembly process based on neutral theory considers aspects not addressed by niche theory, such as individual immigration and emigration, and mainly highlights the importance of stochastic processes and dispersal limitation in community assembly. Stochastic processes refer to the inherent uncertainty and variability in the reproduction, survival and dispersal of individuals within a community [7,8]. Dispersal limitation is an important inference of neutral theory, mainly referring to the inability of seeds to reach suitable germination sites due to local dispersal after leaving the parent tree, emphasizing the impact of the distance decay effect on community structure [9,10]. The negative density dependence hypothesis suggests that individuals of the same species are more vulnerable to natural enemies when aggregated or close to parent trees, which provides living space and resources for other species, thereby promoting species coexistence [11,12].
Spatial point patterns of tree species are an important structural characteristic of forest communities. They retain signatures of processes such as seed dispersal, competition, and habitat filtering, and provide insights into species coexistence, community dynamics, and ecosystem functions [13,14,15,16]. Therefore, describing and quantifying the spatial distribution characteristics of communities and further linking observed patterns to processes is the goal and challenge of spatial point pattern analysis [17,18]. For example, studies have found that within a maximum spatial neighborhood of 50 m, about half of the species pairs do not show significant spatial association patterns, and stochastic processes play the most important role in determining the assembly of recruit communities in the Barro Colorado Island plot [19,20]. However, deterministic processes such as habitat filtering and niche differentiation also drive community assembly during the recruitment stage [19]. Clustered distribution is one of the common distribution patterns in forest ecosystems [21,22]. Due to differences in seed or fruit morphology and dispersal vectors, there are species-specific differences in dispersal distances [23]. Habitat filtering usually leads to the spatial aggregation of species with similar functional traits, and only species with traits adapted to specific environmental conditions can survive in that environment [1]. Negative density dependence is one of the important processes driving species diversity [24], especially in the seedling stage of tropical forests [25], while there is less supporting evidence for the adult tree stage [26].
Environmental filtering is usually evaluated by first-order summary statistics and operates at large scales. Biotic interactions are detected by second-order summary statistics and act at small scales [13]. For example, polar bears cannot survive in rainforests, just as they cannot thrive in arid grassland areas at large scales. Competitive exclusion has virtually no impact when individuals are several kilometers apart, though it may affect individuals in close proximity at smaller spatial scales [27]. At smaller spatial scales, individuals in close proximity often engage in competition for limited resources, leading to the elimination of competitively weaker individuals and thereby giving rise to regular or uniform spatial distribution patterns [28]. Second-order summary statistics are key tools for identifying the type and scale of spatial patterns [29]. Three basic types of common research subjects exist. First is unmarked point patterns, where points are characterized only by their location and a priori types. They are further divided into univariate (one object type), bivariate (two object types), and multivariate (more than two object types) point patterns, with most analyses focusing on univariate point patterns. Second is qualitative marked point patterns, such as analyses using a posteriori labels like survival or death as qualitative marks. Third is marked point patterns, which provide a theoretical framework for tree competition. In these patterns, points represent tree locations, and characteristic values such as tree height or DBH (diameter at breast height) can serve as mark values [30].
The relative importance of ecological processes shifts throughout community succession. Dominant mechanisms in early stages frequently diminish as succession continues [31,32]. Within heterogeneous forest ecosystems, plants occupying distinct strata such as the regeneration layer and overstory layer are likewise shaped by distinct ecological processes [33]. Although spatial point pattern analysis has been applied in ecology for more than 30 years, most studies only focus on whether there is aggregation or association in the spatial distribution of species [13]. In particular, a fundamental goal of ecology is to understand how species interactions enable coexistence. However, the use of bivariate point pattern analysis for this purpose is far less common than univariate analysis, especially between the natural regeneration stage and the mature stage of forests [34].
In this study, we concentrate on the natural regeneration layer and overstory layer of Q. variabilis forests in northern China. As a dominant broad-leaved tree species in China, Q. variabilis serves a vital function in ecological restoration. Since many basic ecological theories (such as niche theory, neutral theory, and the negative density dependence hypothesis) have been validated in different forest types worldwide [4,5,17,33], we anticipate that as ecological processes shift, the spatial point patterns from the natural regeneration layer to the overstory layer will undergo significant changes in the temperate forests of northern China. Such changes may be influenced by interactions within the same layer or between different layers. We hypothesize that large-scale environmental filtering selects for species with specific traits to enter the local species pool, thus the spatial point pattern of the natural regeneration layer is mainly characterized by a clustered pattern. Species with similar traits usually compete for similar resources, and as a result, their marks may be smaller than expected. However, as competition intensifies within the same layer or between different layers, the spatial pattern of the overstory layer will change significantly and thus exhibit a random or regular pattern, and the mark values will show no significant difference from the expected values. The overstory and regeneration layers may exhibit positive spatial associations (attraction), negative associations (repulsion), or spatial independence in their point patterns, and thus their mark values will also exhibit corresponding relationships. Their ultimate manifestation is determined by the combined effects of seed dispersal, competition, spatial scales and other factors. Therefore, the objectives of this study are as follows: (1) identify the spatial structures of the natural regeneration layer and the overstory layer; (2) determine whether the spatial pattern simplifies from seedlings to adult trees; (3) identify how competition operates in community assembly by describing the marked point patterns of the natural regeneration layer and the overstory layer. Identifying the spatial pattern characteristics and their associations between the natural regeneration stage and the mature forest stage is crucial for understanding ecological processes such as seed dispersal, competition and facilitation. It can provide a theoretical basis for artificially promoting the positive succession of Q. variabilis forests.
2. Materials and Methods
2.1. Study Area
This study was conducted in Beijing, situated at the northwestern margin of the North China Plain, within the geographic coordinates of 39°24′–41°36′ N and 115°42′–117°24′ E. The terrain presents a distinct gradient, descending from highlands in the northwest to lowlands in the southeast. The mountainous areas, governed by the Taihang and Yanshan mountain systems, reach elevations of 1000–1500 m, while the southeastern plain has an average elevation of 20–60 m. Beijing falls into a warm temperate semi-humid continental monsoon climate zone, marked by distinct seasons, concentrated rainfall in summer, and dry conditions in winter, with an annual mean temperature ranging from 10 to 13 °C [35]. The dominant soil types include mountain brown soil, cinnamon soil, and mountain meadow soil. Zonal vegetation is primarily composed of warm temperate deciduous broad-leaved forests and temperate coniferous forests. Deciduous broad-leaved forests are dominated by species of Quercus, Populus, and Betula, forming typical zonal forest communities, whereas evergreen coniferous ecosystems are mainly structured by Pinus tabuliformis and Platycladus orientalis [36].
2.2. Experiment Design and Surveys
In July-August 2024, Q. variabilis forests with minimized human disturbance at three sites were selected as the study areas. Twelve 20 × 20 m plots were randomly established at these three sites for field surveys (Figure 1, Table 1). A total of 2761 naturally regenerating tree seedlings (diameter at breast height, DBH < 5 cm) were recorded in the plots, with data collected on their species identity, basal diameter, height, and coordinates. According to the technical regulations of the National Forestry and Grassland Administration (GB/T 38590-2020), natural regeneration seedlings are classified into three grades: good, moderate, and poor [37]. Additionally, 449 adult individuals (DBH ≥ 5 cm) were recorded for their DBH and coordinates. The coordinates of each tree individual, along with plot-level topographic data including elevation, slope, and aspect, were recorded using an RTK GPS system. Collectively, these seedlings and adult individuals represent 22 species across 17 families (Table A1).
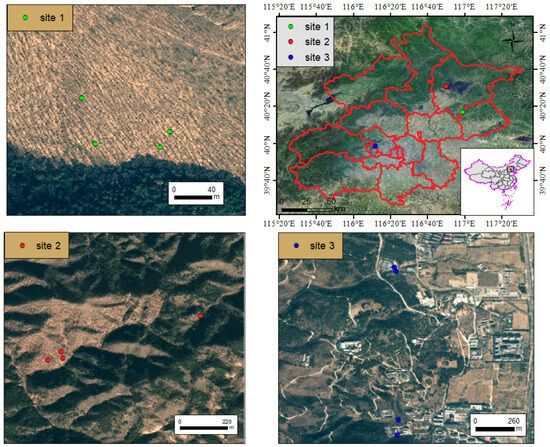
Figure 1.
Location of three sampling sites in Beijing.

Table 1.
Abiotic and biotic conditions of study plots.
2.3. Spatial Pattern Analysis
We first mapped the spatial distribution of seedlings and adult trees in each plot. Because the area of each plot was relatively small and the habitat background was essentially homogeneous, we used the g(r) function based on the homogeneous Poisson process, which represents the absence of clustering and complete spatial randomness (CSR), to test for aggregation in the spatial distribution of trees at both growth stages. For life-history stages with aggregation, we employed three summary functions: the pair correlation function g(r), the nearest-neighbor distance distribution function D1(r), and the spherical contact distribution Hs(r) to further characterize the details of their aggregation as a single-cluster distribution based on the simple Thomas model. The pair correlation function g(r) was derived from Ripley’s K-function [34,38,39]:
where A is the area of study plot, n is the total number of points in the plot, r is the radius of the circle, Ir(dij) is the indicator function, and dij is the distance between the center point i and point j. When dij < r, Ir(dij) = 1 and dij > r, Ir(dij) = 0, Wij is the weight. Ripley’s K-functions are widely used as second-order summary statistics in spatial pattern analysis. However, due to their cumulative nature, effects observed at shorter spatial scales can obscure those at broader scales. Given that our study focuses on relatively small spatial scales, the pair correlation function g(r) offers more appropriate summary statistics for assessing spatial patterns across scale [34]. Meanwhile, the probability function D1(r) that the typical tree has its nearest neighbor within distance r also provides important additional information, as it characterizes the internal cluster structures, and the probability function Hs(r) that a random test point has its nearest tree within distance r does so as well, since it characterizes the “holes” in the pattern [34].
We used two point process models to quantify the spatial distribution patterns of seedlings or adult trees. First, we used a homogeneous Poisson process to test the spatial distribution pattern, which represents the absence of clustering and complete spatial randomness (CSR). However, in the actual forest, the distribution of trees often deviates from complete spatial randomness and exhibits significant clustering due to ecological processes such as limited seed dispersal and the spatial configuration of mother trees [40,41]. To more accurately characterize the aggregation characteristics of seedlings and given the limited area of our study plots, we used the simple Thomas model to fit the seedling data with single clusters. The simple Thomas model describes spatial clustering based on three rules: (1) first, it comprises ρA clusters of points that are randomly and independently distributed, where ρ denotes the intensity of the cluster centers and A represents the area of the study region; (2) the points of the pattern are randomly assigned to clusters according to a Poisson distribution; and (3) points within each cluster are dispersed around their cluster center following a two-dimensional normal distribution with standard deviation σ [34]. The simple Thomas process is characterized by a critical clustering scale defined by σ, within which approximately 86% of all points are located within 2σ of their cluster center. This model effectively quantifies the intensity and spatial scale of clustering of points [42].
To investigate whether self-thinning occurs during the development of seedlings into adult trees, we follow the methods of Moeur [43] and Getzin [44] et al., and assume that the current spatial pattern of seedlings is identical to that of adult trees. It should be noted that we focus on the spatial self-thinning between different forest layers (adult tree layer and regeneration layer) at the community scale. Therefore, the density decrease and spatial structure change observed in the adult tree layer are not completely equivalent to the pure intraspecific self-thinning process of a single species from high density to low density, which may also involve multiple mechanisms such as replacement between pioneer tree species and dominant tree species, competitive exclusion, and niche differentiation. This limitation means that the current interpretation of the “self-thinning” mechanism is more inclined to the “overall density regulation of the regeneration layer” rather than the “intraspecific self-thinning curve” in the strict sense. To assess the degree of spatial self-thinning, we estimate the average density (r = 0) of seedlings and adult trees in the immediate neighborhood of points via the following formula:
where λ is the overall density of N points in the plot (points/area); DCs describes the relative increase in neighborhood density caused by small-scale clustering, [34]. As an indicator of the total self-thinning effect, we used the neighborhood density ratio of seedlings to adult trees:
According to Wiegand et al., if one spatial pattern is antecedent (e.g., the pattern of seedlings relative to adult trees), the antecedent pattern (e.g., adults) should be selected as the fixed pattern 1 while the other pattern is randomized [34]. To assess the spatial association between seedlings and adult trees, we used the bivariate pair correlation function g12(r), with Pattern 1 (adult trees) fixed and Pattern 2 (seedlings) CSR. When they are spatially attracted, g12(r) > 1, and when they are spatially repelled, g12(r) < 1 [34,45].
We used the r-mark correlation function k.m1(r) and mark variogram roh11(r) to statistically characterize the spatial structure of the marks for seedlings (where the mark value for seedlings is height), by means of the independent marking null model—which randomly shuffles the marks among the points to eliminate all potential spatial structure in the marks. When k.m1(r) > 1, it indicates that the observed mark value is larger than expected; when k.m1(r) < 1, it indicates that the observed mark value is smaller than expected. When roh11(r) is >1, it indicates that the observed mark values are more dissimilar than expected; when roh11(r) is <1, it indicates that the observed mark values are more similar than expected. Since the spatial distribution of adult trees follows a CSR pattern, we only used the mark correlation function km1m1 to test the spatial structure of their mark values the completely spatially random null model. When km1m1 > 1, it indicates that the product of its mark value is larger than expected; when km1m1 < 1 it indicates that the product of its mark value is smaller than expected. We used the mark correlation function km1m2 to test whether there is an interspecific interaction between the mark values of seedlings and adult trees by fixing pattern 1 (adult trees) and setting pattern 2 as CSR (seedlings). When km1m2 > 1, it indicates that the product of their marks is larger than expected; when km1m2 < 1 it indicates that the product of their marks is smaller than expected [34].
We used Monte Carlo simulations to generate 199 realizations of each point process, creating approximately 95% simulation envelopes from the 5th lowest and highest values to identify significant departures from the null model. We performed goodness-of-fit (GoF) tests over the 0–10 m range and retained results with p < 0.05 for further analysis [46]. All analyses were performed using Programita (November 2018) and all figures generated in R 4.5.0 [47].
3. Results
3.1. Community Structure and Composition
As shown in Figure 2, the density of adult trees in the plots ranged from 425 to 1750 stems ha−1, with an average DBH between 12.7 (±4.1) and 23.9 (±5.6) cm. The mean height of naturally regenerated seedlings varied from 43 (±38.8) to 90 (±75.4) cm, and their density showed significant variation, with the highest reaching 14,100 stems ha−1 in plot 9 and the lowest being 775 stems ha−1 in plot 7. The regeneration grade of seedlings was classified as good in plots 2, 3, 9, 10, and 11; moderate in plots 4 and 12; and poor in the remaining plots (Table 1). Overall, plots with good regeneration were mostly found on gently sloped, south-facing or southeast-facing hillsides.
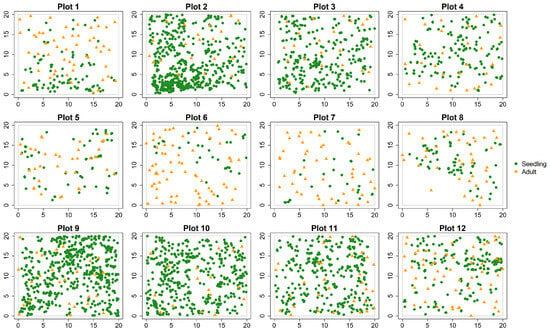
Figure 2.
Spatial locations of seedlings and adult trees in 12 study plots (20 m × 20 m).
Q. variabilis was the dominant species in the adult tree layer across all plots, with its importance value exceeding 85 in most cases (Table A1). In the seedling layer, species richness was generally higher than in the adult layer. Although Q. variabilis remained a key component in the seedling layer of most plots, its dominance had significantly declined, with a substantial presence of pioneer species such as Koelreuteria paniculata, Morus alba, and Prunus davidiana.
3.2. Spatial Patterns and Self-Thinning Between Seedlings and Adult Trees
All adult trees in the study plots showed a pattern consistent with complete spatial randomness (Table 2), while seedlings showed significant aggregation (Table 2, Figure 3). Under the CSR null model, seedlings showed aggregation at scales between 1.5 and 8.5 m with varying intensity. In particular, plot 5 and plot 7 had aggregation scales of 2 m and 1.5 m, respectively. Plot 10 and plot 11 had aggregation scales of 3 m. The remaining plots had aggregation scales greater than 5.5 m. At larger scales of 8.5 to 10 m, plots 2, 5, 8, 9, 10 and 12 exhibited uniform patterns.
Table 2.
The results of spatial pattern analysis of different growth stages in the study plots. For each plot, the analysis fits a cluster radius for seedlings, and the adults in the plot show complete spatial random.
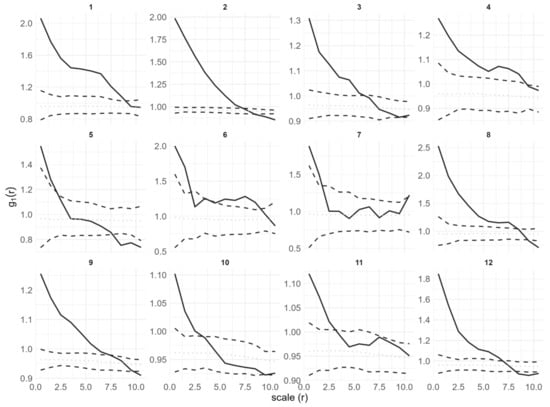
Figure 3.
Univariate point pattern analysis of seedlings in 12 plots under the CSR null model. Solid lines indicate the observed pair correlation functions g(r), and they all significantly deviate from the null model; dotted lines indicate the expected value under the null model; dashed lines indicate the simulation envelopes based on the 5th lowest and highest values of 199 simulations of the CSR null model.
Fitting a simple Thomas model to the seedling data showed that the observed g(r), D1(r) and Hs(r) values for all plots fell within the simulation envelopes. Model goodness of fit tests returned p values greater than 0.05 (for more details on model goodness-of-fit, see Figure A1, Figure A2 and Figure A3). Therefore, the seedling point patterns are consistent with a single cluster process. The fitted cluster radius ranged from 0.8 to 7.46 m, with a mean cluster radius of 3.89 m. Plots 5, 7 and 10 had the smallest cluster radius. Overall, the Thomas model provided a reasonable fit to the data (Table 2, Figure 4).
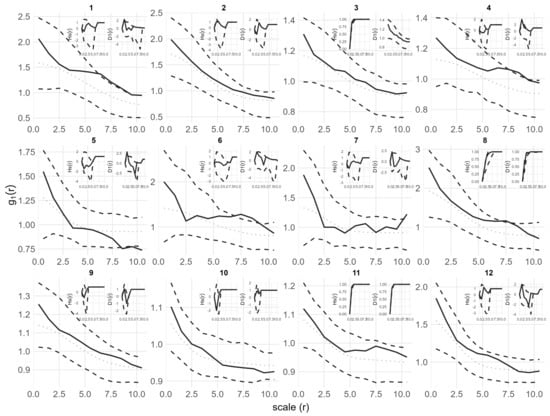
Figure 4.
Univariate point pattern analysis of seedlings in 12 plots under the simple Thomas model. Solid lines indicate the observed pair correlation functions g(r), empty space function Hs(r) and the Nearest neighbor D1(r); dotted lines indicate the expected value under the null model; dotted lines indicate the expected value under the null model; dashed lines indicate the simulation envelopes based on the 5th lowest and highest values of 199 simulations of the simple Thomas process. The observed functions in all plots show no significant difference from the null model.
Marked point pattern analysis by seedling height showed that in plots 1, 2, 3, 9, 10, 11 and 12, the k.m1(r) values at the 0.5 m scale were significantly less than 1 (Figure 5). This indicates that seedlings that are clustered within 0.5 m tend to have smaller heights than expected. In plots 1, 2 and 9 the roh11 values were also significantly less than 1 at corresponding scales (Figure 6). This result indicates that height-similar seedlings tend to be aggregated at those scales.
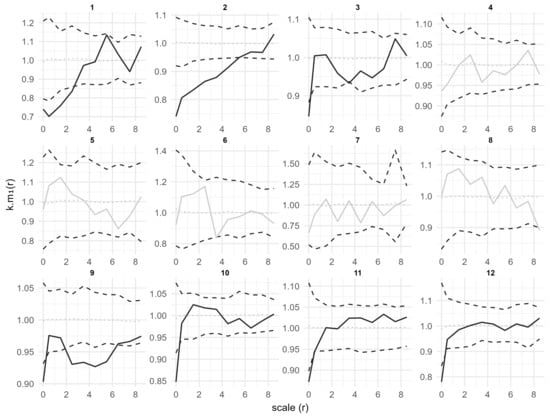
Figure 5.
Univariate mark quantitative point pattern analysis of seedlings in 12 plots under the CSR null model. Solid lines indicate the observed the r-mark correlation function k.m1(r); dotted lines indicate the expected value under the null model; dashed lines indicate the simulation envelopes based on the 5th lowest and highest values of 199 simulations of the CSR null model. Solid black lines represent statistically significant deviations from the null model, while solid gray lines represent no statistically significant deviations.
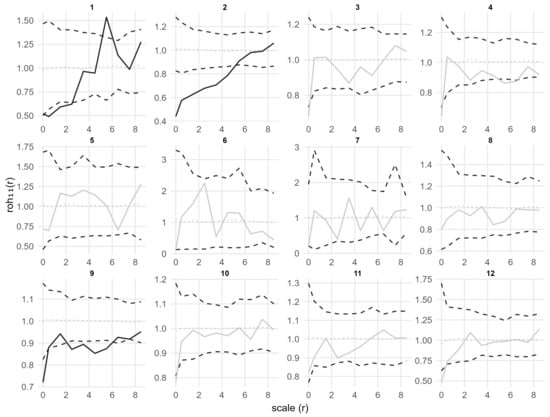
Figure 6.
Univariate mark quantitative point pattern analysis of seedlings in 12 plots under the CSR null model. Solid lines indicate the observed the mark variogram function roh11(r); dotted lines indicate the expected value under the null model; dashed lines indicate the simulation envelopes based on the 5th lowest and highest values of 199 simulations of the CSR null model. Solid black lines represent statistically significant deviations from the null model, while solid gray lines represent no statistically significant deviations.
Marked point pattern analysis of adult tree DBH showed that k1m1 values were significantly less or greater than 1 only in plots 8 and 11 (Figure A4). Overall there was no clear size related spatial pattern for adult trees. When adults are spatially random, their size does not show a systematic spatial structure.
Neighborhood density comparisons between seedlings and adults showed clear differences in most plots. Except for plots 6 and 7, all other plots had a thinning index greater than 1 (Table 3). This indicates a substantial reduction in density from seedlings to adults and supports the presence of self-thinning during the transition from seedlings to adult trees.
Table 3.
The results of the self-thinning assessment of different growth stages in the study plots. NA and NS indicate the numbers of adults and seedlings in each plot.
3.3. Association Between Seedlings and Adults
To explore the spatial relationships between different growth stages, bivariate pair correlation function g12(r) and mark correlation function km1m2(r) analyses were conducted based on the spatial distribution of adults and seedlings (Figure 7 and Figure 8). Here, adult trees were set as Pattern 1, and seedlings as Pattern 2, to assess the effects of adults on the spatial distribution and growth (height) of seedlings. As shown in Figure 7, the spatial associations between adults and seedlings varied greatly across different plots. Overall, the g12(r) curves of most plots were close to 1 at all scales (except for plots 2 and 8) and within the simulation envelopes of the CSR model, indicating a generally random distribution or independent spatial relationship. Only in a few plots (plots 3, 4, 5, and 8), g12(r) was slightly above the upper envelope at small, medium, and large scales, showing a slight positive association. In contrast, in plots 1, 2, and 7, g12(r) was below the lower envelope at small, medium, and large scales, showing a certain degree of negative association. However, no consistent directional pattern was observed across the plots, as the associations were weak and plot-specific.
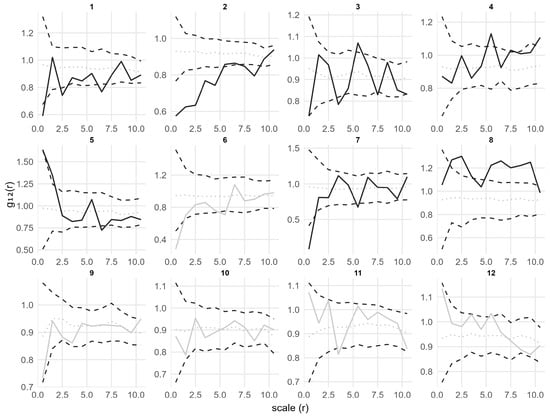
Figure 7.
Bivariate point pattern analysis of adults and seedlings in 12 plots under the CSR null model for pattern 2 (seedling). Solid lines indicate the observed the pair correlation function g12(r); dotted lines indicate the expected value under the null model; dashed lines indicate the simulation envelopes based on the 5th lowest and highest values of 199 simulations of the CSR null model for pattern 2. Solid black lines represent statistically significant deviations from the null model, while solid gray lines represent no statistically significant deviations.
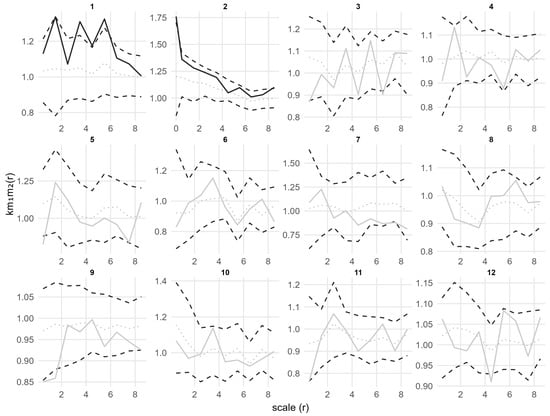
Figure 8.
Bivariate mark point pattern analysis of adults and seedlings in 12 plots under the CSR null model for marks 2 (seedling height). Solid lines indicate the observed the mark correlation function km1m2(r); dotted lines indicate the expected value under the null model; dashed lines indicate the simulation envelopes based on the 5th lowest and highest values of 199 simulations of the CSR null model for marks 2. Solid black lines represent statistically significant deviations from the null model, while solid gray lines represent no statistically significant deviations.
Similarly, the results of mark correlation function analysis (Figure 8) further revealed the spatial structural relationship between adults and seedlings in terms of growth. Except for plots 1 and 2 showing local positive correlation at small scales, km1m2(r) in most plots fluctuated around 1 at all scales and was within the simulation envelopes, indicating no significant correlation between seedling height and adult size distribution overall.
4. Discussion
Spatial point patterns retain the signatures of processes shaping spatial locations and mark values of object characteristics. Thus, spatial point patterns can be regarded as ecological archives that contain valuable information about the potential processes, structures, and functions of ecosystems [13,14,15,16]. Our spatial point pattern analysis of Q. variabilis forests across different growth stages revealed a “clustered juveniles but dispersed adults” pattern between regeneration and overstory layers.
Our results showed that adult trees in all plots exhibited a complete spatial random (CSR) distribution, while seedlings displayed a significant aggregated distribution. This pattern difference is highly consistent with the ecological processes of temperate forests: the aggregation of seedlings may primarily stem from two key factors, namely limited seed dispersal and microhabitat filtering [48]. First, environmental factors filter out species with specific traits to enter the local species pool, and these species can adapt to the local environment and thus form clustered patterns spatially [49]. In forests dominated by Q. variabilis, the seeds are characterized by their large size and heavy weight, and are primarily dispersed by gravity. Animals can also promote a clustered distribution through their feeding or seed-dispersing activities. Furthermore, species pairs with similar dispersal modes or habitat preferences are more likely to exhibit positive spatial associations, resulting in a clustered distribution pattern [50]. Marked point pattern analysis of seedling height further refined the ecological significance of the aggregated pattern. In plots 1, 2, 3, 9, 10, 11, and 12, the k.m1(r) values at the 0.5 m scale were significantly less than 1, indicating that the height of seedlings aggregated at this scale was significantly lower than expected. Correspondingly, the roh11 values in plots 1, 2, and 9 were also significantly less than 1, suggesting that seedlings with similar heights tend to aggregate at this scale. Our findings align with previous studies on community assembly in temperate and subtropical forests. Clustered distribution is often associated with trait convergence. Within clusters, individuals tend to exhibit similar but lower trait values. This pattern reflects intensified competition for light, water, and nutrients among functionally similar species in aggregated areas, leading to overall lower trait values than expected [51,52,53].
Fitting with the simple Thomas model confirmed that seedlings followed a single-cluster distribution pattern. The heterogeneity of seedling cluster radius (1.5–8.5 m) reflects the interaction between the habitat conditions, neighborhood advantage of mother trees. Interestingly, plots with small cluster radius may be limited by sparse or dense mother tree distribution resulting in a narrow seed dispersal range. As shown in Table 1 and Figure A5, plots with good regeneration grades were generally associated with adult tree densities ranging from 400 to 700 stems ha−1, whereas plots with poor regeneration exhibited either much higher densities. Both cases consistently exhibit smaller cluster radius. In contrast, plots with large cluster radius may have moderate mother tree density and low altitude, allowing for a wider spatial range of seed dispersal and seedling establishment. However, with the exception of plot 1, it is evident that seeds slide down the slope to form large-scale aggregations. Our results indicate that the stand density of canopy trees significantly influences seed dispersal pathways and distance. For instance, studies have found that seed establishment and seedling recruitment are more successful in areas with moderate conspecific tree density. Both excessively high and low densities limit effective seed dispersal and establishment [54,55]. Research on natural regeneration in boreal coniferous forests further revealed that a canopy tree density of 50–150 stems ha−1 most favorably supports pine seedling germination and survival. Higher densities suppress seedling growth due to intense competition, while lower densities fail to provide sufficient seed availability [56]. Notably, some plots showed a uniform distribution at large scales of 8.5–10 m, which may be the result of intensified resource competition (e.g., for light, water, and nutrients) when seedling density is high, consistent with the ecological hypothesis that “density-dependent competition leads to uniform distribution [57].” Consequently, thinning practices should aim to maintain adult tree density within the moderate range (400–700 stems·ha−1), rather than maximizing canopy openness.
The random distribution of adult trees represents the outcome of long-term community dynamics. Seedlings initially exhibit an aggregated distribution, then experience environmental filtering and density-dependent mortality. Surviving individuals gradually access more uniform spatial resources, eventually forming a random distribution without significant clustering or repulsion. This transition to randomness was further supported by the absence of significant spatial structure in DBH among adult trees, with only local variations detected in plot 2. These findings indicate that random distribution reflects a stabilized state in adult populations, aligning with the common spatial pattern observed for adult trees in temperate forests. For example, studies in mid-subtropical evergreen–deciduous broadleaved mixed forests have shown that as tree DBH increases, both the proportion and intensity of aggregated distribution decrease, with adult trees tending to exhibit random distribution [58].
Numerous studies have shown that as forest stands develop, the number of individuals per unit area decreases significantly from the seedling stage to the adult tree stage [58]. This study compared local densities between adult trees and seedlings. The self-thinning index exceeded 1 in most plots, indicating a clear density reduction from the regeneration layer to the adult tree layer. This process is primarily driven by density-dependent mortality (self-thinning), which is a common pattern in the structural succession of forest ecosystems. For example, in various forest types in southern China and Australia, stand density gradually decreases with increasing mean DBH and tree height, reflecting the universality of the self-thinning process [59,60,61].
Both bivariate pair correlation function g12(r) and bivariate marked correlation analyses detected no significant spatial relationship between adult trees and seedlings in terms of location or functional traits, except in a few plots. These results imply that seedling growth is primarily influenced by local microhabitat conditions, such as slope gradient and aspect, and competition pressure. The role of adult trees appears limited mainly to the initial seedling establishment phase, affecting spatial distribution patterns rather than subsequent growth stages [62,63]. However, adult trees may also indirectly influence seedling survival and regeneration through processes such as microenvironment modification, soil microbial mediation, and alterations in understory light availability [64,65,66]. These indirect effects do not necessarily manifest as direct spatial associations. Furthermore, the response of seedlings to the presence of adult trees may exhibit significant temporal lags. For instance, ecological effects resulting from processes such as density-dependent mortality or facilitation might only become apparent during subsequent stages of community succession over time [67,68].
Although this study revealed the spatial patterns and association characteristics of different forest layers in Q. variabilis forests, it still has certain limitations: ~First, in spatial analysis, combining data from multiple species may obscure the underlying species-specific processes. Second, the area of the study plots is limited, failing to observe changes in point patterns at larger spatial scales; it did not quantify the impact of specific environmental factors such as light and soil nutrients on spatial point patterns, making it difficult to accurately separate the relative weights of biological processes (e.g., competition, seed dispersal) and abiotic processes (e.g., habitat filtering). Future research can further combine environmental variables such as soil physical and chemical properties and light intensity to construct a multi-factor driving model and quantify the impact of habitat filtering on spatial point patterns; expand the research area to compare spatial pattern differences of Q. variabilis forests in different environments and stand ages to verify the generality of the conclusions of this study; describe the spatial patterns of individual species and among species on a larger research scale to provide more detailed information on ecological processes; and incorporate spatial pattern information into the close-to-nature management and ecological restoration planning of Q. variabilis stands to achieve more refined and predictable regulation of the regeneration process and community structure.
5. Conclusions
In conclusion, our study demonstrates a clear clustered-to-random transition in spatial patterns from the seedling to adult tree stage in Q. variabilis forests. The observed aggregation of seedlings is likely influenced by limited seed dispersal and habitat filtering, while the random distribution of adults may reflect the effects of competition during stand development. The general lack of significant spatial association between forest layers indicates that the direct influence of adult trees on seedling growth may be limited; however, an appropriate adult tree density could facilitate initial seedling establishment. Taken together, these findings suggest that processes such as competition, dispersal limitation, and habitat filtering may play important roles in shaping the stand structure of temperate Quercus forests. For management, our results indicate that promoting natural regeneration might benefit from interventions that maintain moderate stand densities, providing sufficient seed sources while minimizing intense competition at early stages. Nevertheless, we acknowledge that our conclusions are based on observational and spatial analyses, and experimental and long-term demographic studies are needed to more definitively disentangle these ecological mechanisms.
Author Contributions
Conceptualization, Y.J., Y.L. and Z.L. (Zhenghua Lian); methodology, X.H. and Z.L. (Zhenghua Lian); software, X.H.; validation, F.L. (Fang Liang); formal analysis, X.H.; investigation, F.L. (Fang Li); resources, Z.L. (Zuzheng Li); data curation, Y.W. and H.C.; writing—original draft preparation, Z.L. (Zhenghua Lian); writing—review and editing, Y.J. and Y.L.; visualization, J.W.; supervision, Z.L. (Zhenghua Lian); project administration, Z.L. (Zhenghua Lian); funding acquisition, Z.L. (Zhenghua Lian). All authors have read and agreed to the published version of the manuscript.
Funding
This research was funded by the Study on mechanism of natural regeneration community under artificial forest of Quercus variabilis in Beijing (STBH202402); Study on Natural Regeneration Characteristics and Influencing Factors of Oak Forests in Beijing, Phase II (YKYQN202502). Research on Key Technologies for Comprehensive Restoration of Forest Ecosystems in Plain Areas (YKYZD202501).
Data Availability Statement
The data are not publicly available due to proprietary rights.
Conflicts of Interest
The authors declare no conflicts of interest.
Appendix A
Table A1.
Species composition and their important values.
Table A1.
Species composition and their important values.
| Plot | Adult Trees | Seedlings |
|---|---|---|
| 1 | Cb2; Dl2; Ma1; Ps1; Qv94 | Cb28; Qv22; Kp39; Ma9; Dl2 |
| 2 | Qv100; | Cb14; Qv70; Jm1; Kp5; Ma2; Qd3; Pq1; Dl3 |
| 3 | Dl3; Qv97 | Cb21; Qv53; Jm1; Kp18; Ma2; Qd3; Pq1; Dl1 |
| 4 | Dl2; Qv98 | Cb42; Qv46; Kp5; Ma6; Qd1 |
| 5 | Pd12; Qd3; Qv85 | Aa2; Cb1; Cs1; Ma12; Pd35; Qd13; Qv36 |
| 6 | Pd1; Pp2; Qd6; Qv91 | Aa2; Ak11; Cb14; Ct3; Po2; Pd24; Ps18; Qd9; Qv18 |
| 7 | Cb3; Qa2; Qv95 | Pd39; Qd61 |
| 8 | Mb2; Po2; Qa10; Qv86 | Aa11; Ak1; Dl1; Ma11; Pq2; Po4; Pd42; Ps3; Qd15; Qv10 |
| 9 | Qa7; Qv93 | At1; Aa2; Ak1; Bp6; Cs1; Cc8; Dl3; Fc1; Kp4; Ma9; Pd1; Ps1; Qa11; Qv54 |
| 10 | Bp4; Dl8; Qa18; Qv62; Sj4; Zj4 | At1; Aa1; Bp22; Cb1; Cc3; Dl19; Fc1; Kp10; Ma1; Pd1; Ps1; Qa7; Qv35 |
| 11 | Dl16; Mm3; Pt9; Qv68; Sj4 | At2; Aa1; Ak3; Bp18; Cs4; Cc2; Dl21; Fc2; Kp24; Ma1; Pq1; Po1; Pd1; Qv18 |
| 12 | Po17; Qa4; Qa80 | At3; Bp28; Cb1; Cs2; Cc10; Dl4; Fc5; Kp15; Ma1; Pc1; Qa18; Qv12; Up1 |
The letters are abbreviations of the initial letters of the species’ scientific names, and their full names are as follows: At: Acer truncatum; Aa: Ailanthus altissima; Ak: Albizia kalkora; Bp: Broussonetia papyrifera; Cb: Celtis bungeana; Cs: Celtis sinensis; Ct: Celtis tetrandra; Cc: Cotinus coggygria; Dl: Diospyros lotus; Fc: Fraxinus chinensis; Jm: Juglans mandshurica; Kp: Koelreuteria paniculata; Ma: Morus alba; Pq: Picrasma quassioides; Pc: Pistacia chinensis; Po: Platycladus orientalis; Pd: Prunus davidiana; Ps: Prunus sibirica; Qa: Quercus aliena; Qd: Quercus dentata; Qv: Quercus variabilis; Up: Ulmus pumila.

Figure A1.
Goodness-of-fit test results based on the studentized transformation of the pair correlation function g(r) for seedlings in 12 plots under the simple Thomas null model. Black dots represent the observed studentized g(r), red lines indicate pointwise simulation envelopes, and green lines represent the upper and lower global simulation envelopes. The blue line represents the theoretical value for a 5% significance level. Statistical significance is assessed using the global envelopes: crossing of the green envelopes at any distance r indicates rejection of the null model, whereas curves entirely within the envelopes indicate failure to reject the simple Thomas model at α = 0.05.

Figure A2.
Goodness-of-fit test results based on the studentized transformation of the spherical contact distribution Hs(r) for seedlings in 12 plots under the simple Thomas null model. Black dots represent the observed studentized Hs(r), red lines indicate pointwise simulation envelopes, and green lines represent the upper and lower global simulation envelopes. The blue line represents the theoretical value for a 5% significance level. Statistical significance is assessed using the global envelopes: crossing of the green envelopes at any distance r indicates rejection of the null model, whereas curves entirely within the envelopes indicate failure to reject the simple Thomas model at α = 0.05.

Figure A3.
Goodness-of-fit test results based on the studentized transformation of the nearest-neighbor distance distribution D1(r) for seedlings in 12 plots under the simple Thomas null model. Black dots represent the observed studentized D1(r), red lines indicate pointwise simulation envelopes, and green lines represent the upper and lower global simulation envelopes. The blue line represents the theoretical value for a 5% significance level. Statistical significance is assessed using the global envelopes: crossing of the green envelopes at any distance r indicates rejection of the null model, whereas curves entirely within the envelopes indicate failure to reject the simple Thomas model at α = 0.05.

Figure A4.
Univariate mark quantitative point pattern analysis of adults in 12 plots under the CSR null model. Solid lines indicate the observed the mark correlation function km1m1(r); dotted lines indicate the expected value under the null model; dashed lines indicate the simulation envelopes based on the 5th lowest and highest values of 199 simulations of the CSR null model. Solid black lines represent statistically significant deviations from the null model, while solid gray lines represent no statistically significant deviations.

Figure A5.
Spearman’s rank correlation heatmap among variables; crosses mark p ≥ 0.05.
References
- Bañares-De-Dios, G.; Macía, M.; La Cerda, Í.G.D.; Arnelas, I.; De Carvalho, G.M.; Espinosa, C.I.; Salinas, N.; Swenson, N.; Cayuela, L. Linking patterns and processes of tree community assembly across spatial scales in tropical montane forests. Ecology 2020, 101, e03058. [Google Scholar] [CrossRef] [PubMed]
- Kraft, N.; Valencia, R.; Ackerly, D. Functional traits and niche-based tree community assembly in an amazonian forest. Science 2008, 322, 580–582. [Google Scholar] [CrossRef] [PubMed]
- Kraft, N.J.B.; Ackerly, D.D. Functional trait and phylogenetic tests of community assembly across spatial scales in an amazonian forest. Ecol Monogr. 2010, 80, 401–422. [Google Scholar] [CrossRef]
- Jin, L.S.; Yin, D.; Fortin, M.; Cadotte, M.W. The mechanisms generating community phylogenetic patterns change with spatial scale. Oecologia 2020, 193, 655–664. [Google Scholar] [CrossRef]
- Måren, I.; Kapfer, J.; Aarrestad, P.; Grytnes, J.; Vandvik, V. Changing contributions of stochastic and deterministic processes in community assembly over a successional gradient. Ecology 2018, 99, 148–157. [Google Scholar] [CrossRef] [PubMed]
- MacArthur, R.H. Patterns of species diversity. Biol. Rev. Camb. Philos. Soc. 1965, 40, 510–533. [Google Scholar] [CrossRef]
- Ning, D.; Wang, Y.; Fan, Y.; Wang, J.; Van Nostrand, J.; Wu, L.; Zhang, P.; Curtis, D.; Tian, R.; Lui, L.; et al. Environmental stress mediates groundwater microbial community assembly. Nat. Microbiol. 2024, 9, 490–501. [Google Scholar] [CrossRef]
- Catano, C.; Dickson, T.; Myers, J. Dispersal and neutral sampling mediate contingent effects of disturbance on plant beta-diversity: A meta-analysis. Ecol. Lett. 2017, 20, 347–356. [Google Scholar] [CrossRef]
- Gálvez Reyes, N.; Arribas, P.; Andújar, C.; Emerson, B.; Piñero, D.; Mastretta Yanes, A. Dispersal limitations and long-term persistence drive differentiation from haplotypes to communities within a tropical sky-island: Evidence from community metabarcoding. Mol. Ecol. 2021, 30, 6611–6626. [Google Scholar] [CrossRef]
- Janzen, T.; Zotz, G.; Etienne, R. Community structure of vascular epiphytes: A neutral perspective. Oikos 2020, 129, 853–867. [Google Scholar] [CrossRef]
- Zhu, Y.; Mi, X.; Ma, K. A mechanism of plant species coexistence: The negative density-dependent hypothesis. Biodivers. Sci. 2009, 17, 594–604. [Google Scholar] [CrossRef]
- Zhou, G.; Qiao, X.; Xu, Y.; Jiang, M. Advances in the negative density-dependent hypothesis. Plant Sci. J. 2023, 41, 759–767. [Google Scholar]
- Ben-Said, M. Spatial point-pattern analysis as a powerful tool in identifying pattern-process relationships in plant ecology: An updated review. Ecol. Process. 2021, 10, 56. [Google Scholar] [CrossRef]
- Chesson, P. Mechanisms of maintenance of species diversity. Annu. Rev. Ecol. Evol. Syst. 2000, 31, 343–366. [Google Scholar] [CrossRef]
- Brown, C.; Law, R.; Illian, J.B.; Burslem, D.F.R.P. Linking ecological processes with spatial and non-spatial patterns in plant communities. J. Ecol. 2011, 99, 1402–1414. [Google Scholar] [CrossRef]
- Detto, M.; Muller-Landau, H.C. Fitting ecological process models to spatial patterns using scalewise variances and moment equations. Am. Nat. 2013, 181, E68–E82. [Google Scholar] [CrossRef]
- Petritan, I.C.; Marzano, R.; Petritan, A.M.; Lingua, E. Overstory succession in a mixed quercus petraea–fagus sylvatica old growth forest revealed through the spatial pattern of competition and mortality. For. Ecol. Manag. 2014, 326, 9–17. [Google Scholar] [CrossRef]
- Dale, M.R.T. Spatial Pattern Analysis in Plant Ecology; Cambridge University Press: Cambridge, UK, 1999. [Google Scholar]
- Velázquez, E.; Paine, C.E.T.; May, F.; Wiegand, T. Linking trait similarity to interspecific spatial associations in a moist tropical forest. J. Veg. Sci. 2015, 26, 1068–1079. [Google Scholar] [CrossRef]
- Wiegand, T.; Huth, A.; Getzin, S.; Wang, X.; Hao, Z.; Savitri Gunatilleke, C.V.; Nimal Gunatilleke, I.A.U. Testing the independent species’ arrangement assertion made by theories of stochastic geometry of biodiversity. Proc. R. Soc. B Biol. Sci. 2012, 279, 3312–3320. [Google Scholar] [CrossRef] [PubMed]
- Condit, R.; Ashton, P.S.; Baker, P.J.; Bunyavejchewin, S.; Gunatilleke, S.P.; Gunatilleke, N.; Hubbell, S.P.; Foster, R.B.; Itoh, A.; LaFrankie, J.V.; et al. Spatial patterns in the distribution of tropical tree species. Science 2000, 288, 1414–1418. [Google Scholar] [CrossRef]
- May, F.; Huth, A.; Wiegand, T. Moving beyond abundance distributions: Neutral theory and spatial patterns in a tropical forest. Proc. R. Soc. B Biol. Sci. 2015, 282, 20141657. [Google Scholar] [CrossRef]
- Seidler, T.G.; Plotkin, J.B. Seed dispersal and spatial pattern in tropical trees. PLoS Biol. 2006, 4, 2132–2137. [Google Scholar] [CrossRef]
- Wright, J.S. Plant diversity in tropical forests: A review of mechanisms of species coexistence. Oecologia 2002, 130, 1–14. [Google Scholar] [CrossRef]
- Harms, K.E.; Wright, S.J.; Calderón, O.; Hernández, A.; Herre, E.A. Pervasive density-dependent recruitment enhances seedling diversity in a tropical forest. Nature 2000, 404, 493–495. [Google Scholar] [CrossRef]
- Bagchi, R.; Henrys, P.A.; Brown, P.E.; Burslem, D.F.R.P.; Diggle, P.J.; Gunatilleke, C.V.S.; Gunatilleke, I.A.U.N.; Kassim, A.R.; Law, R.; Noor, S.; et al. Spatial patterns reveal negative density dependence and habitat associations in tropical trees. Ecology 2011, 92, 1723–1729. [Google Scholar] [CrossRef]
- Velázquez, E.; Martínez, I.; Getzin, S.; Moloney, K.A.; Wiegand, T. An evaluation of the state of spatial point pattern analysis in ecology. Ecography 2016, 39, 1042–1055. [Google Scholar] [CrossRef]
- Liu, P.; Wang, W.; Bai, Z.; Guo, Z.; Ren, W.; Huang, J.; Xu, Y.; Yao, J.; Ding, Y.; Zang, R. Competition and facilitation co-regulate the spatial patterns of boreal tree species in kanas of Xinjiang, Northwest China. For. Ecol Manag. 2020, 467, 118167. [Google Scholar] [CrossRef]
- Wiegand, T.; Moloney, K.A. Rings, circles, and null-models for point pattern analysis in ecology. Oikos 2004, 104, 209–229. [Google Scholar] [CrossRef]
- Diggle, P.J. Statistical Analysis of Spatial and Spatio-Temporal Point Patterns, 3rd ed.; Chapman and Hall/CRC: Boca Raton, FL, USA, 2013. [Google Scholar]
- Han, T.; Ren, H.; Hui, D.; Zhu, Y.; Lu, H.; Guo, Q.; Wang, J. Dominant ecological processes and plant functional strategies change during the succession of a subtropical forest. Ecol. Indic. 2023, 146, 109885. [Google Scholar] [CrossRef]
- Poorter, L.; Rozendaal, D.; Bongers, F.; De Almeida-Cortez, J.; Zambrano, A.A.; Álvarez, F.; Andrade, J.; Villa, L.F.A.; Balvanera, P.; Becknell, J.; et al. Wet and dry tropical forests show opposite successional pathways in wood density but converge over time. Nat. Ecol. Evol. 2019, 3, 928–934. [Google Scholar] [CrossRef]
- Luo, Y.H.; Cadotte, M.W.; Burgess, K.S.; Liu, J.; Tan, S.L.; Xu, K.; Li, D.Z.; Gao, L.M. Forest community assembly is driven by different strata-dependent mechanisms along an elevational gradient. J. Biogeogr. 2019, 46, 2174–2187. [Google Scholar] [CrossRef]
- Wiegand, T.; Moloney, K.A. Handbook of Spatial Point-Pattern Analysis in Ecology; Chapman and Hall/CRC: Boca Raton, FL, USA, 2014. [Google Scholar]
- Shi, N.; Han, Y.; Wang, Q.; Xiao, N.; Quan, Z. Spatial and temporal characteristics of fractional vegetation cover and its response to urbanization in Beijing. Environ. Sci. 2024, 45, 5318–5328. [Google Scholar]
- Lu, B.; Xing, S.; Cui, G.; Liu, Q. Comparison of species diversity of plant communities in mountains of Beijing. J. Beijing For. Univ. 2010, 32, 36–44. [Google Scholar]
- GB/T 38590-2020; Technical Regulations for Continuous Forest Resource Inventory. China Standards Press: Beijing, China, 2020.
- Ripley, B.D. Spatial Statistics; John Wiley Sons: New York, NY, USA, 1981. [Google Scholar]
- Ripley, B.D. The second-order analysis of stationary point processes. J. Appl. Probab. 1976, 13, 255–266. [Google Scholar] [CrossRef]
- Lin, L.; Ren, X.; Shimizu, H.; Wang, C.; Zou, C. Spatial patterns and associations of tree species in a temperate forest of national forest park, Huadian city, Jilin province, Northeast China. Forests 2024, 15, 714. [Google Scholar] [CrossRef]
- Brearley, F.; Mansur, M.; Eichhorn, M. Spatial patterning of Gonystylus brunnescens in eastern Borneo. Folia Oecologica 2023, 50, 55–59. [Google Scholar] [CrossRef]
- Perea, A.J.; Wiegand, T.; Garrido, J.L.; Rey, P.J.; Alcántara, J.M. Legacy effects of seed dispersal mechanisms shape the spatial interaction network of plant species in mediterranean forests. J. Ecol. 2021, 109, 3670–3684. [Google Scholar] [CrossRef]
- Moeur, M. Spatial models of competition and gap dynamics in old-growth tsuga heterophylla/thuja plicata forests. For Ecol. Manag. 1997, 94, 175–186. [Google Scholar] [CrossRef]
- Getzin, S.; Wiegand, T.; Wiegand, K.; He, F. Heterogeneity influences spatial patterns and demographics in forest stands. J. Ecol. 2008, 96, 807–820. [Google Scholar] [CrossRef]
- Stoyan, D.; Stoyan, H. Estimating pair correlation functions of planar cluster processes. Biom. J. 1996, 38, 259–271. [Google Scholar] [CrossRef]
- Russotto, S.; Di Paola, M.; Pirrotta, A. Digital simulation of multivariate stochastic processes. In Theoretical and Applied Mechanics—AIMETA; Materials Research Forum (MRF): Millersville, PA, USA, 2022. [Google Scholar]
- R Core Team. R: A Language and Environment for Statistical Computing; R Foundation for Statistical Computing: Vienna, Austria, 2025. [Google Scholar]
- Maciel-Nájera, J.; Hernández-Velasco, J.; Gonzalez-Elizondo, M.; Hernández-Díaz, J.; López-Sánchez, C.; Antúnez, P.; Bailón-Soto, C.; Wehenkel, C. Unexpected spatial patterns of natural regeneration in typical uneven-aged mixed pine-oak forests in the sierra madre occidental, mexico. Glob. Ecol. Conserv. 2020, 23, e01074. [Google Scholar] [CrossRef]
- Zhang, L.; Dong, L.; Liu, Q.; Liu, Z. Spatial patterns and interspecific associations during natural regeneration in three types of secondary forest in the central part of the Greater Khingan Mountains, Heilongjiang province, China. Forests 2020, 11, 152. [Google Scholar] [CrossRef]
- Niu, H.; Wang, X.; Wu, S.; Xing, J.; Peng, C.; Chen, Z.; Li, Y.; Zhang, H. Granivorous rodent loss poses greater threats to oak trees with large acorns than those with small ones in urban forests. Urban For. Urban Green. 2021, 62, 127185. [Google Scholar] [CrossRef]
- Kermavnar, J.; Kutnar, L. Patterns of understory community assembly and plant trait-environment relationships in temperate se european forests. Diversity 2020, 12, 91. [Google Scholar] [CrossRef]
- Shinohara, N.; Ohsaki, H. Competitive ability underpins the effect of spatial aggregation on plant performance. Ecology 2025, 106, e70075. [Google Scholar] [CrossRef] [PubMed]
- Rohr, M.; Thuiller, W.; Chalmandrier, L.; Münkemüller, T. The role of observation scales, trait correlations, and competitive regimes in community assembly patterns. Ecol. Evol. 2025, 15, e71272. [Google Scholar] [CrossRef] [PubMed]
- Uriarte, M.; Canham, C.; Thompson, J.; Zimmerman, J.; Brokaw, N. Seedling recruitment in a hurricane-driven tropical forest: Light limitation, density-dependence and the spatial distribution of parent trees. J. Ecol. 2005, 93, 291–304. [Google Scholar] [CrossRef]
- Clark, J.; Macklin, E.; Wood, L. Stages and spatial scales of recruitment limitation in southern appalachian forests. Ecol. Monogr. 1998, 68, 213–235. [Google Scholar] [CrossRef]
- Kyrö, M.J.; Hallikainen, V.; Valkonen, S.; Hyppönen, M.; Puttonen, P.; Bergsten, U.; Winsa, H.; Rautio, P. Effects of overstory tree density, site preparation and ground vegetation on natural scots pine seedling emergence and survival in northern boreal pine forests. Can. J. For. Res. 2021, 52, 860–869. [Google Scholar] [CrossRef]
- Stoll, P.; Bergius, E. Pattern and process: Competition causes regular spacing of individuals within plant populations. J. Ecol. 2005, 93, 395–403. [Google Scholar] [CrossRef]
- Du, H.; Hu, F.; Zeng, F.; Wang, K.; Peng, W.; Zhang, H.; Zeng, Z.; Zhang, F.; Song, T. Spatial distribution of tree species in evergreen-deciduous broadleaf karst forests in southwest China. Sci. Rep. 2017, 7, 15664. [Google Scholar] [CrossRef]
- Forrester, D.; Baker, T.; Elms, S.; Hobi, M.; Shuai, O.; Wiedemann, J.; Xiang, W.; Zell, J.; Pulkkinen, M. Self-thinning tree mortality models that account for vertical stand structure, species mixing and climate. For. Ecol. Manag. 2021, 487, 118936. [Google Scholar] [CrossRef]
- Long, S.; He, X.; Zeng, S.; Xiao, H. Investigating the self-thinning rule in plantation forests: Analyzing the relationship between the basal area and height growth in southern China. Ecol. Evol. 2025, 15, e71034. [Google Scholar] [CrossRef]
- Diao, S.; Sun, H.; Forrester, D.; Soares, Á.; Protásio, T.; Jiang, J. Variation in growth, wood density, and stem taper along the stem in self-thinning stands of sassafras tzumu. Front. Plant Sci. 2022, 13, 853968. [Google Scholar] [CrossRef]
- Paluch, J.; Zarek, M.; Kempf, M. The effect of population density on gene flow between adult trees and the seedling bank in abies alba mill. Eur. J. For. Res. 2019, 138, 203–217. [Google Scholar] [CrossRef]
- Liu, J.; Bai, X.; Yin, Y.; Wang, W.; Li, Z.; Ma, P. Spatial patterns and associations of tree species at different developmental stages in a montane secondary temperate forest of northeastern China. PeerJ 2021, 9, e11517. [Google Scholar] [CrossRef] [PubMed]
- Yin, J.; Lin, F.; De Lombaerde, E.; Mao, Z.; Liu, S.; Ye, J.; Fang, S.; Wang, X. The effects of light, conspecific density and soil fungi on seedling growth of temperate tree species. For. Ecol. Manag. 2023, 529, 120683. [Google Scholar] [CrossRef]
- Liu, H.; Shi, H.; Zhou, Q.; Hu, M.; Shu, X.; Zhang, K.; Zhang, Q.; Dang, H. Habitat heterogeneity and biotic interactions mediate climate influences on seedling survival in a temperate forest. For. Ecosyst. 2023, 10, 100138. [Google Scholar] [CrossRef]
- Ajala, O.; Cheng, Z.; Stovall, J.; Kidd, K.; Oswald, B.; Weng, Y. Seedling survival and growth of four forest tree species: The role of resource gradients in bottomland forests. Restor. Ecol. 2025, 33, e70126. [Google Scholar] [CrossRef]
- Murphy, S.; Wiegand, T.; Comita, L. Distance-dependent seedling mortality and long-term spacing dynamics in a neotropical forest community. Ecol. Lett. 2017, 20, 1469–1478. [Google Scholar] [CrossRef]
- Liang, M.; Johnson, D.; Burslem, D.; Yu, S.; Fang, M.; Taylor, J.; Taylor, A.; Helgason, T.; Liu, X. Soil fungal networks maintain local dominance of ectomycorrhizal trees. Nat. Commun. 2020, 11, 2636. [Google Scholar] [CrossRef] [PubMed]
Disclaimer/Publisher’s Note: The statements, opinions and data contained in all publications are solely those of the individual author(s) and contributor(s) and not of MDPI and/or the editor(s). MDPI and/or the editor(s) disclaim responsibility for any injury to people or property resulting from any ideas, methods, instructions or products referred to in the content. |
© 2025 by the authors. Licensee MDPI, Basel, Switzerland. This article is an open access article distributed under the terms and conditions of the Creative Commons Attribution (CC BY) license.