Abstract
Nitrogen (N) deposition in China remains high. However, the response of species-level plant elemental stoichiometry to N deposition is not comprehensive. This study aimed to investigate the N and phosphorus (P) stoichiometric response of understory herbaceous plants to N deposition at the species level. An addition experiment in Larix principis-rupprechtii plantation was conducted with multiple-gradient N addition (0, 5, 10, 20, 40, 80, and 160 kg N ha−1 yr−1). The N and P stoichiometry of the leaves and roots of nine representative herbaceous plants was determined. N addition significantly increased N concentration and N/P ratio in herbaceous plants. The changes in P concentration varied by species, with most plants reaching their highest P concentration at lower N addition levels. The availability of soil nutrients, such as nitrate nitrogen, driven by N addition, was the primary factor influencing N and P concentrations and the N/P ratio in plant leaves and roots. The response patterns of plants to N addition varied by species and organs, indicating that we should pay more attention to the differential response of different plants to nitrogen deposition.
1. Introduction
Nitrogen (N) deposition in China has declined in recent years [1], yet the country remains an area with high N deposition due to significantly increased reactive N production and emissions in the last century [2]. Moderate atmospheric N deposition has been shown to enhance N utilization in plants, promoting growth and increasing biomass [3]. However, excessive N deposition can negatively impact ecosystems, causing soil acidification and aquatic eutrophication, thereby altering ecosystem structure and function [4]. Therefore, studying the impacts and limitations of atmospheric N deposition is crucial for conserving and sustainably developing ecosystems.
Ecological stoichiometry, the study of elemental ratios, reveals ecological processes, the relationships between chemical elements in the ecosystem and energy flow, and ecosystem structure and function [5]. N and phosphorus (P), which are essential functional elements in plants, characterize growth and development, and their concentrations are sensitive to environmental changes. N/P ratios are diagnostic indicators of ecosystem nutrient conditions and plant growth [6]. Most terrestrial ecosystems are N-deficient during development, with N and P effectiveness limiting plant growth [7].
Short-lived tissues, such as leaves and fine roots, are sensitive to nutrient changes and common research materials in plant ecology [8]. Studies have shown that N addition typically increases N levels in plant leaves and roots [9,10,11]. However, the effects on P concentration display varying trends—increase, decrease, or no change—depending on species differences and environmental conditions [11,12]. Responses of leaf N to P ratio to N addition are species-specific, differing between species and functional groups [13]. Research has primarily focused on families and functional groups in tree or grassland ecosystems, with limited attention given to the species level of the herbaceous layer in forest understories [6].
Larix principis-rupprechtii is a crucial tree species in the region, playing a key role in water and soil conservation; it is a dominant and well-established species in forest areas [14]. To investigate the effects of nitrogen addition on nutrient utilization strategies of understory herbaceous plants, we set up a multi-gradient N addition experiment in L. principis-rupprechtii plantations. The N and P stoichiometry in both the leaves and roots of herbaceous plants growing within the L. principis-rupprechtii plantation forest was measured in order to explore the following: (1) Different herbaceous plants have different responses to N addition. (2) Different parts of the same plant respond differently to N addition. (3) The change of soil nutrients caused by N addition is the main factor leading to the change of plant nutrient utilization strategy.
2. Materials and Methods
2.1. Study Sites
The study site is located in the transition zone between the Mongolian Plateau and the northern Hebei Province mountains in China (116°32′~118°1′ E, 41°35′~42°40′ N) at an altitude ranging between 750 and 1850 m. It features mountainous terrain and complex topography, lying within the temperate monsoon climate zone. Summers are warm and rainy, whereas winters are cold and dry. The average annual temperature is 3.3 °C. Annual atmospheric wet N deposition flux in this region, measured using a rain gauge [15], was 5.03 kg N ha−1 yr−1, with 88% of the deposition occurring from May to September. The region is economically underdeveloped and experiences low N deposition, making it suitable for artificial N addition experiments. The forest stand type is a 30-year-old L. principis-rupprechtii plantation, with an average density of 1490 plants per hectare. The average tree height is 9.15 m, the average diameter at breast height is 12.44 cm, and the mean crown width is 1.54 m. The understory primarily comprises herbaceous plants such as Phlomoides maximowiczi, Agrimonia pilosa, Sanguisorba officinalis, and Bistorta officinalis.
2.2. Experimental Design
A randomized experimental design was used to study the L. principis-rupprechtii forest understory. In July 2018, 28 sample plots of 20 × 20 m2 were established along the contour line of the hillside. The boreal forests of our country belong to the N-limitation area [16]. A soil nutrient background survey was conducted in July 2019 before N addition, and the results showed that there was no significant difference in soil total and available nutrients among the plots. The ratios of C, N, and P acquisition activities proved that the soil in the sample plots was under the N-limitation in our previous studies [15,17]. The soil homogeneity among the plots made them suitable for artificial fertilization experiments. Each plot was enclosed by a 1.5 m high fence, which was built in the position where the boundary of the sample plots was expanded outward by 5 m; also, the interval between the plots was more than 10 m to prevent interference.
We set the fertilization concentration as 0, 5, 10, 20, 40, 80, and 160 kg N ha−1 yr−1, with a total of seven N addition levels and four replicates for each level. After 1 year of containment, different concentrations of urea (CH4N2O) were applied in different plots according to the experimental design of N addition each month, from July to October 2019 and from May to October 2020–2024, for a total of 5 years. During fertilization, urea was dissolved in 40 L of water (equivalent to about 0.1 mm of precipitation) and evenly sprayed on the soil surface of the sample field with a back sprayer. The same amount of water was sprayed in the same way to remove the interference of adding clean water to the experiment.
2.3. Sampling Methods
Herbaceous plant samples were collected in August 2023 for this experiment. A survey of herbaceous diversity was conducted within the sample plots. Based on their functional groups, the herbaceous plants under the L. principis-rupprechtii plantation forests were mainly forbs. Within each N addition plot, nine dominant perennial herbaceous species were selected for analysis. These species included Phlomis maximowiczii, Geum aleppicum, Thalictrum aquilegifolium, Ranunculus japonicus, A. pilosa, B. officinalis, Potentilla fragarioides, S. officinalis, and Viola collina. Three healthy, mature, and uniformly growing plants from each species were selected, cut, and wrapped in filter paper. Distilled water was added to maintain their growth. Soil was dug around plants, bags were labeled, and the roots were rinsed well. The roots were squeezed with absorbent paper to remove excess water and impurities.
2.4. Indicator Measurements
Leaf and root samples were fixed by drying at 105 °C for 30 min, followed by drying at 65 °C until constant weight was reached. The dried leaves and roots samples were ground with a ball mill. The crushed plant sample was boiled in H2SO4-H2O2 for later use. The N concentration of the plants was determined using the Kjeldahl method. In this method, the organic N in the plant sample is converted to ammonium N by acid digestion, and then the amount of ammonium N is determined by distillation and titration to calculate the total N content in the sample. Whereas the P concentration was determined using the molybdenum–antimony anti-spectrophotometric method. Phosphorus molybdenum blue was produced by a reaction of plant solution with molybdenum-antimony anti-color reagent under acidic conditions, measured at 880 nm wavelength absorbance, and calculated P content. The N/P ratio was calculated as follows:
where N/P is the plant N and P ratio, TN is the total N concentration of the plant (mg/g), and TP is the total P concentration of the plant (mg/g).
N/P = TN/TP
2.5. Statistical Analysis
Raw data were recorded and initially organized using Excel 2021 and statistically analyzed using SPSS 24. One-way analysis of variance was used to assess the effects of N addition on N and P concentrations and the N/P ratio in leaves and roots. Pearson’s correlation was used to analyze the correlation between N and P concentrations and N/P ratio of different plants and soil nutrient concentrations. Origin 2022 software was employed for plotting and labeling significance (p < 0.05).
3. Results
3.1. Plant N Concentration in Response to N Addition
3.1.1. Leaf N Concentration
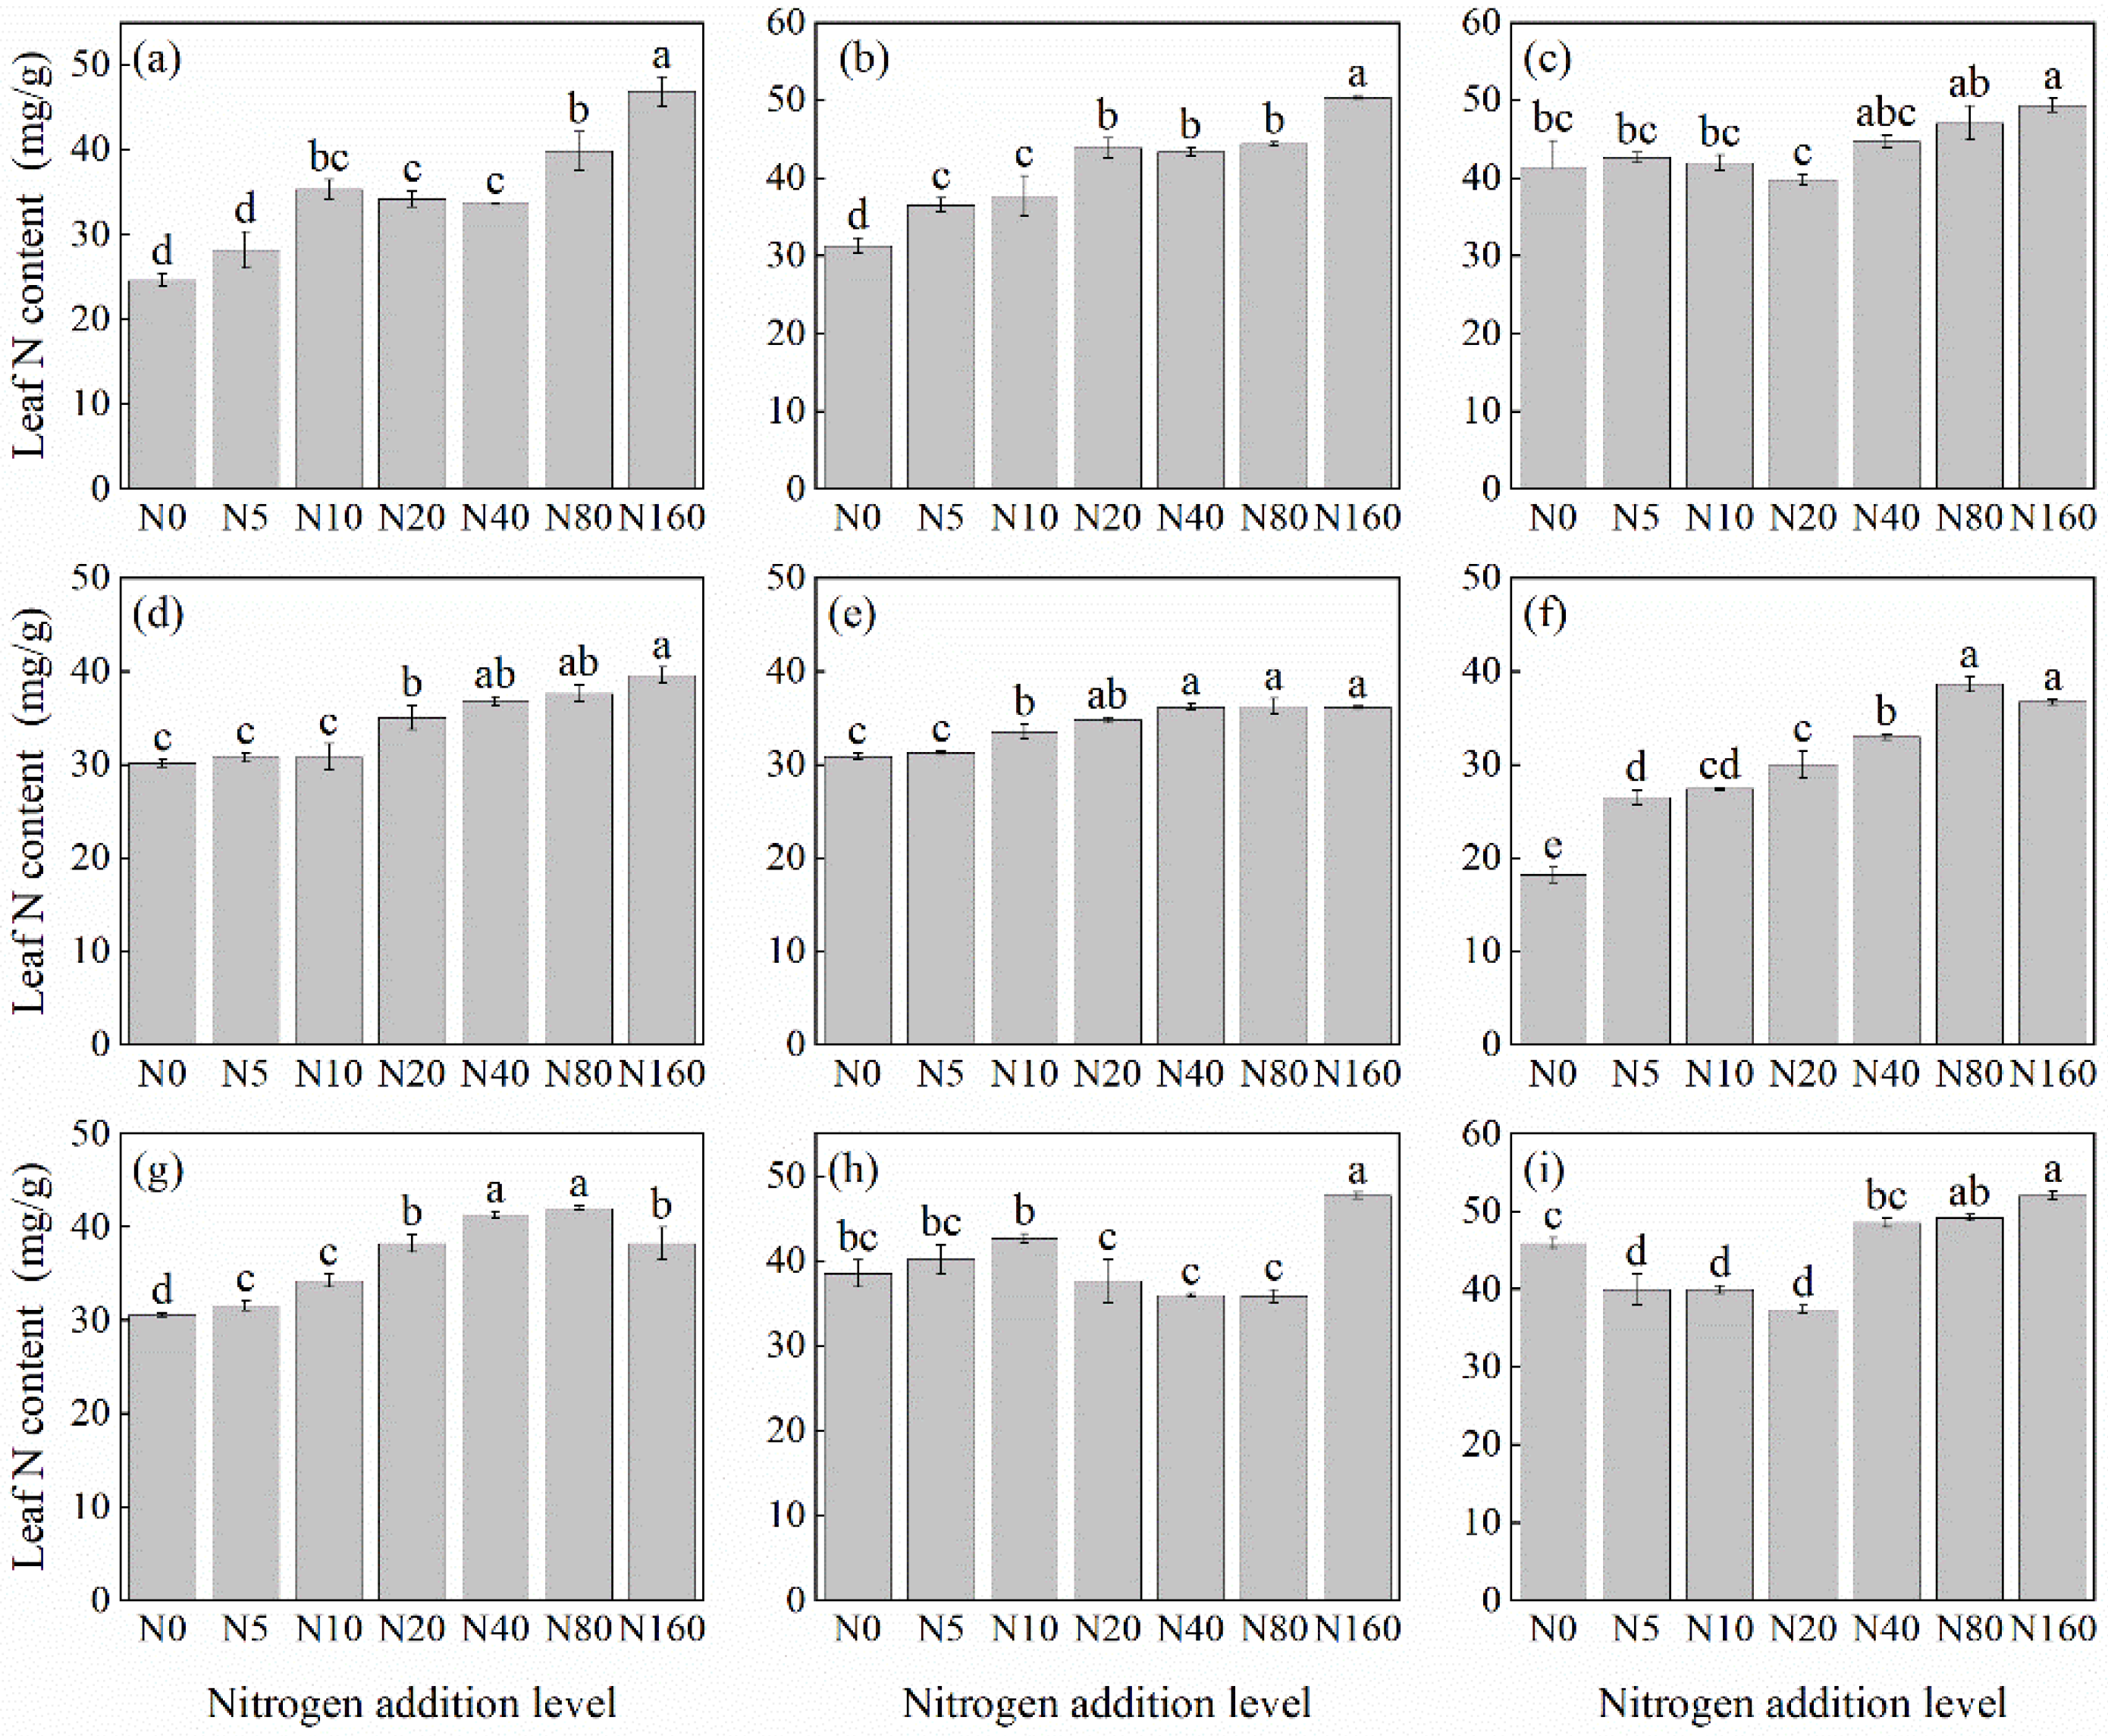
Overall, the leaf N concentration in herbaceous plants under the L. principis-rupprechtii plantation increased with N addition (Figure 1). However, the degree of increase varied among species. Compared with the control, the leaf N concentration increased by 13.34%–112.3%. Most species, except S. officinalis (Figure 1g), R. japonicus (Figure 1f), and G. aleppicum (Figure 1e), reached their highest N concentration at a concentration of 160 kg N ha−1 yr−1. Potentilla fragarioides (Figure 1d) and V. collina (Figure 1c) did not show significant differences compared with the control at low levels of N addition (p > 0.05). Significant differences did not appear until 20 kg N ha−1 yr−1 (Figure 1d) and 40 kg N ha−1 yr−1 (Figure 1c) (p < 0.05).
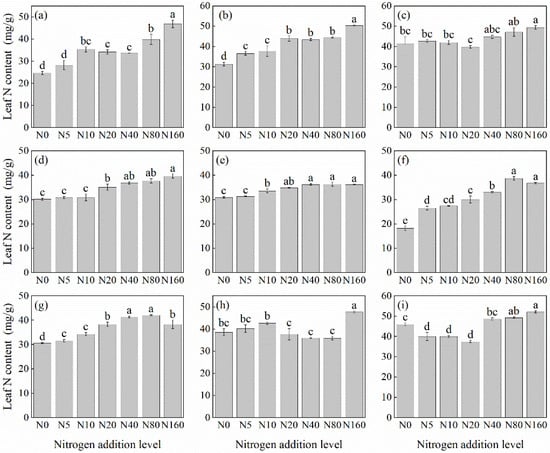
Figure 1.
Changes in leaf N concentration in plants under different N additions (mean ± SE). (a) Agrimonia pilosa, (b) Phlomis maximowiczii, (c) Viola collina, (d) Potentilla fragarioides, (e) Geum aleppicum, (f) Ranunculus japonicus, (g) Sanguisorba officinalis, (h) Bistorta officinalis, (i) Thalictrum aquilegifolium. Different letters indicate significant differences between different N addition treatment within the same herbaceous plants (p < 0.05).
3.1.2. Root N Concentration
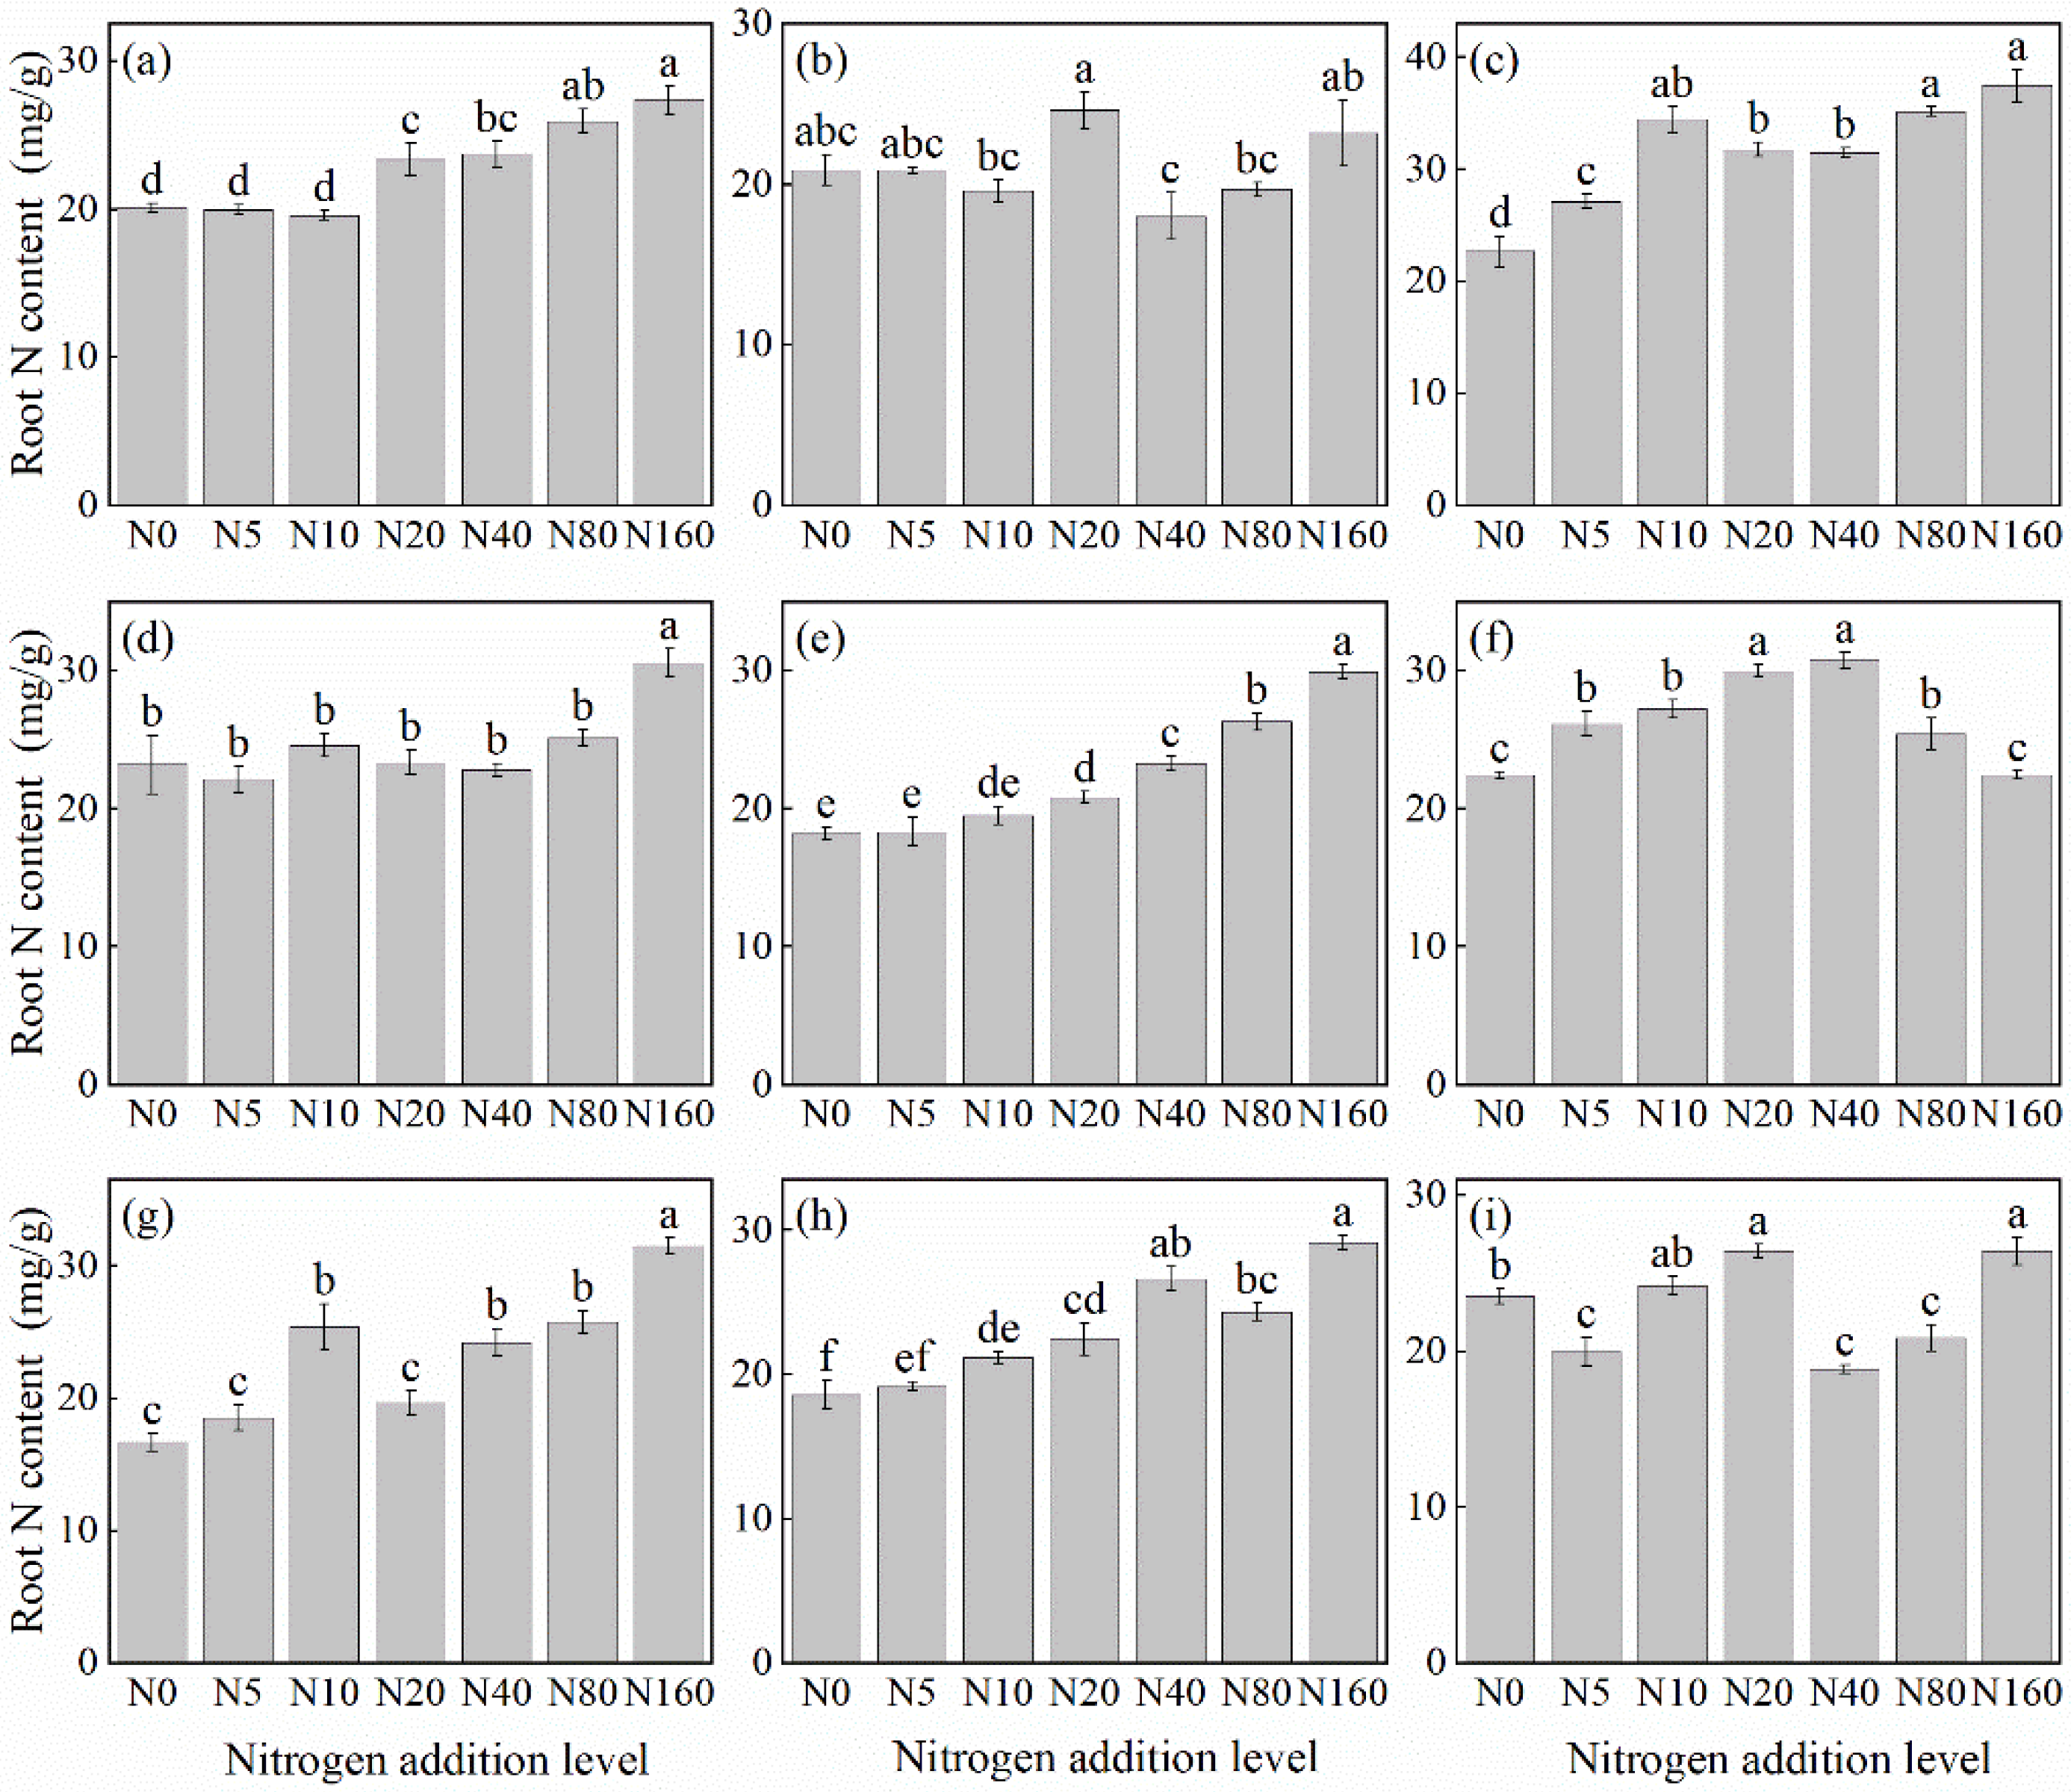
The effects of N addition on the root N concentration of herbaceous plants under L. principis-rupprechtii plantation forests mainly showed two trends: increasing, and first increasing and then decreasing (Figure 2). Species such as V. collina (Figure 2c), G. aleppicum (Figure 2e), P. fragarioides (Figure 2d), A. pilosa (Figure 2a), S. officinalis (Figure 2g), and B. officinalis (Figure 2h) showed increasing trend from 31.76%–88.71% compared with the control. N concentration increased significantly, peaking at 160 kg N ha−1 yr−1. The first increasing and then decreasing trend was observed only in R. japonicus (Figure 2f), peaking at 40 kg N ha−1 yr−1 before declining. The root N concentration of T. aquilegifolium (Figure 2i) and P. maximowiczii (Figure 2b) did not show a consistent pattern with the increase in N addition.
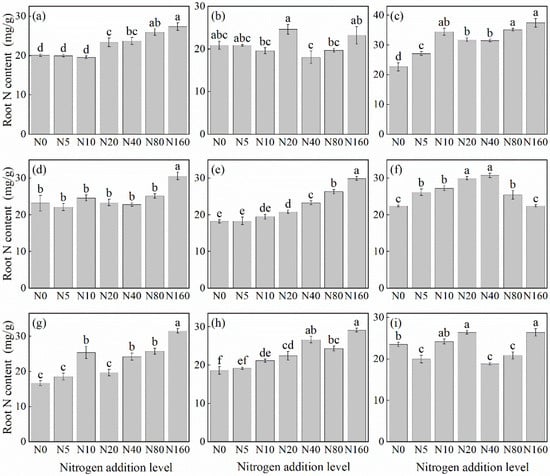
Figure 2.
Changes in root N concentration in plants under different N additions (mean ± SE). (a) Agrimonia pilosa, (b) Phlomis maximowiczii, (c) Viola collina, (d) Potentilla fragarioides, (e) Geum aleppicum, (f) Ranunculus japonicus, (g) Sanguisorba officinalis, (h) Bistorta officinalis, (i) Thalictrum aquilegifolium. Different letters indicate significant differences between different N addition treatment within the same herbaceous plants (p < 0.05).
3.2. Plant P Concentration in Response to N Addition
3.2.1. Leaf P Concentration
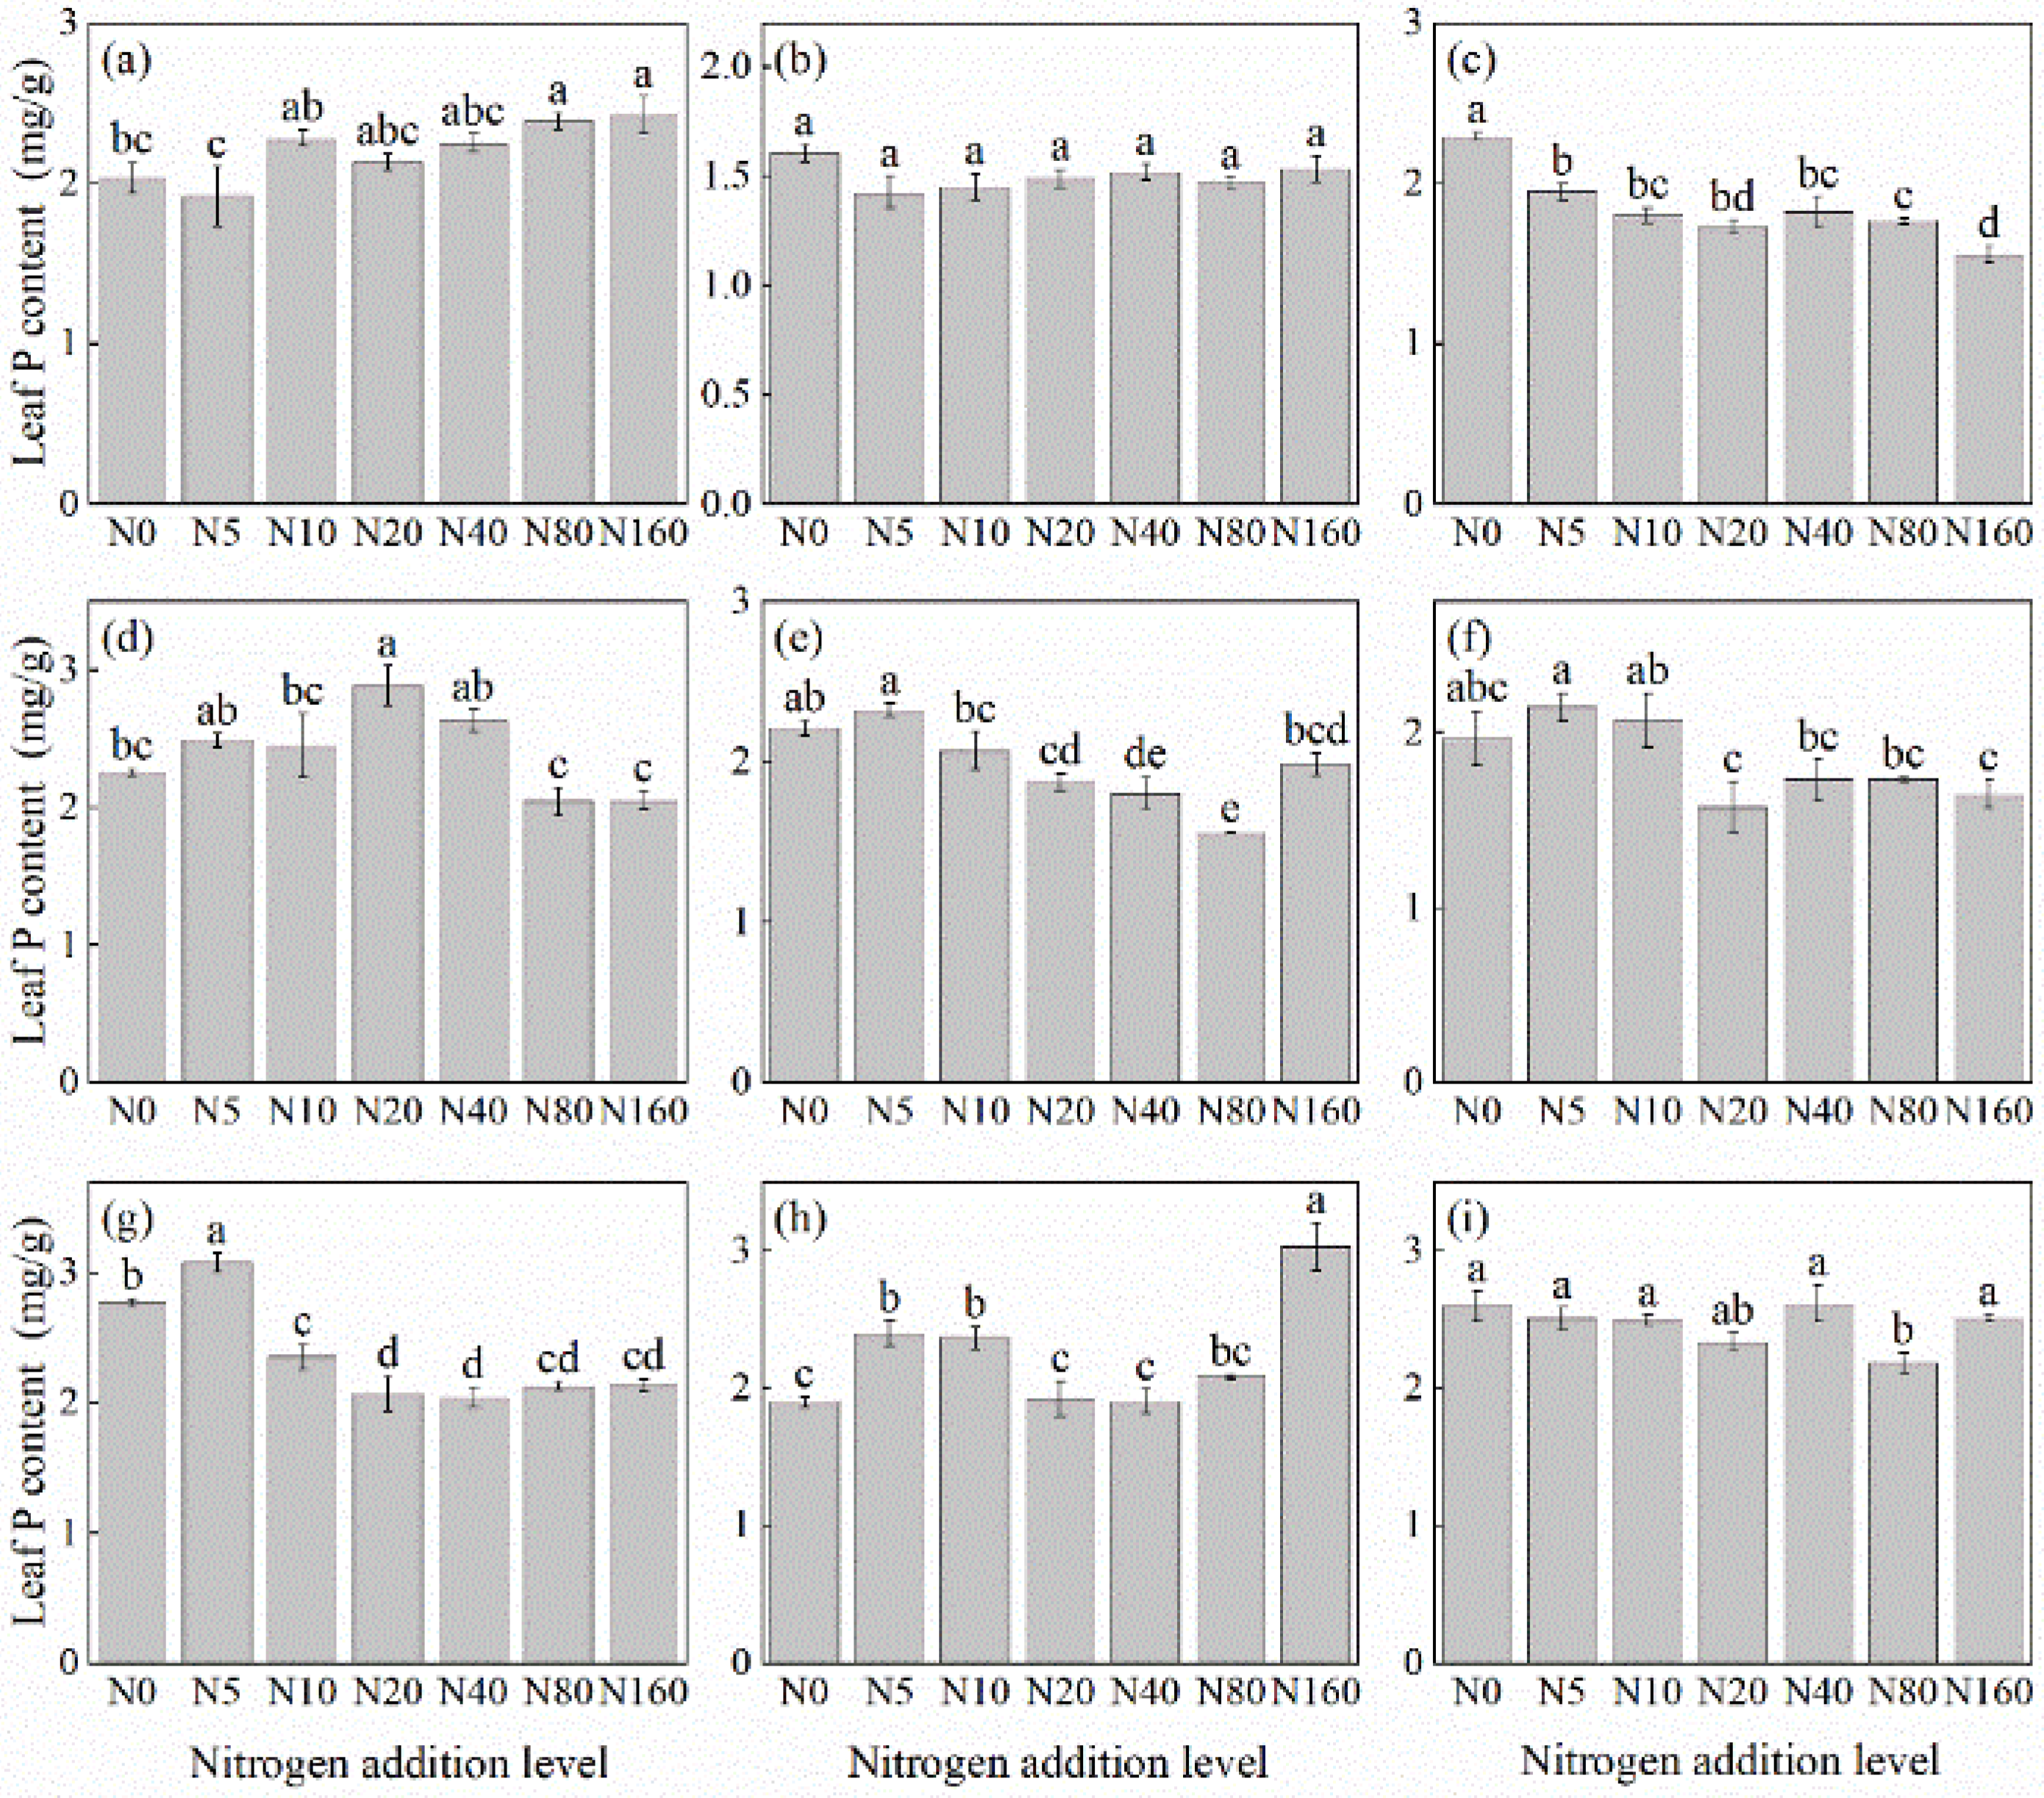
The effects of N addition on leaf P concentration of herbaceous plants under L. principis-rupprechtii plantation forests varied among species, showing mainly four trends: unchanged, increasing, decreasing, and first increasing and then decreasing (Figure 3). The species with unchanged leaf P concentration included T. aquilegifolium (Figure 3i) and P. maximowicziis (Figure 3b). B. officinalis (Figure 3h) and A. pilosa (Figure 3a) exhibited an increasing trend, with increases ranging from 9.45% to 19.44% compared with the control. The decreasing trend was observed in G. aleppicum (Figure 3e), V. collina (Figure 3c), and S. officinalis (Figure 3g), with decreases ranging from 26.40% to 32.14% compared with the control. P. fragarioides (Figure 3d) and R. japonicus (Figure 3f) exhibited an first increasing and then decreasing trend, with P. fragarioides (Figure 3d) peaking at a concentration of 20 kg N ha−1 yr−1 and R. japonicus (Figure 3f) peaking at a concentration of 5 kg N ha−1 yr−1.
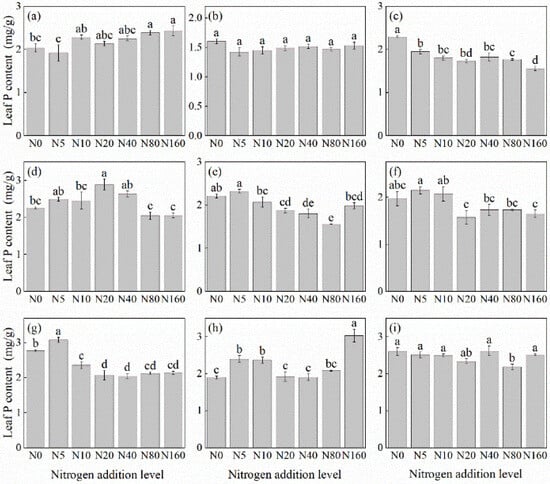
Figure 3.
Changes in leaf P concentration in plants under different N additions (mean ± SE). (a) Agrimonia pilosa, (b) Phlomis maximowiczii, (c) Viola collina, (d) Potentilla fragarioides, (e) Geum aleppicum, (f) Ranunculus japonicus, (g) Sanguisorba officinalis, (h) Bistorta officinalis, (i) Thalictrum aquilegifolium. Different letters indicate significant differences between different N addition treatment within the same herbaceous plants (p < 0.05).
3.2.2. Root P Concentration
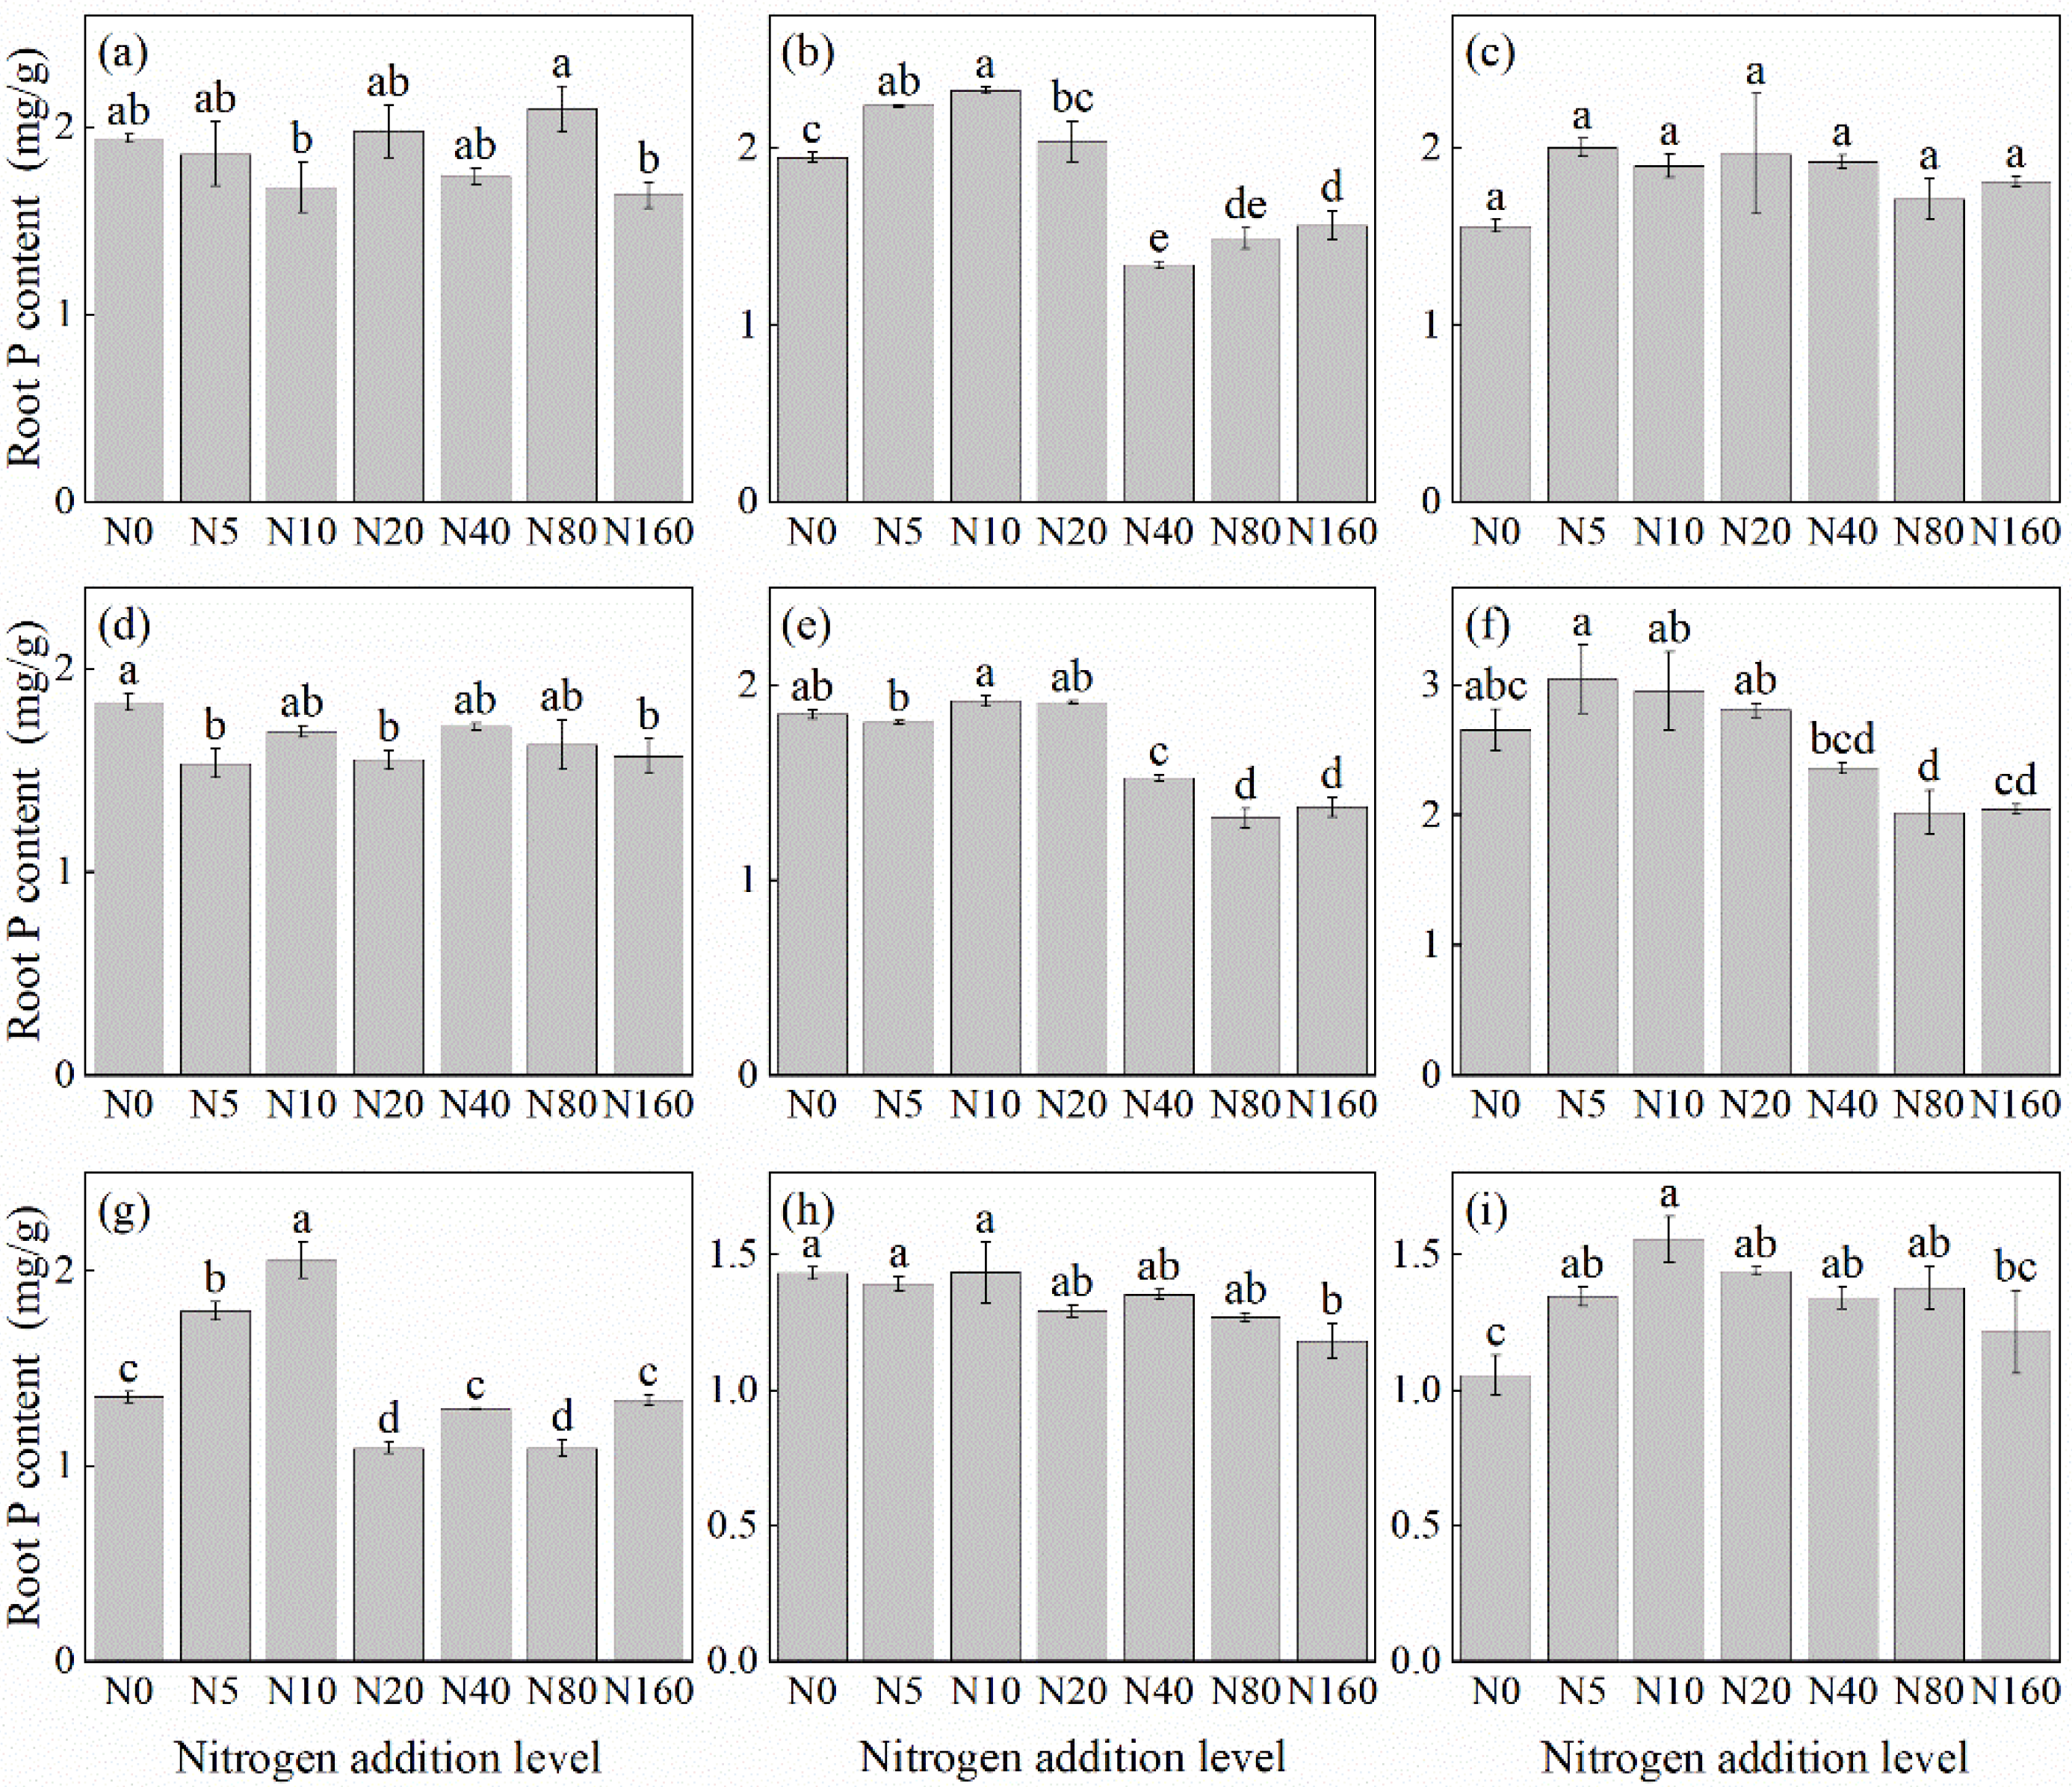
The effects of N addition on the root P concentration of herbaceous plants in L. principis-rupprechtii plantation forests exhibited three main trends: unchanged, first increasing and then decreasing, and decreasing (Figure 4). The unchanged trend was observed in V. collina (Figure 4c) and A. pilosa (Figure 4a). The decreasing trend was observed in P. fragarioides (Figure 4d), R. japonicus (Figure 4f), B. officinalis (Figure 4h), and G. aleppicum (Figure 4e). Compared with the control, the decline ranged from 17.49% to 28.80%, with R. japonicus (Figure 4f) and G. aleppicum (Figure 4e) showing the highest reduction under the 80 kg N ha−1 yr−1 addition. B. officinalis (Figure 4h) exhibited the highest reduction under the 160 kg N ha−1 yr−1 addition. The first increasing and then decreasing trend was observed in T. aquilegifolium (Figure 4i), P. maximowiczii (Figure 4b), and S. officinalis (Figure 4g), all exhibiting the highest P concentration under the 10 kg N ha−1 yr−1 addition. The root P concentration in S. officinalis (Figure 4g) was not significantly different from that in the control group at a higher N concentration (p > 0.05).
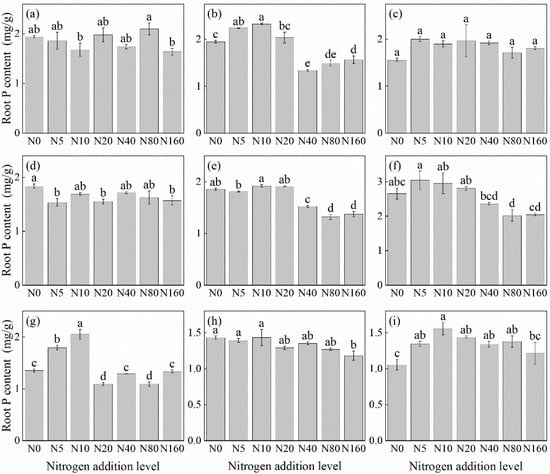
Figure 4.
Changes in root P concentration in plants under different N additions (mean ± SE). (a) Agrimonia pilosa, (b) Phlomis maximowiczii, (c) Viola collina, (d) Potentilla fragarioides, (e) Geum aleppicum, (f) Ranunculus japonicus, (g) Sanguisorba officinalis, (h) Bistorta officinalis, (i) Thalictrum aquilegifolium. Different letters indicate significant differences between different N addition treatment within the same herbaceous plants (p < 0.05).
3.3. Plant N/P Response to N Addition
3.3.1. Leaf N/P Ratio
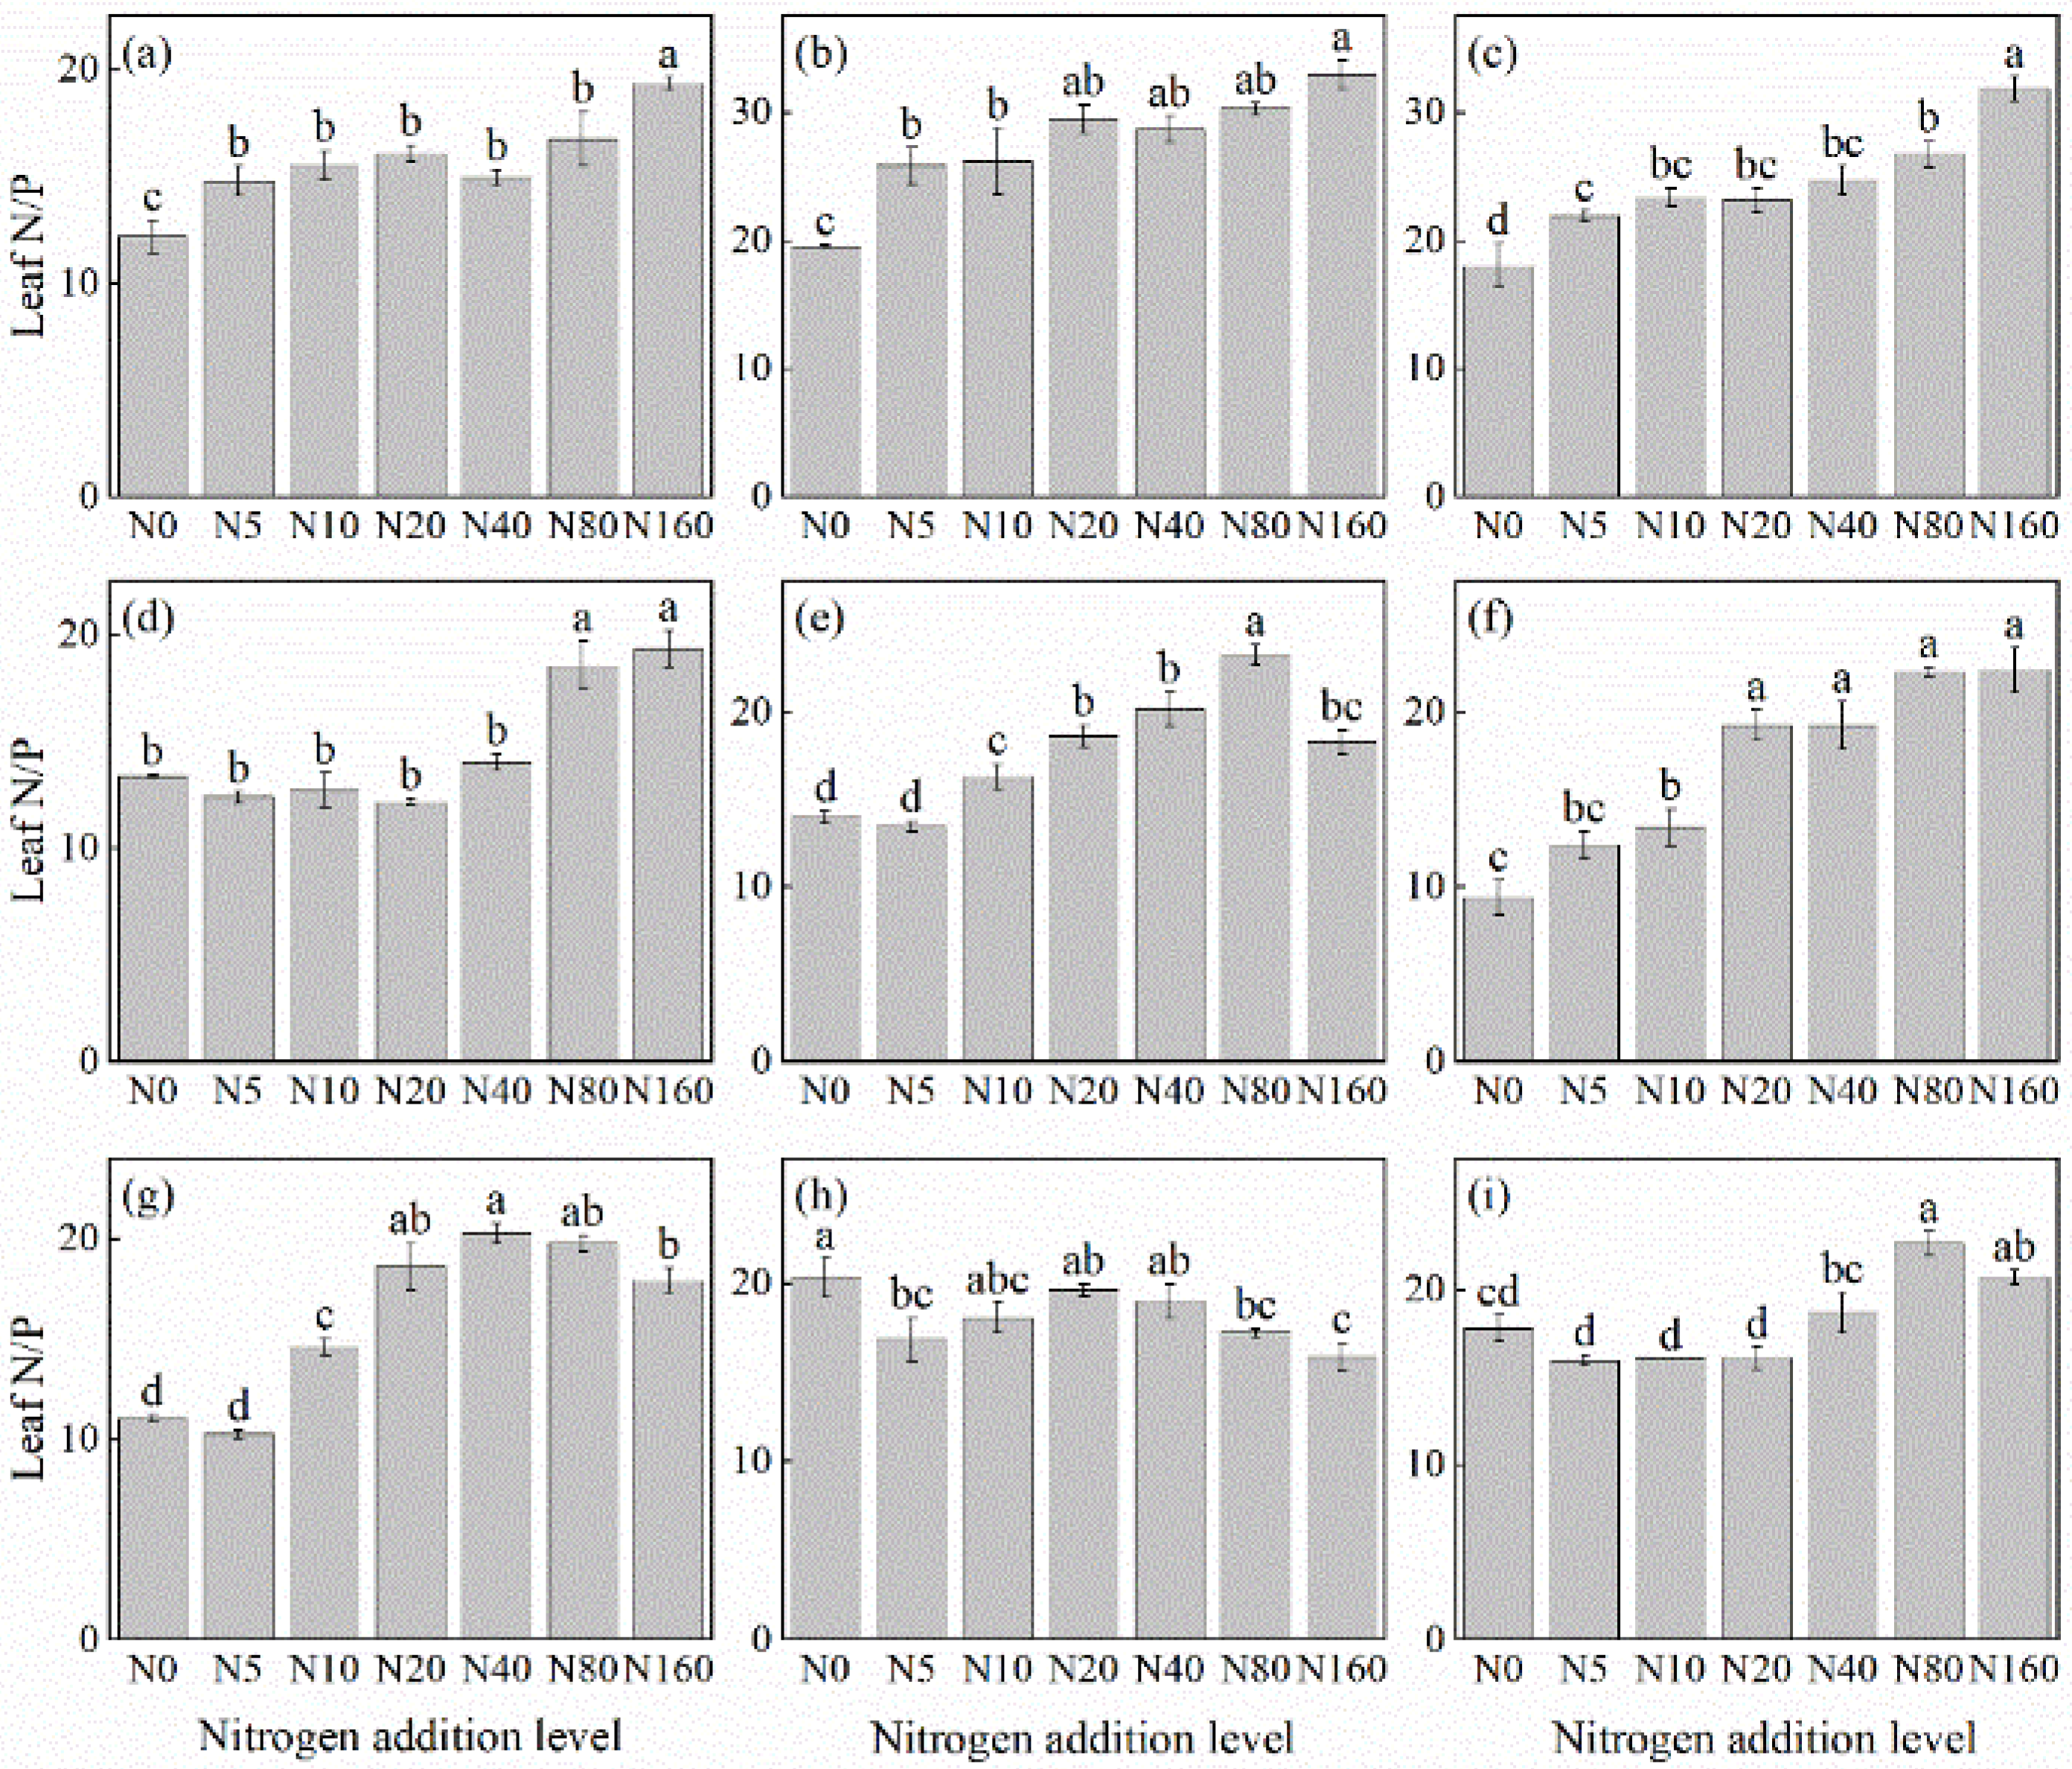
The effects of N addition on the leaf N/P ratio of herbaceous plants in L. principis-rupprechtii plantation forests exhibited three main trends: increasing, decreasing, and first increasing and then decreasing (Figure 5). The increasing trend was observed in R. japonicus (Figure 5f), P. maximowiczii (Figure 5b), P. fragarioides (Figure 5d), V. collina (Figure 5c), T. aquilegifolium (Figure 5i), and A. pilosa (Figure 5a). The species showed increases ranging from 27.27% to 138.24% compared with the control, with the highest values observed under the 160 kg N ha−1 yr−1 addition. The increasing and then decreasing trend was observed in G. aleppicum (Figure 5e) and S. officinalis (Figure 5g), which peaked at concentrations of 80 kg N ha−1 yr−1 and 40 kg N ha−1 yr−1, respectively. Only B. officinalis (Figure 5h) displayed a consistently decreasing trend, with a 21.85% reduction compared with the control; its highest value was recorded under no N addition.
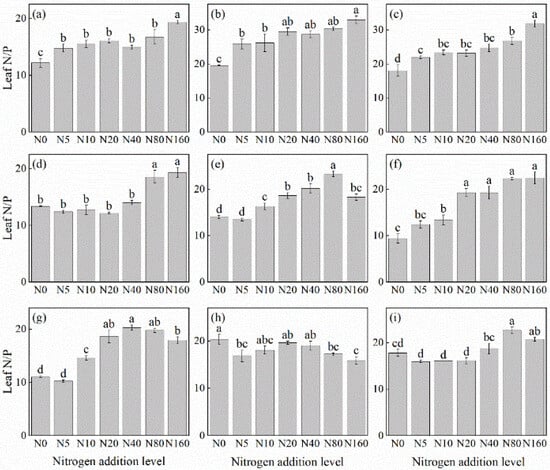
Figure 5.
Changes in the N/P ratios in plant leaves under different N additions (mean ± SE). (a) Agrimonia pilosa, (b) Phlomis maximowiczii, (c) Viola collina, (d) Potentilla fragarioides, (e) Geum aleppicum, (f) Ranunculus japonicus, (g) Sanguisorba officinalis, (h) Bistorta officinalis, (i) Thalictrum aquilegifolium. Different letters indicate significant differences between different N addition treatment within the same herbaceous plants (p < 0.05).
3.3.2. Root N/P Ratio
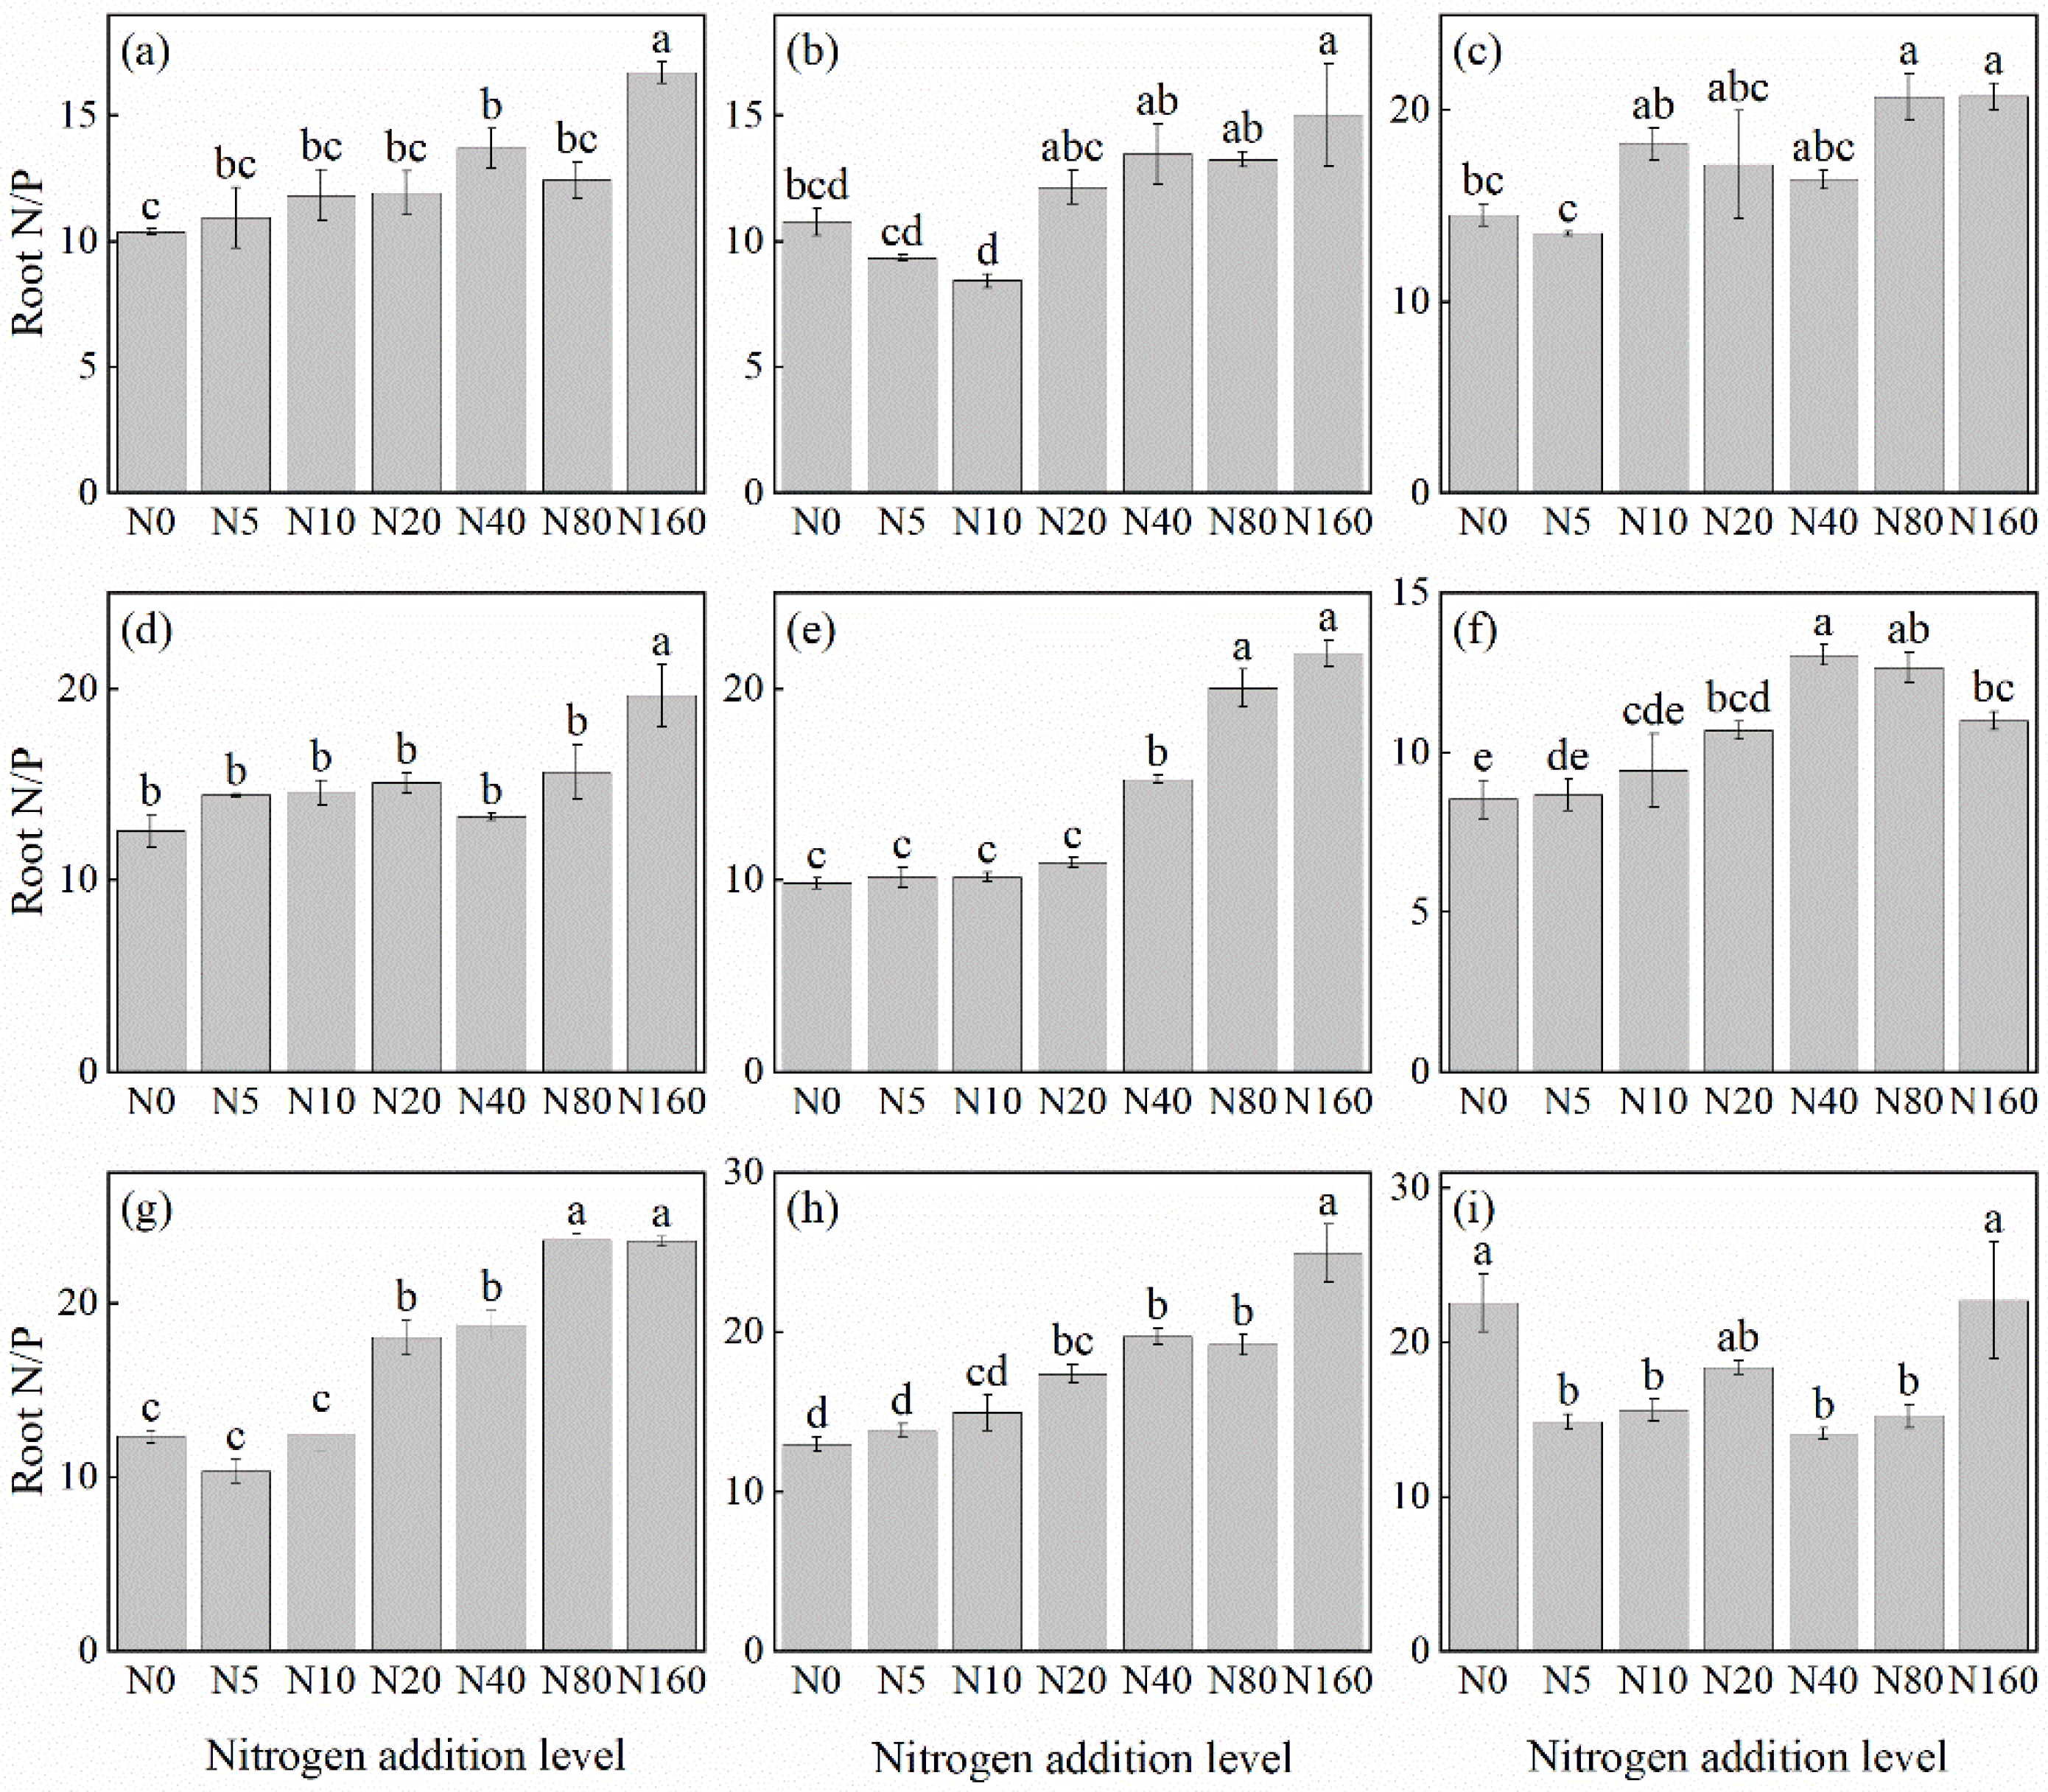
The effects of N addition on the root N/P ratio of herbaceous plants in L. principis-rupprechtii plantations exhibited mainly three trends: unchanged, first increasing and then decreasing, and increasing (Figure 6). The unchanged trend was observed in T. aquilegifolium (Figure 6i). The increasing trend was observed in G. aleppicum (Figure 6e), B. officinalis (Figure 6h), A. pilosa (Figure 6a), V. collina (Figure 6c), P. fragarioides (Figure 6d), S. officinalis (Figure 6g), and P. maximowiczii (Figure 6b), with increases ranging from 39.66% to 122.05% compared with the control. All species exhibited the highest P concentration under the 160 kg N ha−1 yr−1 addition. The first increasing and then decreasing trend was observed only in R. japonicus (Figure 6f), which peaked at the concentration of 40 kg N ha−1 yr−1.
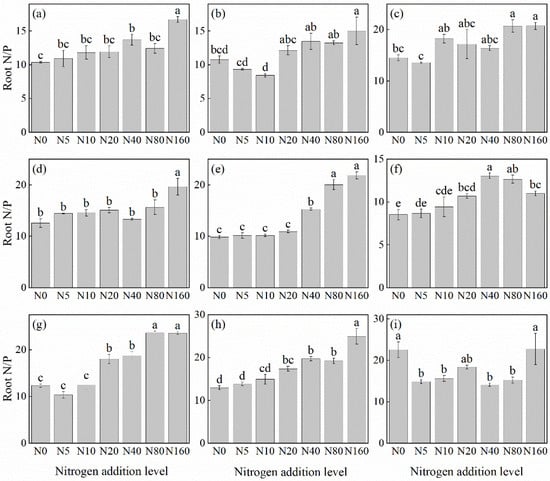
Figure 6.
Changes in the N/P ratios in plant roots under different N additions (mean ± SE). (a) Agrimonia pilosa, (b) Phlomis maximowiczii, (c) Viola collina, (d) Potentilla fragarioides, (e) Geum aleppicum, (f) Ranunculus japonicus, (g) Sanguisorba officinalis, (h) Bistorta officinalis, (i) Thalictrum aquilegifolium. Different letters indicate significant differences between different N addition treatment within the same herbaceous plants (p < 0.05).
3.4. Correlation of Plant N and P Concentrations and Their Ratios with Soil Nutrients
3.4.1. Leaf N and P Concentrations and N/P Ratio
According to the analysis of Figure 7, the leaf N concentration of nine herbaceous plants showed an increasing trend with the increase of NO3−-N, and all of them reached a significant level except B. officinalis and S. officinalis (p < 0.05). P. maximowiczii leaf N contention was positively correlated with NH4+-N and TP (p < 0.05), while P. fragarioides leaf N contention was positively correlated with TP (p < 0.05).
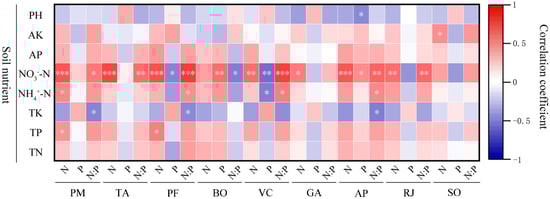
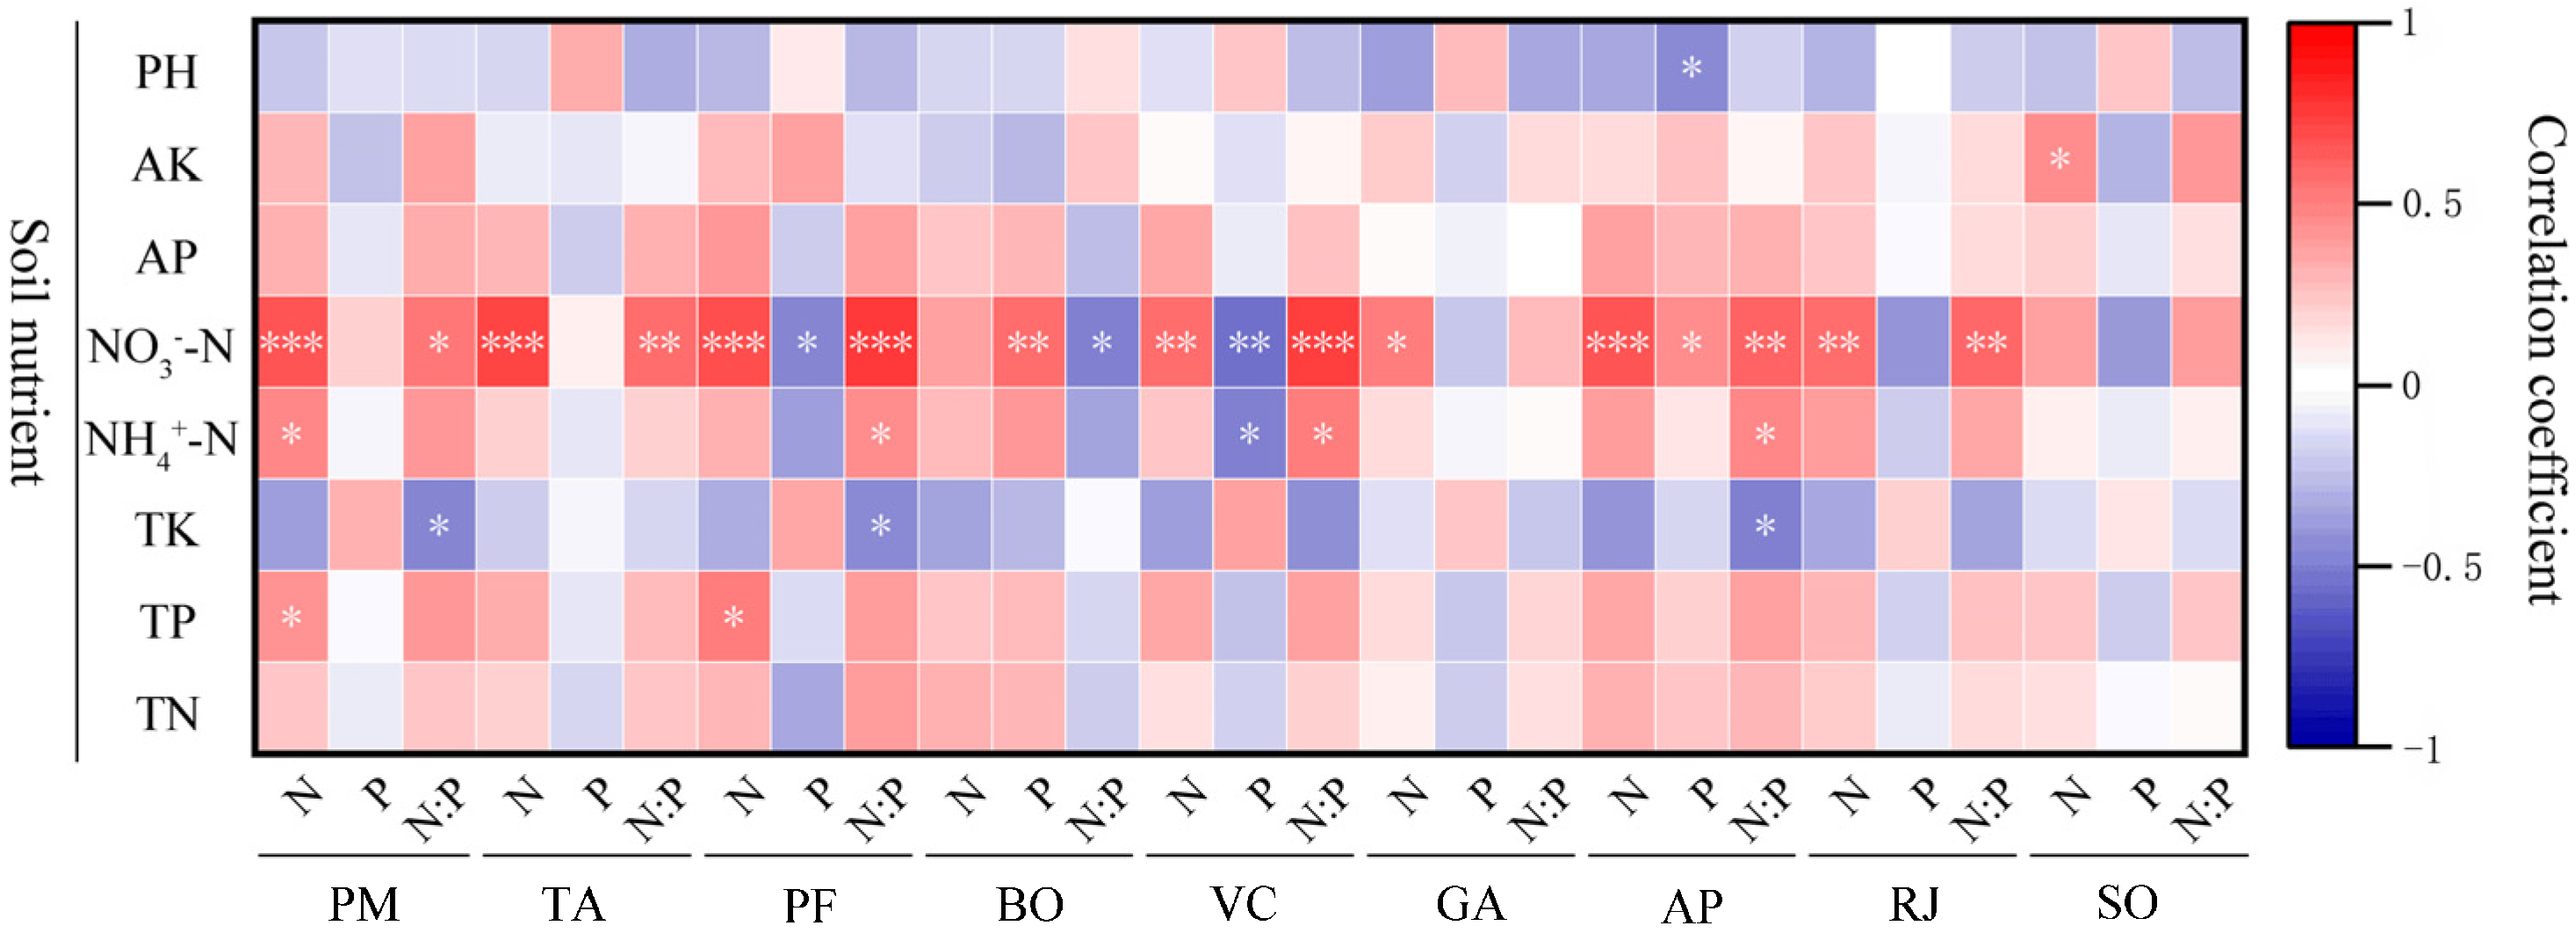
Figure 7.
Correlation analysis of leaf N and P concentrations and ratios with soil nutrient concentrations of different plants. Soil nutrients include pH, AK (soil available potassium concentration), AP (soil available phosphorus concentration), NO3−-N (soil nitrate nitrogen concentration), NH4+-N (soil ammonium nitrogen), TK (soil total potassium concentration), TP (soil total phosphorus concentration), and TN (soil total nitrogen concentration). The plant species studied include PM (Phlomis maximowiczii), TA (Thalictrum aquilegifolium), PF (Potentilla fragarioides), BO (Bistorta officinalis), VC (Viola collina), GA (Geum aleppicum), AP (Agrimonia pilosa), RJ (Ranunculus japonicus), and SO (Sanguisorba officinalis). *** p < 0.001; ** p < 0.01; * p < 0.05.
P. maximowiczii, T. aquilegifolium, B. officinalis, and A. pilosa leaf P contention showed an increasing trend with the increase of NO3−-N, while B. officinalis and A. pilosa reached a significant level (p < 0.05). P. fragarioides, V. collina, G. aleppicum, R. japonicus, and S. officinalis leaf P contention showed a decreasing trend with the increase of NO3−-N, while P. fragarioides and V. collina reached a significant level (p < 0.05). There was a significant negative correlation between V. collina leaf P contention and NH4+-N (p < 0.05), and A. pilosa leaf P contention was significantly negatively correlated with pH (p < 0.05). The leaf P concentration of P. maximowiczii, T. aquilegifolium, G. aleppicum, R. japonicus, and S. officinalis exhibited no significant correlation with soil nutrients.
There was a correlation between leaf N/P and soil nutrients in all nine herbaceous plants. Leaf N/P of B. officinalis was significantly negatively correlated with NO3−-N, and leaf N/P of other plants showed an increasing trend with the increase of NO3−-N. Except for G. aleppicum and S. officinalis, all of them reached a significant level (p < 0.05). Leaf N/P of P. maximowiczii, P. fragarioides, and A. pilosa were negatively correlated with TK (p < 0.05), while leaf N/P of P. fragarioides, V. collina, and A. pilosa were positively correlated with NH4+-N (p < 0.05).
3.4.2. Root N and P Concentrations and N/P Ratio
The analysis of Figure 8 showed that the root N contention of nine herbaceous plants was correlated with soil nutrients. R. japonicus showed a decreasing trend with the increase of NO3−-N, and the other eight plants showed an increasing trend with the increase of NO3−-N, except for P. maximowiczii and T. aquilegifolium, all of which reached significant level (p < 0.05). There was a significant positive correlation between G. aleppicum root N contention and NH4+-N (p < 0.05). No significant correlation was observed between the root N concentration and the soil nutrients of P. maximowiczii and T. aquilegifolium.
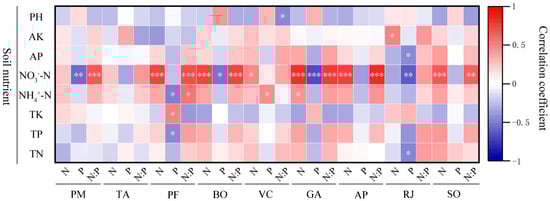
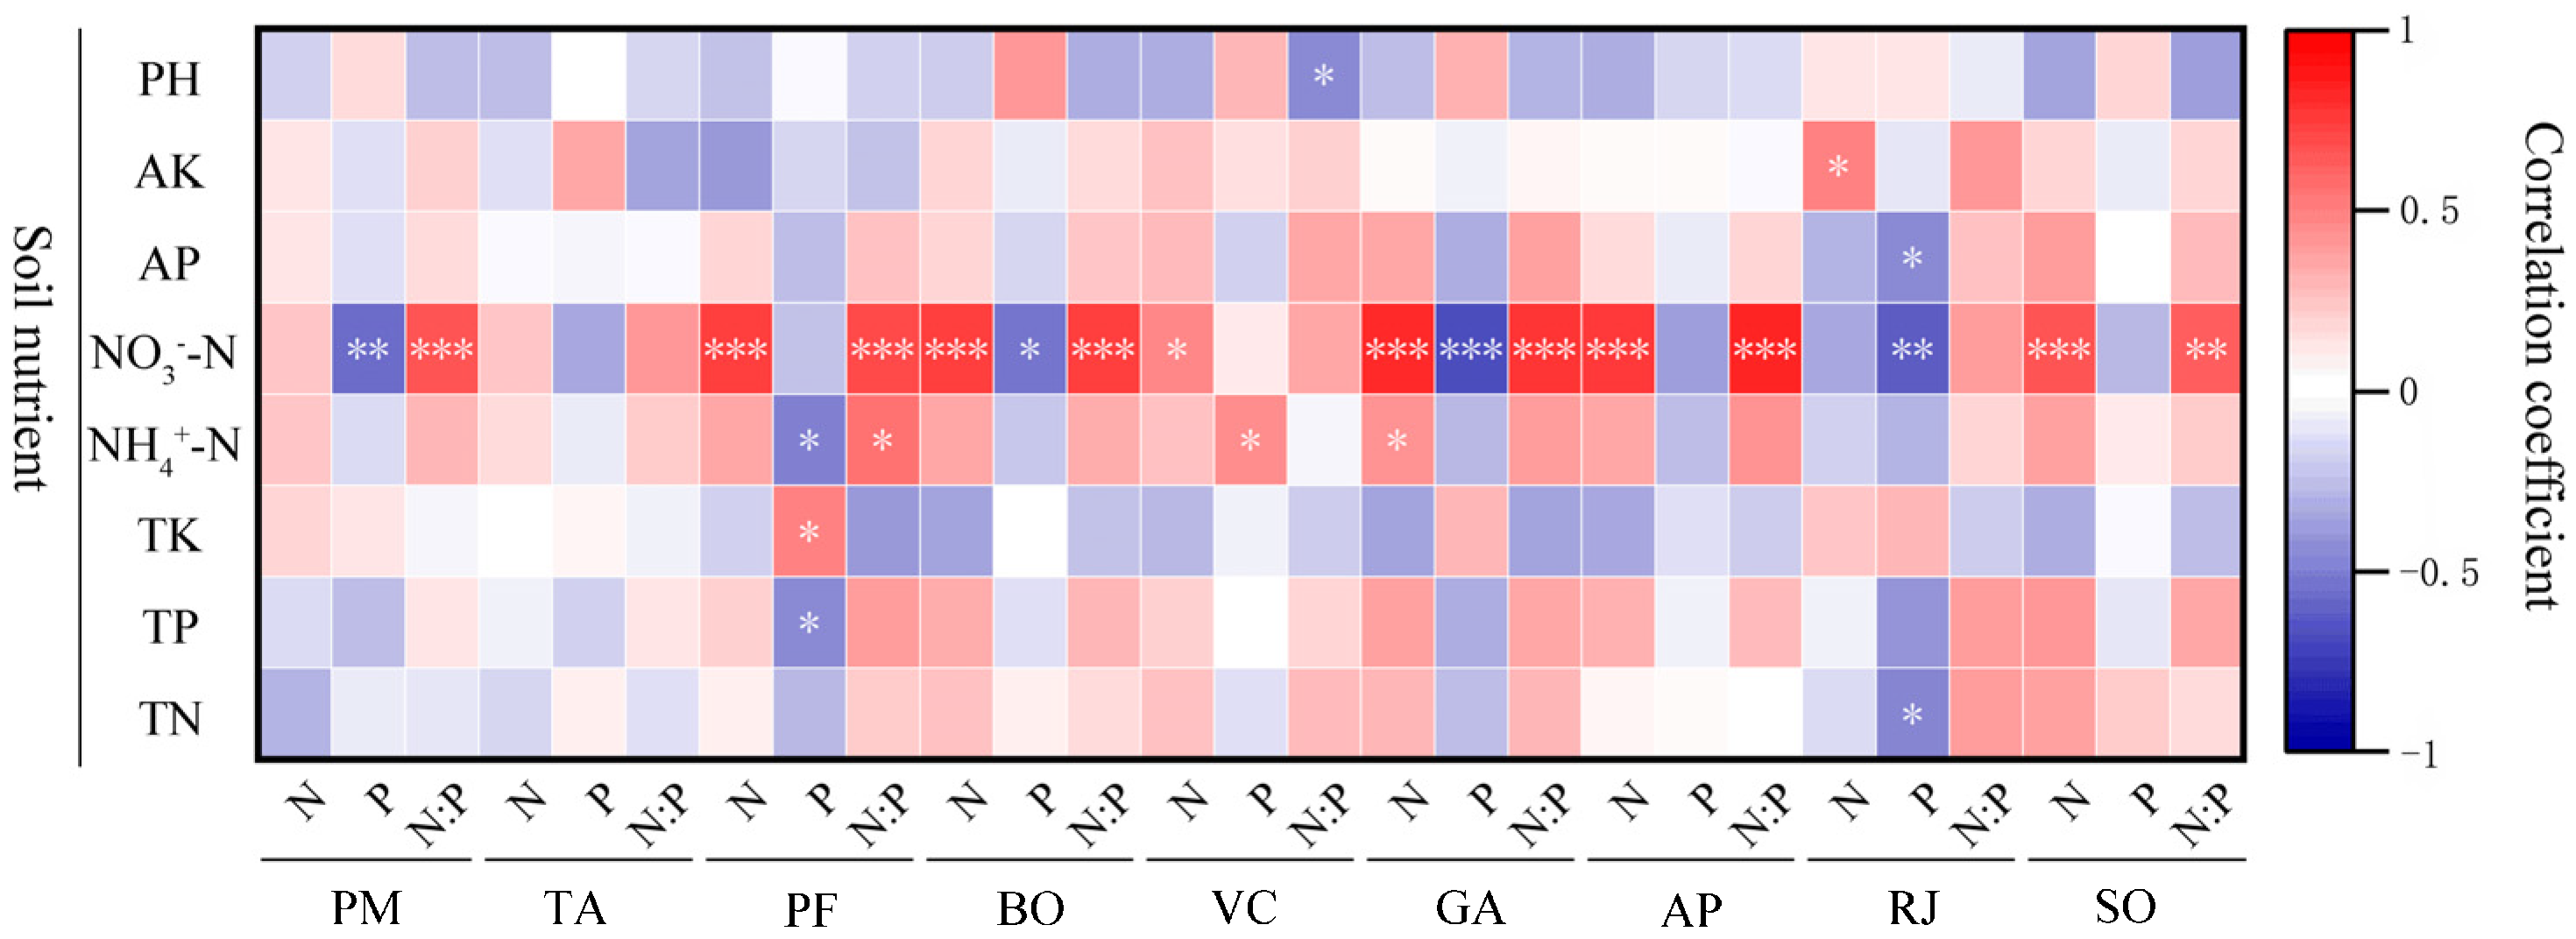
Figure 8.
Correlation analysis of N and P concentrations and ratios of roots and soil nutrient concentration of different plants. Soil nutrients include pH, AK (soil available potassium concentration), AP (soil available phosphorus concentration), NO3−-N (soil nitrate nitrogen concentration), NH4+-N (soil ammonium nitrogen concentration), TK (soil total potassium concentration), TP (soil total phosphorus concentration), and TN (soil total nitrogen concentration). The plant species studied include PM (Phlomis maximowiczii), TA (Thalictrum aquilegifolium), PF (Potentilla fragarioides), BO (Bistorta officinalis), VC (Viola collina), GA (Geum aleppicum), AP (Agrimonia pilosa), RJ (Ranunculus japonicus), and SO (Sanguisorba officinalis). *** p < 0.001; ** p < 0.01; * p < 0.05.
The root P contention of nine herbs showed a decreasing trend with the increase of NO3−-N, among which P. maximowiczii, B. officinalis, G. aleppicum, and R. japonicus reached significant levels. The P. fragarioides root P contention was negatively correlated with NH4+-N and TP, and positively correlated with TK. V. collina root P contention was positively correlated with NH4+-N. The P content of R. japonicus root was negatively correlated with AP and TN. No significant correlation was observed in the root P concentration and soil nutrients of T. aquilegifolium, A. pilosa, and S. officinalis.
The root N/P of nine herbaceous plants was all correlated with soil nutrients. They all showed an upward trend with the increase of NO3−-N, except for T. aquilegifolium, V. collina, and R. japonicus, which reached significant level. P. fragarioides root N/P was significantly positively correlated with NH4+-N, while V. collina root NP was significantly negatively correlated with pH. The root N/P ratios of T. aquilegifolium and R. japonicus were not significantly correlated with soil nutrients.
4. Discussion
4.1. Effects of N Addition on the N Concentration of Herbaceous Plants
This study showed that the N concentration in the roots and leaves of different species of miscellaneous grass functional groups in the understory of L. principis-rupprechtii plantation forests manifested as an increase with the level of N addition.
Overall, N addition increased the N concentration in the roots and leaves of different species of the miscellaneous grass functional group to varying degrees. In this study, the leaf and root N concentrations of A. pilosa, V. collina, P. fragarioides, G. aleppicum, S. officinalis, and B. officinalis showed an increasing trend, which was consistent with the findings of Sun, Shi, Su, and Yan [9,11,18,19]. The correlation analysis indicated that N addition mainly increased plant N concentration by increasing the availability of soil nutrients such as NH4+-N and NO3−-N [14,20]. In this study, the root N concentration of V. collina, G. aleppicum, B. officinalis, and S. officinalis responded more significantly to N additions than their leaves. This might be because the above-ground portions of the perennial herbaceous plants died off annually, whereas the below-ground parts of the plant persisted, indicating a cumulative effect of N addition on plant roots [21].
Different species and plant organs have varying requirements and sensitivities to N, leading to differences in their responses to N addition. For instance, the root N concentration of R. japonicus first showed an increasing and then decreasing trend, reaching a maximum at 40 kg N ha−1 yr−1 addition. This pattern can be interpreted using N saturation theory [22]. N addition increased in soil available N content especially soil NO3− in this experiment [15], which alleviated N limitations for R. japonicus in low N addition. When N addition reached the threshold of some plants, such as R. japonicus, the negative effects of N addition appeared, such as P limitation and soil acidification. As a result, plants can reduce the absorption of N.
Thus, the effects of nutrient limitations on ecosystem stability cannot be predicted solely based on the response of the above-ground plant parts. This further underscores the need to study the dynamics of subsurface ecosystems. In addition, plants of the miscellaneous grass functional group are less sensitive to N addition compared with Gramineae and Leguminosae [23]. The root N concentration of T. aquilegifolium and P. maximowiczii in this study did not show a consistent response to N addition for the time being.
4.2. Effects of N Addition on the P Concentration of Herbaceous Plants
The effects of N addition on P concentration in plants are species-specific [24]. Wang summarized previous studies and found that different plants had varying nutrient absorption efficiencies and utilization strategies, making the impact of N addition on P concentration more complex than that on N concentration. These effects can be broadly categorized as positive, negative, and neutral [25]. If plants are under N-limitation conditions, N addition increases the plant growth, which can result in the growth dilution effect. Therefore, N addition reduces the P concentration in plants, showing a negative effect. If plants are under P-limiting conditions, N addition can aggravate the P limitation. Therefore, plants exhibit an increase in demand and absorption of P to maintain a stable N/P in leaves or roots when the N concentrations increase in the plants with the N addition. So, the plant’s P concentration increases showed a positive effect. If plants are under N and P-limitation conditions, N addition has an almost neutral effect on plant P concentration.
You’s study also confirmed that N addition might exacerbate P limitations under N-limitation conditions [26]. Studies have shown that N deposition can accelerate the release of AP from soil by changing the physical and chemical properties of soil, thereby increasing the P concentration of plant leaves with the increase in N deposition [27,28]. In this study, the P concentration in the roots and leaves of R. japonicus and P. fragarioides remained unchanged, suggesting that plants experienced co-limitation by N and P. The P concentration in both the leaves and roots of G. aleppicum indicated an N-limitation condition, aligning with the findings of Wang [25]. The P concentration in the leaves of B. officinalis and A. pilosa increased [13,29]. The P concentration in the leaves of V. collina and S. officinalis decreased [14].
In addition, the variations in leaf and root P concentration among the six plants were inconsistent, possibly attributed to changing soil nutrient conditions. These changes affect the distribution of nutrients between above-ground and below-ground plant parts [30]. Underground parts of perennial plants persist for many years, whereas their above-ground parts are renewed annually. This leads to incongruent changes in the plant P concentration in the above-ground parts. Studies have shown that most plants achieve their highest P concentration at a concentration of 5–10 kg N ha−1 yr−1, supporting the idea that lower levels of N addition promote better phosphorus absorption by herbaceous plants [24].
4.3. Effect of N Addition on N/P Ratio of Herbaceous Plants
Plant N/P ratios are influenced by the differences in nutrient uptake and distribution, biomass turnover, species growth rate, plant age, and site conditions [31]. Jack showed that plant N/P ratios, which indicate N or P limitations, varied across ecosystem types [32]. N addition usually significantly increases plant N concentration, although changes in P concentration are less pronounced. As a result, N/P ratios generally show an upward trend. In this study, the N/P ratios in the leaves and roots of eight plants, except B. officinalis, showed an overall upward trend [11,33].
The root N/P ratio of B. officinalis showed an increasing trend, and its leaf N/P ratio showed a decreasing trend, consistent with the findings of Zheng [12]. Studies have shown that when N/P ratios exceed 16, plants are no longer N-limited [34]. Under the control addition, the N/P ratio was 20, indicating that N addition had little effect on the N concentration in the leaves in P-limited ecosystems. Excess N existed in the form of phosphatase, accelerated P transformation in the soil, and promoted the absorption of P by plants, thereby significantly increasing the P concentration in the leaves and decreasing the N/P ratio.
Han’s large-scale study of N and P concentration in leaves of 753 plant species in China’s grasslands found that different functional groups responded differently to the changes in the same environmental conditions [35,36]. Previous studies showed that forbs’ functional groups were less sensitive to N addition than functional groups of forbs and legumes. The nine species of herbaceous plants selected in this study belonged to forbs functional groups, but their responses to N addition were not uniform. Under N addition, the utilization strategies of mineral elements such as N and P vary depending on the nutrient requirements, competitiveness, and dominance of different species. When nutrient conditions in an ecosystem change, nutrients are often preferentially absorbed by plants with higher productivity and competitiveness [29]. This is one of the factors explaining why different species exhibit different responses to N additions.
Over time, plants have gradually developed unique physiological and ecological characteristics based on their growth, development, and environmental conditions. The changes in element concentration and stoichiometry reflect these characteristics. N addition mainly changes the physical and chemical properties of soil, increases available N concentration in the soil, and changes the nutrient absorption efficiency of plants, thus affecting element concentration in plants.
5. Conclusions
On the whole, in our study, N addition significantly increased N content in two-thirds of the herbaceous plants. However, the degree of influence and the response patterns in the roots and leaves of these plants varied. N addition significantly affected the P concentration in the nine species, but the P concentration of plants showed four different trends depending on the species and plant parts: increasing, decreasing, unchanged, and first increasing and then decreasing. Additionally, the N/P ratios in the roots and leaves of most plants showed an increasing trend, indicating that N addition alleviated the N nutrient limitation in these plants under L. principis-rupprechtii plantation forests.
Author Contributions
Y.J. and Z.X. contributed to the design of this study. S.W., Z.L. (Zehua Liu), J.L. and J.M. collected experimental samples. S.W., T.Z., Z.L. (Zuhong Li) and C.L. performed the experiment. S.W. and X.L. performed the statistical analysis. S.W. wrote the first draft of the manuscript with contributions from all authors. All authors have read and agreed to the published version of the manuscript.
Funding
This study was supported by the National Natural Science Foundation of China [31700377] and the Natural Science Foundation of Hebei [C2018204096].
Data Availability Statement
The original contributions presented in this study are included in this article; further inquiries can be directed to the corresponding author.
Conflicts of Interest
The authors declare no conflicts of interest.
References
- Zhu, J.X.; Jia, Y.L.; Yu, G.R.; Wang, Q.; He, N.P.; Chen, Z.; He, H.L.; Zhu, X.J.; Li, P.; Zhang, F.S.; et al. Changing Patterns of Global Nitrogen Deposition Driven by Socio-Economic Development. Nat. Commun. 2025, 16, 46. [Google Scholar] [CrossRef] [PubMed]
- Yu, G.R.; Jia, Y.L.; He, N.P.; Zhu, J.X.; Chen, Z.; Wang, Q.F.; Piao, S.L.; Liu, X.J.; He, H.L.; Guo, X.L.; et al. Stabilization of Atmospheric Nitrogen Deposition in China over the Past Decade. Nat. Geosci. 2019, 12, 424–429. [Google Scholar] [CrossRef]
- Huang, W.J.; Zhou, G.Y.; Liu, J.X.; Zhang, D.Q.; Xu, Z.H.; Liu, S.Z. Effects of Elevated Carbon Dioxide and Nitrogen Addition on Foliar Stoichiometry of Nitrogen and Phosphorus of Five Tree Species in Subtropical Model Forest Ecosystems. Environ. Pollut. 2012, 168, 113–120. [Google Scholar] [CrossRef] [PubMed]
- Dinis, M.D.L.; In, M. Spatial Variability of Atmosphere Dust Fallout Flux in Urban–Industrial Environments. Atmosphere 2020, 11, 1069. [Google Scholar] [CrossRef]
- Zhang, W.J.; She, W.W.; Qin, S.G.; Qiao, Y.G.; Zhang, Y.Q. Effects of nitrogen and water addition on leaf nitrogen and phosphorus stoichiometry of the dominant species in an Artemisia ordosica community. Chin. J. Plant Ecol. 2024, 48, 590–600. [Google Scholar]
- Mo, Q.F.; Zou, B.; Li, Y.W.; Chen, Y.; Zhang, W.X.; Mao, R.; Ding, Y.Z.; Wang, J.; Lu, X.K.; Li, X.B.; et al. Response of Plant Nutrient Stoichiometry to Fertilization Varied with Plant Tissues in a Tropical Forest. Sci. Rep. 2015, 5, 14605. [Google Scholar] [CrossRef]
- Vitousek, P.M.; Porder, S.; Houlton, B.Z.; Chadwick, O.A. Terrestrial Phosphorus Limitation: Mechanisms, Implications, and Nitrogen–Phosphorus Interactions. Ecol. Appl. 2010, 20, 5–15. [Google Scholar] [CrossRef]
- Bu, W.S.; Chen, F.S.; Wang, F.C.; Fang, X.M.; Mao, R.; Wang, H.M. The Species-Specific Responses of Nutrient Resorption and Carbohydrate Accumulation in Leaves and Roots to Nitrogen Addition in a Subtropical Mixed Plantation. Can. J. For. Res. 2019, 49, 826–835. [Google Scholar] [CrossRef]
- Su, Y.; Ma, X.F.; Le, J.J.; Li, K.H.; Han, W.X.; Liu, X.J. Decoupling of Nitrogen and Phosphorus in Dominant Grass Species in Response to Long-Term Nitrogen Addition in an Alpine Grassland in Central Asia. Plant Ecol. 2021, 222, 261–274. [Google Scholar] [CrossRef]
- Mao, Q.G.; Lu, X.K.; Mo, H.; Gundersen, P.; Mo, J.M. Effects of Simulated N Deposition on Foliar Nutrient Status, N Metabolism and Photosynthetic Capacity of Three Dominant Understory Plant Species in a Mature Tropical Forest. Sci. Total Environ. 2018, 610–611, 555–562. [Google Scholar] [CrossRef]
- Yan, T.; Qu, T.T.; Song, H.H.; Ciais, P.; Piao, S.L.; Sun, Z.Z.; Zeng, H. Contrasting Effects of N Addition on the N and P Status of Understory Vegetation in Plantations of Sapling and Mature Larix Principis-Rupprechtii. J. Plant Ecol. 2018, 11, 843–852. [Google Scholar] [CrossRef]
- Zheng, Z.M.; Lu, J.; Su, Y.Q.; Yang, Q.S.; Lin, Y.H.; Liu, H.M.; Yang, J.; Huang, H.; Wang, X.H. Differential Effects of N and P Additions on Foliar Stoichiometry between Species and Community Levels in a Subtropical Forest in Eastern China. Ecol. Indic. 2020, 117, 106537. [Google Scholar] [CrossRef]
- Wang, Q.S.Y.; Zheng, C.Y.; Zhang, X.Y.; Zeng, F.X.; Xing, J. Impacts of Nitrogen Addition on Foliar Nitrogen and Phosphorus Stoichiometry in a Subtropical Evergreen Broad-Leaved Forest in Mount Wuyi. Chin. J. Plant Ecol. 2016, 40, 1124–1135. [Google Scholar]
- Lu, M.; Yang, Y.H.; Luo, Y.Q.; Fang, C.M.; Zhou, X.H.; Chen, J.K.; Yang, X.; Li, B. Responses of Ecosystem Nitrogen Cycle to Nitrogen Addition: A Meta-analysis. New Phytol. 2011, 189, 1040–1050. [Google Scholar] [CrossRef] [PubMed]
- Yang, X.C.; Yang, L.; Li, Q.R.; Li, X.; Xu, G.Q.; Xu, Z.Q.; Jia, Y.L. Short-Term Responses of Soil Nutrients and Enzyme Activities to Nitrogen Addition in a Larix Principis-Rupprechtii Plantation in North China. Front. Ecol. Evol. 2023, 11, 1105150. [Google Scholar] [CrossRef]
- Du, E.; Terrer, C.; Pellegrini, A.F.A.; Ahlström, A.; Van Lissa, C.J.; Zhao, X.; Xia, N.; Wu, X.; Jackson, R.B. Global Patterns of Terrestrial Nitrogen and Phosphorus Limitation. Nat. Geosci. 2020, 13, 221–226. [Google Scholar] [CrossRef]
- Yang, L.; Jia, Y.L.; Li, Q.R.; Cui, H.N.; Lu, J.P.; Ma, J.J.; Xu, Z.Q. Ecoenzymatic Stoichiometry in the Rhizosphere and Bulk Soil of a Larix Principis-Rupprechtii Plantation in North China. Forests 2023, 14, 1315. [Google Scholar] [CrossRef]
- Sun, Y.; Wang, C.T.; Chen, H.Y.H.; Ruan, H.H. Responses of C:N Stoichiometry in Plants, Soil, and Microorganisms to Nitrogen Addition. Plant Soil. 2020, 456, 277–287. [Google Scholar] [CrossRef]
- Bennett, L.T.; Adams, M.A. Response of a Perennial Grassland to Nitrogen and Phosphorus Additions in Sub-Tropical, Semi-Arid Australia. J. Arid. Environ. 2001, 48, 289–308. [Google Scholar] [CrossRef]
- Zeng, W.J.; Zhang, J.Y.; Wang, W. Strong Root Respiration Response to Nitrogen and Phosphorus Addition in Nitrogen-Limited Temperate Forests. Sci. Total Environ. 2018, 642, 646–655. [Google Scholar] [CrossRef]
- Wang, Y.H.; Wang, C.; Ren, F.; Jing, X.; Ma, W.H.; He, J.S.; Jiang, L. Asymmetric Response of Aboveground and Belowground Temporal Stability to Nitrogen and Phosphorus Addition in a Tibetan Alpine Grassland. Glob. Change Biol. 2023, 29, 7072–7084. [Google Scholar] [CrossRef] [PubMed]
- Aber, J.; McDowell, W.; Nadelhoffer, K.; Magill, A.; Berntson, G.; Kamakea, M.; McNulty, S.; Currie, W.; Rustad, L.; Fernandez, I. Nitrogen Saturation in Temperate Forest Ecosystems. BioScience 1998, 48, 921–934. [Google Scholar] [CrossRef]
- Xia, J.Y.; Wan, S.Q. Global Response Patterns of Terrestrial Plant Species to Nitrogen Addition. New Phytol. 2008, 179, 428–439. [Google Scholar] [CrossRef] [PubMed]
- Lü, X.T.; Reed, S.C.; Yu, Q.; Han, X.G. Nutrient Resorption Helps Drive Intra-Specific Coupling of Foliar Nitrogen and Phosphorus under Nutrient-Enriched Conditions. Plant Soil 2016, 398, 111–120. [Google Scholar] [CrossRef]
- Wang, Z.Q.; Wang, J.; Wu, H.H.; Yang, T.; An, Y.X.; Zhang, Y.L.; Bian, J.L.; Li, Y.; Ren, H.Y.; Lkhagva, A.; et al. Nitrogen Addition Alters Aboveground C:N:P Stoichiometry of Plants but Not for Belowground in an Inner Mongolia Grassland. J. Plant Ecol. 2024, 17, rtad041. [Google Scholar] [CrossRef]
- You, C.M.; Wu, F.Z.; Yang, W.Q.; Xu, Z.F.; Tan, B.; Yue, K.; Ni, X.Y. Nutrient-Limited Conditions Determine the Responses of Foliar Nitrogen and Phosphorus Stoichiometry to Nitrogen Addition: A Global Meta-Analysis. Environ. Pollut. 2018, 241, 740–749. [Google Scholar] [CrossRef] [PubMed]
- Crowley, K.F.; McNeil, B.E.; Lovett, G.M.; Canham, C.D.; Driscoll, C.T.; Rustad, L.E.; Denny, E.; Hallett, R.A.; Arthur, M.A.; Boggs, J.L.; et al. Do Nutrient Limitation Patterns Shift from Nitrogen Toward Phosphorus with Increasing Nitrogen Deposition Across the Northeastern United States? Ecosystems 2012, 15, 940–957. [Google Scholar] [CrossRef]
- Dong, J.L.; Xu, H.; Xie, Y.X.; Chen, J.; Li, Y.P.; Lei, J. Effects of nitrogen addition on root morphology and nutrient content of roots and leaves of leguminous seedlings with different nitrogen requirements. Chin. J. Ecol. 2023, 43, 1255–1262. [Google Scholar]
- Rocci, K.S.; Barker, K.S.; Seabloom, E.W.; Borer, E.T.; Hobbie, S.E.; Bakker, J.D.; MacDougall, A.S.; McCulley, R.L.; Moore, J.L.; Raynaud, X.; et al. Impacts of Nutrient Addition on Soil Carbon and Nitrogen Stoichiometry and Stability in Globally-Distributed Grasslands. Biogeochemistry 2022, 159, 353–370. [Google Scholar] [CrossRef]
- Kou, L.; Wang, H.M.; Gao, W.L.; Chen, W.W.; Yang, H.; Li, S.G. Nitrogen Addition Regulates Tradeoff between Root Capture and Foliar Resorption of Nitrogen and Phosphorus in a Subtropical Pine Plantation. Trees 2017, 31, 77–91. [Google Scholar] [CrossRef]
- He, X.J.; Hou, E.Q.; Liu, Y.; Wen, D.Z. Altitudinal Patterns and Controls of Plant and Soil Nutrient Concentrations and Stoichiometry in Subtropical China. Sci. Rep. 2016, 6, 24261. [Google Scholar] [CrossRef] [PubMed]
- Tessier, J.T.; Raynal, D.J. Use of Nitrogen to Phosphorus Ratios in Plant Tissue as an Indicator of Nutrient Limitation and Nitrogen Saturation. J. Appl. Ecol. 2003, 40, 523–534. [Google Scholar] [CrossRef]
- Liu, Y.L.; Liu, B.; Yue, Z.W.; Zeng, F.J.; Li, X.Y.; Li, L. Effects of Short-Term Nitrogen and Phosphorus Addition on Leaf Stoichiometry of a Dominant Alpine Grass. PeerJ 2021, 9, e12611. [Google Scholar] [CrossRef]
- He, J.S.; Fang, J.Y.; Wang, Z.H.; Guo, D.L.; Flynn, D.F.B.; Geng, Z. Stoichiometry and Large-Scale Patterns of Leaf Carbon and Nitrogen in the Grassland Biomes of China. Oecologia 2006, 149, 115–122. [Google Scholar] [CrossRef] [PubMed]
- Han, W.X.; Fang, J.Y.; Guo, D.L.; Zhang, Y. Leaf Nitrogen and Phosphorus Stoichiometry across 753 Terrestrial Plant Species in China. New Phytol. 2005, 168, 377–385. [Google Scholar] [CrossRef] [PubMed]
- Gao, Z.B.; Wang, H.Y.; Lü, X.T.; Wang, Z.W. Effects of nitrogen and phosphorus addition on C : N : P stoichiometry in roots and leaves of four dominant plant species in a meadow steppe of Hulunbuir. Chin. J. Ecol. 2017, 36, 80–88. [Google Scholar]
Disclaimer/Publisher’s Note: The statements, opinions and data contained in all publications are solely those of the individual author(s) and contributor(s) and not of MDPI and/or the editor(s). MDPI and/or the editor(s) disclaim responsibility for any injury to people or property resulting from any ideas, methods, instructions or products referred to in the content. |
© 2025 by the authors. Licensee MDPI, Basel, Switzerland. This article is an open access article distributed under the terms and conditions of the Creative Commons Attribution (CC BY) license (https://creativecommons.org/licenses/by/4.0/).