The Impact of the Small Urban Green Space on the Urban Thermal Environment: The Belgrade Case Study (Serbia)

 , ,
, ,  , , and
Abstract
1. Introduction
2. Materials and Methods
2.1. Study Area
2.2. Selection of Green Spaces
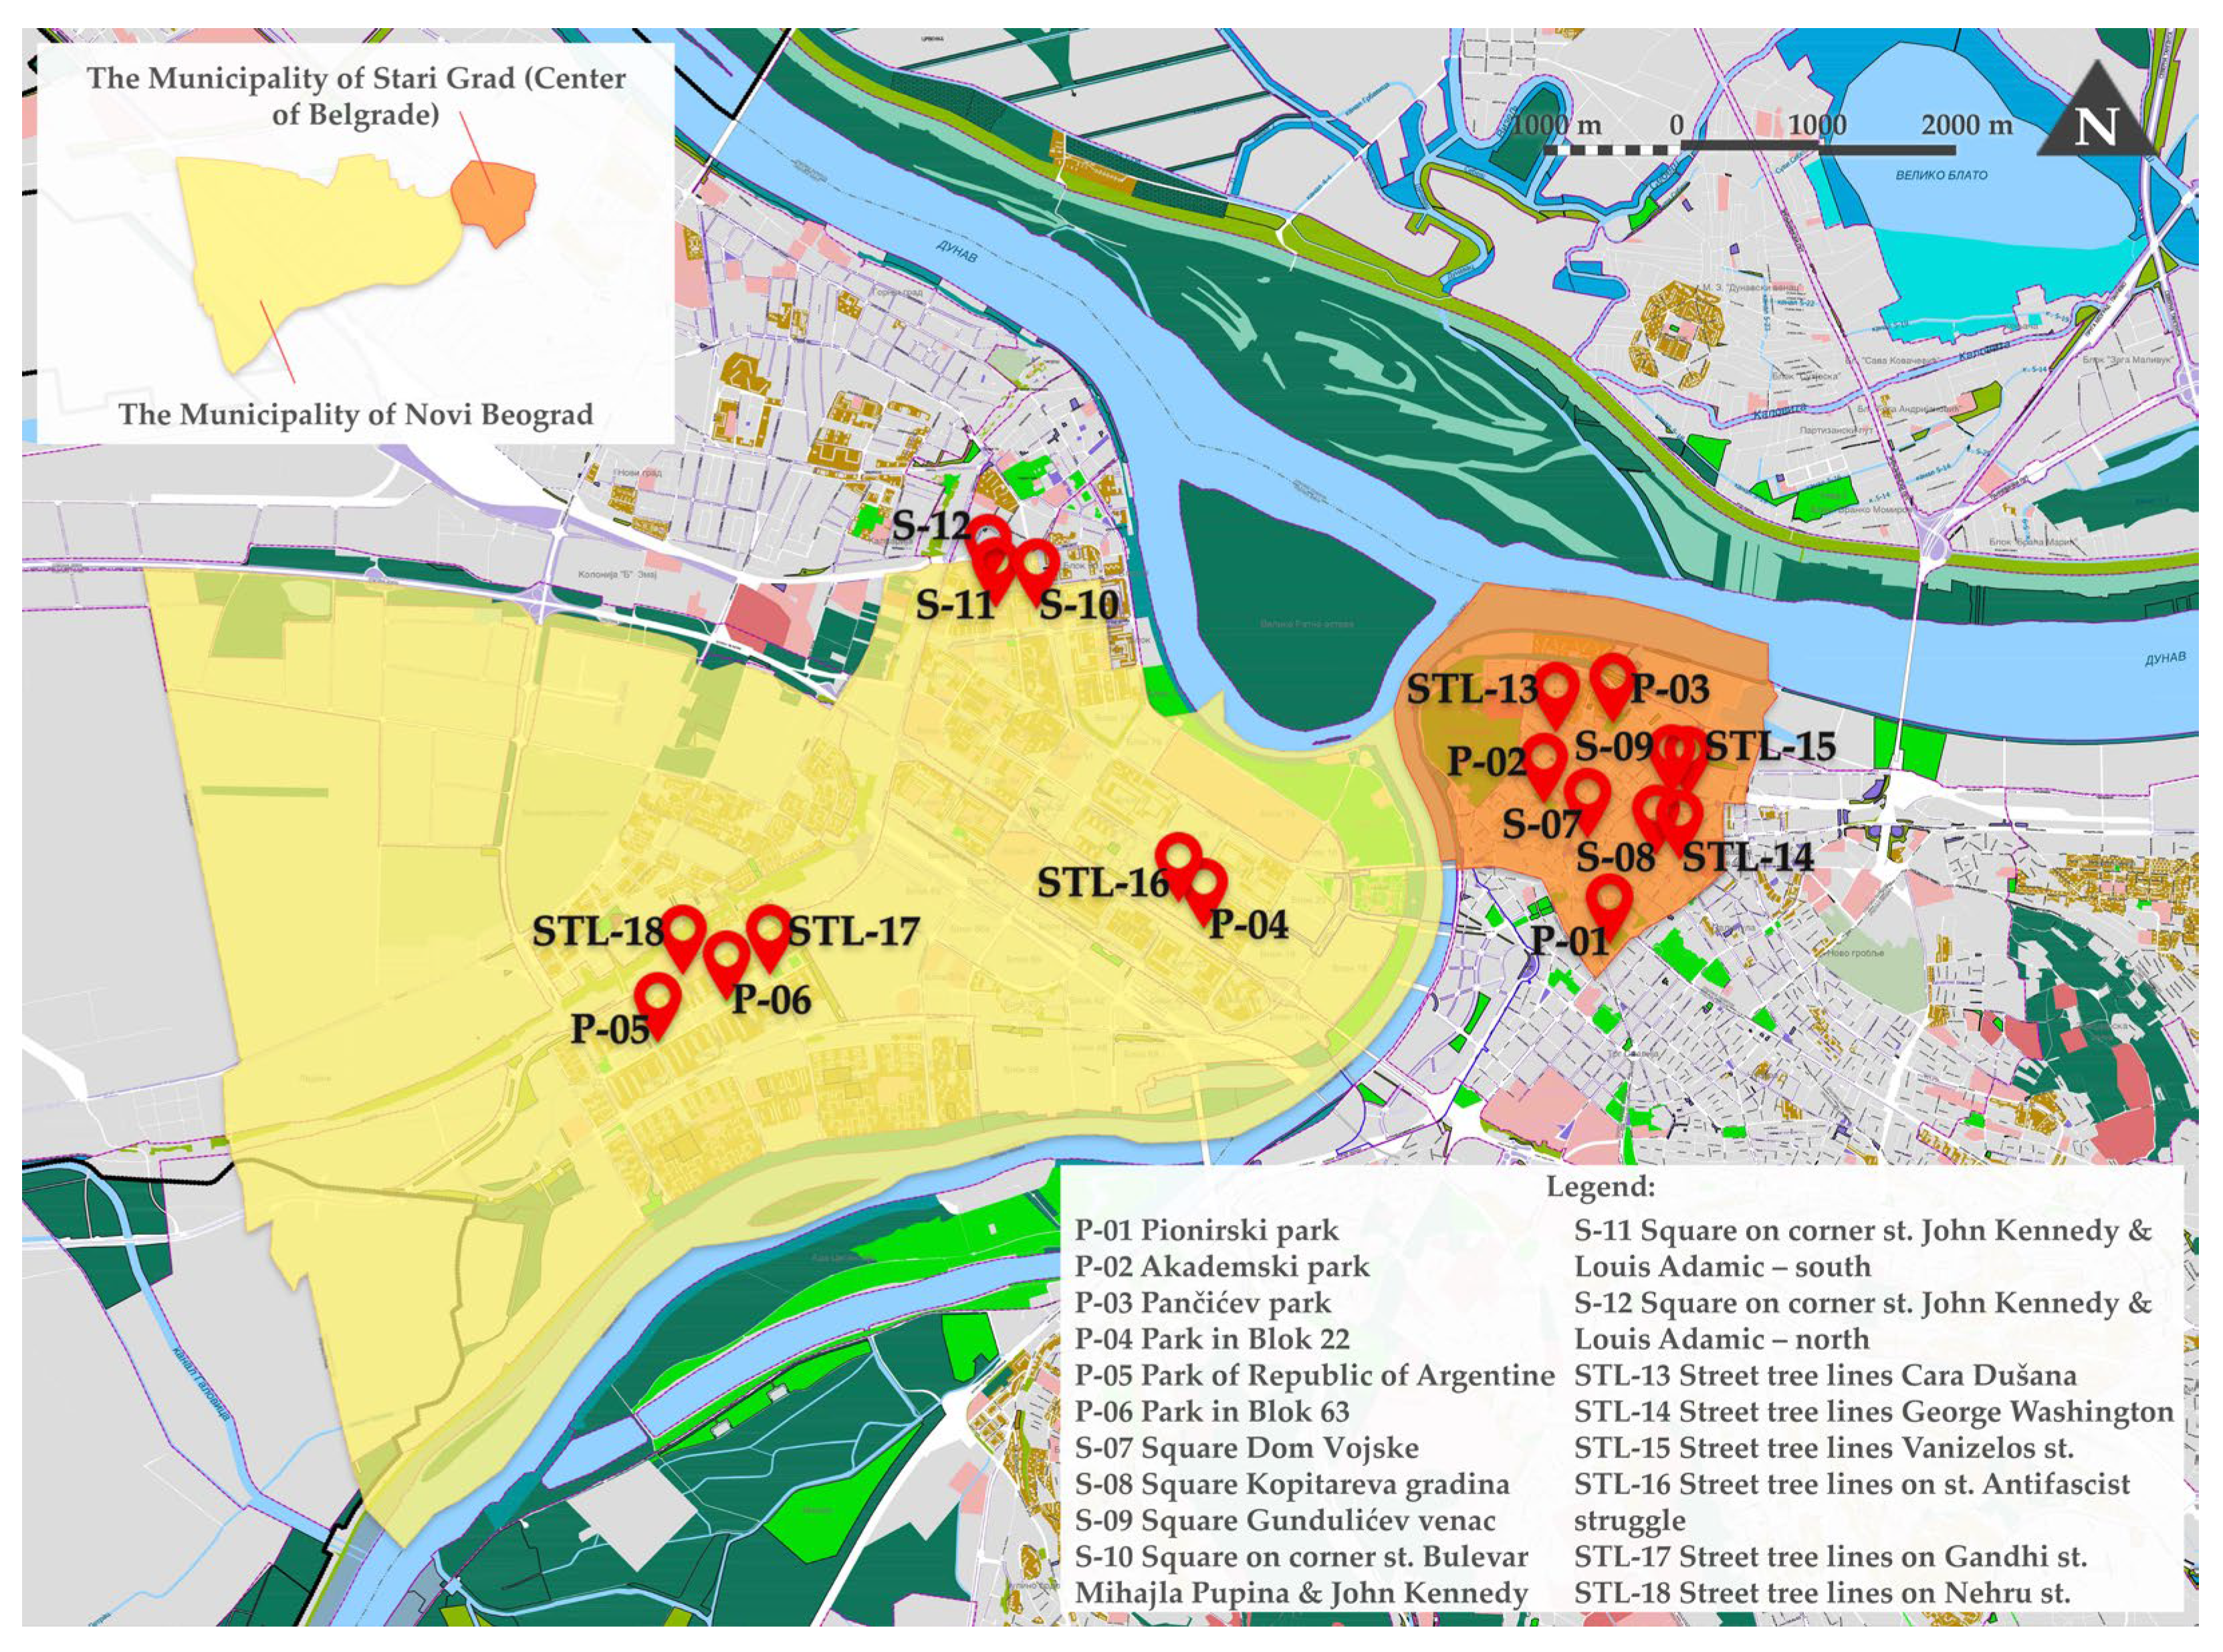
2.3. Selection of Coordinates for Green Space
2.4. Data Description
2.5. Data Collection
2.6. Data Analysis
3. Results
4. Discussion
4.1. Discussion of Methodological Limitations
4.2. Discussion of the Results
4.3. Implications of the Results
5. Conclusions
5.1. In-Depth Analysis and Interpretation of Results
5.2. Summary of This Study’s Key Findings, Implications, and Contributions
Author Contributions
Funding
Data Availability Statement
Acknowledgments
Conflicts of Interest
References
- Kántor, N.; Kovács, A.; Takács, Á. Small-scale human-biometeorological impacts of shading by a large tree. Open Geosci. 2016, 8, 231–245. [Google Scholar] [CrossRef]
- Klok, L.; Rood, N.; Kluck, J.; Kleerekoper, L. Assessment of thermally comfortable urban spaces in Amsterdam during hot summer days. Int. J. Biometeorol. 2019, 63, 129–141. [Google Scholar] [CrossRef] [PubMed]
- Klemm, W.; Heusinkveld, B.G.; Lenzholzer, S.; Van Hove, B. Street greenery and its physical and psychological impact on thermal comfort. Landsc. Urban Plan. 2015, 138, 87–98. [Google Scholar] [CrossRef]
- Chen, Y.; Yue, W.; La Rosa, D. Which communities have better accessibility to green space? An investigation into environmental inequality using big data. Landsc. Urban Plan. 2020, 204, 103919. [Google Scholar] [CrossRef]
- Hitchmough, J.D. Urban Landscape Management; Inkata Press: Sydney, Australia, 1994; p. 594. [Google Scholar]
- Randrup, T.B.; Jansson, M. Introduction: Urban open space governance and management–the long-term perspective. In Urban Open Space Governance and Management, 1st ed.; Jansson, M., Randrup, T.B., Eds.; Routledge, Taylor & Francis Group: London, UK, 2020; pp. 2–10. [Google Scholar]
- M’Ikiugu, M.M.; Kinoshita, I.; Tashiro, Y. Urban Green Space Analysis and Identification of its Potential Expansion Areas. Procedia-Soc. Behav. Sci. 2012, 35, 449–458. [Google Scholar] [CrossRef]
- Vukmirovic, M.; Gavrilovic, S.; Stojanovic, D. The Improvement of the Comfort of Public Spaces as a Local Initiative in Coping with Climate Change. Sustainability 2019, 11, 6546. [Google Scholar] [CrossRef]
- Nikolopolou, M.; Lykoudis, S. Thermal comfort in outdoor urban space: Analysis across different European countries. Build. Environ. 2006, 41, 1455–1470. [Google Scholar] [CrossRef]
- Błażejczyk, K.; Broede, P.; Fiala, D.; Havenith, G.; Holmér, I.; Jendritzky, G.; Kampmann, B.; Kunert, A. Principles of the New Universal Thermal Climate Index (UTCI) and its Application to Bioclimatic Research in European Scale. Misc. Geogr. 2010, 14, 91–102. [Google Scholar] [CrossRef]
- Blazejczyk, K.; Epstein, Y.; Jendritzky, G.; Staiger, H.; Tinz, B. Comparison of UTCI to selected thermal indices. Int. J. Biometeorol. 2012, 56, 515–535. [Google Scholar] [CrossRef]
- Błażejczyk, K.; Jendritzky, G.; Bröde, P.; Fiala, D.; Havenith, G.; Epstein, Y.; Psikuta, A.; Kampmann, B. An introduction to the Universal Thermal Climate Index (UTCI). Geogr. Pol. 2013, 86, 5–10. [Google Scholar] [CrossRef]
- Matzarakis, A.; Muthers, S.; Rutz, F. Application and comparison of UTCI and PET in temperate climate conditions. Finisterra 2014, 49, 21–31. [Google Scholar] [CrossRef]
- Lai, D.; Lian, Z.; Liu, W.; Guo, C.; Liu, W.; Liu, K.; Chen, Q. A comprehensive review of thermal comfort studies in urban open spaces. Sci. Total Environ. 2020, 742, 140092. [Google Scholar] [CrossRef]
- Lukić, M.; Filipović, D.; Pecelj, M.; Crnogorac, L.; Lukić, B.; Divjak, L.; Lukić, A.; Vučićević, A. Assessment of Outdoor Thermal Comfort in Serbia’s Urban Environments during Different Seasons. Atmosphere 2021, 12, 1984. [Google Scholar] [CrossRef]
- Matzarakis, A.; Mayer, H.; Iziomon, M.G. Applications of a universal thermal index: Physiological equivalent temperature. Int. J. Biometeorol. 1999, 43, 76–84. [Google Scholar] [CrossRef] [PubMed]
- Zhang, L.; Wei, D.; Hou, Y.; Du, J.; Liu, Z.; Zhang, G.; Shi, L. Outdoor Thermal Comfort of Urban Park—A Case Study. Sustainability 2020, 12, 1961. [Google Scholar] [CrossRef]
- Matzarakis, A.; Rutz, F.; Mayer, H. Modelling Radiation fluxes in simple and complex environments—Application of the RayMan model. Int. J. Biometeorol. 2007, 51, 323–334. [Google Scholar] [CrossRef]
- Fröhlich, D.; Gangwisch, M.; Matzarakis, A. Effect of radiation and wind on thermal comfort in urban environments—Application of the RayMan and SkyHelios model. Urban Clim. 2019, 27, 1–7. [Google Scholar] [CrossRef]
- Honjo, T. Thermal Comfort in Outdoor Environment. Glob. Environ. Res. 2009, 13, 43–47. [Google Scholar]
- Ghani, S.; Mahgoub, A.O.; Bakochristou, F.; ElBialy, E.A. Assessment of thermal comfort indices in an open air-conditioned stadium in hot and arid environment. J. Build. Eng. 2021, 40, 102378. [Google Scholar] [CrossRef]
- Fröhlich, D.; Matzarakis, A.; RayMan Pro—A Tool for Applied Climatology. Modelling of Mean Radiant Temperature and Thermal Indices, RayMan Manual Version 0.1. 29 August 2018. Available online: https://www.urbanclimate.net/rayman/RayManManual.pdf (accessed on 17 July 2022).
- Li, Y.; Song, Y. Optimization of Vegetation Arrangement to Improve Microclimate and Thermal Comfort in an Urban Park. Int. Rev. Spat. Plan. Sustain. Dev. 2018, 7, 18–30. [Google Scholar] [CrossRef]
- Aram, F.; Solgi, E.; Garcia, E.H.; Mosavi, A. Urban heat resilience at the time of global warming: Evaluating the impact of the urban parks on outdoor thermal comfort. Environ. Sci. Eur. 2020, 32, 117. [Google Scholar] [CrossRef]
- Wei, D.; Yang, L.; Bao, Z.; Lu, Y.; Yang, H. Variations in outdoor thermal comfort in an urban park in the hot-summer and cold-winter region of China. Sustain. Cities Soc. 2022, 77, 103535. [Google Scholar] [CrossRef]
- Aram, F.; Solgi, E.; Higueras García, E.; Mosavi, A.; Várkonyi-Kóczy, A.R. The cooling effect of large-scale urban parks on surrounding area thermal comfort. Energies 2019, 12, 3904. [Google Scholar] [CrossRef]
- Chang, C.R.; Li, M.H.; Chang, S.D. A preliminary study on the local cool-island intensity of Taipei city parks. Landsc. Urban Plan. 2007, 80, 386–395. [Google Scholar] [CrossRef]
- Sun, F.; Zhang, J.; Yang, R.; Liu, S.; Ma, J.; Lin, X.; Su, D.; Liu, K.; Cui, J. Study on Microclimate and Thermal Comfort in Small Urban Green Spaces in Tokyo, Japan—A Case Study of Chuo Ward. Sustainability 2023, 15, 16555. [Google Scholar] [CrossRef]
- Armson, D.; Stringer, P.; Ennos, A.R. The effect of tree shade and grass on surface and globe temperatures in an urban area. Urban For. Urban Green. 2012, 11, 245–255. [Google Scholar] [CrossRef]
- Milovanović, B.; Ducić, V.; Radovanović, M.; Milivojević, M. Climate regionalization of Serbia according to Köppen climate classification. J. Geogr. Inst. “Jovan Cvijić” SASA 2017, 67, 103–114. [Google Scholar] [CrossRef]
- Official Gazette of the City of Belgrade. Regional Spatial Plan of the Administrative Area of the City of Belgrade; Official Gazette of the City of Belgrade: Belgrade, Serbia, 2011; p. 38. [Google Scholar]
- City of Belgrade. Official Website of the City of Belgrade. Available online: https://www.beograd.rs/en/ (accessed on 3 May 2020).
- Republic Institute for Statistics. Regions in the Republic of Serbia 2022; Republic Institute for Statistics: Belgrade, Serbia, 2023. [Google Scholar]
- Cohen, P.; Potchter, O.; Matzarakis, A. Daily and seasonal climatic conditions of green urban open spaces in the Mediterranean climate and their impact on human comfort. Build. Environ. 2012, 51, 285–295. [Google Scholar] [CrossRef]
- Müller, N.; Kuttler, W.; Barlag, A.B. Counteracting urban climate change: Adaptation measures and their effect on thermal comfort. Theor. Appl. Climatol. 2014, 115, 243–257. [Google Scholar] [CrossRef]
- General Regulation Plan of the Green Areas System of Belgrade. 2019. Available online: https://www.urbel.com/planovi/1547/PGRSZP_plan_namena_LIST_03-pregledna.pdf (accessed on 11 March 2020).
- Höppe, P. The physiological equivalent temperature—A universal index for the biometeorological assessment of the thermal environment. Int. J. Biometeorol. 1999, 43, 71–75. [Google Scholar] [CrossRef]
- Fiala, D.; Havenith, G.; Bröde, P.; Kampmann, B.; Jendritzky, G. UTCI-Fiala multi-node model of human heat transfer and temperature regulation. Int. J. Biometeorol. 2011, 56, 429–441. [Google Scholar] [CrossRef] [PubMed]
- Pecelj, M.; Matzarakis, A.; Vujadinović, M.; Radovanović, M.; Vagić, N.; Đurić, D.; Cvetković, M. Temporal Analysis of Urban-Suburban PET, mPET and UTCI Indices in Belgrade (Serbia). Atmosphere 2021, 12, 916. [Google Scholar] [CrossRef]
- Gillner, S.; Vogt, J.; Tharang, A.; Dettmann, S.; Roloff, A. Role of street trees in mitigating effects of heat and drought at highly sealed urban sites. Landsc. Urban Plan. 2015, 143, 33–42. [Google Scholar] [CrossRef]
- Chen, Y.C.; Matzarakis, A. Modification of physiologically equivalent temperature. J. Heat Isl. Inst. Int. 2014, 9–2, 26–32. [Google Scholar]
- Republic Hydrometeorological Institute. Guidelines for Measurement and Observations at a Standard Climatological Station; Republic Hydrometeorological Institute: Belgrade, Serbia, 2020. [Google Scholar]
- Nanda, A.; Mohapatra, B.B.; Mahapatra, A.P.K.; Mahapatra, A.P.K.; Mahapatra, A.P.K. Multiple comparison test by Tukey’s honestly significant difference (HSD): Do the confident level control type I error. Int. J. Stat. Appl. Math. 2021, 6, 59–65. [Google Scholar] [CrossRef]
- Lehnert, M.; Tokar, V.; Jurek, M.; Geletič, J. Summer thermal comfort in Czech cities: Measured effects of blue and green features in city centres. Int. J. Biometeorol. 2021, 65, 1277–1289. [Google Scholar] [CrossRef]
- Lin, B.S.; Lin, C.T. Preliminary study of the influence of the spatial arrangement of urban parks on local temperature reduction. Urban For. Urban Green. 2016, 20, 348–357. [Google Scholar] [CrossRef]
- Vaz Monteiro, M.; Doick, K.J.; Handley, P.; Peace, A. The impact of greenspace size on the extent of local nocturnal air temperature cooling in London. Urban For. Urban Green. 2016, 16, 160–169. [Google Scholar] [CrossRef]
- Park, J.; Kim, J.H.; Lee, D.K.; Park, C.Y.; Jeong, S.G. The influence of small green space type and structure at the street level on urban heat island mitigation. Urban For. Urban Green. 2017, 21, 203–212. [Google Scholar] [CrossRef]
- Jaganmohan, M.; Knapp, S.; Buchmann, C.M.; Schwarz, N. The Bigger, the Better? The Influence of Urban Green Space Design on Cooling Effects for Residential Areas. J. Environ. Qual. 2016, 45, 134–145. [Google Scholar] [CrossRef]


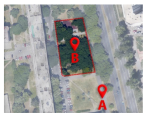
| Pionirski Park (P-01) | Akademski Park (P-02) | Pančićev Park (P-03) | Park in Blok 22 (P-04) | Park of Republic of Argentine (P-05) | Park in Blok 63 (P-06) |
 A: 44°48′42.0″ N 20°27′52.3″ E | 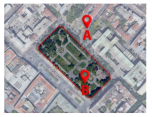 A: 44°49′12.8″ N 20°27′29.9″ E | 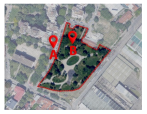 A: 44°49′29.7″ N 20°27′48.8″ E | 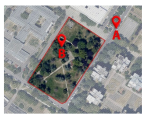 A: 44°48′41.0″ N 20°25′36.6″ E | 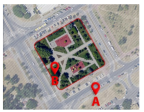 A: 44°48′09.2″ N 20°22′30.1″ E | 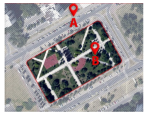 A: 44°48′23.4″ N 20°22′52.9″ E |
| B: 44°48′36.0″ N 20°27′52.6″ E | B: 44°49′08.5″ N 20°27′29.6″ E | B: 44°49′29.9″ N 20°27′50.6″ E | B: 44°48′40.1″ N 20°25′32.9″ E | B: 44°48′10.2″ N 20°22′27.4″ E | B: 44°48′21.4″ N 20°22′54.4″ E |
| Area: 2.43 ha (LGS) | Area: 1.46 ha (LGS) | Area: 1.03 ha (LGS) | Area: 0.70 ha (MGS) | Area: 0.58 ha (MGS) | Area: 1.02 ha (LGS) |
| Square Dom Vojske (S-07) | Square Kopitareva gradina (S-08) | Square Gundulićev Venac (S-09) | Square on Corner of St. Bulevar Mihajla Pupina and John Kennedy (S-10) | Square on Corner of St. John Kennedy and Louis Adamic—South (S-11) | Square on Corner of St. John Kennedy and Louis Adamic—North (S-12) |
 | 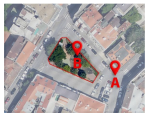 |  |  | 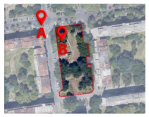 | 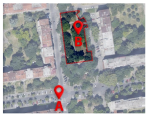 |
| A: 44°49′00.6″ N 20°27′41.1″ E | A: 44°48′57.2″ N 20°28′07.7″ E | A: 44°49′11.8″ N 20°28′10.5″ E | A: 44°49′54.2″ N 20°24′37.1″ E | A: 44°49′58.4″ N 20°24′18.8″ E | A: 44°49′58.4″ N 20°24′18.8″ E |
| B: 44°49′00.9″ N 20°27′42.1″ E | B: 44°48′57.7″ N 20°28′06.6″ E | B: 44°49′11.5″ N 20°28′11.1″ E | B: 44°49′56.0″ N 20°24′35.6″ E | B: 44°49′57.7″ N 20°24′19.9″ E | B: 44°50′01.0″ N 20°24′20.0″ E |
| Area: 0.10 ha (SGS) | Area: 0.05 ha (SGS) | Area: 0.05 ha (SGS) | Area: 0.26 ha (SGS) | Area: 0.34 ha (MGS) | Area: 0.20 ha (SGS) |
| Street Tree Lines on Cara Dušana (STL-13) | Street Tree Lines on George Washington (STL-14) | Street Tree Lines on Vanizelos St. (STL-15) | Street Tree Lines on St. Antifascist Struggle (STL-16) | Street Tree Lines on Gandhi St. (STL-17) | Street Tree Lines on Nehru St. (STL-18) |
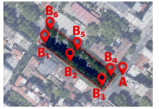 | 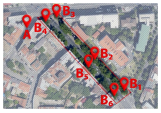 |  | 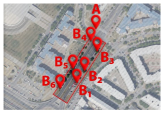 | 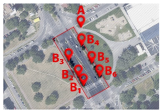 | 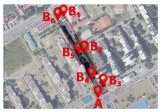 |
| A: 44°49′25.0″ N 20°27′36.3″ E | A: 44°48′59.5″ N 20°28′07.0″ E | A: 44°49′12.7″ N 20°28′12.9″ E | A: 44°48′48.2″ N 20°25′26.7″ E | A: 44°48′28.1″ N 20°23′06.3″ E | A: 44°48′18.7″ N 20°22′41.3″ E |
| B1: 44°49′26.3″ N 20°27′31.4″ E | B1: 44°48′56.4″ N 20°28′14.1″ E | B1: 44°49′11.6″ N 20°28′16.3″ E | B1: 44°48′44.2″ N 20°25′24.8″ E | B1: 44°48′25.4″ N 20°23′06.5″ E | B1: 44°48′27.4″ N 20°22′36.2″ E |
| B2: 44°49′25.6″ N 20°27′33.0″ E | B2: 44°48′58.0″ N 20°28′12.0″ E | B2: 44°49′11.8″ N 20°28′14.6″ E | B2: 44°48′45.1″ N 20°25′25.6″ E | B2: 44°48′25.8″ N 20°23′06.1″ E | B2: 44°48′23.4″ N 20°22′39.3″ E |
| B3: 44°49′24.6″ N 20°27′34.8″ E | B3: 44°49′00.2″ N 20°28′09.2″ E | B3: 44°49′12.0″ N 20°28′13.1″ E | B3: 44°48′46.5″ N 20°25′26.9″ E | B3: 44°48′26.6″ N 20°23′05.5″ E | B3: 44°48′20.0″ N 20°22′42.1″ E |
| B4: 44°49′25.0″ N 20°27′35.6″ E | B4: 44°48′59.8″ N 20°28′08.3″ E | B4: 44°49′11.6″ N 20°28′13.2″ E | B4: 44°48′47.4″ N 20°25′26.2″ E | B4: 44°48′27.3″ N 20°23′06.3″ E | B4: 44°48′20.7″ N 20°22′40.4″ E |
| B5: 44°49′26.1″ N 20°27′33.6″ E | B5: 44°48′57.5″ N 20°28′11.4″ E | B5: 44°49′11.5″ N 20°28′14.6″ E | B5: 44°48′45.3″ N 20°25′24.3″ E | B5: 44°48′26.5″ N 20°23′07.0″ E | B5: 44°48′23.3″ N 20°22′38.3″ E |
| B6: 44°49′27.0″ N 20°27′31.9″ E | B6: 44°48′56.0″ N 20°28′13.3″ E | B6: 44°49′11.3″ N 20°28′15.9″ E | B6: 44°48′43.8″ N 20°25′23.0″ E | B6: 44°48′25.9″ N 20°23′07.5″ E | B6: 44°48′27.1″ N 20°22′35.2″ E |
| Area: 0.33 ha (MGS) | Area: 0.51 ha (MGS) | Area: 0.15 ha (SGS) | Area: 0.65 ha (MGS) | Area: 0.35 ha (MGS) | Area: 0.99 ha (LGS) |
| The Difference in the Thermal Comfort Index * | Area of Green Spaces | N | Mean | Std. Deviation | Std. Error | 95% Confidence Interval for Mean Lower Bound Upper Bound | Min. | Max. | |
|---|---|---|---|---|---|---|---|---|---|
| PET (°C) | SGS | 72 | 2.1875 | 1.48674 | 0.17521 | 1.8381 | 2.5369 | 0.00 | 5.40 |
| MGS | 84 | 2.3155 | 1.53313 | 0.16728 | 1.9828 | 2.6482 | 0.00 | 6.70 | |
| LGS | 60 | 4.0400 | 2.74376 | 0.35422 | 3.3312 | 4.7488 | 0.10 | 10.90 | |
| Σ | 216 | 2.7519 | 2.08503 | 0.14187 | 2.4722 | 3.0315 | 0.00 | 10.90 | |
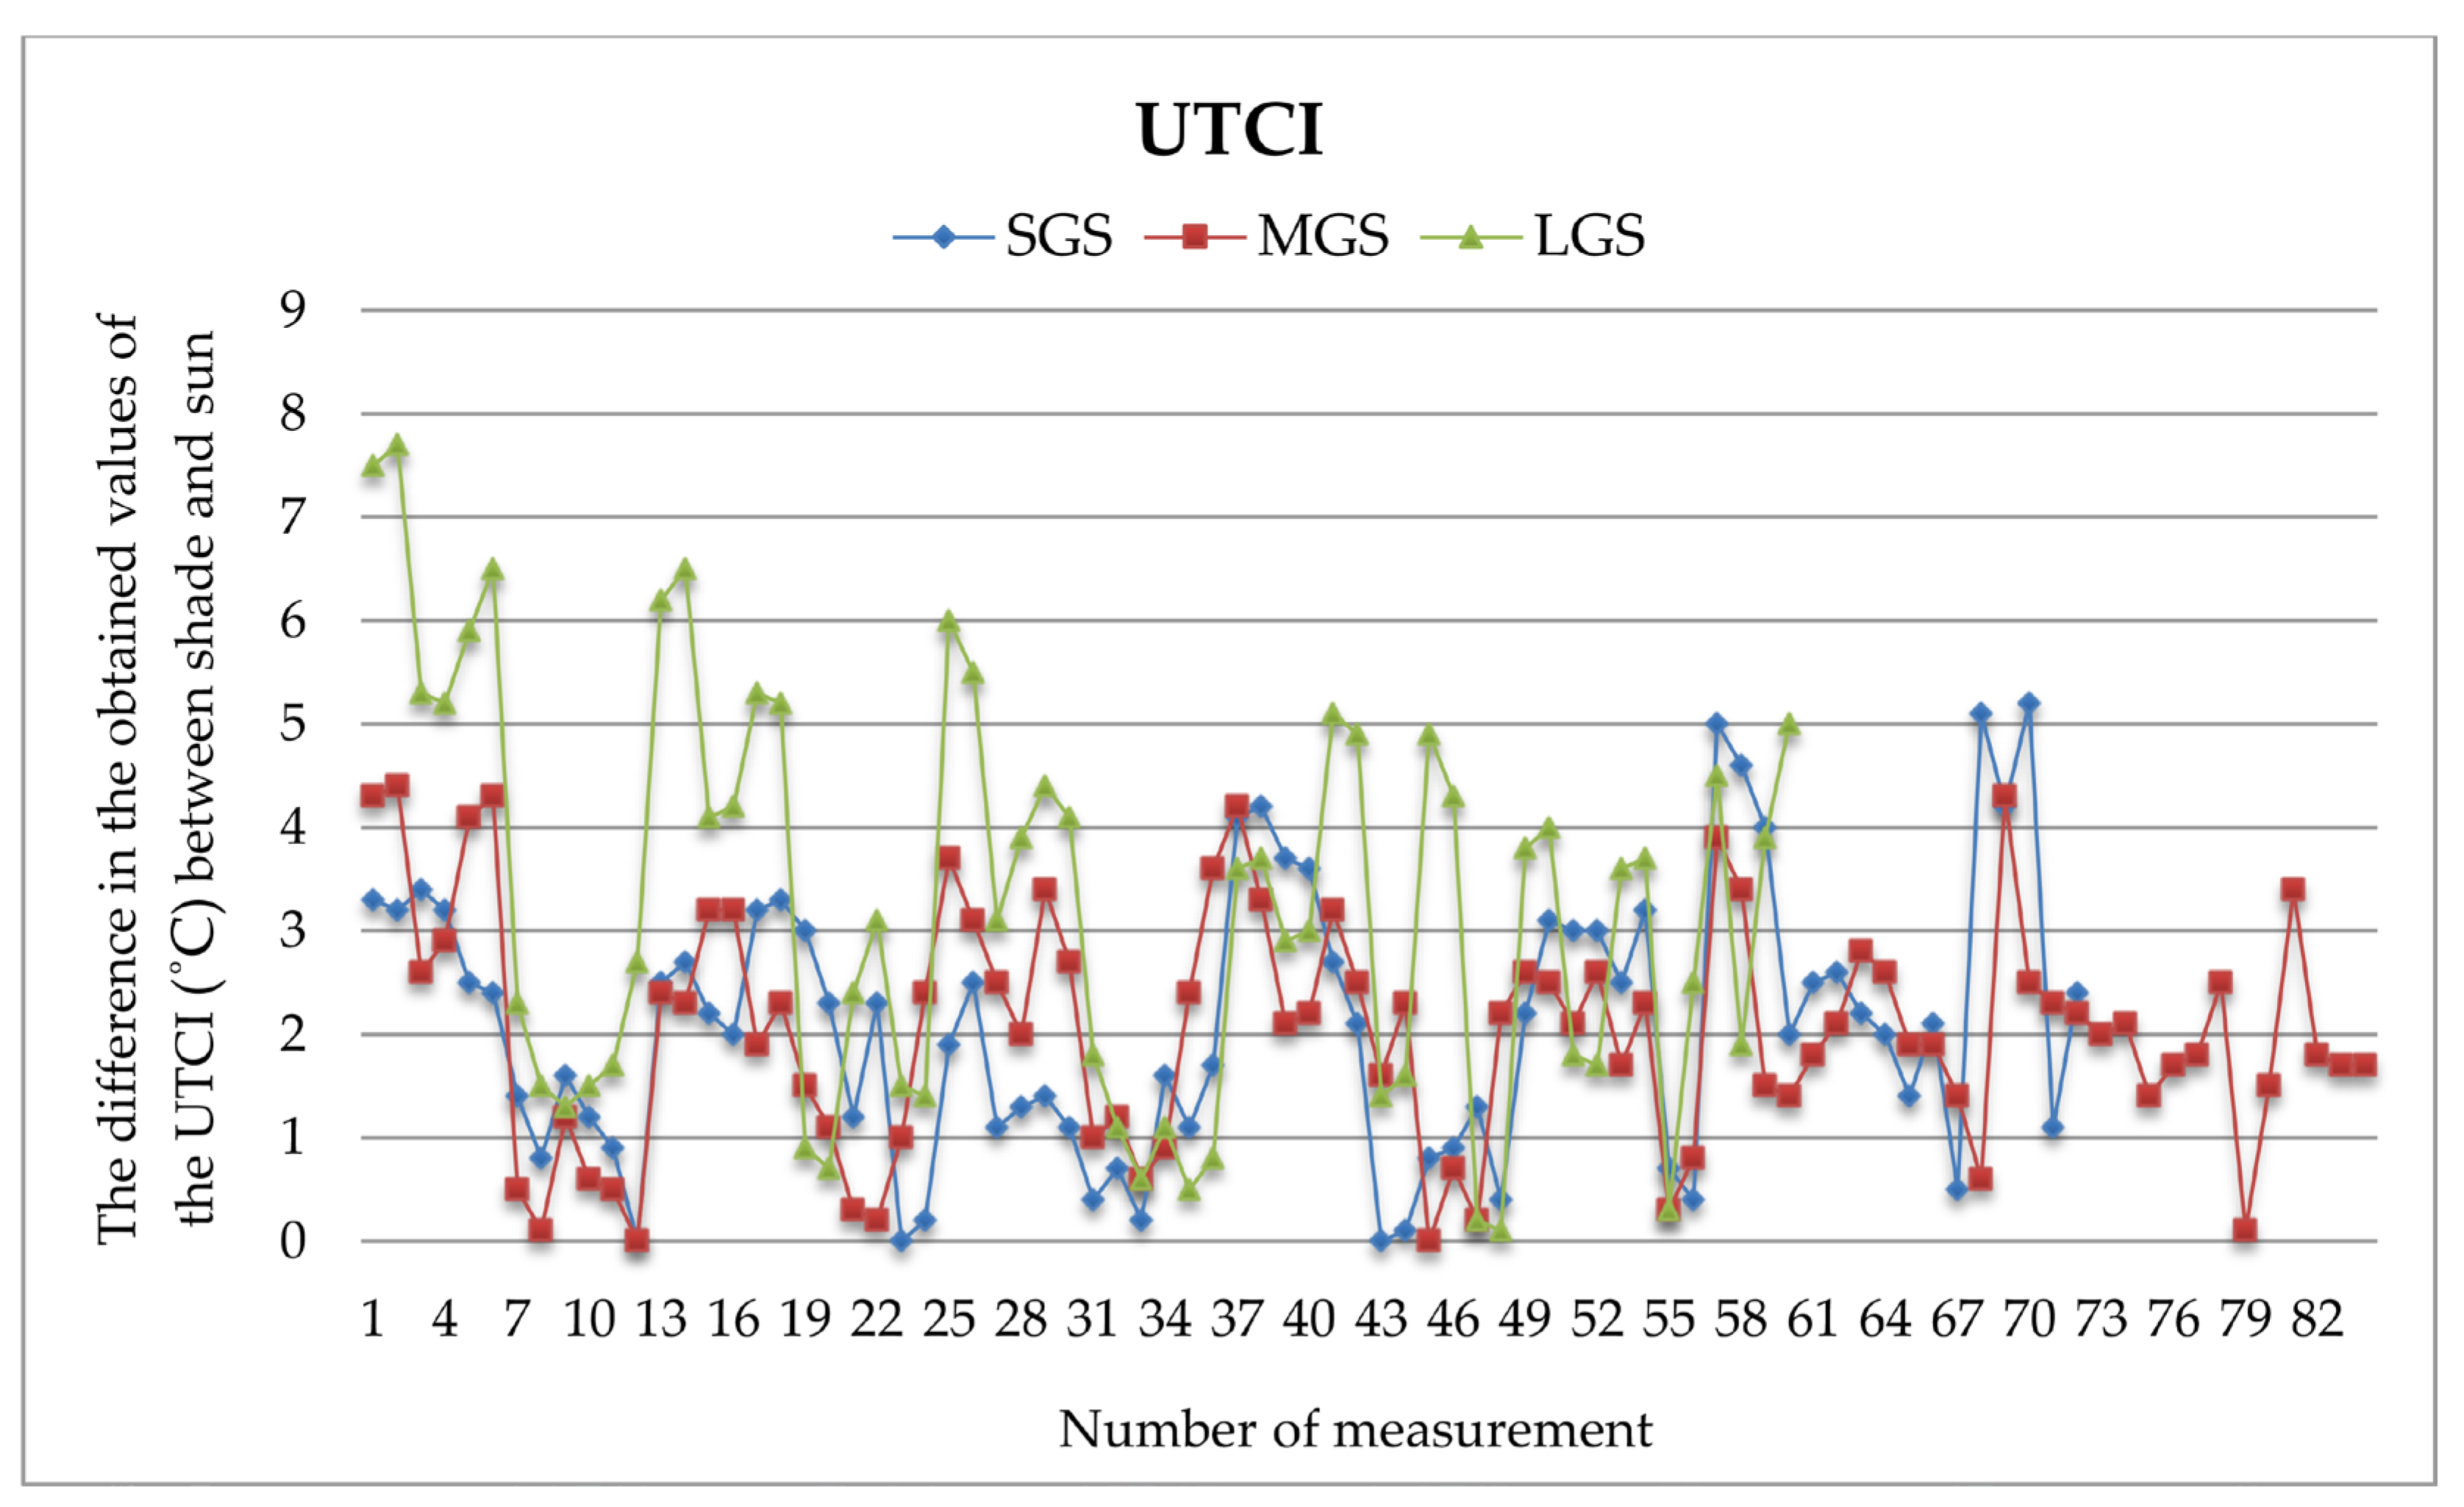
| UTCI (°C) | SGS | 72 | 2.1208 | 1.32335 | 0.15596 | 1.8099 | 2.4318 | 0.00 | 5.20 |
| MGS | 84 | 2.0488 | 1.13727 | 0.12409 | 1.8020 | 2.2956 | 0.00 | 4.40 | |
| LGS | 60 | 3.2650 | 1.97380 | 0.25482 | 2.7551 | 3.7749 | 0.10 | 7.70 | |
| Σ | 216 | 2.4106 | 1.55875 | 0.10606 | 2.2016 | 2.6197 | 0.00 | 7.70 | |
| The Difference in the Thermal Comfort Index * | Statistic a | df1 | df2 | Sig. | |
|---|---|---|---|---|---|
| PET (°C) | Welch | 11.455 | 2 | 123.343 | 0.000 |
| Brown-Forsythe | 16.591 | 2 | 125.203 | 0.000 | |
| UTCI (°C) | Welch | 9.508 | 2 | 122.916 | 0.000 |
| Brown-Forsythe | 12.751 | 2 | 141.497 | 0.000 | |
| The Difference in the Thermal COMFORT Index * | (I) Area of Green Spaces | (J) Area of Green Spaces | Mean Difference (I-J) | Std. Error | Sig. | 95% Confidence Interval Lower Bound Upper Bound | |
|---|---|---|---|---|---|---|---|
| PET (°C) | SGS | MGS | −0.12798 | 0.31051 | 0.911 | −0.8608 | 0.6049 |
| LGS | −1.85250 * | 0.33796 | 0.000 | −2.6502 | −1.0548 | ||
| MGS | SGS | 0.12798 | 0.31051 | 0.911 | −0.6049 | 0.8608 | |
| LGS | −1.72452 * | 0.32680 | 0.000 | −2.4958 | −0.9532 | ||
| LGS | SGS | 1.85250 * | 0.33796 | 0.000 | 1.0548 | 2.6502 | |
| MGS | 1.72452 * | 0.32680 | 0.000 | 0.9532 | 2.4958 | ||
| UTCI (°C) | SGS | MGS | 0.07202 | 0.23641 | 0.950 | −0.4860 | 0.6300 |
| LGS | −1.14417 * | 0.25731 | 0.000 | −1.7515 | −0.5369 | ||
| MGS | SGS | −0.07202 | 0.23641 | 0.950 | −0.6300 | 0.4860 | |
| LGS | −1.21619 * | 0.24882 | 0.000 | −1.8035 | −0.6289 | ||
| LGS | SGS | 1.14417 * | 0.25731 | 0.000 | 0.5369 | 1.7515 | |
| MGS | 1.21619 * | 0.24882 | 0.000 | 0.6289 | 1.8035 | ||
Disclaimer/Publisher’s Note: The statements, opinions and data contained in all publications are solely those of the individual author(s) and contributor(s) and not of MDPI and/or the editor(s). MDPI and/or the editor(s) disclaim responsibility for any injury to people or property resulting from any ideas, methods, instructions or products referred to in the content. |
© 2025 by the authors. Licensee MDPI, Basel, Switzerland. This article is an open access article distributed under the terms and conditions of the Creative Commons Attribution (CC BY) license (https://creativecommons.org/licenses/by/4.0/).
Share and Cite
Kecman, S.; Stojanović, N.; Vukmirović, M.; Vasiljević, N.; Bjedov, I.; Vujović, D. The Impact of the Small Urban Green Space on the Urban Thermal Environment: The Belgrade Case Study (Serbia). Forests 2025, 16, 321. https://doi.org/10.3390/f16020321
Kecman S, Stojanović N, Vukmirović M, Vasiljević N, Bjedov I, Vujović D. The Impact of the Small Urban Green Space on the Urban Thermal Environment: The Belgrade Case Study (Serbia). Forests. 2025; 16(2):321. https://doi.org/10.3390/f16020321
Chicago/Turabian StyleKecman, Snežana, Nadežda Stojanović, Milena Vukmirović, Nevena Vasiljević, Ivana Bjedov, and Dragana Vujović. 2025. "The Impact of the Small Urban Green Space on the Urban Thermal Environment: The Belgrade Case Study (Serbia)" Forests 16, no. 2: 321. https://doi.org/10.3390/f16020321
APA StyleKecman, S., Stojanović, N., Vukmirović, M., Vasiljević, N., Bjedov, I., & Vujović, D. (2025). The Impact of the Small Urban Green Space on the Urban Thermal Environment: The Belgrade Case Study (Serbia). Forests, 16(2), 321. https://doi.org/10.3390/f16020321