Article

Trade-Off Between Leaf Mass Area and Phosphorus Concentration Alters Resource-Use Strategy of Understory Plants Under Long-Term Nitrogen and Phosphorus Addition in a Subtropical Forest

1
Zhejiang Tiantong Forest Ecosystem National Field Observation and Research Station, School of Ecological and Environmental Sciences, East China Normal University, Shanghai 200241, China
2
Research Center for Global Change and Ecological Forecasting, Shanghai 200241, China
*
Author to whom correspondence should be addressed.
These authors contributed equally to this work.
Forests 2025, 16(2), 319; https://doi.org/10.3390/f16020319
Submission received: 19 December 2024 / Revised: 15 January 2025 / Accepted: 7 February 2025 / Published: 12 February 2025
(This article belongs to the Section Forest Ecology and Management)

Abstract

:
Leaf economic spectrum (LES) traits (e.g., leaf mass area and leaf nutrient concentrations) are effective indicators of an acquisitive or conservative resource use strategy for plants. The increased atmospheric deposition of nitrogen (N) and phosphorus (P) alters soil nutrient availability, thereby affecting plant LES traits. However, how the LES traits and their trade-offs affect the resource-use strategies of understory plants under long-term N and P additions is still unclear. Based on a fertilization plot including four treatments (control (CK), N addition (+N, 100 kg N hm−1 yr−1), P addition (+P, 50 kg P hm−1 yr−1), and combined N and P additions (+NP, 100 kg N hm−1 yr−1 + 50 kg P hm−1 yr−1)) conducted over 12 years in a subtropical broad-leaved evergreen forest, this study addresses the differential response of four LES traits (leaf mass per area (LMA), leaf N concentration (Nmass), leaf P concentration (Pmass) and leaf net photosynthesis per unit mass (Amass)) to fertilization in five dominant understory plants (Camellia fraternal, Eurya muricata, Eurya rubiginosa, Rhododendron ovatum, and Symplocos sumuntia) to test whether trade-offs between plant traits closely related to light resources play an important role in influencing plant resource-use strategies. The results show that, compared to the CK treatment, the LMA was significantly increased by 12.5% to 12.8% under +N treatment, and the Nmass was significantly increased by 25.9% and 23.6% under +N and +NP treatments, while Pmass and Amass were significantly increased by about 23% and 15~50%, respectively, after P addition. There was a highly significant negative correlation between the response of LMA and Pmass, irrespective of the addition of N and P alone or together. The increase in LMA under +N treatment made the resource-use strategy of the understory plants more conservative. Meanwhile, the understory plants tended to rapidly acquire resources by decreasing LMA while increasing Pmass under +P and +NP treatments. Our results suggest that, under long-term N and P additions, understory plants with limited light availability change their resource-use strategies mainly through the trade-off between leaf LMA and Pmass, which should be considered to capture the long-term adaptive strategies of understory plants against a background of intense atmospheric N and P deposition.

1. Introduction

Since the industrial revolution, with the increased burning of fossil fuels and chemical fertilizers used, the atmospheric deposition of nitrogen (N) and phosphorus (P) has increased rapidly [1,2], altering the soil N and P availability in terrestrial ecosystems, thereby affecting the plant growth, community composition, and structure. Plant leaves respond rapidly to environmental changes and are highly plastic [3,4]. When the external environment changes, plants adjust their functional traits, such as morphological structure, chemical composition, and physiological characteristics, to achieve a greater ecological amplitude. Plant leaf functional traits, as important indicators of plant resource-use capacity, can better reflect plant response strategies and adaptation mechanisms to environmental fluctuations [5,6]. Therefore, elucidating the effects of atmospheric N and P depositions on plant leaf functional traits is the basis for understanding plant responses and feedback mechanisms to environmental changes.
According to the leaf economic spectrum (LES) concept [3], there are trade-offs between key plant traits such as specific leaf area, leaf N and P concentration, and photosynthetic rate. At one end of the LES are “fast-investing-yielding” species with the characteristics of a low specific leaf area and high leaf N and P concentration, and photosynthetic rate, which increase investment in photosynthetic and respiratory functions, and have relatively faster growth rates [3,7]. The resource-use strategy of these plants is acquisitive. However, at the conservative end, the opposite is true. Due to the differences in resource-use strategies among plants, they may adjust LES traits and their synergistic or trade-off relationship to adapt to environmental changes following N or P addition [8,9,10]. For example, subtropical forest plants exhibit significant trait variation in light-saturated photosynthetic rates under P addition [8]. Mo et al. found in a nine-year N and P addition experiment conducted in a tropical forest that the leaf morphological traits of most understory or overstory species were not significantly altered by N and P additions, while the leaf N:P response of understory species was greater than that of overstory species [9].
Researchers have found that the variation in LES traits can be interpreted as differences in plant resource-use strategies across space, time, species, and individuals [11,12] and have used changes in LES traits and their correlations to elucidate how plant resource-use strategies are affected by environmental conditions [13,14,15]. Zhao et al. [13] found that 9-year N supplementation increased the leaf N:P ratio and promoted a trend toward the conservative end of LES for two dominant species in a subtropical forest. However, some studies in subtropical forests have found that small trees shift towards resource acquisition due to increases in leaf N concentration and their photosynthetic rate [14] or that seedlings adjust their resource-use strategy towards a more acquisitive focus, which is associated with an increase in specific leaf area [15]. In summary, plants may be able to better exploit the resource conditions of their habitat by adjusting their LES traits [10].
Understory plants are diverse in species types and contribute greatly to the biodiversity of forest ecosystems, and their growth and reproduction significantly influence the dynamics of the forest ecosystem’s composition and structure, although they account for a relatively small proportion of the total forest biomass [4]. Understory plants are located below the forest community, and their competition for light resources is lower than that of canopy plants [9,16]. Most of the nutrients taken up by their root systems are invested in the leaves to promote photosynthetic efficiency [17] and improve their own growth. Therefore, understory plants always have higher nutrient cycling rates than canopy plants and are more sensitive to changes in external nutrient conditions [8,9,18]. However, most of the current studies on the effects of N and P additions on LES traits in understory plants have focused on temperate and tropical forests [19,20,21] or on understory seedling experiments conducted in artificial environments with sufficient light [15,22]. The effects of N and P additions, especially long-term fertilization, on the LES traits of understory plants in subtropical forests under natural conditions are still less well understood, and how synergies or trade-offs between LES traits affect plant resource-use strategies is not clear.
In December 2011, we initiated a N and P addition experiment in a subtropical broadleaved forest located in Zhejiang province [23]. In this study, the leaves of five dominant understory species were collected, and LES traits were measured. The objectives were as follows: (1) to investigate the response of LES traits and the resource-use strategy to long-term N and P additions, and (2) to determine the relationship between the response of LES traits and resource-use strategy under fertilization. The hypotheses are given as follows: (1) due to species specificity, the strength of the same LES trait response to the same fertilization treatment may vary between different species; (2) because understory plant growth is limited with regards to light, trade-offs between LES traits related to light availability (i.e., increasing LMA with decreasing leaf nutrient concentrations) play an important role in influencing plant resource-use strategies.

2. Materials and Methods

2.1. Study Area and Fertilization Experiments

This study was conducted at the Tiantong Forest Ecosystem National Observation and Research Station, Zhejiang Province (29°48′ N, 121°47′ E). The study area is warm and humid throughout the year, with four distinct seasons and the same period of rain and heat. The average annual temperature is 16.2 °C, and the average annual rainfall is 1374.7 mm. The soil in this area is mainly mountainous brick red loam, with the soil pH ranging from 4.5 to 5.0. The soil total organic carbon, total nitrogen, and total phosphorus concentrations are 3.8~5.2 mg g−1, 0.25~0.36 mg g−1, and 0.12~0.21 mg g−1, respectively [24].
The fertilization platform was established at the end of 2010. Four fertilization treatments were set up in twelve plots (20 m × 20 m): control (CK, 0 kg N hm−2 yr−1 + 0 kg P hm−2 yr−1), N addition (+N, 100 kg N hm−2 yr−1), P addition (+P, 50 kg P hm−2 yr−1), and combined N and P additions (NP, 100 kg N hm−2 yr−1 + 50 kg P hm−2 yr−1). Three replications were randomly established for each treatment. The specific experimental settings can be found in the study of Zheng et al. [25]. Fertilizer (NH4NO3 or NaH2PO3 in 20 L of water) was applied monthly over the litter layer from January 2011, and NH4NO3 solution was changed to a mixed solution of NH4CL and NaNO3 from 2018 to 2023. Meanwhile, 20 L of water was applied to each CK plot to avoid differences in throughfall between the different treatments.

2.2. Plant Sample Collection and Measurement

Five dominant species ranked by the importance value [26] in the understory were selected for this study as follows: Camellia fraternal (Cf), Eurya muricata (Em), Eurya rubiginosa (Er), Rhododendron ovatum (Ro), and Symplocos sumuntia (Ss) (Table 1). Important value was calculated as the sum of relative frequency, relative dominance, and relative abundance. Relative frequency is the percentage of frequency of a particular species in relation to the total frequency of all species in the community. During the plant community survey, each plot was divided into 16 sub-plots (5 m × 5 m), and the number of occurrences of a given species in the sub-plots was calculated to obtain its frequency. Relative dominance is the percentage of the basal area of a given species in the community. Relative abundance is the percentage of the number of trees of a given species in relation to the total number of all species in the community. Plant leaf samples were collected, and LES traits were measured during the summer of 2023.
In each plot, 2~3 individuals of each species were selected with a diameter at breast height (DBH, 1.3 m) similar to the average DBH of the species. Well-grown branches were then selected, and the maximum net photosynthetic rate per unit area of leaves distributed on the sunny side and fully expanded was determined using a portable gas exchange system (Li-6800, Li-Cor, Lincoln, NE, USA). In total, 20~30 samples of fresh and mature leaves were randomly collected from branches, placed in self-sealing bags, and brought back to the laboratory to determine the leaf area using a leaf area meter (Li-3000, Li-Cor, Lincoln, NE, USA). After the above work was completed, the leaf surface was washed with distilled water to remove the sediment. The leaves withered in an oven at 105 °C and were then dried at 75 °C to a constant weight. The weight was then measured to obtain the dry weight of the leaves. Leaf mass per area (LMA, g m−2) was obtained as the ratio of the leaf dry weight to leaf area. The dried leaf samples were ground, and the total nitrogen concentration was determined by the Kjeldahl method (Nmass, g kg−1), while the total phosphorus concentration was determined by the molybdenum blue colorimetric method (Pmass, g kg−1), and the net photosynthesis rate per unit mass (Amass μmol g−1 s−1) was obtained as the ratio of the net photosynthesis rate per unit area to LMA.

2.3. Statistical Analysis

Two-way ANOVA was used to test the effects of fertilization on species and their interactions on the LES traits, and LSD multiple comparison tests were used to test for differences in the effects of different fertilization treatments on the LES traits within species.
The response ratio (RR) was used to determine the response magnitude of LES traits to nitrogen and phosphorus additions, which was calculated as shown in Equation (1) [27]:
RR = DT/DC
where DT is the value of LES traits under +N, +P, or +NP treatments at the species level, and DC is the value of LES traits under the CK treatment. RR was natural-log-transformed to obtain LnRR, which gives equal weight to negative and positive responses to nutrient addition [28]. A positive value of LnRR indicates an increase in LES traits in the fertilized treatment compared to the CK treatment, whereas a negative value represents a decrease. The relationship between the LnRR of LES traits was then analyzed using linear regression. If the linear regression equation passes the significance test and the regression slope is less than or greater than zero, it indicates a significant trade-off or synergy between LES traits under fertilization.
The standardized LES trait values that did not discriminate between species and fertilization treatments were subjected to principal component analysis (PCA). First, two eigenvectors with larger eigenvalues were extracted to form the PC1 axis and PC2 axis, and according to the ratio of the variance of each variable on PC1 and PC2 compared to the total variance of this principal component, the degree of contribution of each variable to PC1 and PC2 was calculated. The values of each trait were then placed in the trait space with distinct fertilization treatments and species. According to the projection position of the species on the PC1 axis from left to right, the ranking of the different species under the same treatment was obtained. Finally, the ranking of the +N, +P, and +NP treatments was compared with the ranking of the CK treatment to determine the shift in the resource-use strategy of species.
The above analysis was performed in R software (R4.3.1) using the stats, multcomp, and vegan packages, and the graphs were illustrated using the ggplot2 package. The significance level of the statistical test for the above analysis was p < 0.05.

3. Results

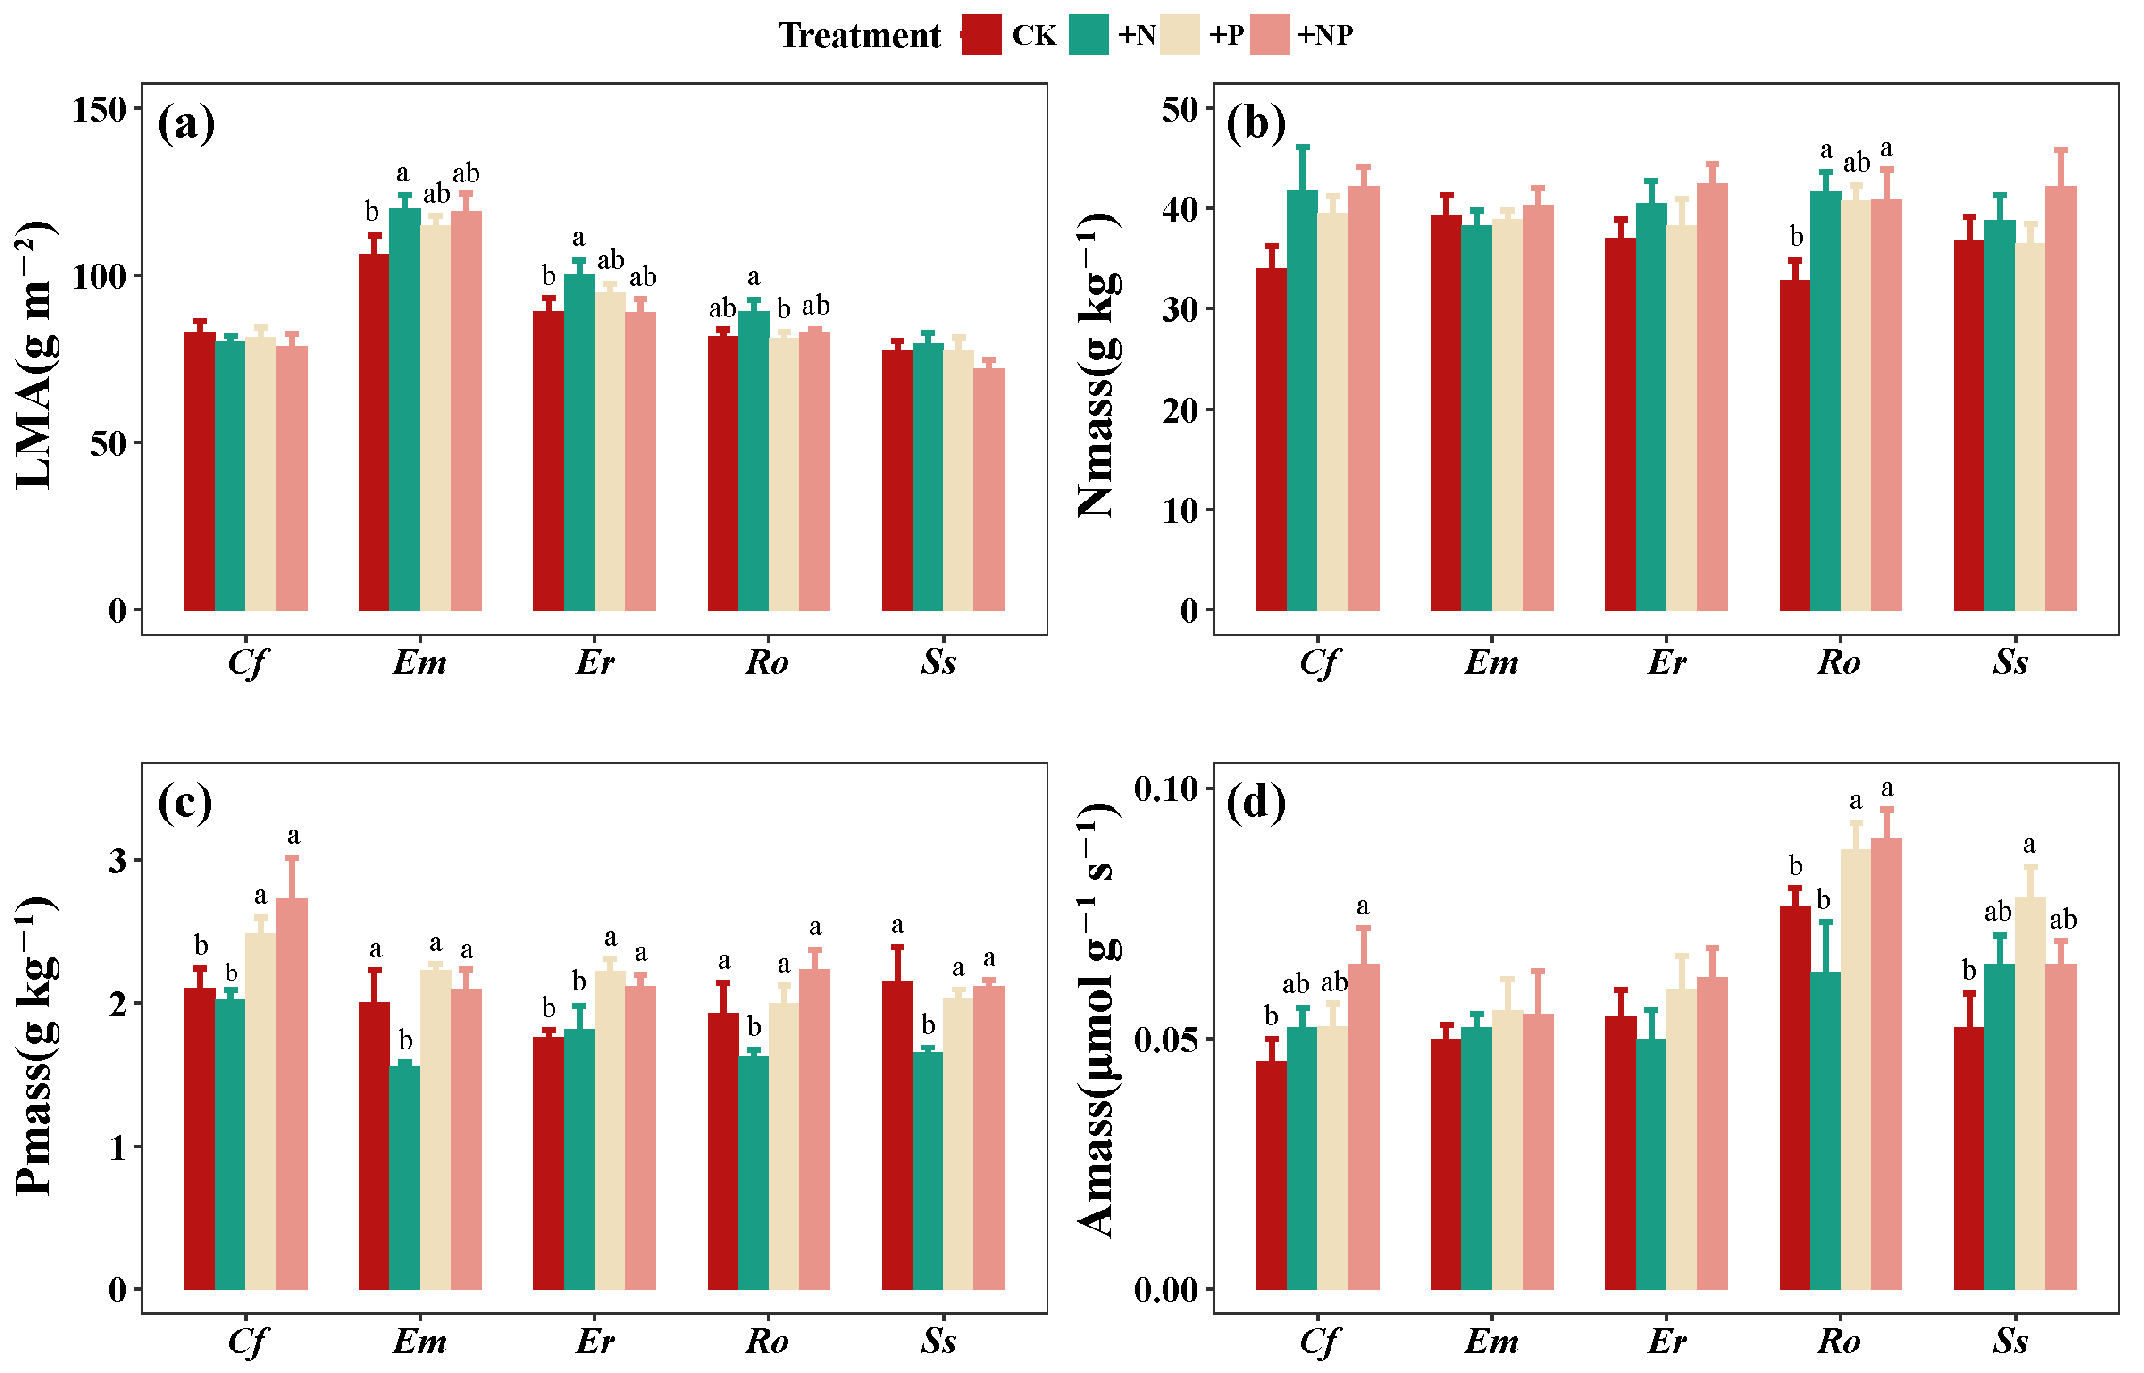
3.1. Effects of N and P Additions on LES Traits of Understory Plants

The effects of long-term N and P additions on each LES trait varied depending on the type of fertilization and species type (Table 2, Figure 1). Under the CK treatments, the LMA of Em and Er were 106.34 g m−2 and 100.20 g m−2, respectively, which were higher than those of the other three species. Compared to the CK treatment, the +N treatments significantly increased their LMA by 12.8% and 12.5%, respectively. The +N and +NP treatments increased the Nmass of Ro by 25.9% and 23.6%, respectively. The +N treatments significantly reduced the Pmass of Em, Ro, and Ss by 22.5%, 15.6%, and 23.2%, respectively. The +P and +NP treatments significantly increased the Pmass of Cf and Er by ~23%. The Amass of Ro and Ss significantly increased by 15% and 50% under the +P treatment, and the +NP treatment significantly increased the Amass of Cf and Ro by 43% and 18%, respectively.

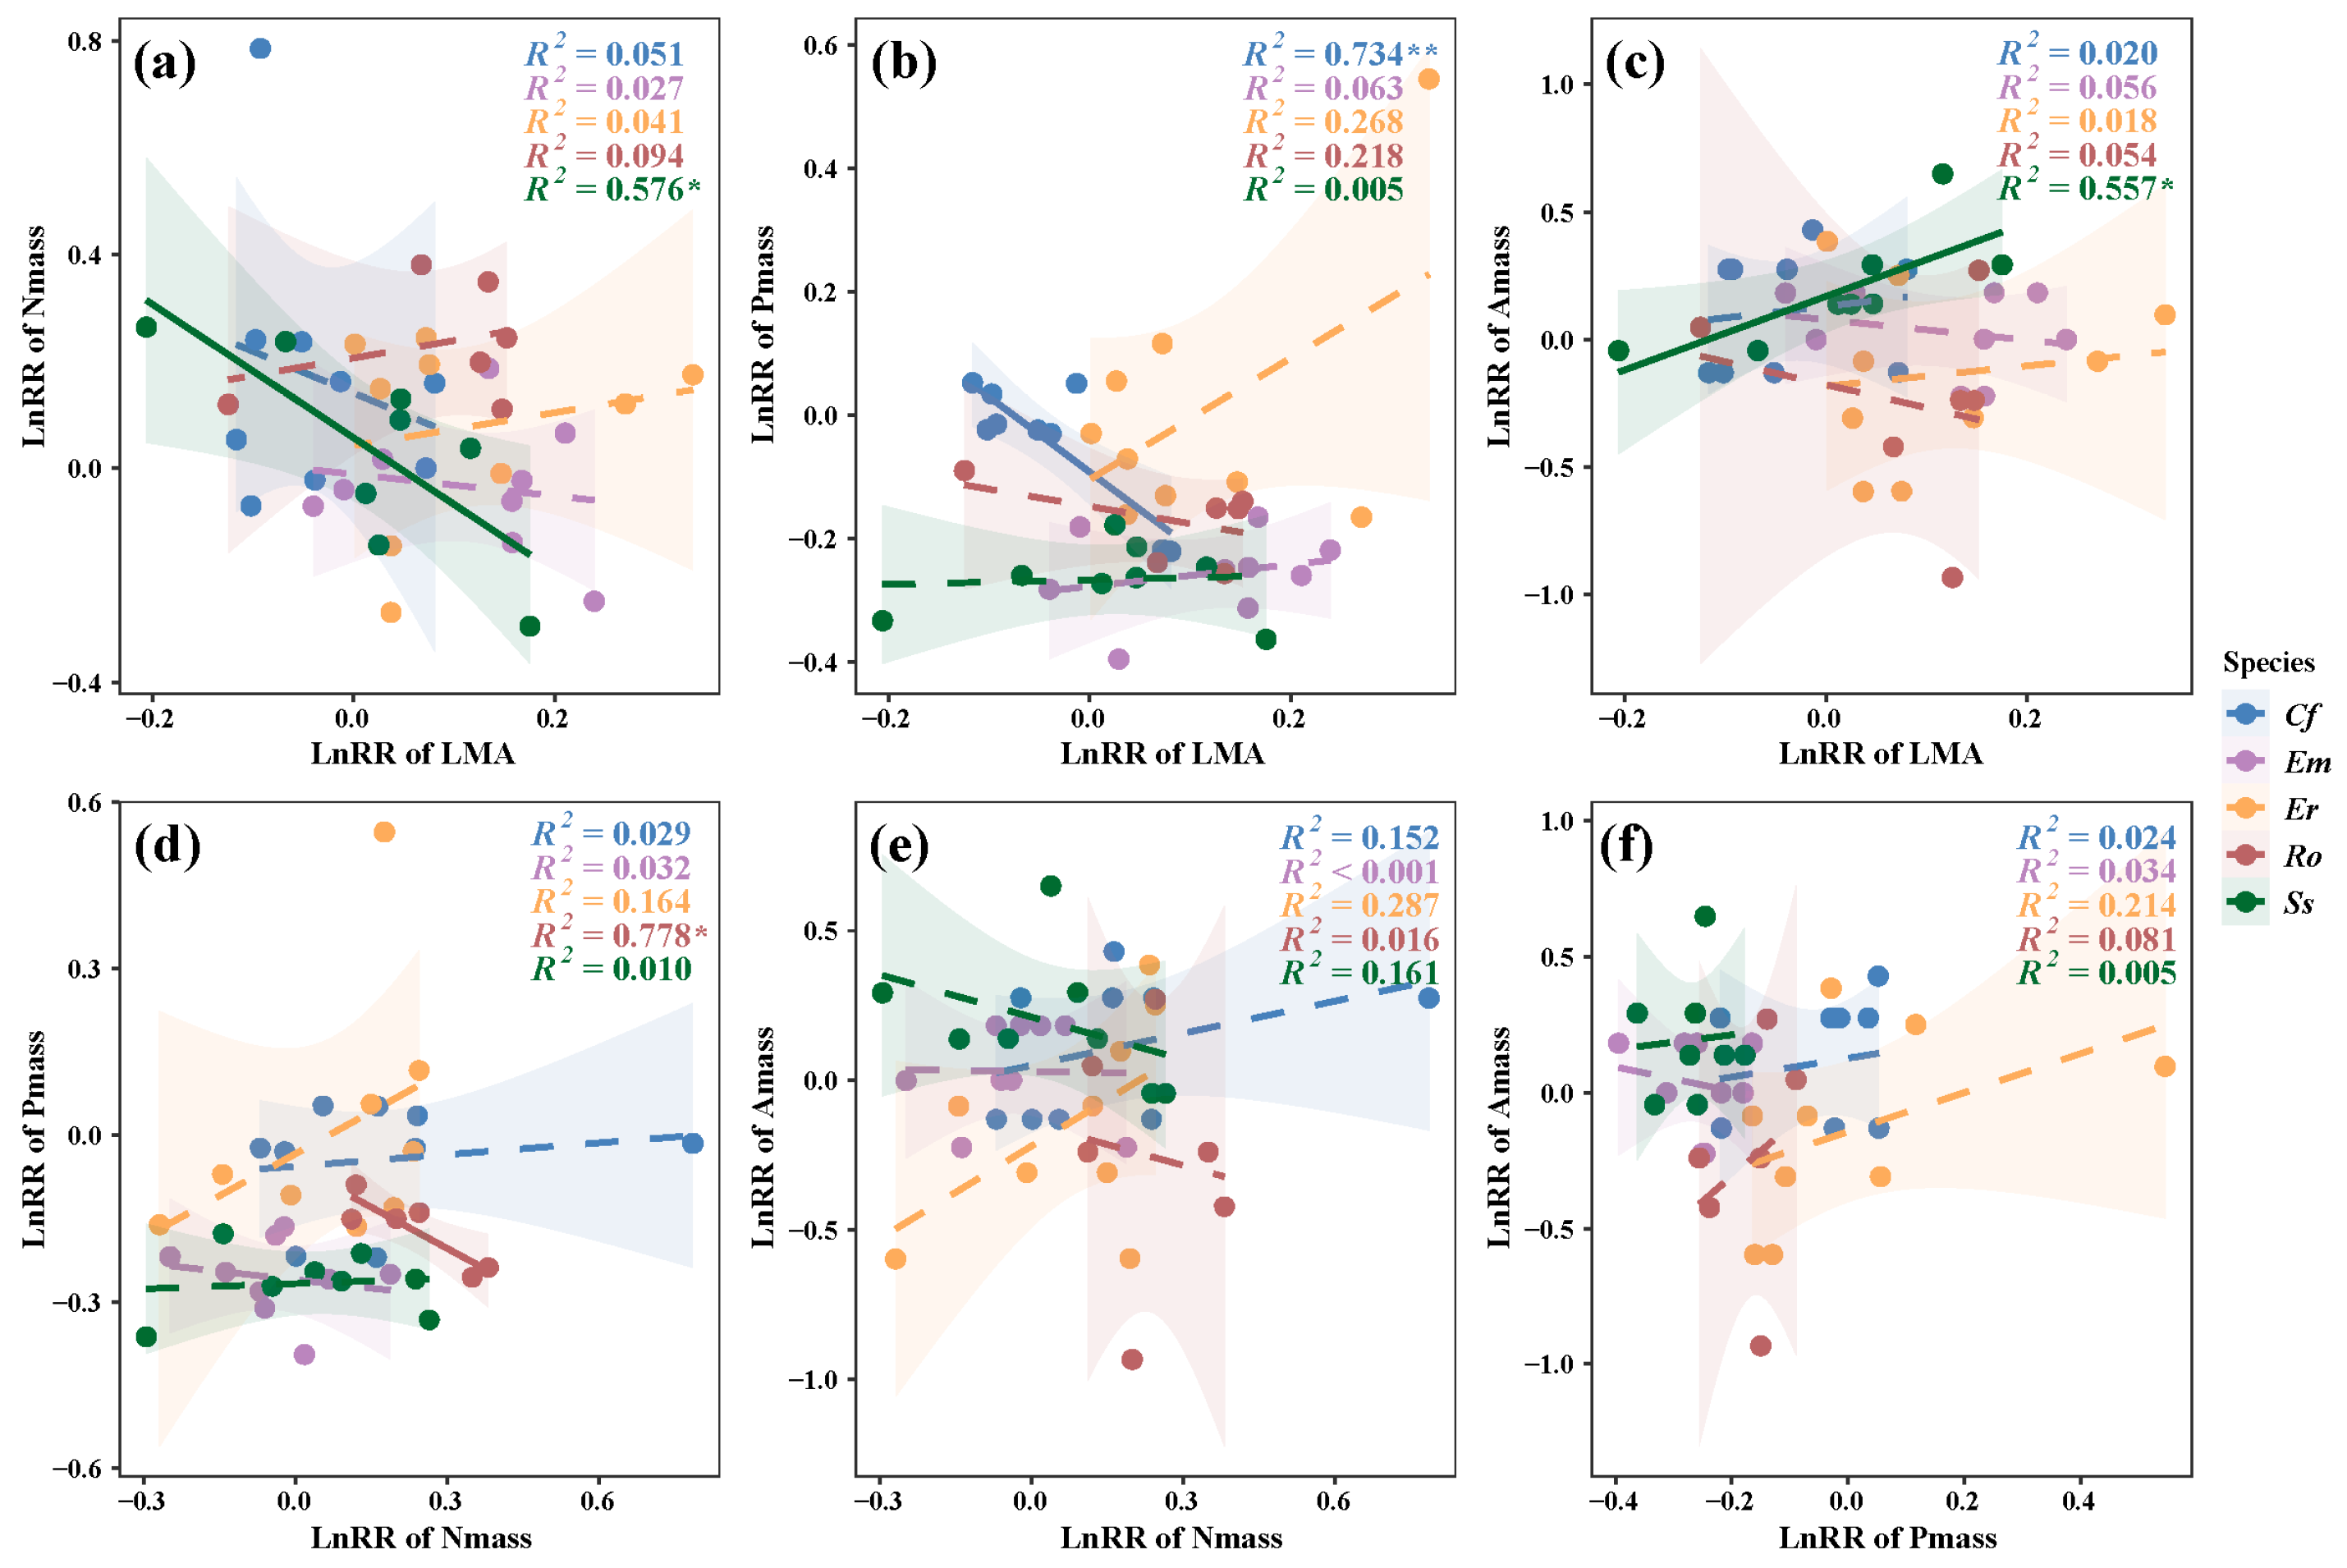
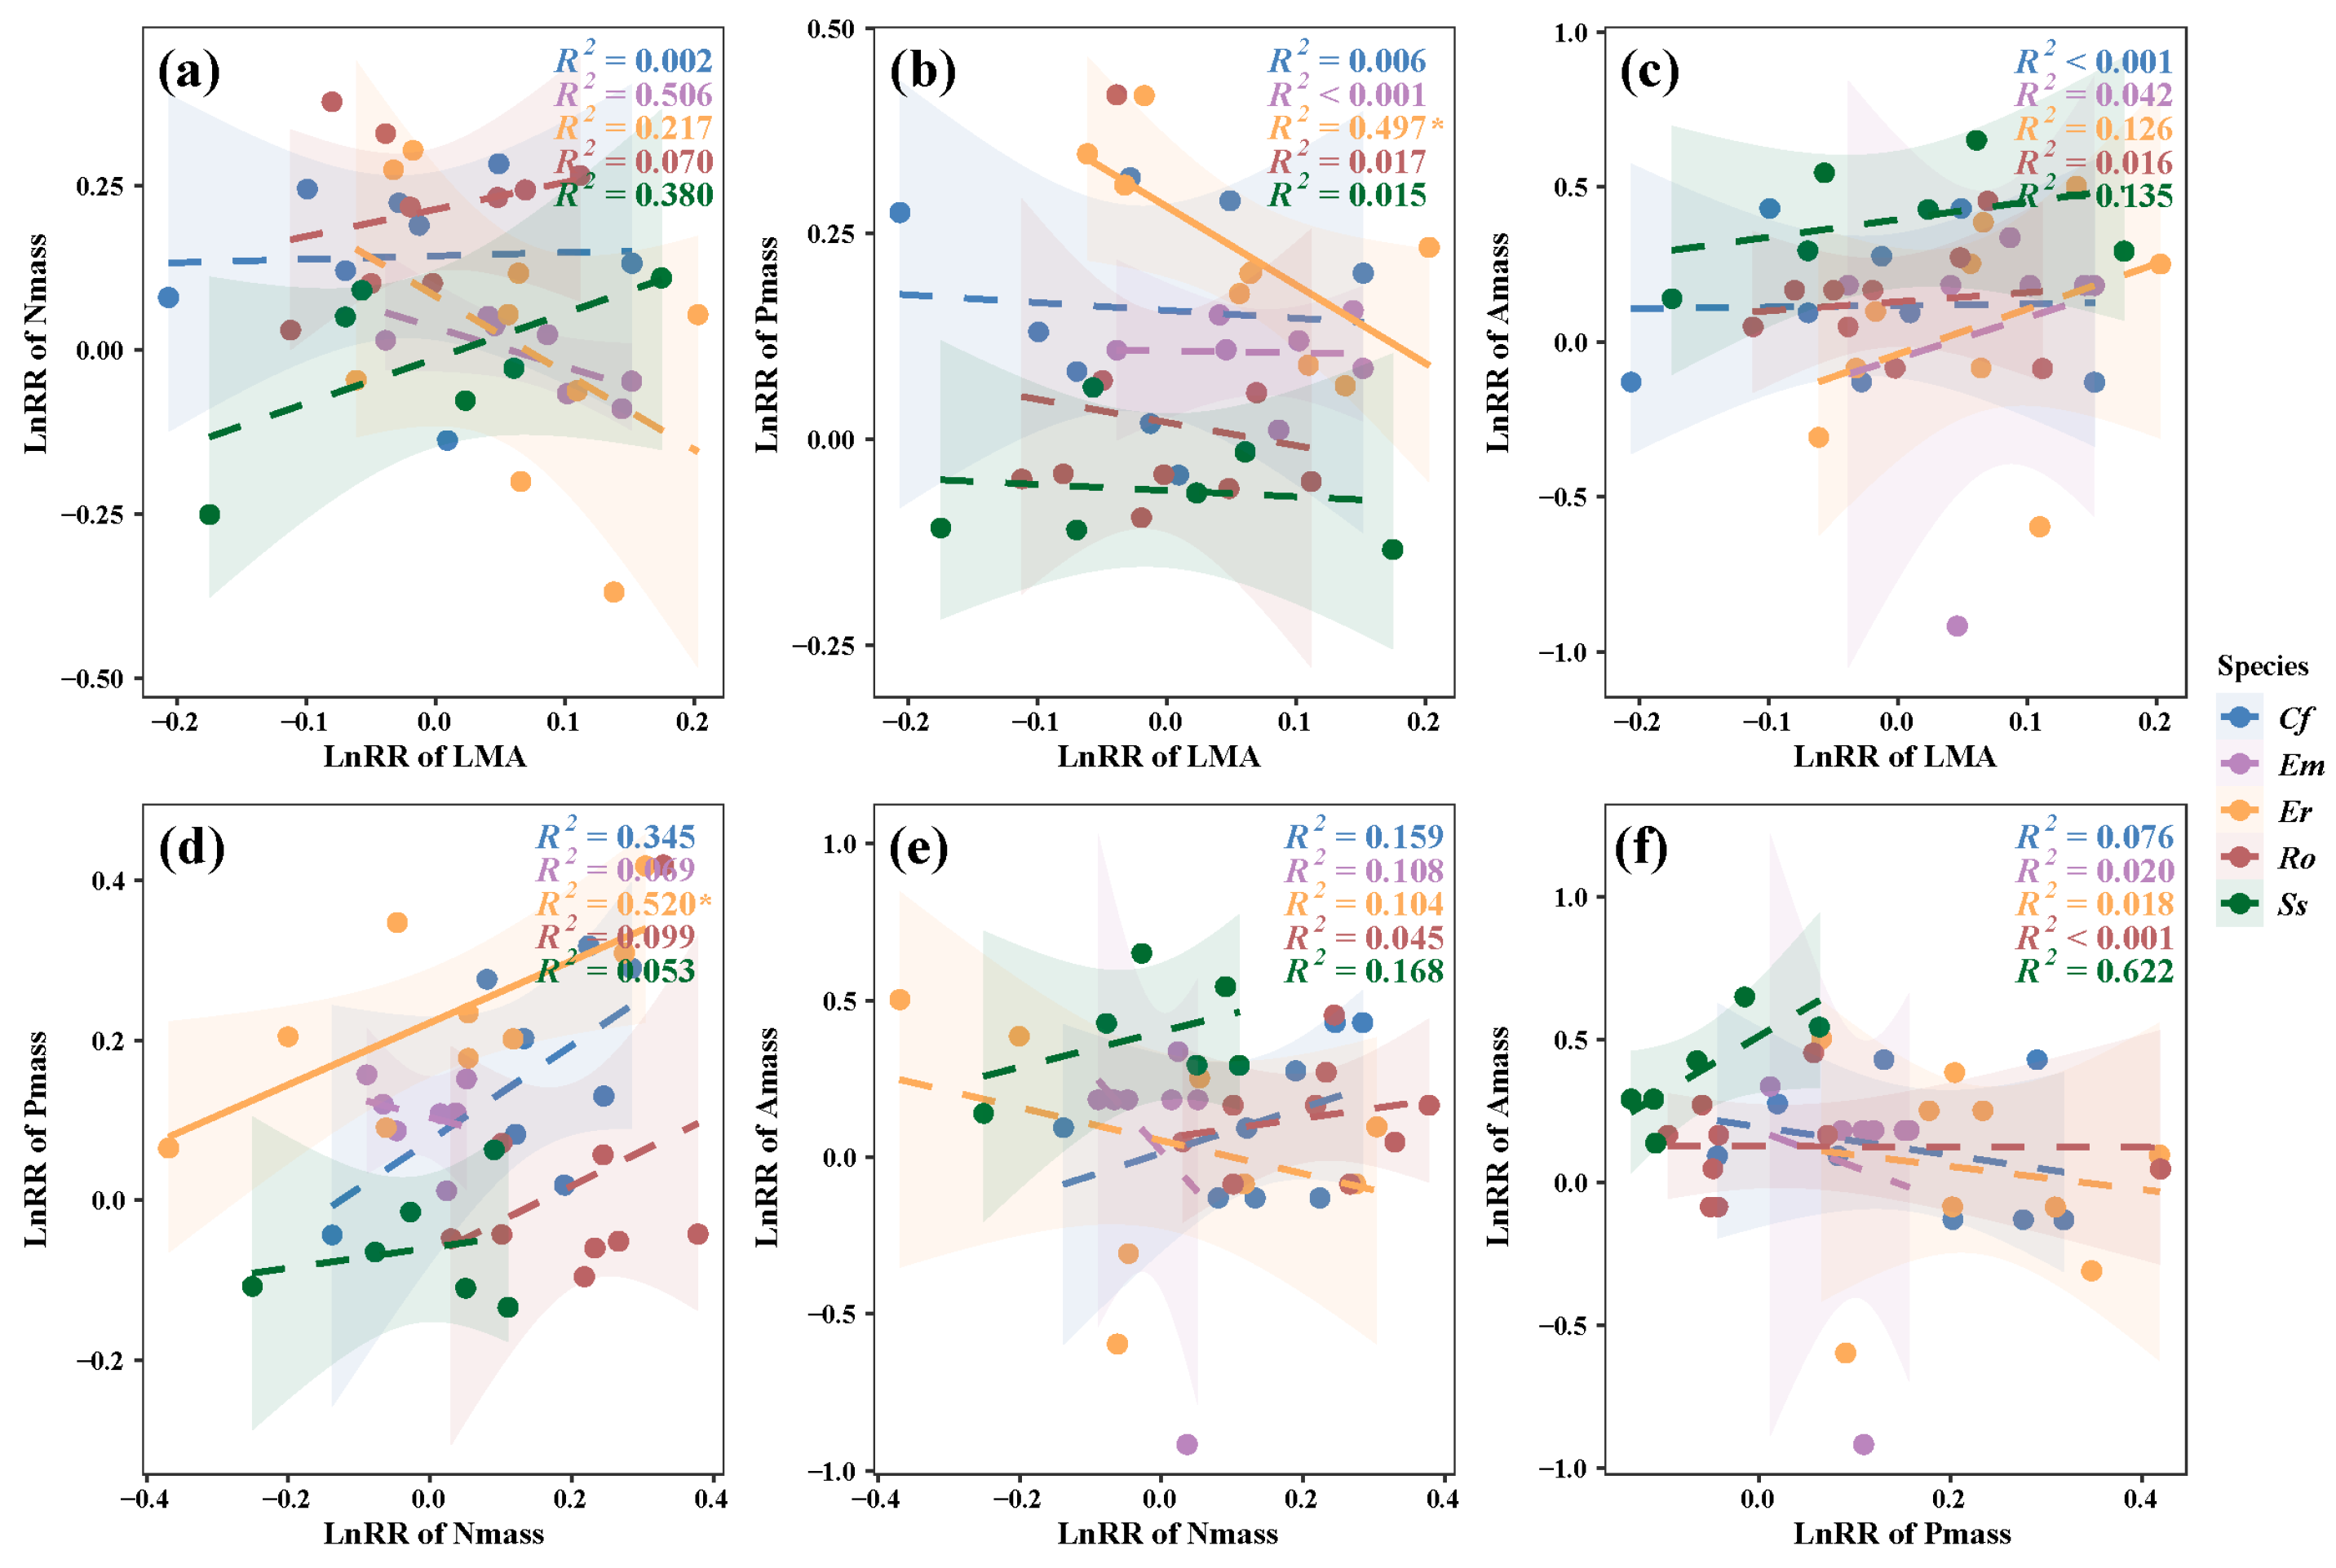
3.2. Relationships Between LES Trait Responses and N and P Additions

Under the +N treatment, the LnRR of LMA exhibited a significant negative correlation with Nmass and Pmass (Ss: R2 = 0.576, p < 0.05, Figure 2a; Cf: R2 = 0.734, p < 0.01, Figure 2b), showing the trade-offs between plant LMA and leaf N and P concentrations after N addition. The LnRR of LMA of Ss had a highly significant positive correlation with that of Amass (R2 = 0.557, p < 0.05, Figure 2c), showing the synergy between plant LMA and Amass after N addition. By contrast, the LnRR of Nmass and Pmass of Ro showed a significant negative correlation (R2 = 0.778, p < 0.05, Figure 2d).
The relationship between the LnRR of the LES traits of Er was the most pronounced among the five species under the +P treatment, with a significant negative correlation between the LnRR of LMA and Pmass of Er (R2 = 0.497, p < 0.05, Figure 3b) and a significant positive correlation between the LnRR of Nmass and Pmass (R2 = 0.520, p < 0.05, Figure 3d).
The trade-off between LMA and Pmass was evident, and the LnRR of LMA and Pmass of three understory plants (i.e., Cf, Ro, Ss) showed significant negative correlations (R2 = 0.462~0.861, p < 0.05) under the +NP treatment (Figure 4b). There was also a significant positive correlation between the LnRR of Nmass and the Pmass of Em (R2 = 0.516, p < 0.05, Figure 4d).

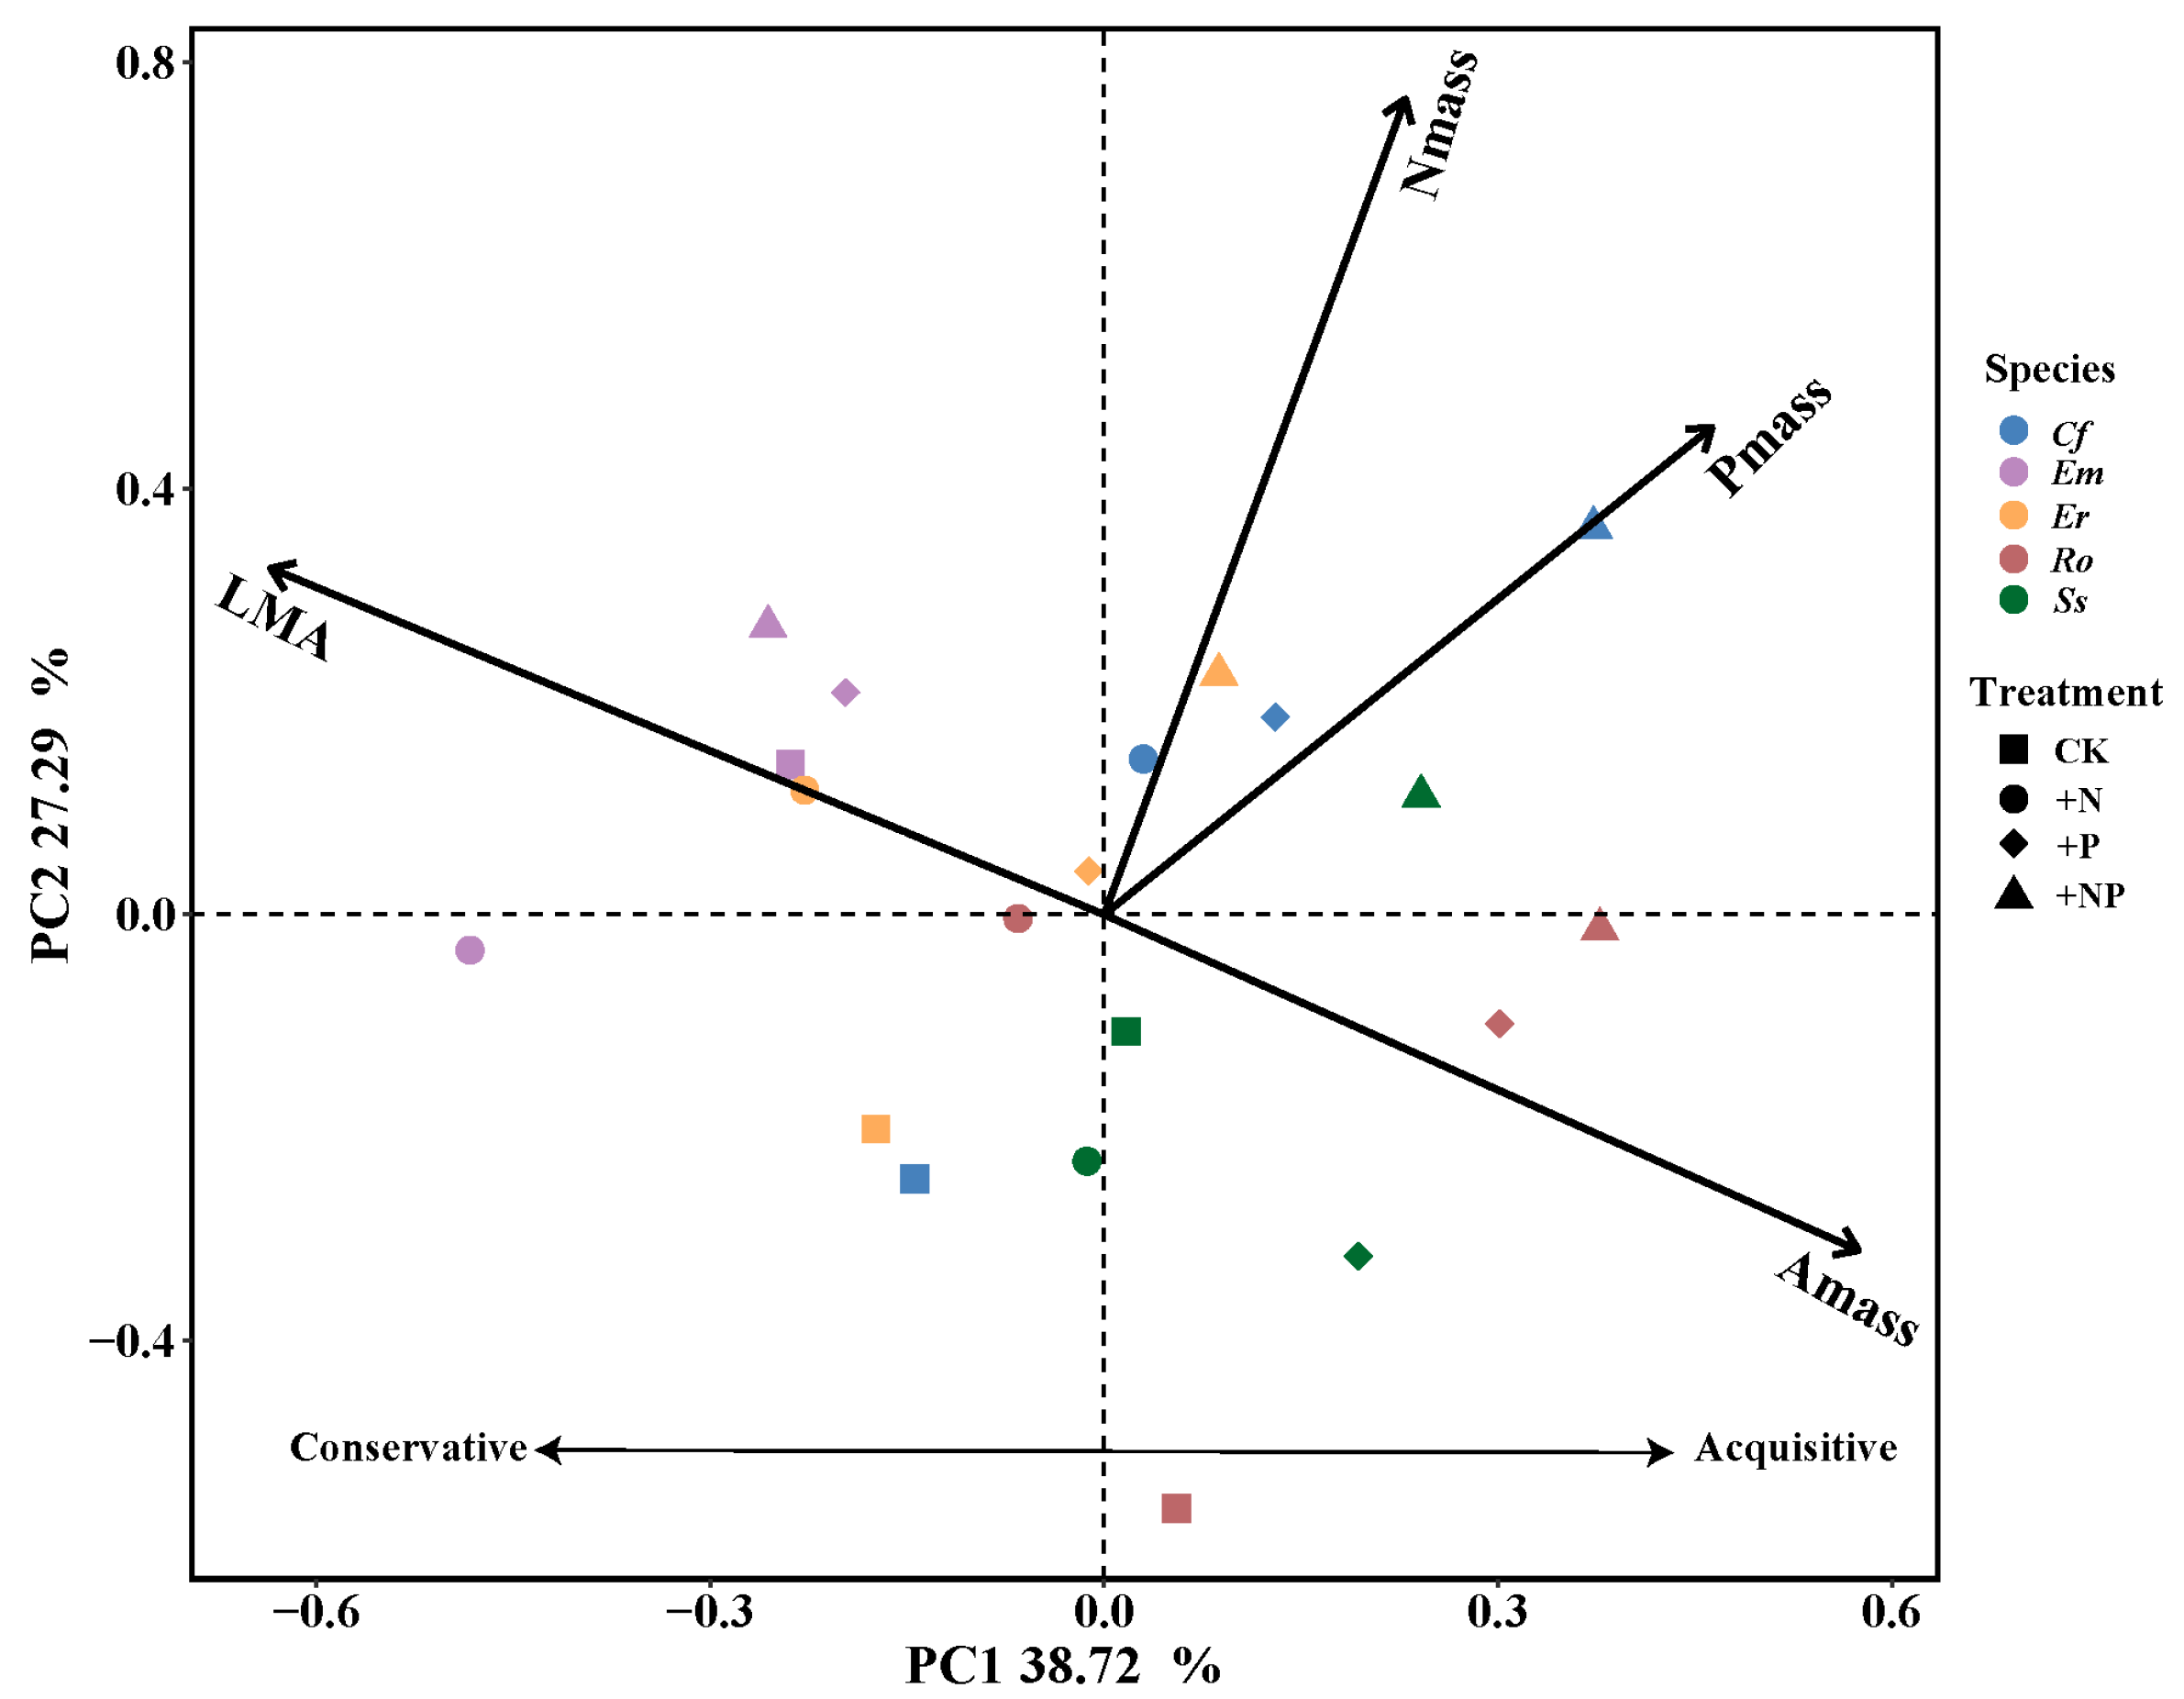
3.3. Shifts in LES Position and Plant Resource-Use Strategies Under N and P Additions

The results of the PCA show that the principal component axes 1 and 2 can explain 66.02% of the variation in LAM, Nmass, Pmass, and Amass (Figure 5). The variance explained by the PC1 axis is 38.87% and corresponds to the “investment-return” strategy axis in the LES theory. The LMA, Pmass, and Amass are highly correlated with the PC1 axis, with the LMA contributing 40.3% to the PC1 axis, followed by Amass and Pmass (Figure 6a). The PC2 axis explains 27.29% of the variation, and Nmass contributes the most to this, reaching 58.6% (Figure 6b).
Under the CK treatment, Em, Er, and Cf belonged to the relatively conservative types of resource-use strategy, while the plant strategy of Ro and Ss tended towards the relatively acquisitive type (Figure 5, Table 3). In addition, the fertilization treatments changed the distance of the five species from the PC1 axis, and the ranking of the species on the LES strategy axis also changed to some extent.
Under the +N treatment, the ranking of Cf dropped to fifth place, indicating that its resource-use strategy was closer to the acquisitive type, and the ranking of Ro increased to third place, showing a shift from the relatively acquisitive type to the relatively conservative type (Figure 5, Table 3). The rankings of Em and Er were closer to the left end of the PC1 axis, suggesting that the resource-use strategy of these two species is relatively more conservative after N addition. Although the ranking of the five species remained unchanged under the +P treatment (Table 3), there was a trend in the plant resource use strategies from the relatively conservative to the acquisitive direction (Figure 5). The order of Cf and Ss was reversed under the +NP treatment, and the other four species except Em were closer to the right end of the PC1 axis, showing that their resource use strategies tend to be more acquisitive.

4. Discussions

4.1. Fertilization Alters Plant LES Traits and Their Relationships

In this study, four LES traits were selected, and the effects of N and P additions on them were analyzed. There were different effects of fertilizer type on the same plant trait, and species type significantly influenced the response of LES traits to fertilization (Table 2, Figure 1). The results are consistent with hypothesis 1. The strong control of species type on the response of plant leaf traits to fertilization was due to the fact that plant functional traits are related to plant phylogeny, ecological niches, and resource-use strategies [29]. Several studies have found that structural traits (e.g., LMA) are less responsive to changes in environmental conditions than chemical and physiological traits (e.g., leaf P concentration) [6,9,30]. However, our results show that the LMA of Er and Em increased significantly under the +N treatment (Figure 1a). This result is inconsistent with other studies by Ye et al. [14], who found a decrease in the LMA of Superba schima seedling leaves under N addition. LMA is an indicator of both light capture capacity and carbohydrate accumulation capacity. The higher the LMA, the more conservative the plant is in its resource use. Our result suggests that understory plants would increase their input per unit leaf area (i.e., an increase in LMA) in order to reduce the rate of recycling of resources and to adopt a more conservative growth strategy to cope with light limitation and greater nutrient stress under the increasing phosphorus limitation caused by long-term N addition [21]. Pmass and Amass showed a positive response to phosphorus addition (Figure 1c,d), which is consistent with other studies in subtropical forests [15]. The +P treatment increased soil phosphatase activity and soil P availability [31], as well as the phosphorus cycling rate, leading to an increase in plant leaf P concentration and the photosynthesis rate (Figure 1).
The total amount of resources that plants can use is limited; thus, if too many resources are invested in one aspect, there will inevitably be a corresponding reduction in other aspects. This change in resource allocation leads to a generalized trade-off between plant traits to ensure that plants are able to achieve optimal growth and development under limited resource conditions [13,32]. In this study, there was a significant negative correlation between the LnRR of LMA and Pmass or Nmass regardless of fertilizer treatments (Figure 2, Figure 3 and Figure 4), suggesting the robust trade-off relationships that occur between plant traits following the changes in soil resource availability due to fertilization [33]. These results are consistent with hypothesis 2 and other studies [6,15]. Shi et al. found significant pairwise correlations for most plant functional traits under N addition in a subtropical montane forest [15]. The trade-offs between LMA and leaf nutrients in our study (e.g., decreasing LMA and increasing leaf Nmass in species Ro under +NP treatment) indicated that understory plants with limited light availability prefer to invest their resources in leaf nutrient storage as well as leaf morphology construction in response to nitrogen and phosphorus additions because a decrease in LMA implies a larger leaf area per unit of dry weight, which, in turn, ensures that they can obtain a greater amount of light energy for photosynthesis [34].

4.2. Plants Adjust Resource-Use Strategies Through Trait Changes After Fertilization

The LES theory describes how the strategies for optimizing resource allocation have been developed by the long-term adaptation of plants to their environment, and plants surviving in the same environment may adopt different resource allocation approaches [32]. In this study, the five understory plants under our investigation showed clear differences in resource-use strategies under the CK treatment (Figure 5). Zhao et al. [13] also found that LES was applicable to closely related species at the local scale. When the environment changes, plants can adapt to environmental changes by changing their leaf functional traits [8,15], and plants with different positions on the LES adopt differentiated resource-use strategies, thereby enhancing their competitiveness [35]. This study also found that the response of LES traits to N and P additions varied among plants (Figure 1), and the ranking of species position on the LES axis changed (Table 3).
Previous studies have reported the more acquisitive resource-use strategy of plant seedlings in subtropical forests under N addition [15]. In this study, only one species (i.e., Cf) shifted from relatively conservative to relatively acquisitive under +N treatment (Table 3). The LMA of Cf had a negative response, whereas Amass had a positive response to N addition (Figure 1), suggesting that Cf may be more inclined to decrease LMA and, thus, increase its photosynthetic capacity to improve its own competitiveness [36]. However, the other four species tended to be more conservative under the +N treatment (Figure 5) due to the different trade-offs between the LES traits of these species compared to Cf. For example, the LMA and Pmass of Em showed significant positive and negative responses to N addition, respectively (Figure 1), suggesting that this species shifted its own resource use mode to be more conservative by increasing LMA and decreasing Pmass in response to the increased N input.
In contrast to N addition, five species showed a trend in the resource-use strategy from a relatively conservative to a relatively acquisitive type after P addition (Figure 5). Plant growth in subtropical forests was generally limited by P, and Pmass or Amass increased significantly after P addition (Figure 1), suggesting that with the alleviation of plant nutrient limitation after long-term P addition [31], plants adopted an acquisitive strategy by increasing their leaf P concentration and photosynthesis rate to adapt to the changes in soil phosphorus availability [10].
With the combined additions of nitrogen and phosphorus, the resource-use strategy of the four species except Em became more acquisitive. This change was mainly related to the trade-off between LMA and Pmass, i.e., a decrease in LMA and an increase in Pmass (Figure 4b). LMA showed a negative response to the simultaneous addition of nitrogen and phosphorus, but Pmass and Amass showed a positive response (Figure 2). As LMA decreased, plants acquired phosphorus more rapidly for photosynthetic construction [36], leading to a shift in the resource-use strategy of these species (Figure 5). Overall, the ranking of species on the LES strategy axis, together with the response of LES traits to fertilization, could partially indicate the change in resource-use strategy under N and P additions. However, this 12-year experiment may not be sufficient, and a longer experiment duration might be needed to capture the long-term adaptive strategies of forest plants.

5. Conclusions

Our results confirm that the response of LES traits of understory plants to nitrogen and phosphorus additions varied greatly depending on fertilizer type and species specificity. The understory plants shifted from relative resource acquisition to relative conservative by increasing LMA and decreasing Pmass under +N treatment, whereas under +P and +NP treatments, most of the plants made the shift to relative rapid resource acquisition by increasing Pmass or Amass while decreasing LMA, indicating that plants can alter their resource-use strategies by adjusting their functional traits and their trade-offs differently to adapt to the environmental changes. Our results highlight that more attention should be paid to the response and trade-off between functional traits related to the light resource use of understory species in the context of intense N and P depositions in subtropical forests.

Author Contributions

Conceptualization, Z.Z. and Y.Y.; methodology, Y.Y. and P.H.; validation, X.Y., S.X. and P.H.; formal analysis, Y.Y.; investigation, Y.Y., P.H. and J.B.; data curation, Z.Z., Y.Y. and P.H.; writing—original draft preparation, Z.Z., Y.Y. and P.H.; writing—review and editing, Z.Z., Y.Y. and P.H.; project administration, Z.Z.; funding acquisition, Z.Z. All authors have read and agreed to the published version of the manuscript.

Funding

This study was funded jointly by the Natural Science Foundation of Shanghai (Grant No. 22ZR1421800) and the National Natural Science Foundation of China (Grant No. 42261144688).

Data Availability Statement

The data of this study are available from the corresponding author upon request.

Acknowledgments

We thank Dingzhong Cao and Bo Wang for help with the field and laboratory work.

Conflicts of Interest

The authors declare no conflicts of interest.

References

  1. Ackerman, D.; Millet, D.B.; Chen, X. Global Estimates of Inorganic Nitrogen Deposition across Four Decades. Glob. Biogeochem. Cycles 2019, 33, 100–107. [Google Scholar] [CrossRef]
  2. Pan, Y.; Liu, B.; Cao, J.; Liu, J.; Tian, S.; Du, E. Enhanced Atmospheric Phosphorus Deposition in Asia and Europe in the Past Two Decades. Atmos. Ocean. Sci. Lett. 2021, 14, 100051. [Google Scholar] [CrossRef]
  3. Wright, I.J.; Reich, P.B.; Westoby, M.; Ackerly, D.D.; Baruch, Z.; Bongers, F.; Cavender-Bares, J.; Chapin, T.; Cornelissen, J.H.C.; Diemer, M.; et al. The Worldwide Leaf Economics Spectrum. Nature 2004, 428, 821–827. [Google Scholar] [CrossRef] [PubMed]
  4. Poorter, L.; Bongers, F. Leaf Traits Are Good Predictors of Plant Performance Across 53 Rain Forest Species. Ecology 2006, 87, 1733–1743. [Google Scholar] [CrossRef]
  5. Fan, Y.; Lambers, H.; Sayer, E.J.; Li, Y.; Li, Y.; Zhang, J.; Li, Z.; Hu, Z.; Li, H.; Wang, J.; et al. Variation in Leaf Phosphorus Fractions Reflects Plant Adaptations and Distribution in Low-Phosphorus Tropical Forests. Funct. Ecol. 2025, 39, 621–634. [Google Scholar] [CrossRef]
  6. Zhang, X.; Li, B.; Peñuelas, J.; Sardans, J.; Cheng, D.; Yu, H.; Zhong, Q. Resource-Acquisitive Species Have Greater Plasticity in Leaf Functional Traits than Resource-Conservative Species in Response to Nitrogen Addition in Subtropical China. Sci. Total Environ. 2023, 903, 166177. [Google Scholar] [CrossRef] [PubMed]
  7. Reich, P.B. The World-Wide ‘Fast–Slow’ Plant Economics Spectrum: A Traits Manifesto. J. Ecol. 2014, 102, 275–301. [Google Scholar] [CrossRef]
  8. Ye, X.; Bu, W.; Hu, X.; Wang, F.; Sun, R.; He, P.; Liang, X.; Chen, F. Are Small Trees More Responsive to Nutrient Addition than Large Trees in an Evergreen Broadleaved Forest? For. Ecol. Manag. 2023, 543, 121129. [Google Scholar] [CrossRef]
  9. Mo, Q.; Wang, W.; Chen, Y.; Peng, Z.; Zhou, Q. Response of Foliar Functional Traits to Experimental N and P Addition among Overstory and Understory Species in a Tropical Secondary Forest. Glob. Ecol. Conserv. 2020, 23, e01109. [Google Scholar] [CrossRef]
  10. Su, Y.; Tang, Y.; Hu, Y.; Liu, M.; Lu, X.; Duan, B. Exploring Plant Adaptation Strategies to Phosphorus Limitation Induced by Nitrogen Addition: Foliar Phosphorus Allocation and Root Functional Traits Analysis in Two Dominant Subalpine Tree Species. J. Plant Ecol. 2024, 17, rtae060. [Google Scholar] [CrossRef]
  11. Freschet, G.T.; Cornelissen, J.H.C.; Van Logtestijn, R.S.P.; Aerts, R. Evidence of the ‘Plant Economics Spectrum’ in a Subarctic Flora. J. Ecol. 2010, 98, 362–373. [Google Scholar] [CrossRef]
  12. Zhao, N.; Yu, G.; Wang, Q.; Wang, R.; Zhang, J.; Liu, C.; He, N. Conservative Allocation Strategy of Multiple Nutrients among Major Plant Organs: From Species to Community. J. Ecol. 2020, 108, 267–278. [Google Scholar] [CrossRef]
  13. Zhao, C.; Lin, Q.; Tian, D.; Ji, C.; Shen, H.; Fan, D.; Wang, X.; Fang, J. Nitrogen Addition Promotes Conservative Resource-Use Strategies via Aggravating Phosphorus Limitation of Evergreen Trees in Subtropical Forest. Sci. Total Environ. 2023, 889, 164047. [Google Scholar] [CrossRef]
  14. Ye, X.; Bu, W.; Hu, X.; Liu, B.; Liang, K.; Chen, F. Species Divergence in Seedling Leaf Traits and Tree Growth Response to Nitrogen and Phosphorus Additions in an Evergreen Broadleaved Forest of Subtropical China. J. For. Res. 2023, 34, 137–150. [Google Scholar] [CrossRef]
  15. Shi, X.-M.; Qi, J.-H.; Liu, A.-X.; Zakari, S.; Song, L. Leaf Phenotypic Plasticity Coupled with Integration Facilitates the Adaptation of Plants to Enhanced N Deposition. Environ. Pollut. 2023, 327, 121570. [Google Scholar] [CrossRef] [PubMed]
  16. Tang, S.; Zhang, L.; Lambers, H.; Ren, W.; Lu, X.; Hou, E.; Fu, S.; Kuang, Y. Addition of Nitrogen to Canopy versus Understorey Has Different Effects on Leaf Traits of Understorey Plants in a Subtropical Evergreen Broad-Leaved Forest. J. Ecol. 2021, 109, 692–702. [Google Scholar] [CrossRef]
  17. Lambers, H.; Raven, J.A.; Shaver, G.R.; Smith, S.E. Plant Nutrient-Acquisition Strategies Change with Soil Age. Trends Ecol. Evol. 2008, 23, 95–103. [Google Scholar] [CrossRef]
  18. Scheller, R.M.; Mladenoff, D.J. Understory Species Patterns and Diversity in Old-Growth and Managed Northern Hardwood Forests. Ecol. Appl. 2002, 12, 1329–1343. [Google Scholar] [CrossRef]
  19. Mao, Q.; Lu, X.; Wang, C.; Zhou, K.; Mo, J. Responses of Understory Plant Physiological Traits to a Decade of Nitrogen Addition in a Tropical Reforested Ecosystem. For. Ecol. Manag. 2017, 401, 65–74. [Google Scholar] [CrossRef]
  20. Turner, B.L.; Brenes-Arguedas, T.; Condit, R. Pervasive Phosphorus Limitation of Tree Species but Not Communities in Tropical Forests. Nature 2018, 555, 367–370. [Google Scholar] [CrossRef] [PubMed]
  21. Khan, A.; Sun, J.; Zarif, N.; Khan, K.; Jamil, M.A.; Yang, L.; Clothier, B.; Rewald, B. Effects of Increased N Deposition on Leaf Functional Traits of Four Contrasting Tree Species in Northeast China. Plants 2020, 9, 1231. [Google Scholar] [CrossRef]
  22. Cárate-Tandalla, D.; Camenzind, T.; Leuschner, C.; Homeier, J. Contrasting Species Responses to Continued Nitrogen and Phosphorus Addition in Tropical Montane Forest Tree Seedlings. Biotropica 2018, 50, 234–245. [Google Scholar] [CrossRef]
  23. Zheng, Z.; Mamuti, M.; Liu, H.; Shu, Y.; Hu, S.; Wang, X.; Li, B.; Lin, L.; Li, X. Effects of Nutrient Additions on Litter Decomposition Regulated by Phosphorus-Induced Changes in Litter Chemistry in a Subtropical Forest, China. For. Ecol. Manag. 2017, 400, 123–128. [Google Scholar] [CrossRef]
  24. Gao, Q.; Hasselquist, N.J.; Palmroth, S.; Zheng, Z.; You, W. Short-Term Response of Soil Respiration to Nitrogen Fertilization in a Subtropical Evergreen Forest. Soil Biol. Biochem. 2014, 76, 297–300. [Google Scholar] [CrossRef]
  25. Zheng, Z.; Lu, J.; Su, Y.; Yang, Q.; Lin, Y.; Liu, H.; Yang, J.; Huang, H.; Wang, X. Differential Effects of N and P Additions on Foliar Stoichiometry between Species and Community Levels in a Subtropical Forest in Eastern China. Ecol. Indic. 2020, 117, 106537. [Google Scholar] [CrossRef]
  26. Song, Y. Vegetation Ecology, 2nd ed.; Higher Education Press: Beijing, China, 2017; ISBN 978-7-04-046159-6. [Google Scholar]
  27. Hedges, L.V.; Gurevitch, J.; Curtis, P.S. The Meta-Analysis of Response Ratios in Experimental Ecology. Ecology 1999, 80, 1150–1156. [Google Scholar] [CrossRef]
  28. Marklein, A.R.; Houlton, B.Z. Nitrogen Inputs Accelerate Phosphorus Cycling Rates across a Wide Variety of Terrestrial Ecosystems. New Phytol. 2012, 193, 696–704. [Google Scholar] [CrossRef] [PubMed]
  29. Bai, T.; Liu, Y.-Y.; Muhammad, I.; Yang, X.; Yin, X.-J.; Bai, L.; Wang, Y.-J. Mixed Nitrogen Form Addition Facilitates the Growth Adaptation of Legume Plant to Heavy Metal Contamination in Degraded Mining Areas. Glob. Ecol. Conserv. 2020, 24, e01387. [Google Scholar] [CrossRef]
  30. Cernusak, L.A.; Winter, K.; Turner, B.L. Leaf Nitrogen to Phosphorus Ratios of Tropical Trees: Experimental Assessment of Physiological and Environmental Controls. New Phytol. 2010, 185, 770–779. [Google Scholar] [CrossRef] [PubMed]
  31. Cui, E.; Lu, R.; Xu, X.; Sun, H.; Qiao, Y.; Ping, J.; Qiu, S.; Lin, Y.; Bao, J.; Yong, Y.; et al. Soil Phosphorus Drives Plant Trait Variations in a Mature Subtropical Forest. Glob. Change Biol. 2022, 28, 3310–3320. [Google Scholar] [CrossRef] [PubMed]
  32. Westoby, M.; Falster, D.S.; Moles, A.T.; Vesk, P.A.; Wright, I.J. Plant Ecological Strategies: Some Leading Dimensions of Variation Between Species. Annu. Rev. Ecol. Evol. Syst. 2002, 33, 125–159. [Google Scholar] [CrossRef]
  33. Cui, E.; Weng, E.; Yan, E.; Xia, J. Robust Leaf Trait Relationships across Species under Global Environmental Changes. Nat. Commun. 2020, 11, 2999. [Google Scholar] [CrossRef] [PubMed]
  34. Griffith, D.M.; Quigley, K.M.; Anderson, T.M. Leaf Thickness Controls Variation in Leaf Mass per Area (LMA) among Grazing-Adapted Grasses in Serengeti. Oecologia 2016, 181, 1035–1040. [Google Scholar] [CrossRef] [PubMed]
  35. Li, J.; Chen, X.; Niklas, K.J.; Sun, J.; Wang, Z.; Zhong, Q.; Hu, D.; Cheng, D. A Whole-Plant Economics Spectrum Including Bark Functional Traits for 59 Subtropical Woody Plant Species. J. Ecol. 2022, 110, 248–261. [Google Scholar] [CrossRef]
  36. Zhang, Q.; Hao, G.; Li, M.; Li, L.; Kang, B.; Yang, N.; Li, H. Transformation of Plant to Resource Acquisition Under High Nitrogen Addition Will Reduce Green Roof Ecosystem Functioning. Front. Plant Sci. 2022, 13, 894782. [Google Scholar] [CrossRef]
Figure 1. Effect of nitrogen (N) and phosphorus (P) additions on LES traits ((a): leaf mass per area (LMA), (b): leaf N concentration (Nmass), (c): leaf P concentration (Pmass); (d): leaf net photosynthesis per unit mass (Amass)) of understory plants. Cf: Camellia fraternal; Em: Eurya muricata; Er: Eurya rubiginosa; Ro: Rhododendron ovatum; Ss: Symplocos sumuntia. CK: control; +N: N addition; +P: P addition; +NP: combined N and P additions. Different letters in subfigure denote significant difference (p < 0.05) between treatment.
Forests 16 00319 g001
Figure 2. The relationship between the LnRR (natural-log-transformed response ratio) of LES traits ((a): LMA versus Nmass; (b): LMA versus Pmass; (c): LMA versus Amass; (d): Nmass versus Pmass; (e): Nmass versus Amass; (f): Pmass versus Amass) of understory plants under the N addition treatment. *: p < 0.05; **: p < 0.01; Cf: Camellia fraternal; Em: Eurya muricata; Er: Eurya rubiginosa; Ro: Rhododendron ovatum; Ss: Symplocos sumuntia. Shaded areas indicate the 95% confidence intervals of the fitted lines.
Forests 16 00319 g002
Figure 3. The relationship between the LnRR (natural-log-transformed response ratio) of LES traits ((a): LMA versus Nmass; (b): LMA versus Pmass; (c): LMA versus Amass; (d): Nmass versus Pmass; (e): Nmass versus Amass; (f): Pmass versus Amass) of understory plants under the P addition treatment. *: p < 0.05; Cf: Camellia fraternal; Em: Eurya muricata; Er: Eurya rubiginosa; Ro: Rhododendron ovatum; Ss: Symplocos sumuntia. Shaded areas indicate the 95% confidence intervals of the fitted lines.
Forests 16 00319 g003
Figure 4. The relationship between the LnRR (natural-log-transformed response ratio) of LES traits ((a): LMA versus Nmass; (b): LMA versus Pmass; (c): LMA versus Amass; (d): Nmass versus Pmass; (e): Nmass versus Amass; (f): Pmass versus Amass) of understory plants under the combined N and P additions treatment. *: p < 0.05; ***: p < 0.001; Cf: Camellia fraternal; Em: Eurya muricata; Er: Eurya rubiginosa; Ro: Rhododendron ovatum; Ss: Symplocos sumuntia. Shaded areas indicate the 95% confidence intervals of the fitted lines.
Forests 16 00319 g004
Figure 5. Principal component analysis (PCA) of LMA, Nmass, Pmass, and Amass of understory plants under N and P additions. Cf: Camellia fraternal; Em: Eurya muricata; Er: Eurya rubiginosa; Ro: Rhododendron ovatum; Ss: Symplocos sumuntia. CK: control; +N: N addition; +P: P addition; +NP: combined N and P additions.
Forests 16 00319 g005
Figure 6. Contributions of understory plants LMA, Nmass, Pmass, and Amass to PC1 axis (a) and PC2 axis (b) based on principal component analysis (PCA).
Forests 16 00319 g006
Table 1. Information of five dominant understory species in the Tiantong Forst with nitrogen and phosphorus addition on experimental platform.
SpeciesAbbreviationFamilyDiameter at the Breast Height (DBH, cm)Tree Density
(Tree hm−2)
Important Value
Camellia fraternalCfTheaceae2.15750.28
Eurya muricataEmTheaceae3.42250.13
Eurya rubiginosaErTheaceae2.12500.20
Rhododendron ovatumRoEricaceae2.55000.20
Symplocos sumuntiaSsSymplocaceae2.14500.22
Table 2. The F-value of two-way ANOVA for the effect of nitrogen and phosphorus additions on leaf economic spectrum (LES) traits of understory plants.
VariabledfLMANmassPmassAmass
Fertilization33.167 *3.705 *8.589 **4.290 *
Species479.865 **0.0982.920 *9.666 **
Fertilization × Species121.2870.5930.6390.924
*: p < 0.05; **: p < 0.01.
Table 3. Ranking understory plants under different fertilization treatments based on PC1 axis of principal component analysis (PCA).
TreatmentsRanking
12345
CKEmErCfSsRo
+NEmErRoSsCf
+PEmErCfSsRo
+NPEmErSsCfRo
Cf: Camellia fraternal; Em: Eurya muricata; Er: Eurya rubiginosa; Ro: Rhododendron ovatum; Ss: Symplocos sumuntia. CK: control; +N: N addition; +P: P addition; +NP: combined N and P additions.
Disclaimer/Publisher’s Note: The statements, opinions and data contained in all publications are solely those of the individual author(s) and contributor(s) and not of MDPI and/or the editor(s). MDPI and/or the editor(s) disclaim responsibility for any injury to people or property resulting from any ideas, methods, instructions or products referred to in the content.

