1. Introduction
Monitoring forest stands is essential for sustainable forest management, as it provides critical information about forest structure [
1,
2]. The analysis of forest structure, species composition, and regeneration dynamics supports operational planning and plays a vital role in evaluating ecosystem health. Information derived from these assessments is essential for enhancing forest resilience in the face of climate change [
3,
4,
5]. According to current climate change projections, Europe is anticipated to experience a temperature rise ranging from 2.4 °C in optimistic projections to up to 6 °C in the worst-case scenarios. These climatic shifts are expected to intensify forest disturbances, including more severe and frequent droughts, pest outbreaks, wildfires, and extreme weather events.
Portugal, with its Mediterranean climate, is particularly vulnerable to these extremes and has witnessed increasingly intense wildfires in recent decades, notably in 2003, 2017, and more recently in 2025 [
6]. Consequently, post-fire restoration has become a national priority, and assessing the success of reforestation and natural regeneration is critical for improving recovery strategies. In addition to the prevalence of wildfires, the increasing frequency of extreme weather events, including severe storms, has further compromised forest ecosystems. These phenomena lead to significant structural damage and increased tree mortality, thereby impacting forest resilience and overall biodiversity [
7]. These disturbances also reduce timber value and impair key ecosystem services such as carbon sequestration, reinforcing the need for advanced tools to monitor forest condition and resilience under climate change [
8,
9,
10].
Traditionally, forest inventories have been performed using field-based surveys, which offer high levels of accuracy. However, these traditional methods face significant limitations regarding spatial coverage, time efficiency, and accessibility. Such challenges are particularly pronounced in the aftermath of severe weather events or when assessing recently planted stands located in rugged terrain. Recent advances in remote sensing, especially through the use of unmanned aerial vehicles (UAVs) equipped with high-resolution RGB and multispectral sensors, have offered a more flexible and cost-effective alternative for forest monitoring [
11,
12,
13,
14]. UAVs enable fast and repeated data acquisition over targeted areas, facilitating the timely detection of structural changes and vegetation conditions [
15,
16].
When integrated with artificial intelligence, particularly deep convolutional neural networks (CNNs), such as Mask R-CNN [
17] and YOLOv8 (You Only Look Once) [
18], UAV imagery can support automated detection of individual trees, fallen trunks, or plantation gaps, requiring minimal human intervention while achieving high spatial accuracy [
19,
20,
21,
22,
23]. Recent studies have shown the potential of deep learning in automating the assessment of forest damage following storms or tornadoes. Nasimi and Wood [
20] employed a deep learning approach using YOLOv8x-seg to detect tornado-induced tree falls in forested regions of Kentucky and Tennessee. Their method achieved a mean average precision of over 80% in instance segmentation of fallen trees using 2 cm-resolution UAV imagery, demonstrating the effectiveness of 2D image analysis for post-disturbance mapping. Treefall detection is not the only application where this approach is valuable. Guo et al. [
21] found that UAV imagery with ultra-high spatial resolution is effective for recognising young trees in complex plantation environments, even where overlapping vegetation and irregular spacing are present. Candiago et al. [
22] also demonstrated the usefulness of vegetation indices such as NDVI and GNDVI for detecting gaps in plantations. However, is the combination of these indices with deep learning algorithms that allows accurate and automated individual tree identification at scale [
24,
25].
Despite advancements in the field, several challenges remain in applying deep learning to forestry. A major limitation is the requirement for large, annotated datasets for model training, which is difficult to achieve due to the variability of forest structures, species diversity, lighting conditions, and terrain types [
9]. Diez et al. [
26] emphasised that although deep learning models generally outperform traditional approaches in image-based forestry applications, their ability to generalise across forest types, canopy structures, and illumination conditions is still limited [
27]. Similarly, Miao et al. [
28] found that although multispectral UAV classifiers achieved over 93% accuracy, they still required active learning to generalise effectively across seasonal conditions.
Mask R-CNN is one of the most widely used deep learning architectures for instance segmentation in forestry applications [
17,
29,
30]. This model not only detects objects in an image but also generates a segmentation mask for each instance. It is particularly suited for individual tree detection due to its ability to handle overlapping crowns and produce spatially precise outputs. Kislov and Korznikov [
31] applied Mask R-CNN to satellite RGB orthomosaic imagery and a manually annotated dataset for detecting windthrown trees in boreal forests. The model achieved over 85% precision and recall in detecting fallen trees, outperforming manual photo interpretation and significantly reducing processing time. Han et al. [
24] utilized a similar approach to detect individual trees in plantations and orchards using RGB drone images processed with a CNN-based object detection framework. They reported accuracies above 90% under varying canopy densities and lighting conditions. In more recent research, Yao et al. [
32] combined RGB images and Digital Surface Model (DSM) layers to differentiate between live and dead trees in mixed forests stands, highlighting the potential of combining spatial structure data with instance segmentation [
33]. These works illustrate that while traditional spectral analysis has its merits, incorporating deep learning enables fine-scale, object-based monitoring that aligns more closely with adaptative forest management goals. For example, Worachairungreung et al. [
34] employed deep networks (Faster R-CNN and Mask R-CNN) on UAV RGB images to detect and classify coconut trees in plantations with high accuracy, highlighting the potential of these approaches for individual tree-level monitoring.
Among the most efficient real-time object detection frameworks is YOLO (You Only Look Once), which has been successfully adapted for segmentation tasks. For instance, the study by Nasimi and Wood [
20] applied the YOLOv8x-seg variant to post-tornado forest damage assessment, achieving high segmentation precision (mAP > 80%) and highlighting YOLO’s capability to map fallen trees with minimal computational cost. The method reduced the need for time-consuming field assessments and enabled near-real-time storm damage estimation. Similarly, recent advances in lightweight architectures, such as YOLO-UFS [
35] and RSD-YOLOv8 [
36], have extended their applicability to real-time fire and pest detection in forestry, enabling deployment on low-power edge devices.
While the application of deep learning in forestry has demonstrated considerable potential, several methodological challenges remain unresolved. One of the primary limitations concerns data requirements, as most deep learning models demand large volumes of annotated training data, typically ranging from hundreds to thousands of labelled instances. However, the forestry sector continues to lack open access, standardised datasets suitable for robust model development and validation, as noted by Diez et al. [
26]. A second major challenge is model generalization. Predictive performance often deteriorates when models are applied across forest types that differ in species composition, canopy density, or environmental conditions [
26]. Soto Vega et al. [
37] similarly observed reduced generalisation in tropical plantations when CNNs trained on temperate forest data were transferred without adaptation.
A further complication relates to the influence of overlapping tree crowns and shadow effects, which remain problematic, particularly in dense stands, and negatively affect the performance of object detection frameworks such as Mask R-CNN and YOLO-based models [
38]. Yao et al. [
32] addressed this issue by incorporating DSM layers, which helped reduce the misclassification of overlapping crowns. Another underexplored yet promising avenue lies in the integration of multispectral data. While models trained solely on RGB imagery can achieve satisfactory results, especially when combined with segmentation algorithms and vegetation indices (VIs), the fusion of spectral, structural, and contextual features could further enhance model robustness and transferability. Allen et al. [
39] demonstrated that RGB-based monitoring can yield high predictive accuracy when supported by VIs, confirming its potential for low-cost applications. Nevertheless, other studies [
20,
21], underscored the added value of incorporating multispectral or contextual information for improving classification performance under variable conditions [
40].
Addressing these challenges will require coordinated efforts to develop annotated datasets, adopt domain adaptation strategies, and integrate spectral and spatial data sources within deep learning frameworks for forest monitoring [
41]. Building on previous research that has demonstrated the value of integrating UAV imagery and deep learning for forest monitoring, this work focuses on the specific application of these methods to
Pinus pinaster stands. It addresses two key research questions: (i) Can Mask R-CNN accurately detect fallen trees in post-storm conditions using UAV imagery? (ii) Is it possible to identify individual young trees in recently planted
Pinus pinaster stands using multispectral UAV data? By addressing these questions, the study aims to contribute to the development of automated, scalable tools to support forest monitoring, post-disturbance assessment, and restoration planning in Mediterranean pine-dominated landscapes.
2. Materials and Methods
2.1. Study Area
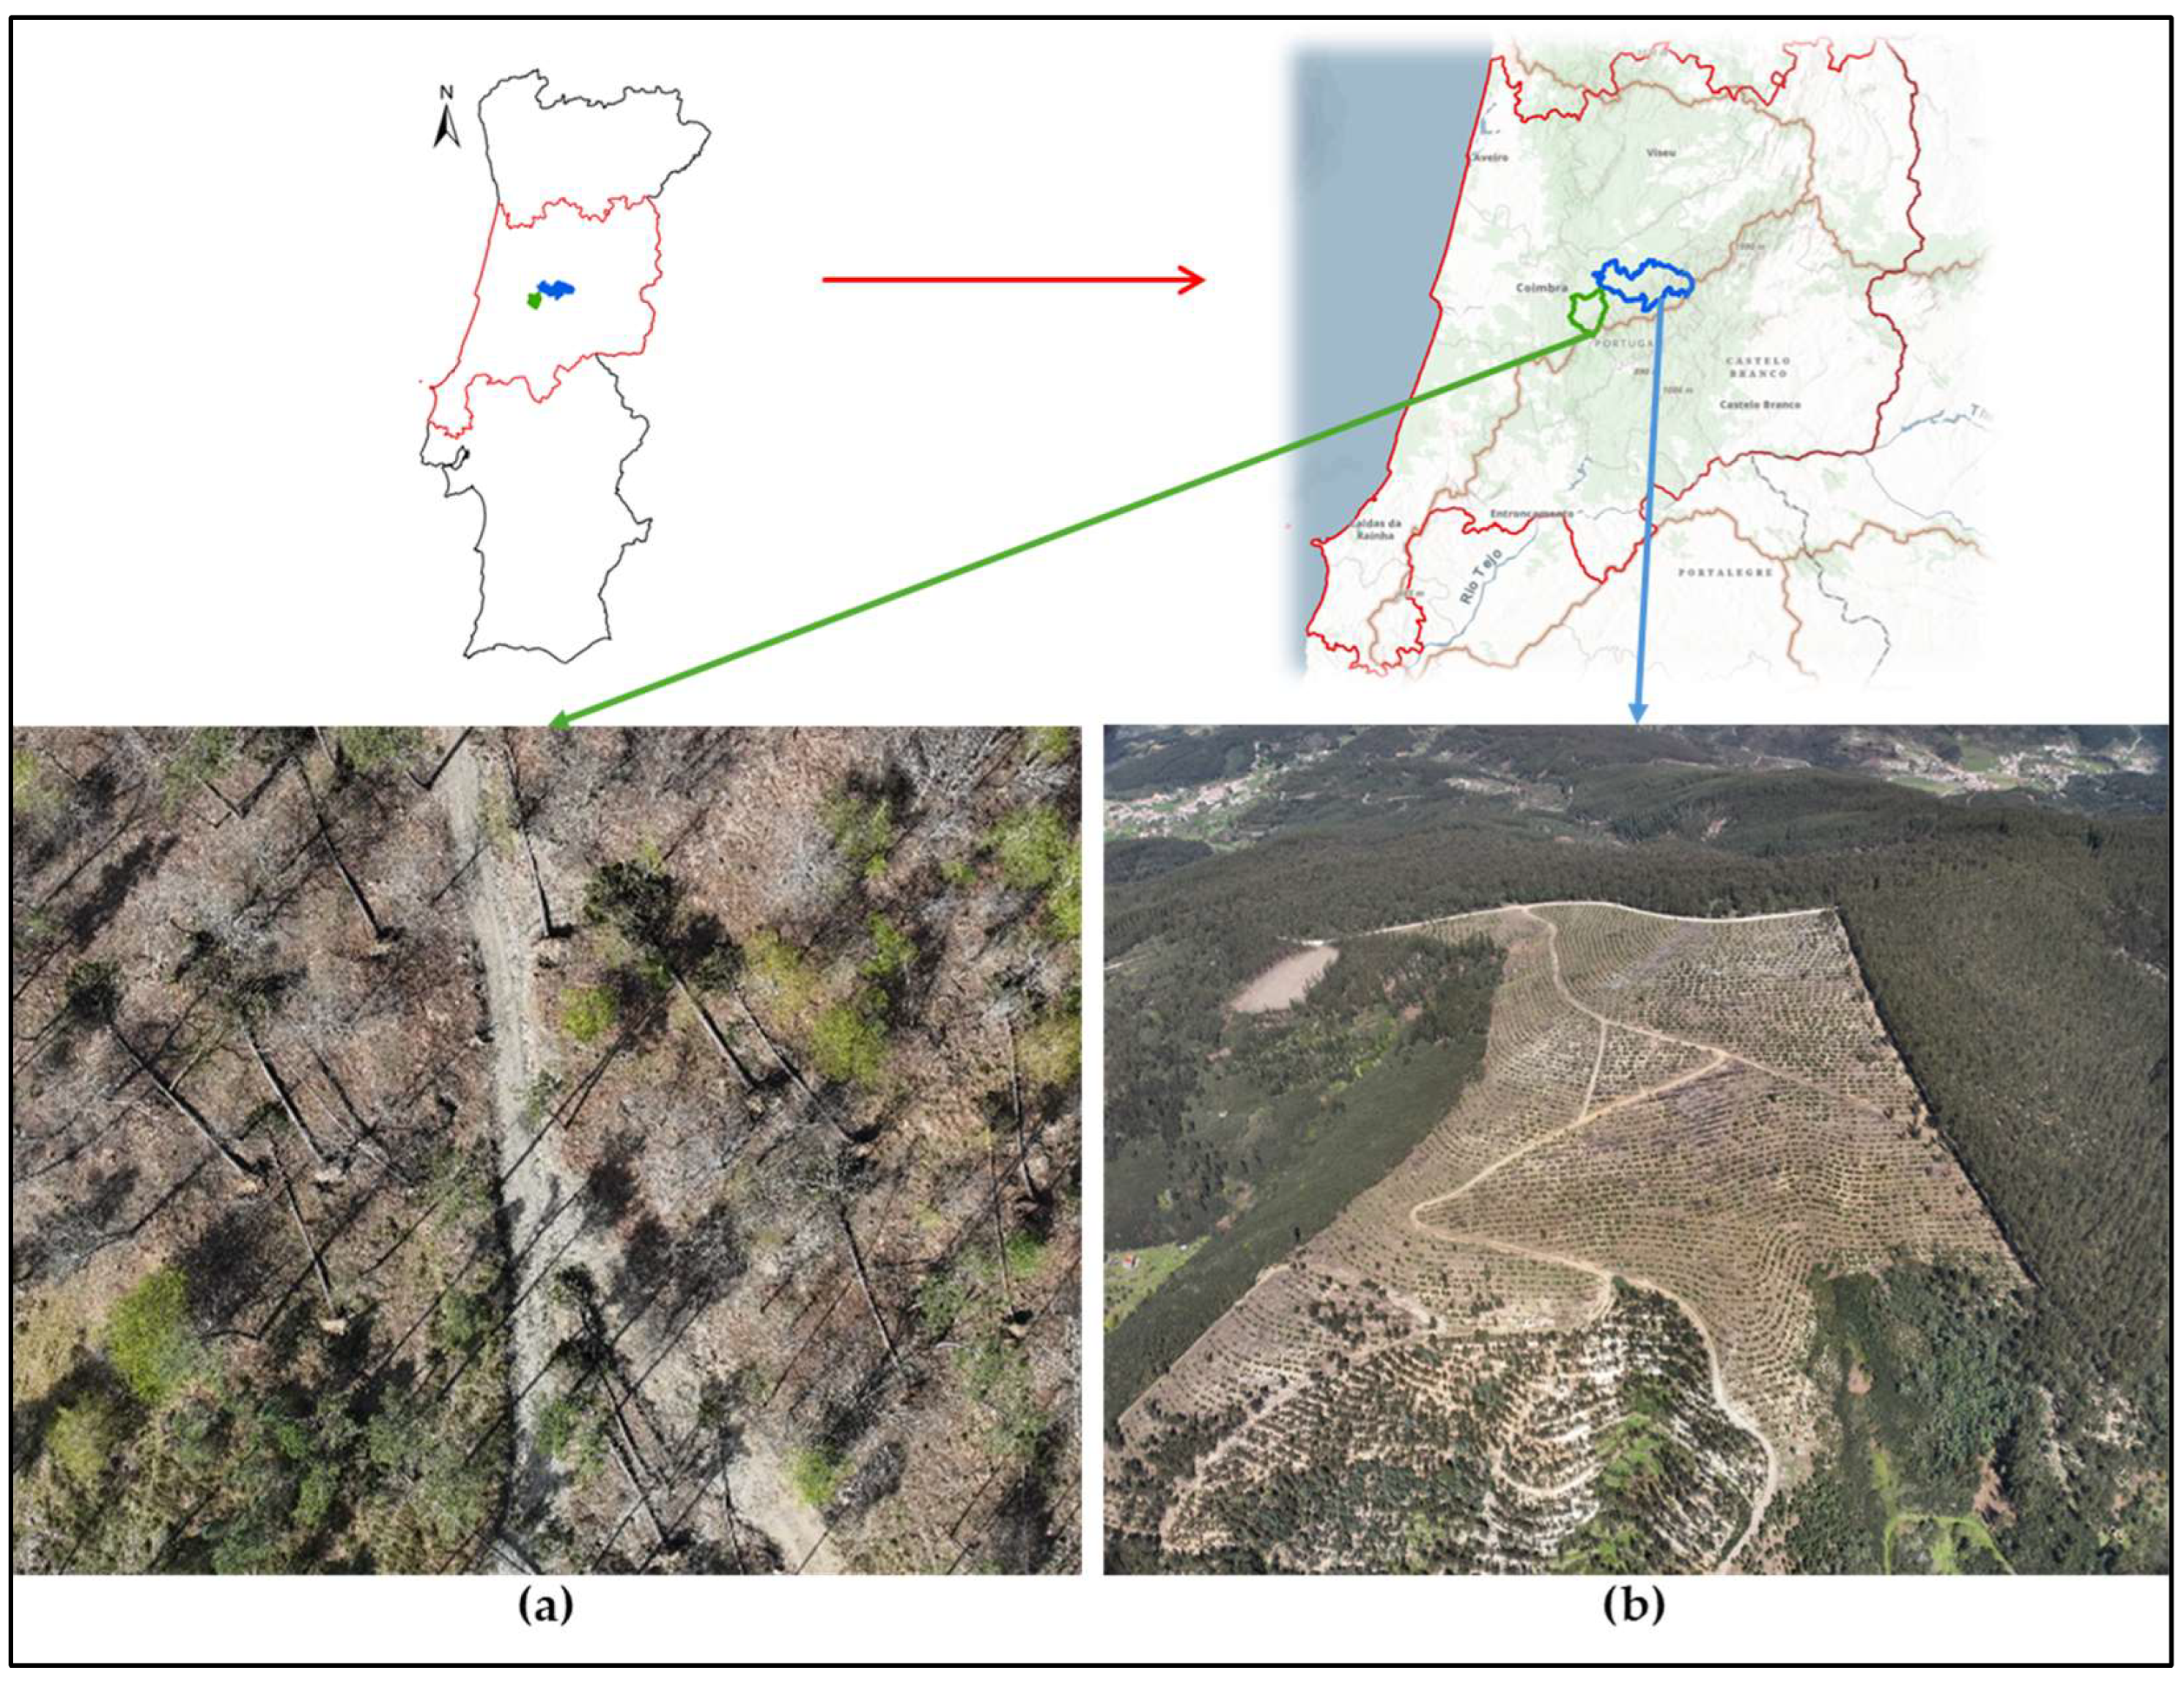
This study was conducted in two pilot sites located in central Portugal (
Figure 1), both integrated in the Transform Agenda Project under the Better Forests Program, which aims to promote climate-resilient forest landscapes. The selected study areas included mixed stands dominated by
Pinus pinaster, either mature or recently planted, allowing for the evaluation of two distinct forest monitoring challenges: detection of fallen trees following an extreme weather event, and identification of plantation gaps in early-stage forest regeneration.
In Serra da Lousã, the focus was on detecting windthrown trees caused by storm Martinho (March 2025) in a mature stand composed primarily of Pinus pinaster, with presence of Castanea sativa, Pseudotsuga menziesii and Quercus robur. This stand is part of forest area established and managed by the Portuguese Forest Service (ICNF), characterized by a transition from monocultures to more structurally and ecologically diverse forests. The second site, located in Serra do Açor (municipality of Arganil), includes over 2500 hectares of community-managed land undergoing ecological restoration after the 2017 wildfires. The selected stand served as a case study for detecting trees in a newly established plantation and evaluating the spatial distribution and density of newly planted trees, particularly Pinus pinaster and Quercus robur.
2.2. Data Acquisition
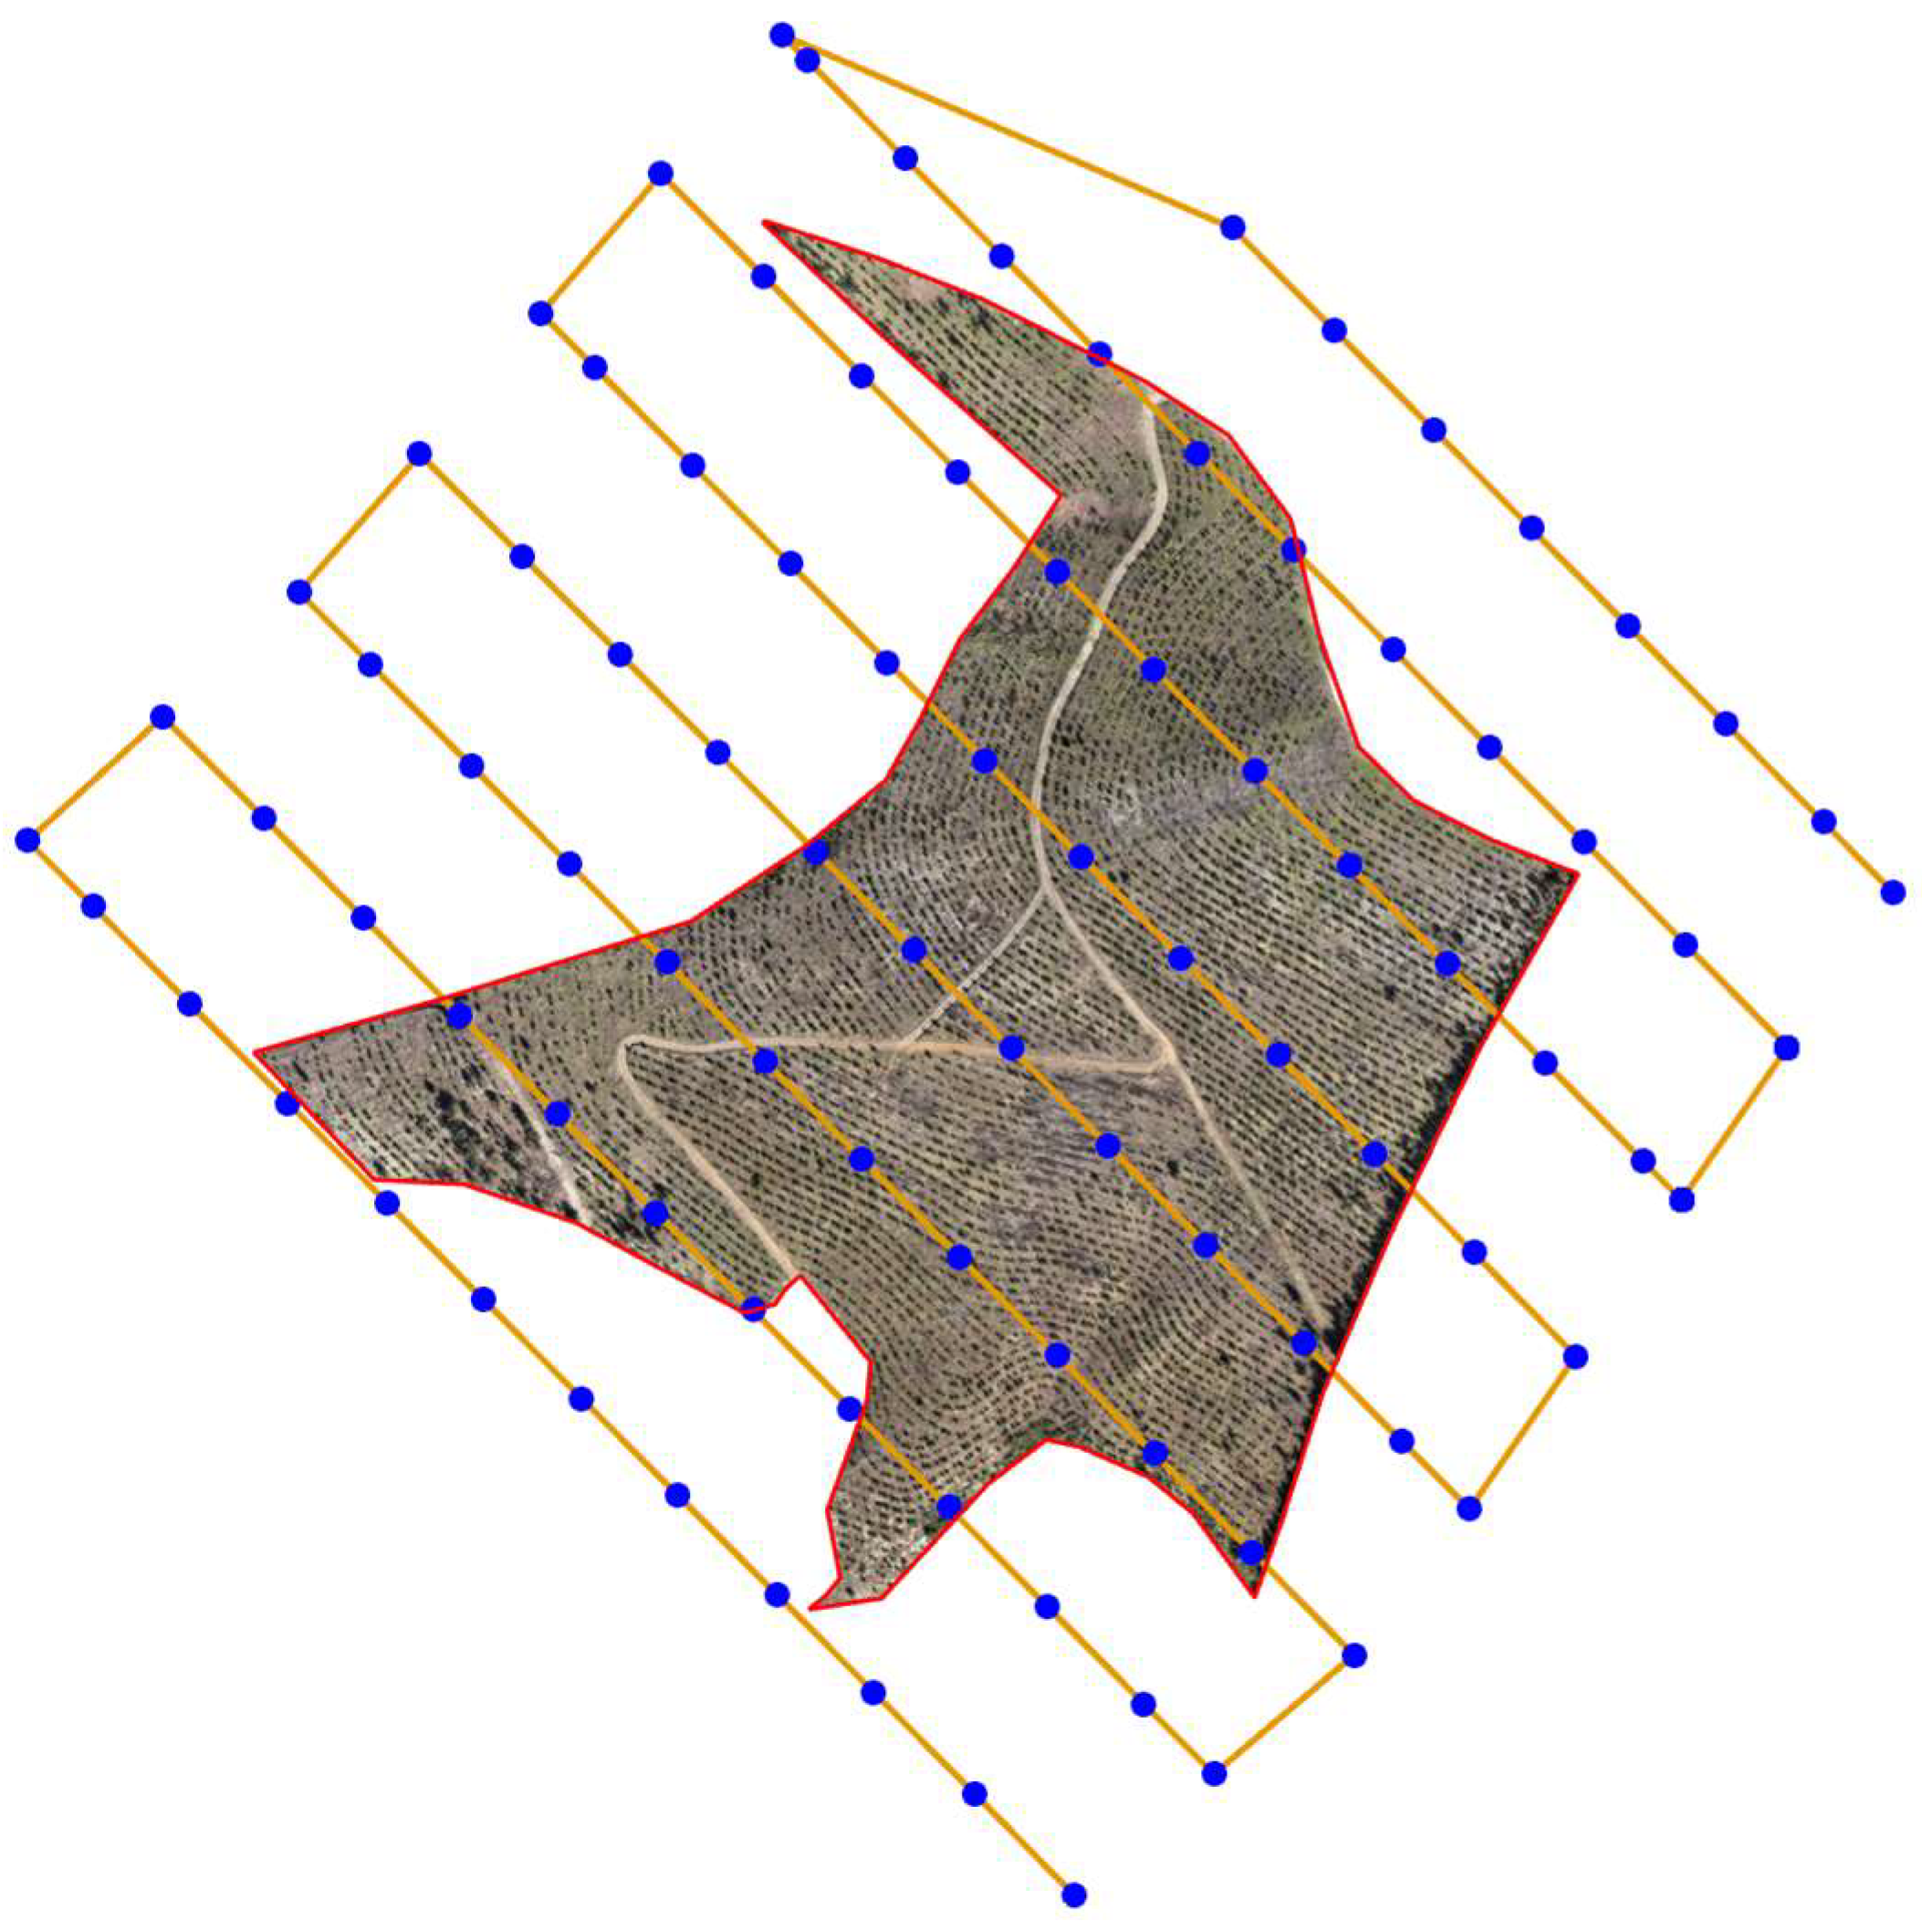
A DJI Mavic 3 M UAV (DJI, Shenzhen, China) was employed for aerial data acquisition. This drone integrates RGB and multispectral cameras, with real-time kinematic (RTK) support and multi-constellation GNSS (GPS, Galileo, BeiDou, GLONASS), ensuring high precision georeferencing (
Table 1). Before each flight, the UAV system was calibrated using its built-in GNSS and camera calibration routine, following the manufacturer’s recommended procedures to ensure geometric and radiometric accuracy.
Flight altitude and speed were selected based on operational experience in forested environments. Flying at lower altitudes can hinder orthoimage generation, especially in dense, mature canopies, due to movement of foliage and branches caused by wind. To balance image quality and coverage area while considering battery limitations, flights were conducted at 120 m (the maximum legally allowed altitude for UAVs of this type in Portugal) with relatively slow speeds. High forward and side overlap (80%) further ensured sufficient matching points between images, minimizing errors in orthomosaic generation and supporting reliable object detection.
Field data were collected to serve both georeferencing and model validation. A Spectra Precision SP60 GNSS Receiver (Spectra Geospatial, Westminster, CO, USA) and a Spectra Precision MobileMapper 50 (Spectra Geospatial, Westminster, CO, USA) device were used to acquire ground control points (GCPs) and reference tree positions. Tree biometric data, including diameter at breast height (DBH) and height, were obtained using a diameter tape and a TruPulse 200B Laser Rangefinder (Laser Technology, Inc., Centennial, CO, USA). These field measurements supported model evaluation through spatial accuracy and detection metrics.
2.3. Data Processing
All imagery was processed in ESRI Drone2Map (v2025.1) software, generating orthomosaics (
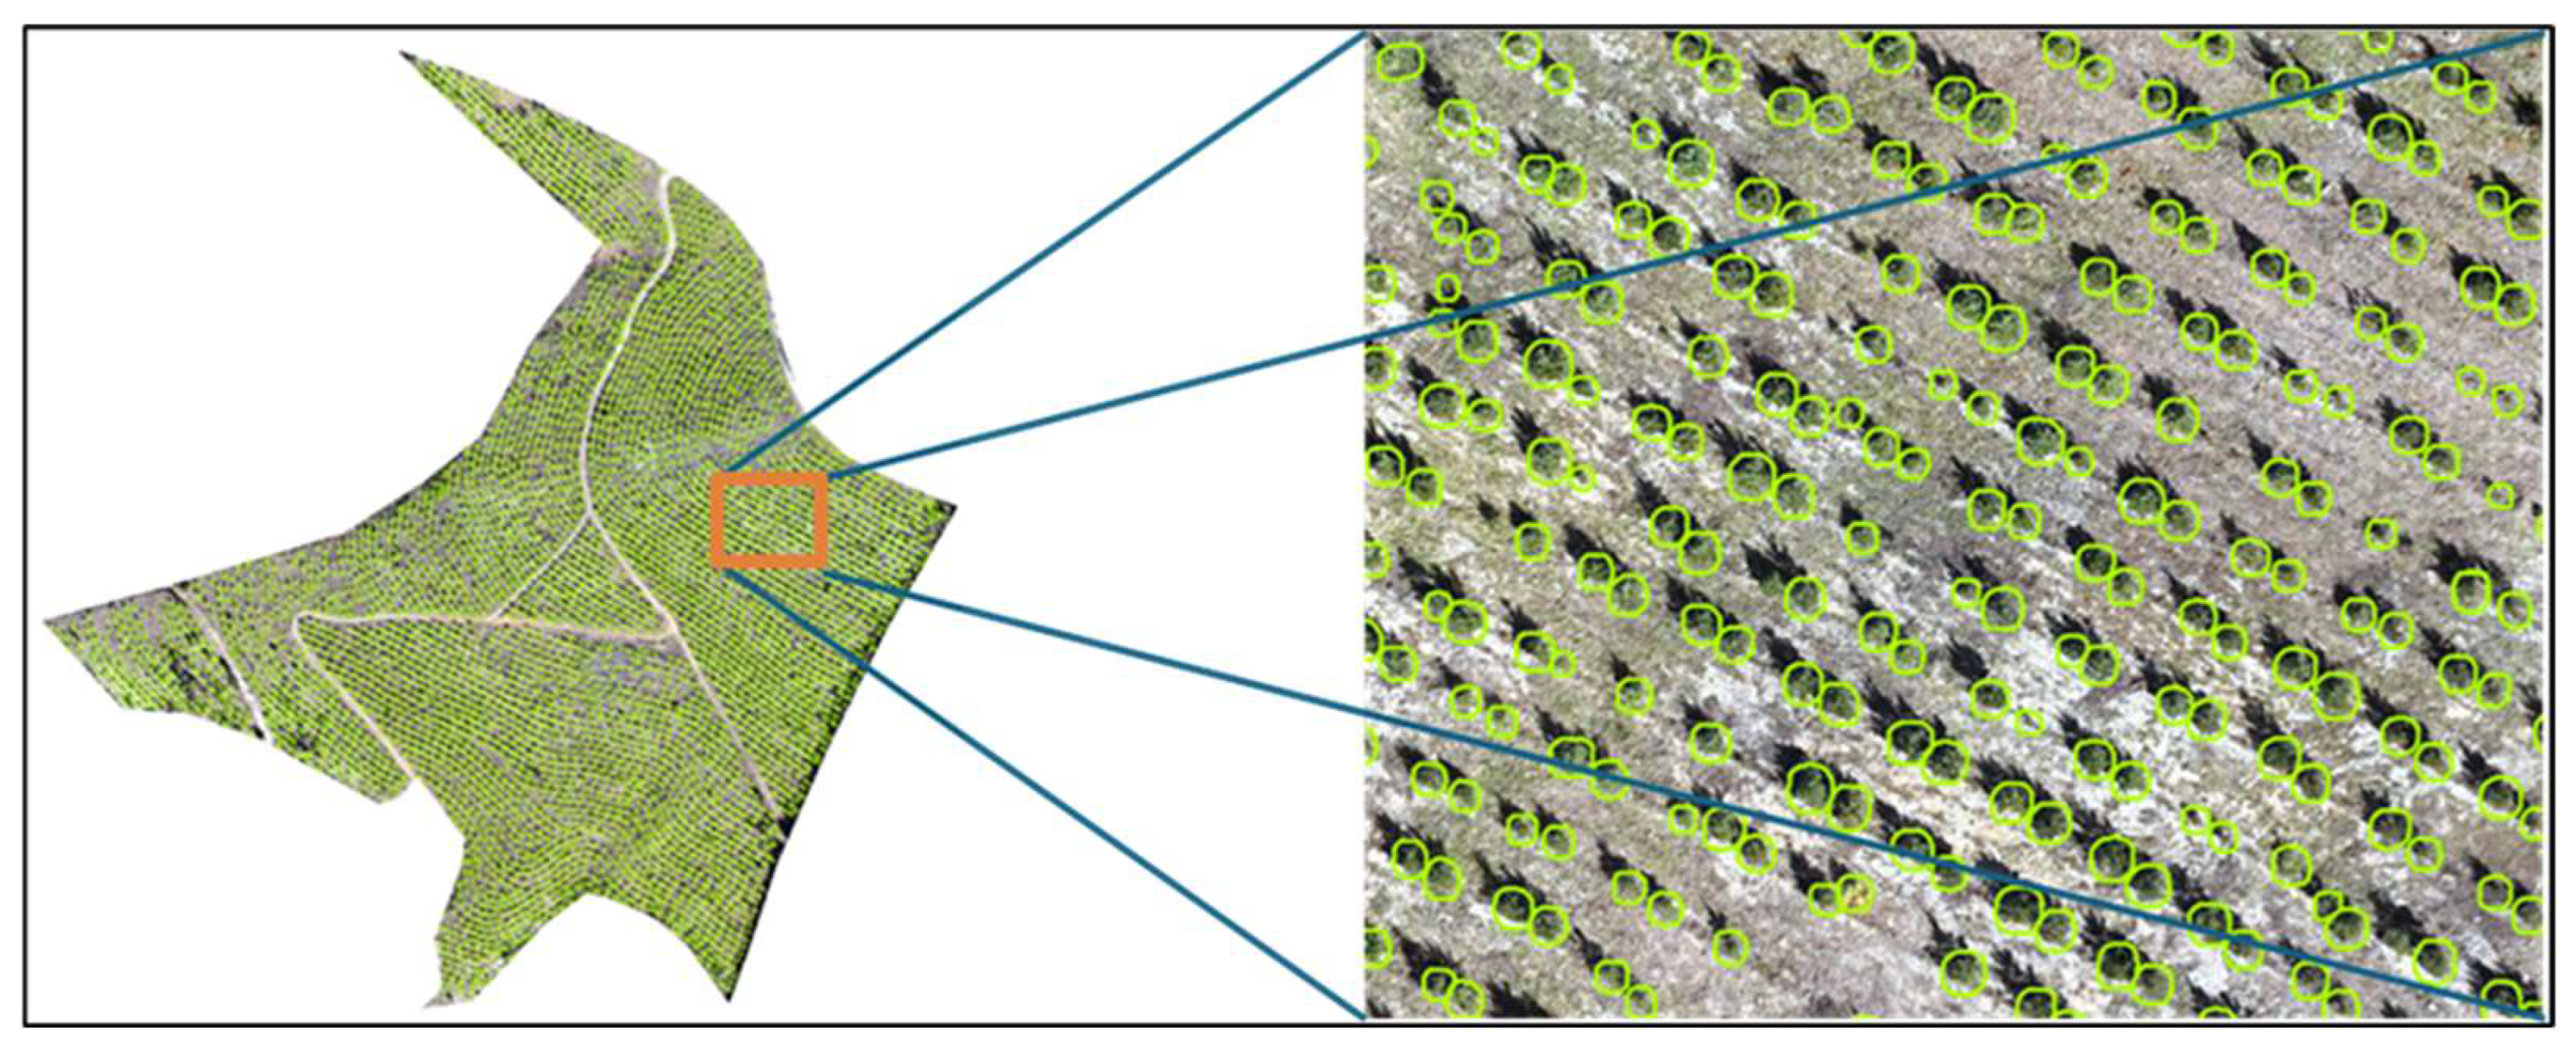
Figure 2). RTK corrections were applied during processing to improve image location accuracy. The “Initial Image Scale” and “Matching Neighbourhood” parameters were adjusted to enhance tie-point generation. GCPs were manually marked to further refine orthoimage alignment. Final products were projected to ETRS89/PT-TM06 and exported as GeoTIFFs for use in ArcGIS Pro (v3.5).
2.4. Deep Learning Workflow
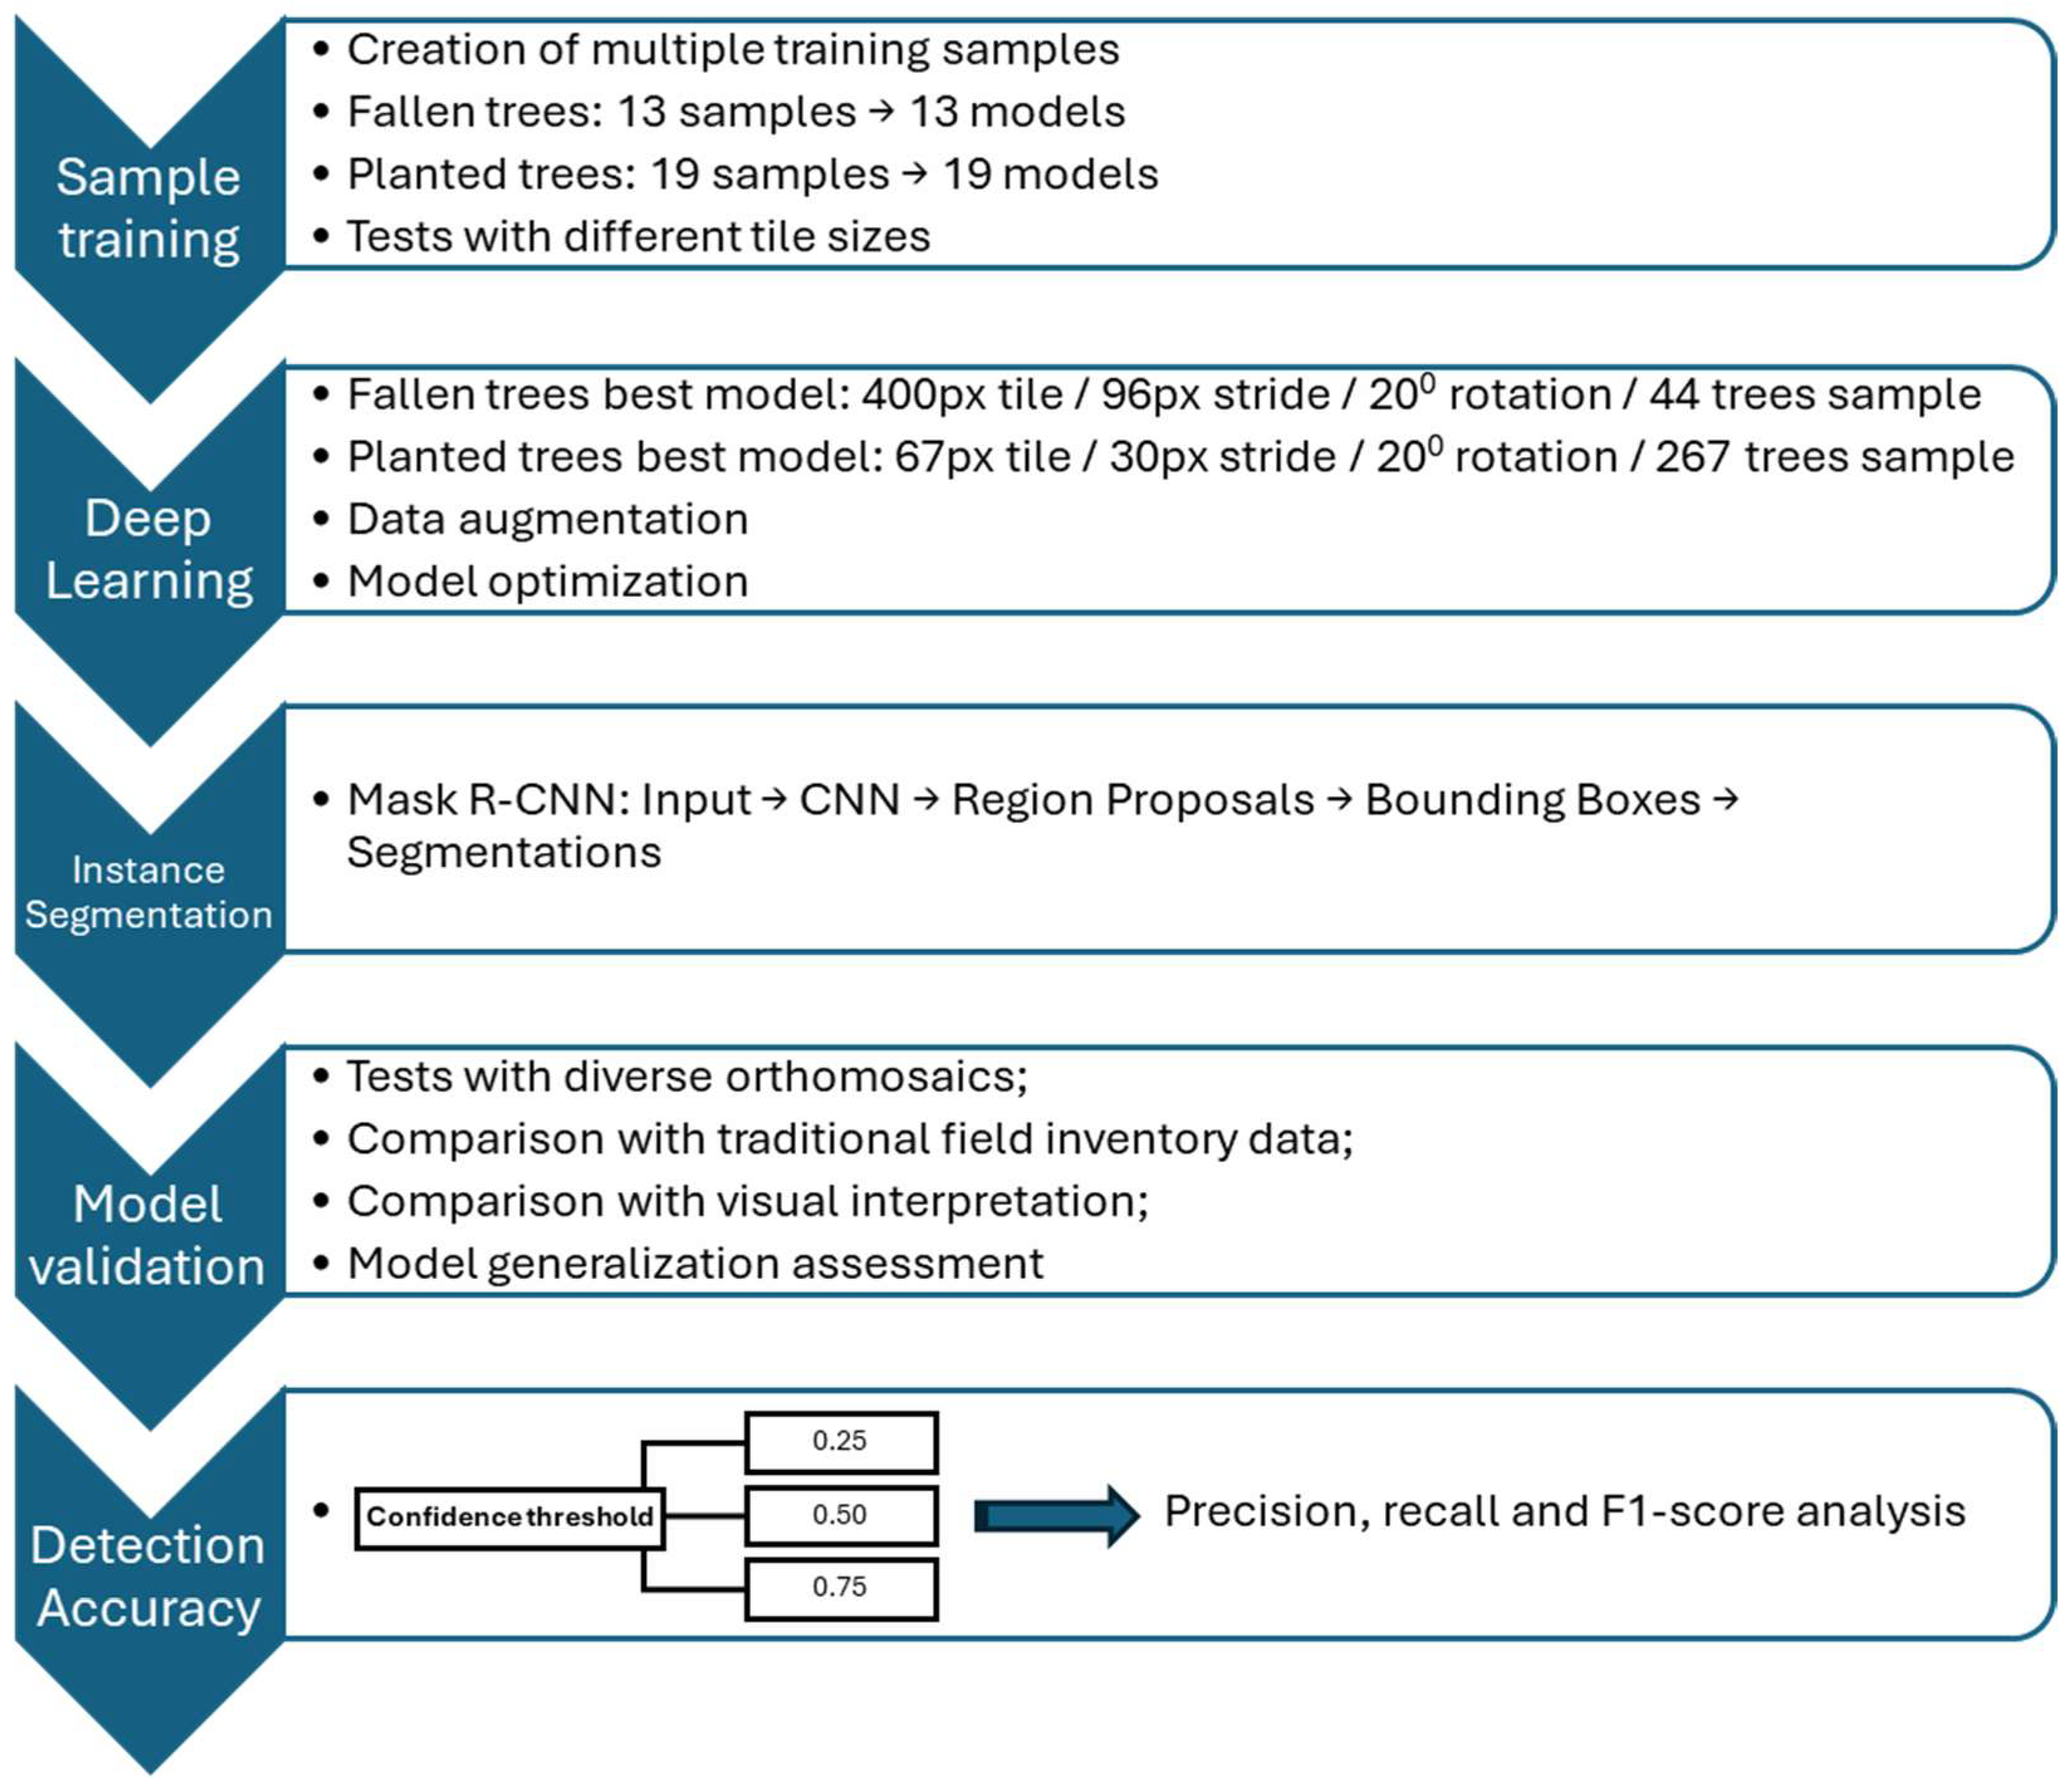
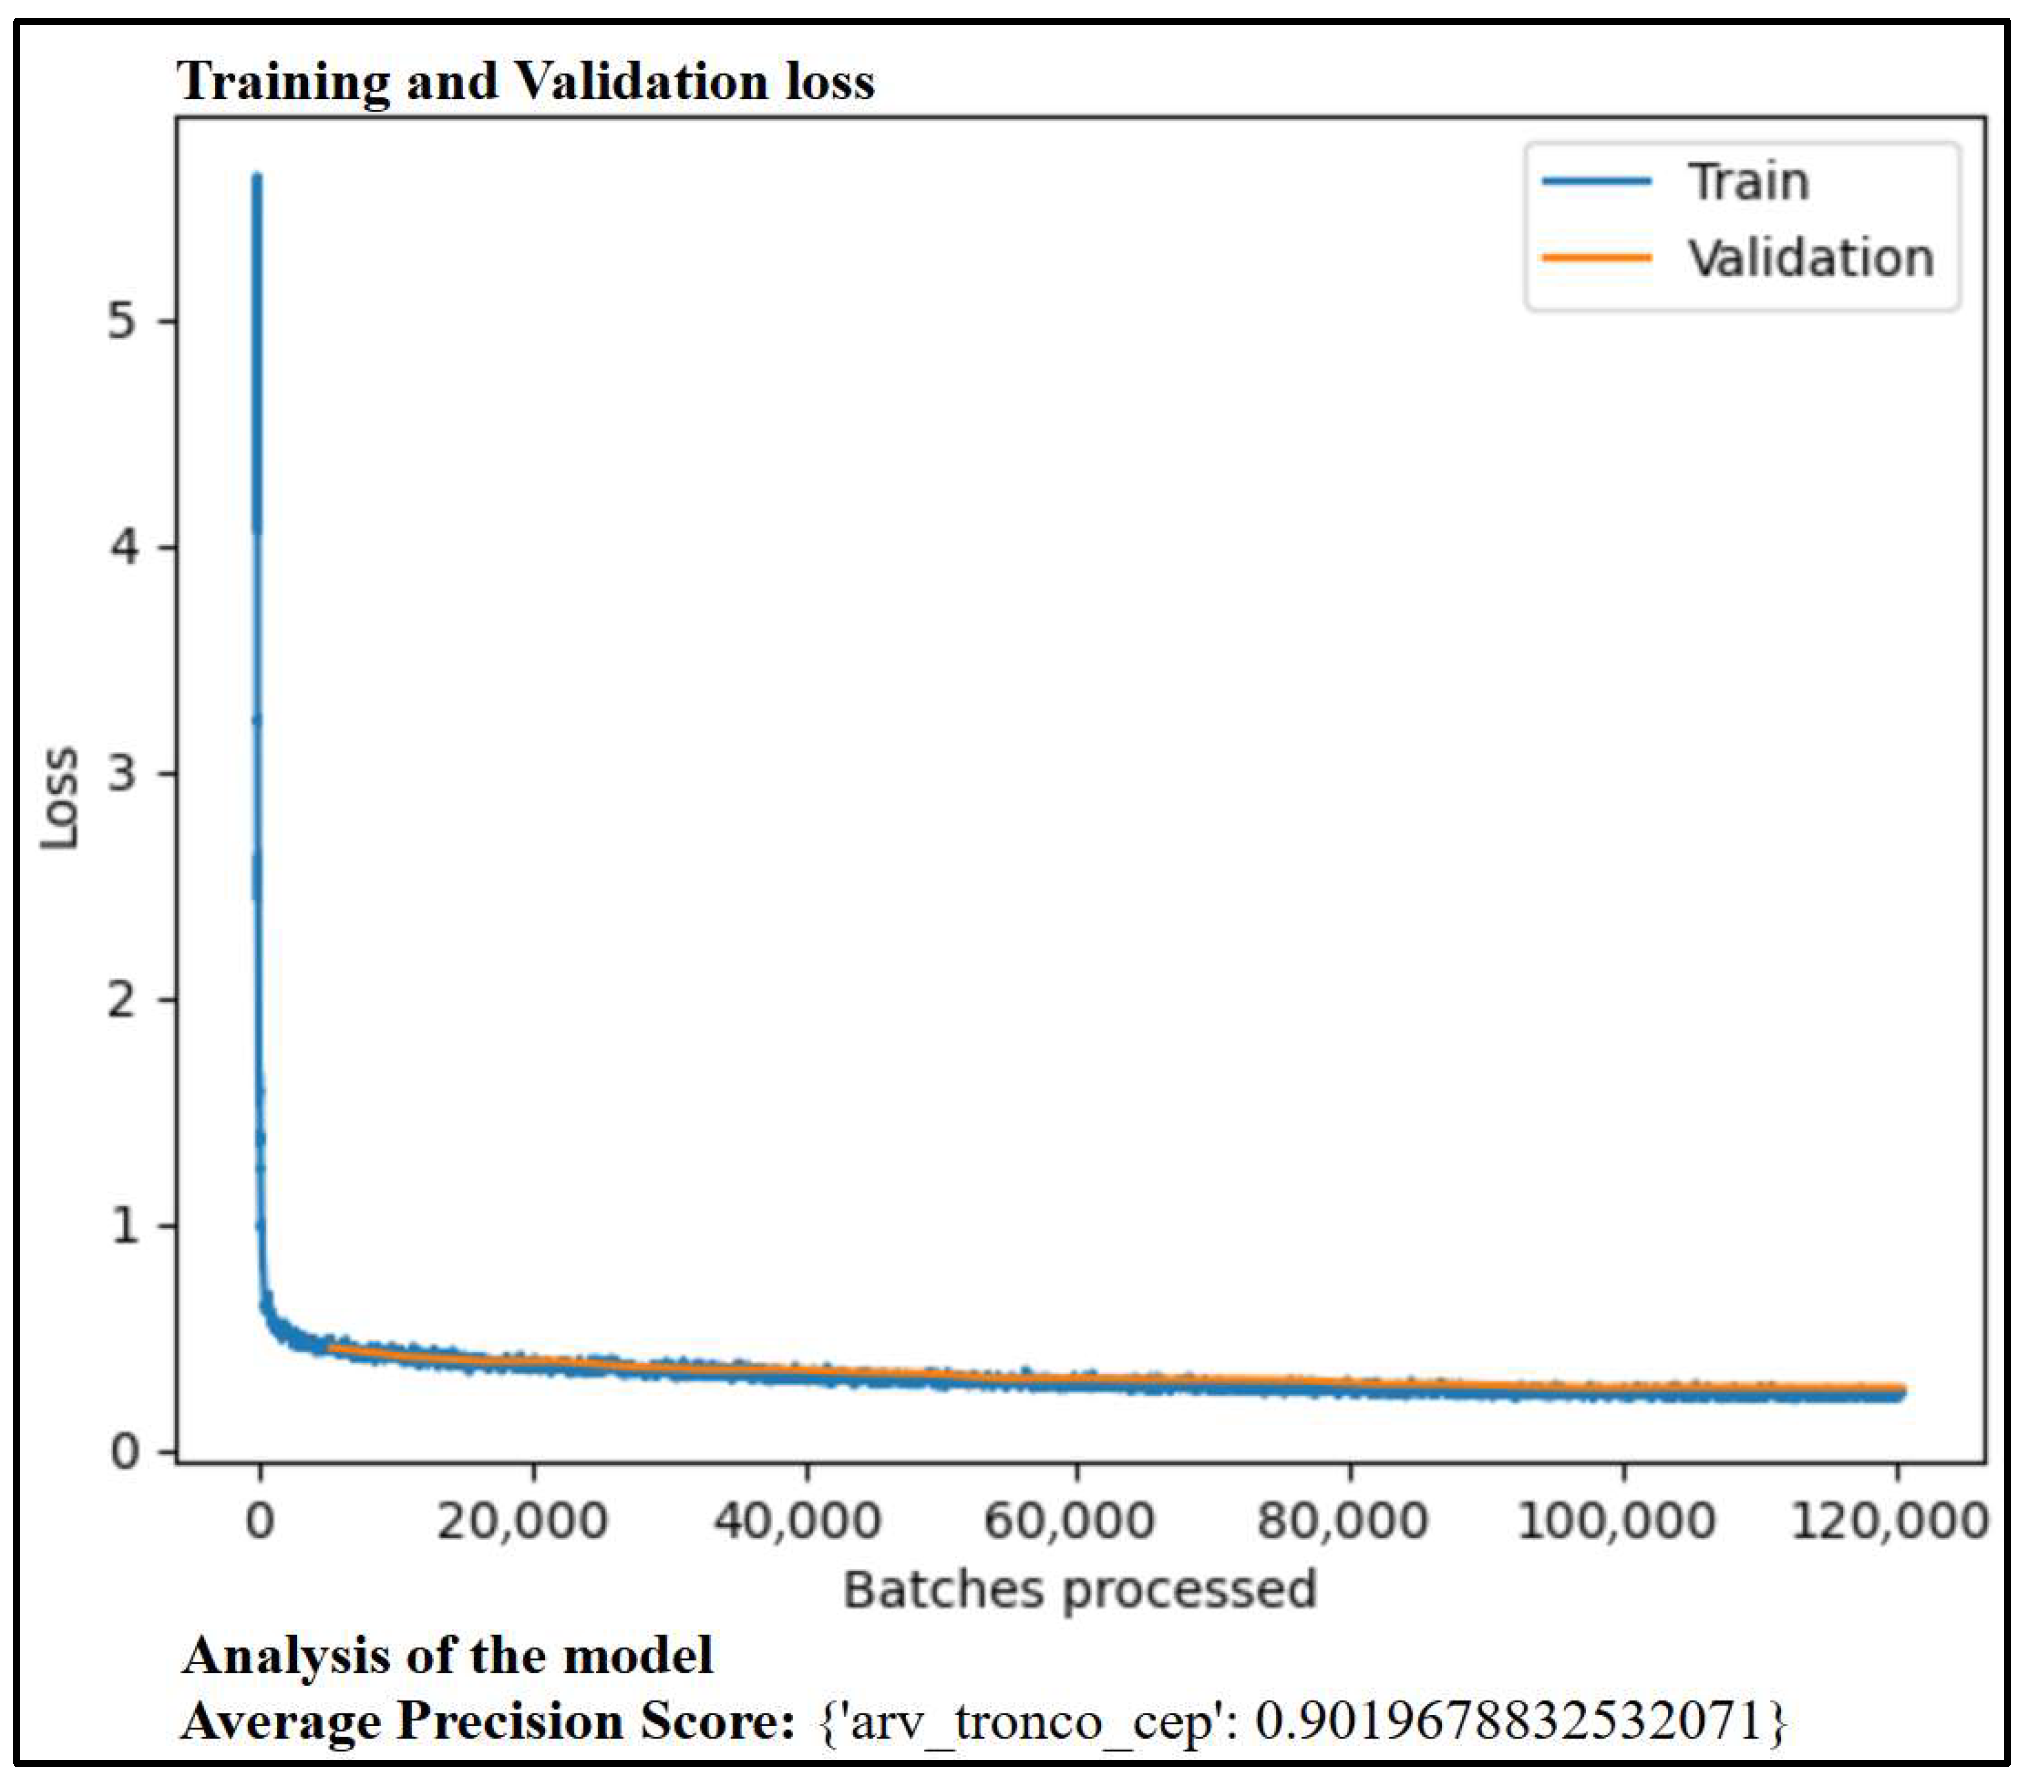
Training, validation, and testing datasets were defined to ensure both model learning and independent performance evaluation, as illustrated in
Figure 3. The deep learning workflow involved two stages: manual annotation and model training. Using ArcGIS Pro’s “Label Objects for Deep Learning” tool, objects of interest (fallen trees and planted seedlings) were delineated as polygons on orthomosaics. They were deliberately chosen to capture the natural variability of tree forms, colours, illumination conditions, and background complexity within the orthomosaics. These labelled datasets were exported with the “Export Training Data for Deep Learning” tool, which produced tiled imagery (typically 76 × 76 to 512 × 512 px) and metadata in R-CNN Masks format. These tiles formed the input for training instance segmentation models based on the Mask R-CNN architecture.
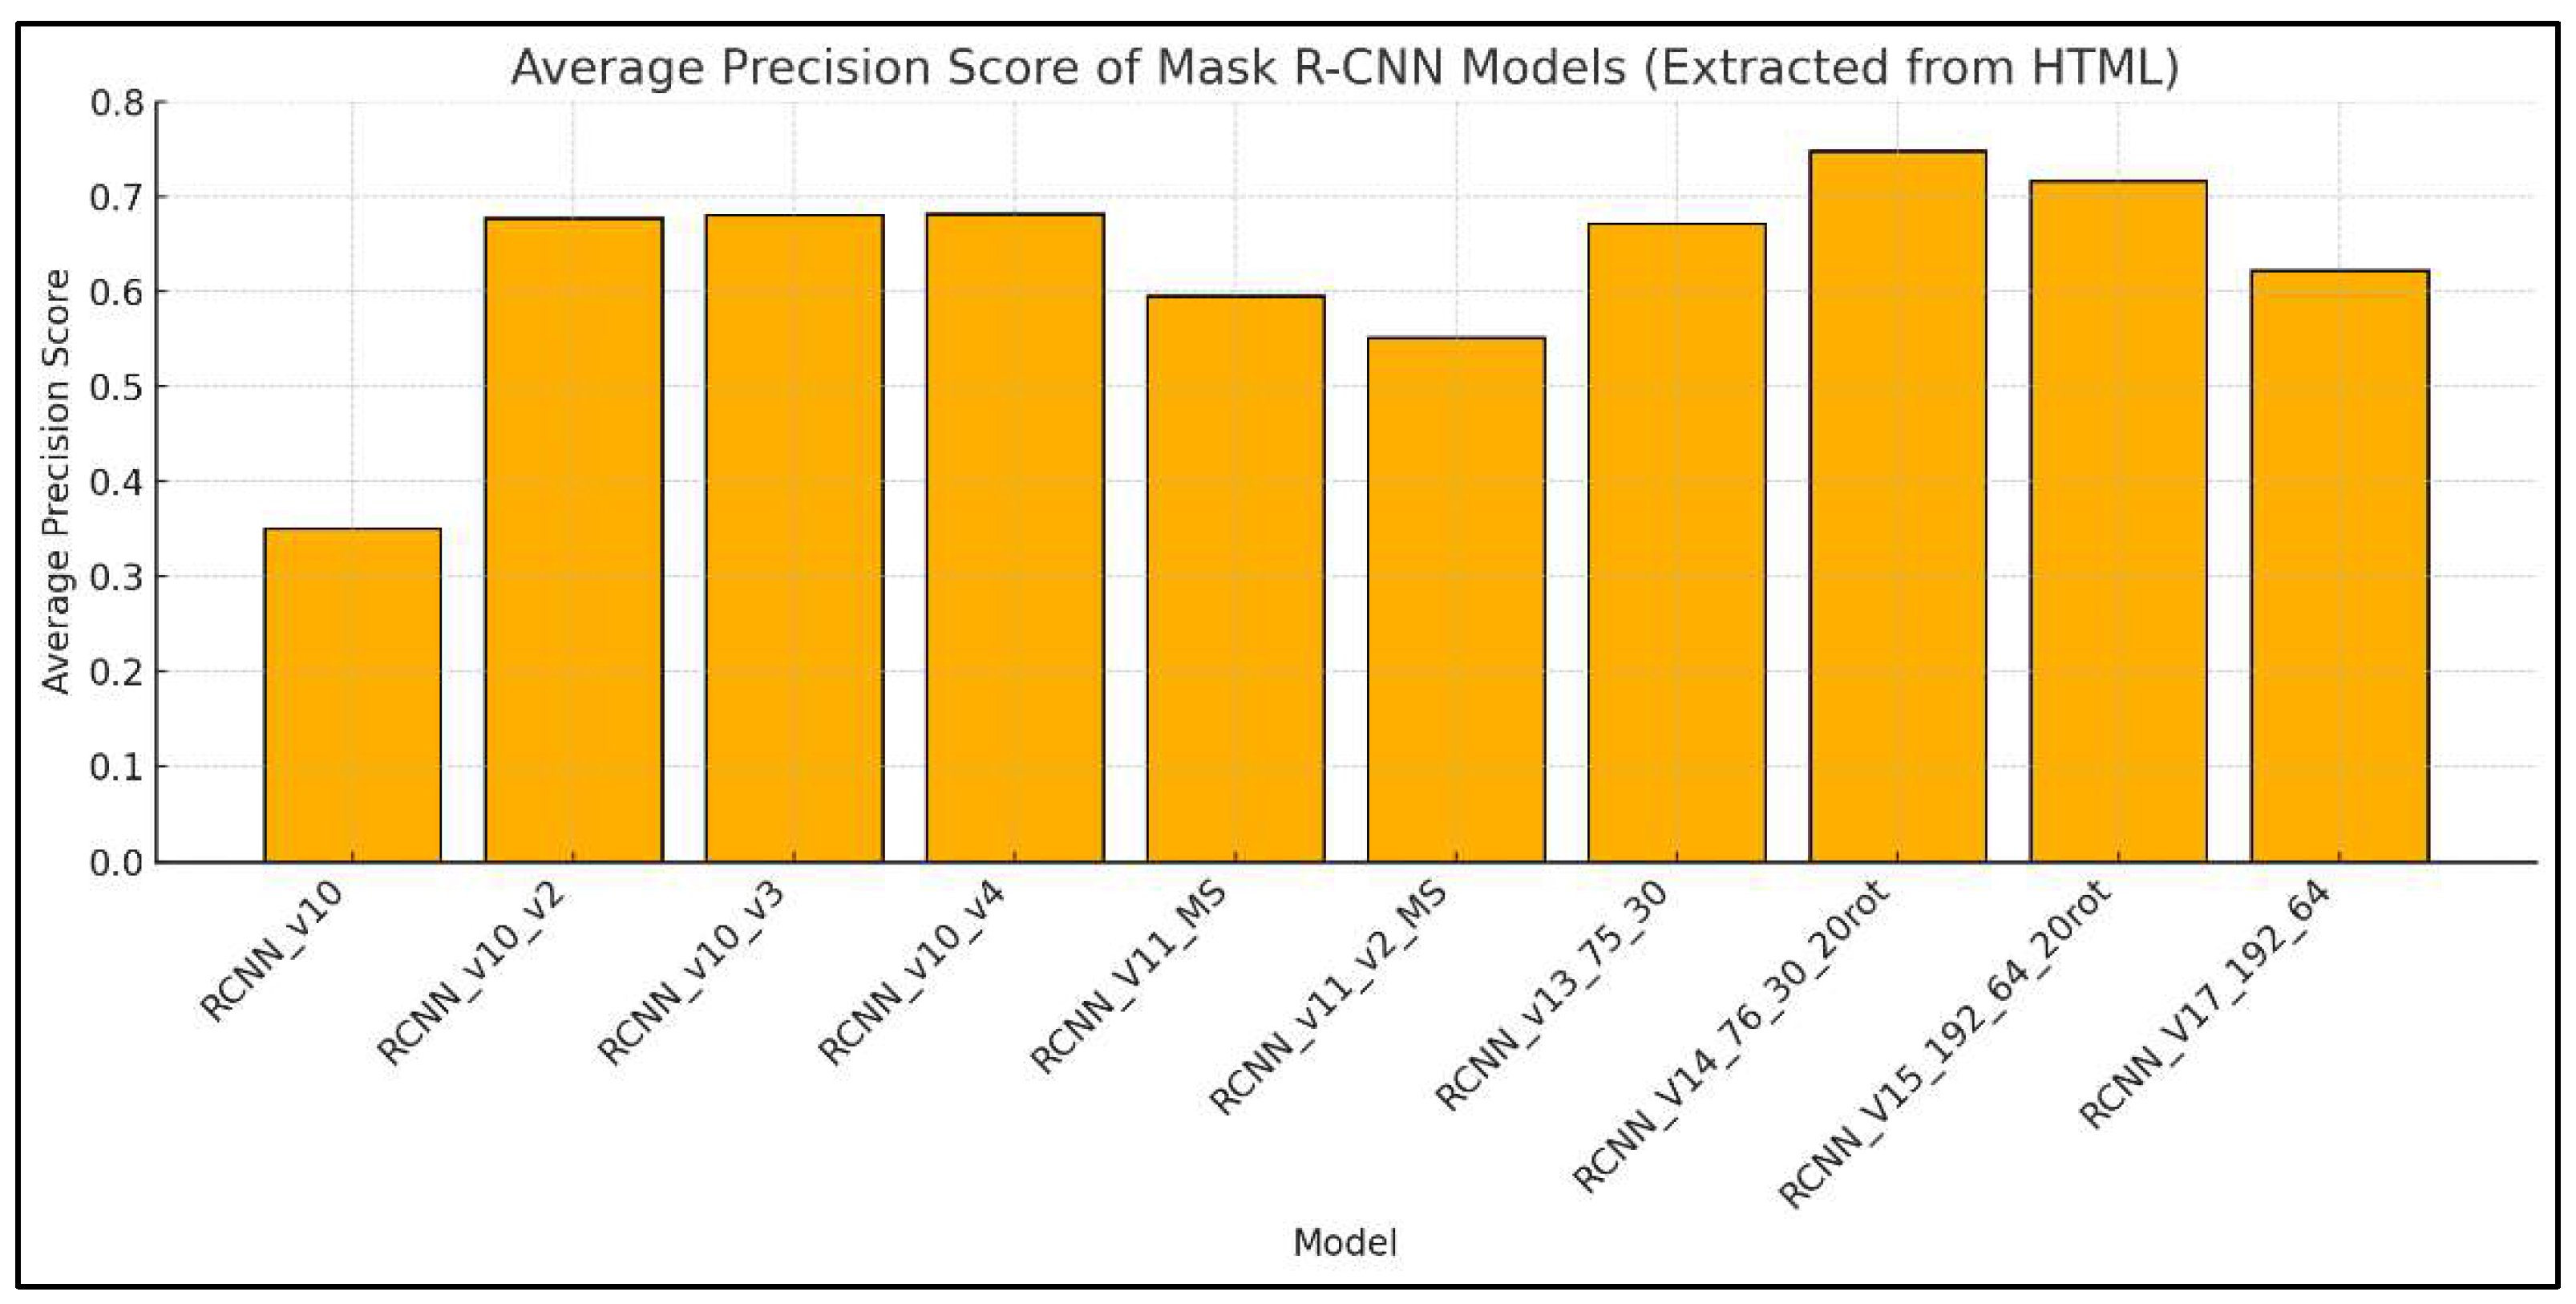
For fallen tree detection, 10 different training datasets were prepared, each including between 29 and 44 annotated trees. Over 52,300 image tiles were produced, resulting in thousands more of tree instances knowing each tile had multiple annotated instances. The datasets varied in object density (1.13 to 2.46 trees per tile) and mask size (2.30 to 24.31 units), capturing the variability in tree crown shapes, illumination, and background complexity. The most robust dataset included 24,328 tiles and 36,590 instances.
For plantation gap detection in Serra do Açor, training datasets included between 161 and 534 labelled trees per set, generating over 66,000 images and 126,000 annotated instances. The largest dataset contributed 20,006 images and 72,674 trees. Smaller sets with higher tree densities (up to 12.73 trees/tile) were also included to improve model performance in densely planted areas. Object sizes were generally small (1.31 to 2.31 units), matching the typical scale of young trees.
All models were trained using the “Train Deep Learning Model” tool in ArcGIS Pro, using a ResNet-50 backbone. The standard Mask R-CNN implementation available in ArcGIS Pro was used without any architectural modifications, as the focus of this study was on evaluating its performance across different forest conditions rather than on model development. During training, the default data augmentation settings available in ArcGIS Pro were applied, including standard transformations such as crop, dihedral_affine, brightness, contrast, and zoom. This procedure helped to improve the model’s generalization ability by exposing it to a wider range of illumination and spectral conditions, effectively mitigating issues related to shadows, variable lighting, and other image inconsistencies. Model performance was evaluated through training/validation loss curves and average precision (AP) scores. The trained models were then applied to the full orthomosaics using the “Detect Objects Using Deep Learning” tool, with adjusted parameters such as confidence threshold (0.25–0.75), test-time augmentation (TTA), and non-maximum suppression (NMS) to optimize performance.
2.5. Model Validation and Performance Metrics
Ground-truth data were used to compute precision, recall, F1-score, and intersection-over-union (IoU) as shown in Equation (1), which served as the principal evaluation metric for segmentation accuracy.
where A_intersection is the overlapping area between predicted and reference masks, and A_union is the total combined area.
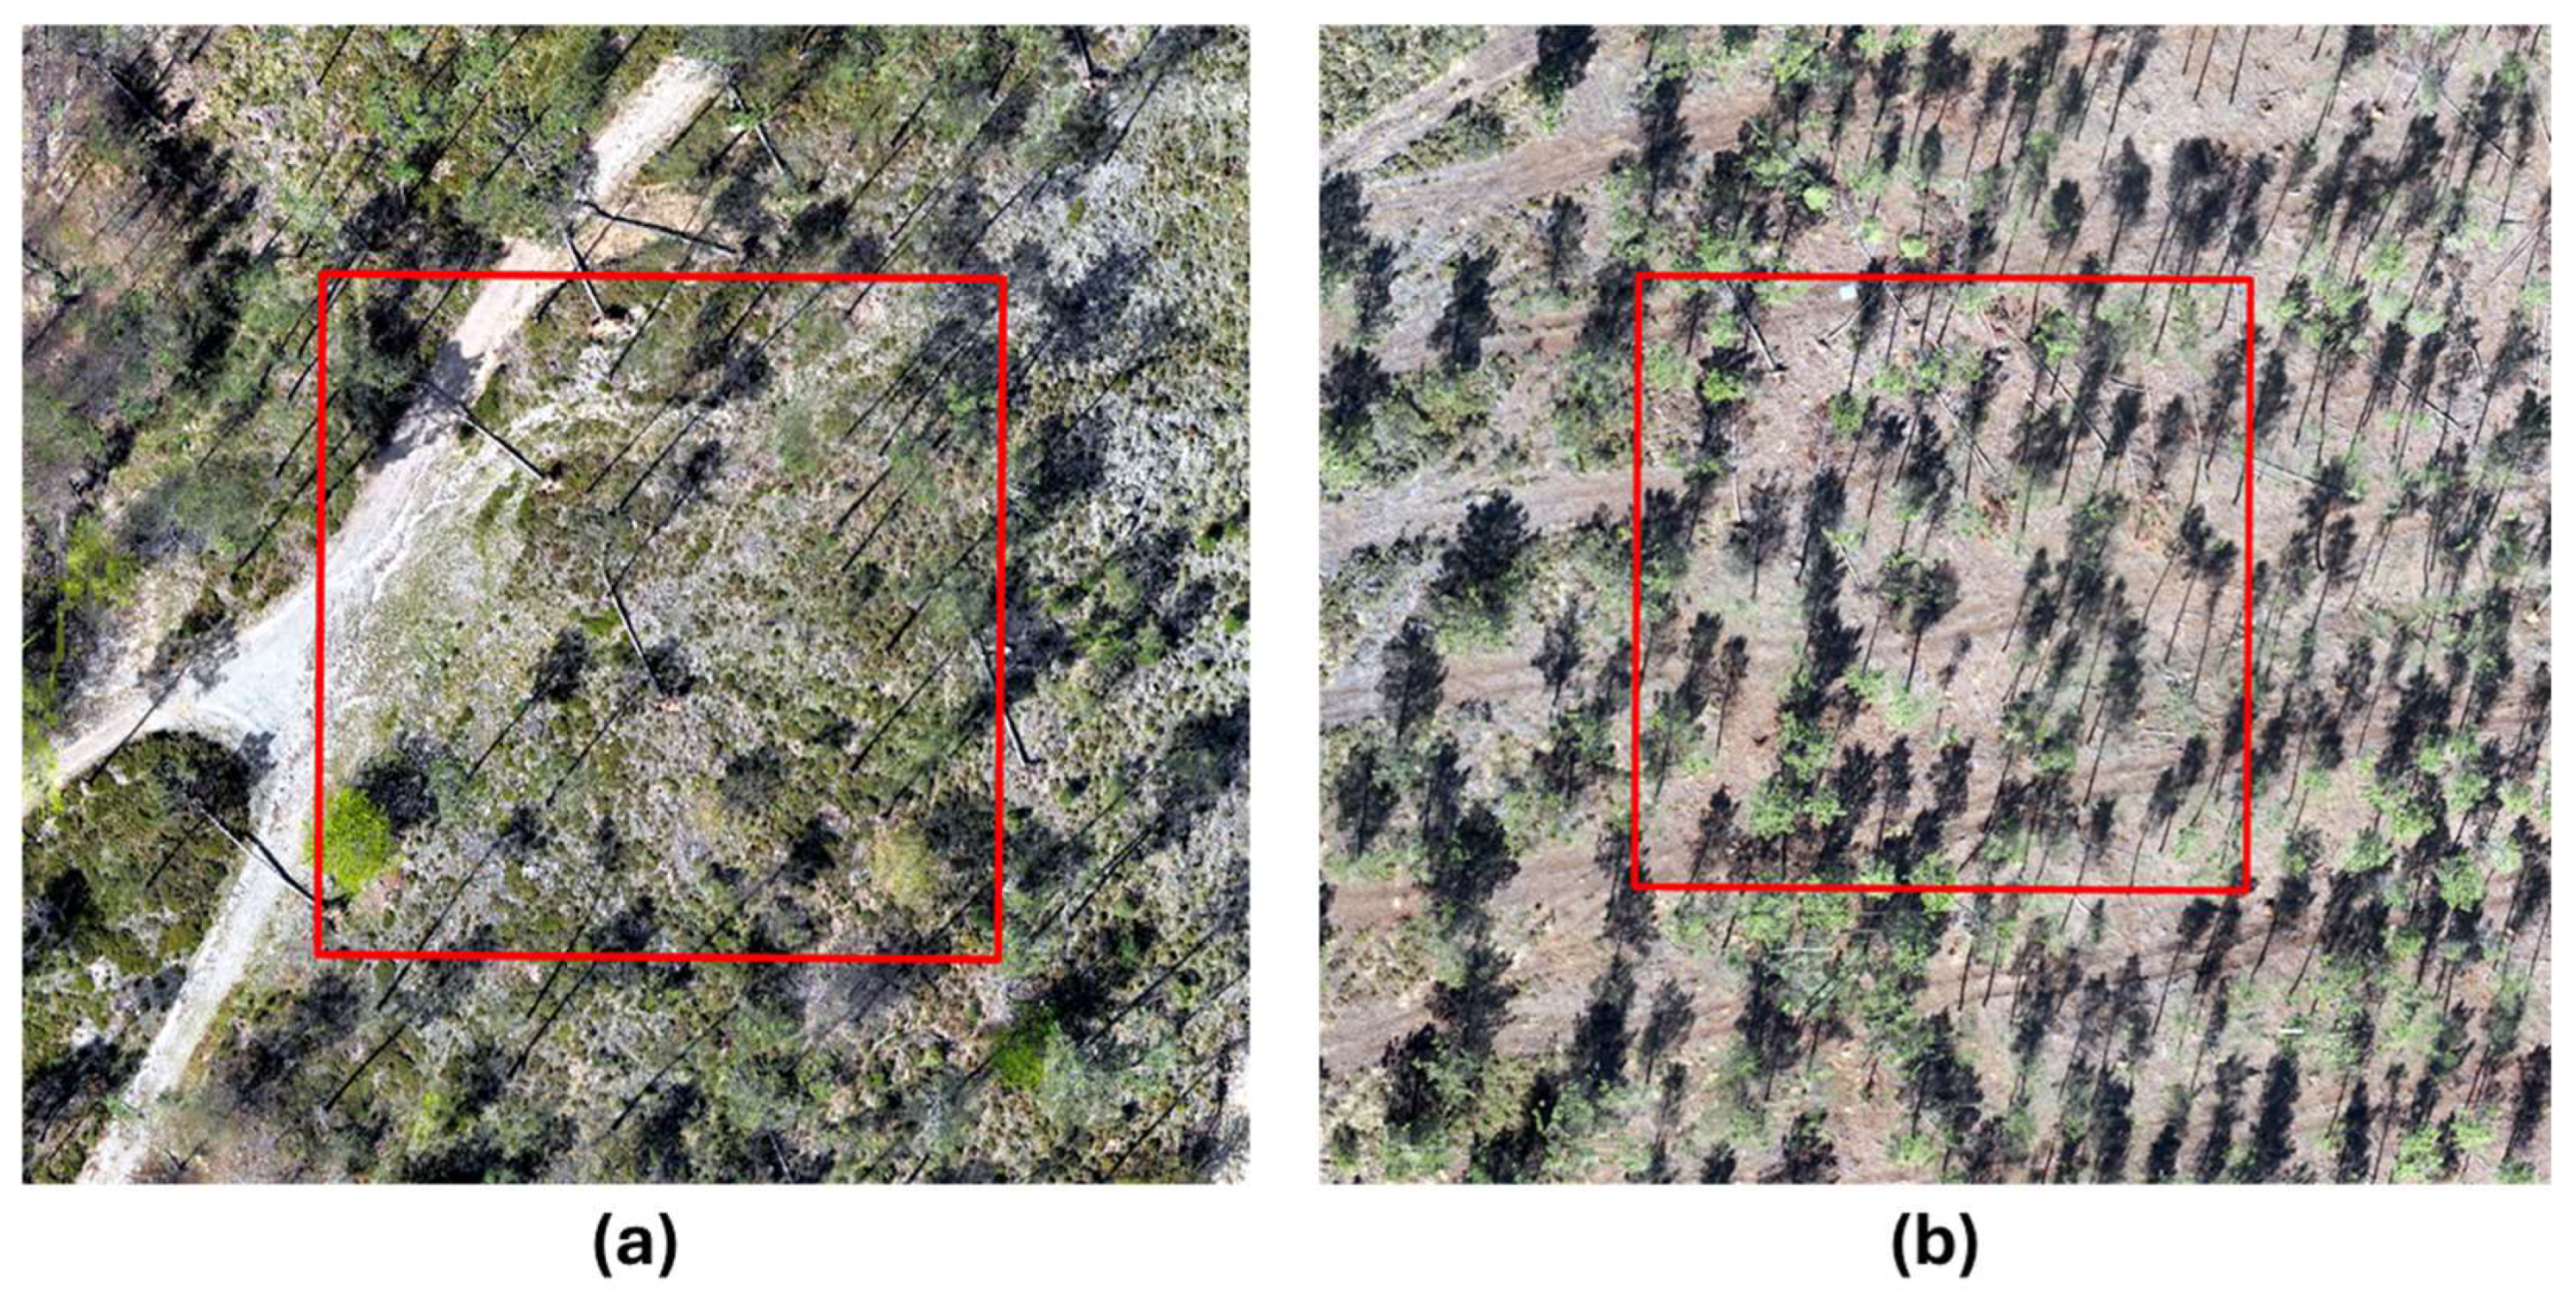
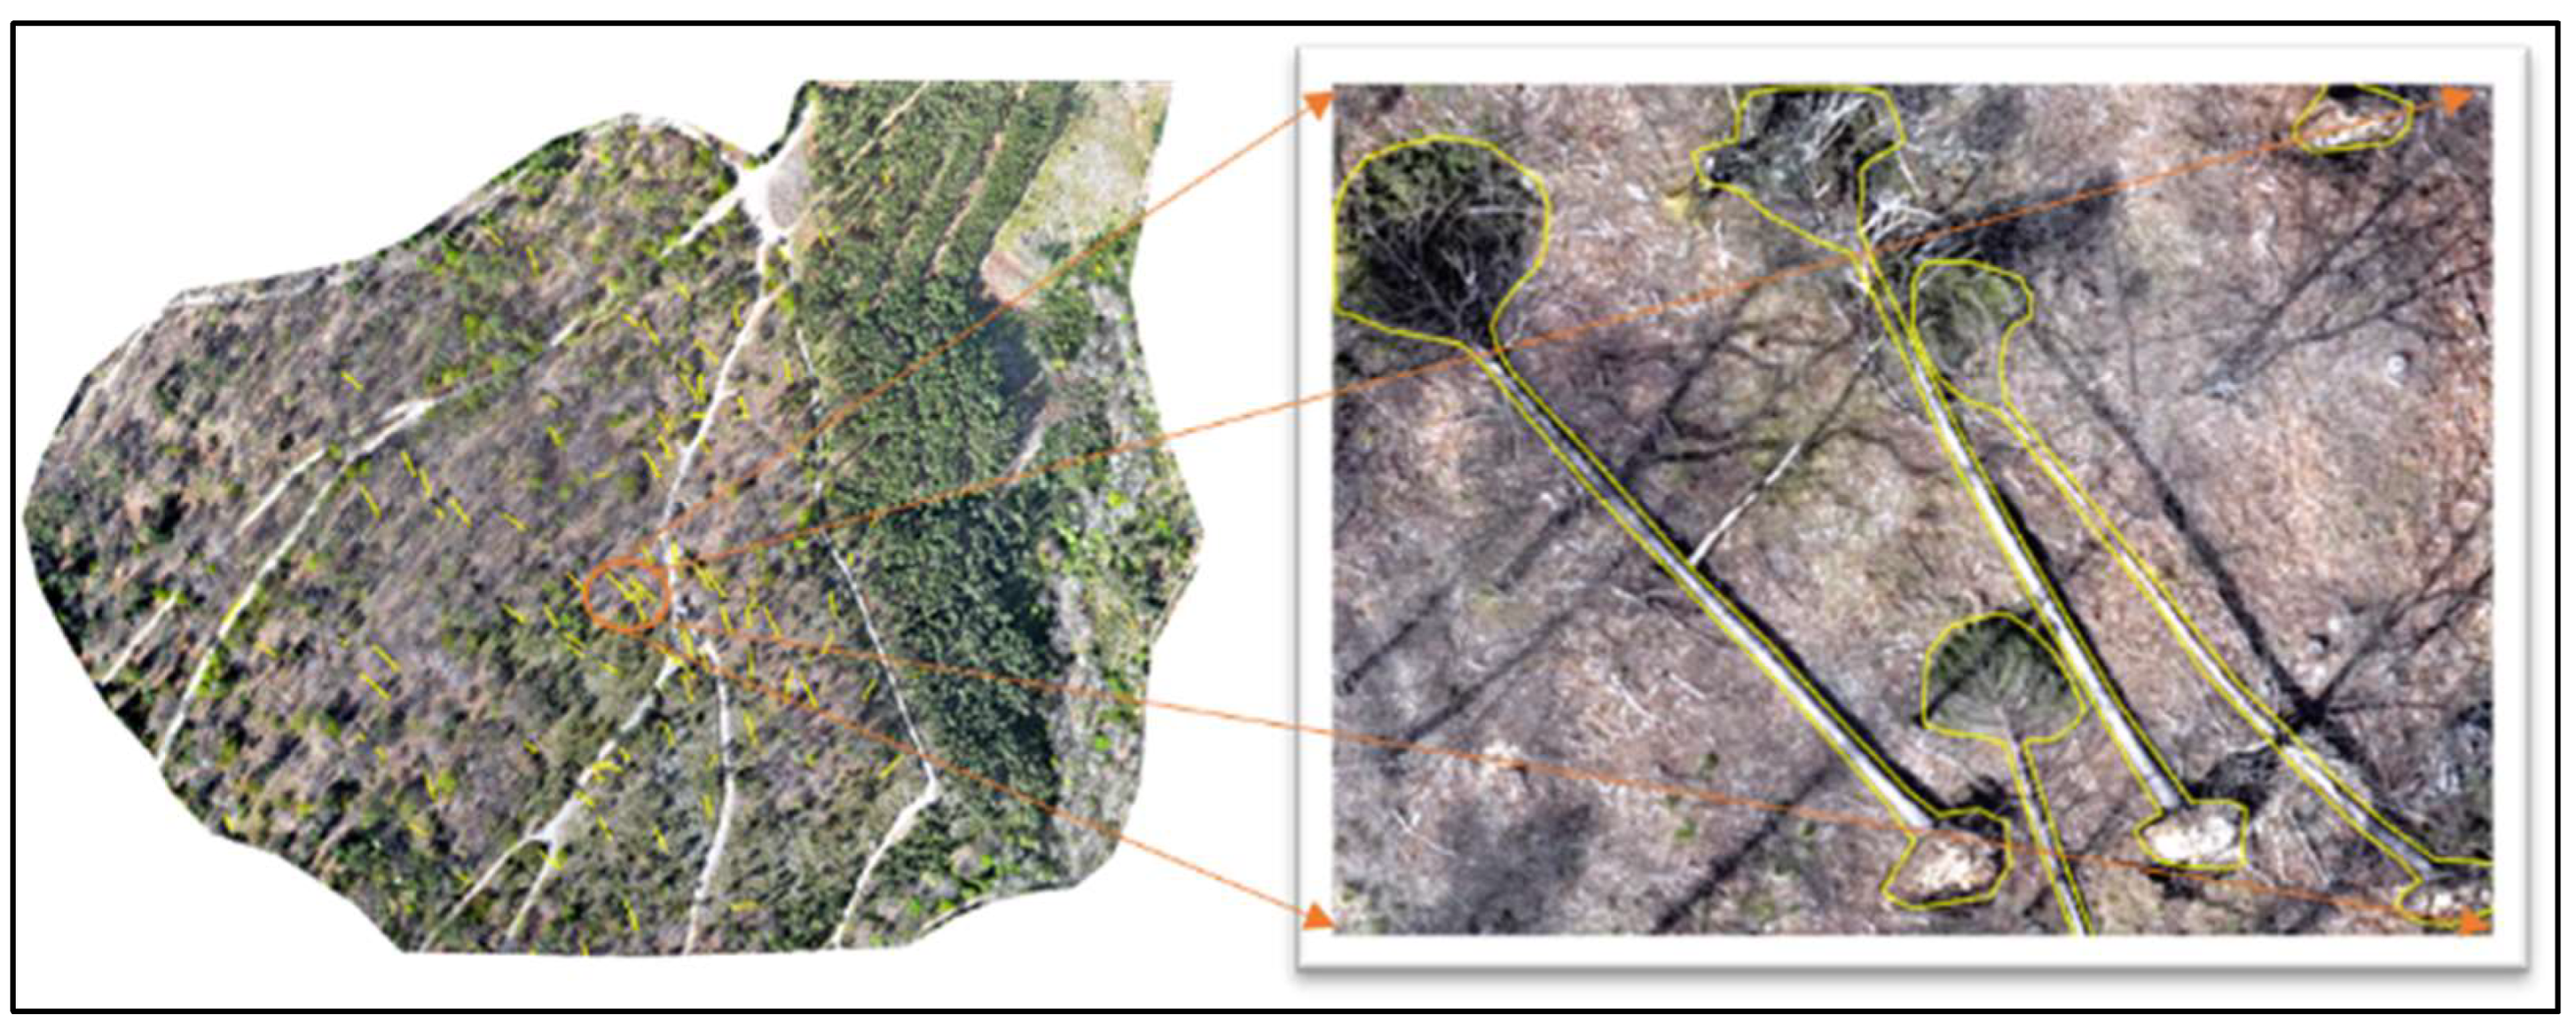
To assess the robustness and generalization ability of the models, a multi-level validation approach was implemented. Regarding the fallen trees model, validation plots (each 3600 m
2) were randomly distributed across two orthomosaics: one corresponding to the training ortho and another representing a distinct site with different environmental and imaging characteristics (
Figure 4).
These differences included variations in illumination, vegetation density, slope, and the presence of woody debris on the ground. Two validation plots were located within the training orthomosaics (total area of interest = 16.75 ha) and one within the independent orthomosaic (total area of interest = 4.14 ha). This configuration meant that approximately 4.3% of the area of interest in the training orthomosaic and 8.7% of the independent orthomosaic were used for validation, representing 5% of the total combined area. The 5% validation proportion was selected to ensure consistency with the validation approach adopted in Serra do Açor study area and to provide a compromise between spatial representativeness and computational feasibility. The chosen proportion ensured sufficient coverage of different canopy and background conditions within and beyond the training area, while keeping manual annotation manageable and consistent across datasets. The larger validation proportion in the untrained orthomosaic was intentionally adopted to better evaluate the model’s transferability to new environments. Unlike the conventional inventory approach used for the planting areas, where field validation was performed on-site, validation of the fallen tree detection model was conducted visually using the orthomosaics. This decision was based on practical constraints such as GNSS positional errors that complicated tree-to-image correspondence, limited accessibility due to steep terrain, and hazardous conditions caused by post-storm debris accumulation. Visual interpretation of the orthomosaic was deemed appropriate, as the relatively large size and distinct spectral and geometric signatures of fallen trees make them readily identifiable in high-resolution UAV imagery.
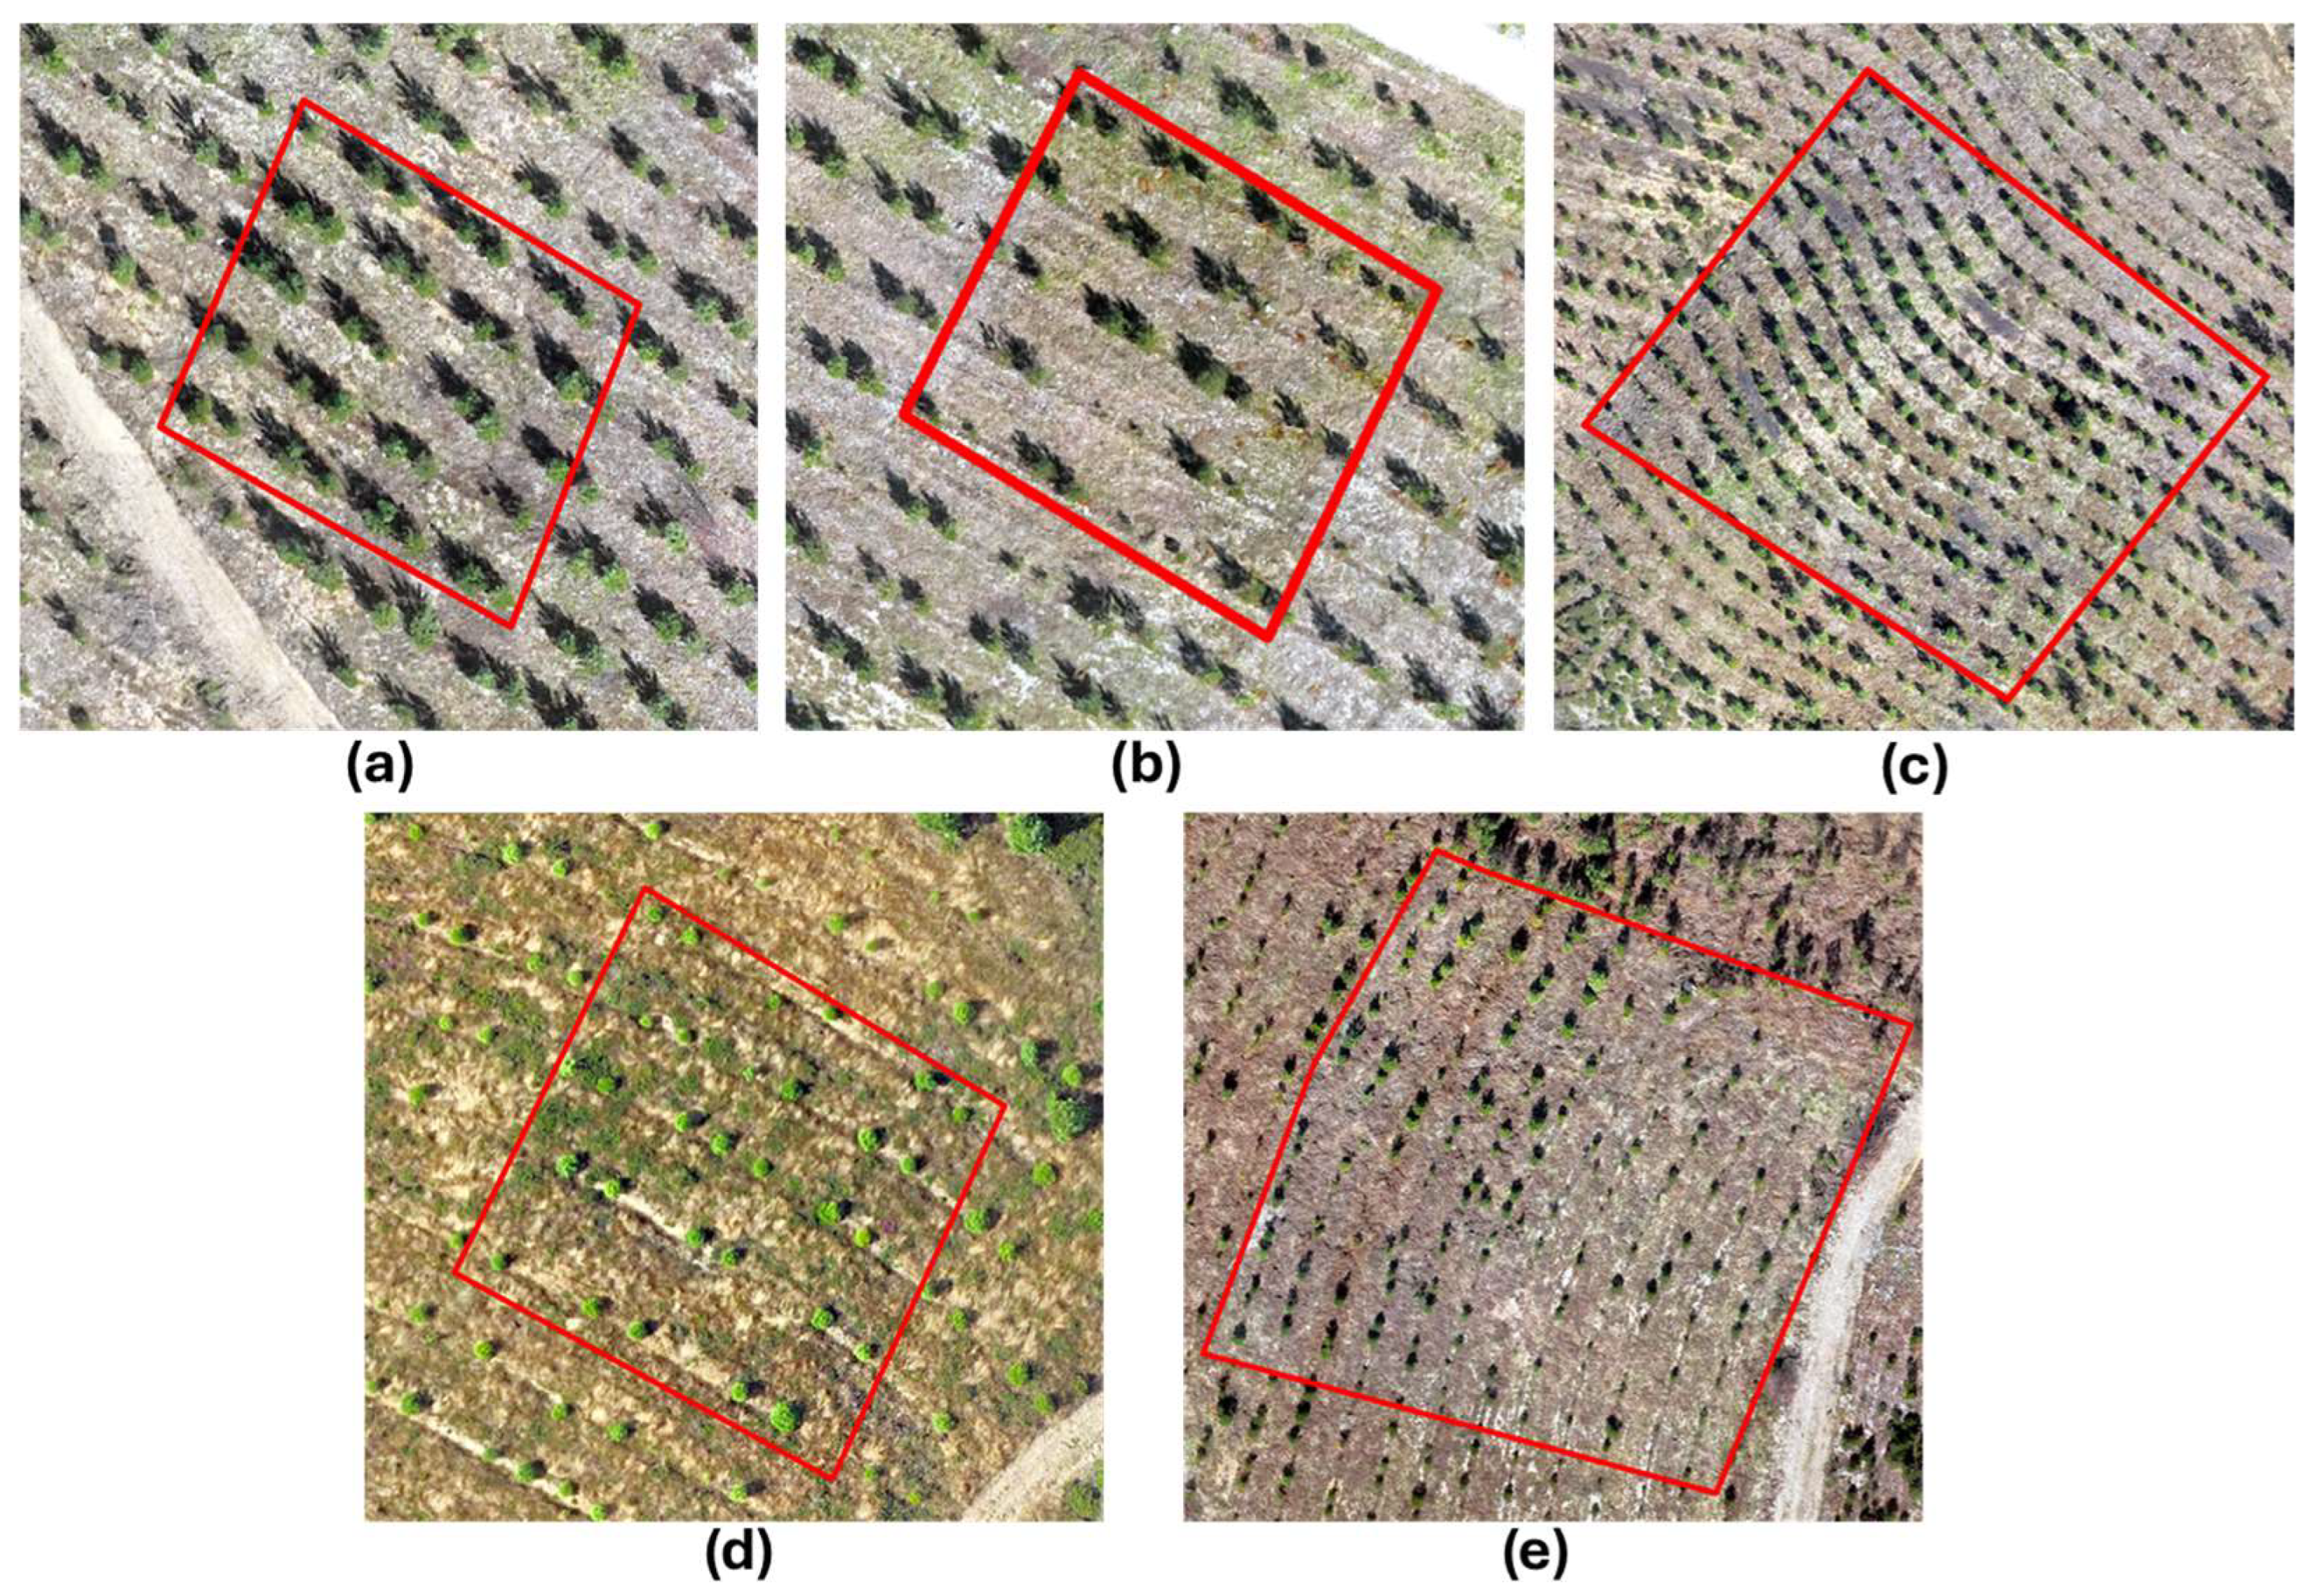
The validation plots used in the Serra do Açor area varied in size from approximately 0.04 to 0.35 ha, as they were initially established for other ongoing studies within the same experimental area. However, because these plots collectively represented about 5% of the total area of interest and were randomly distributed across the orthomosaics, they were also employed for validating the detection of individual planted seedlings model. This approach ensured spatial representativeness and allowed the assessment of model performance under realistic field and imaging conditions (
Figure 5).
The highest proportion of validation area corresponded to orthomosaics not used in model training, ensuring a more robust and independent evaluation. Plots were randomly distributed within the selected areas. Unlike the validation of the fallen-tree detection model, which relied on a visual inventory from orthomosaics, this validation employed field-based ground truthing. All planted trees within the validation plots were geolocated using a GNSS antenna, and their DBH, height, and crown diameter were recorded for complementary studies.
In both case studies, performance evaluation was conducted using confusion matrices and derived metrics (Precision, Recall, and F1-score (Equations (2)–(4)), computed for three detection thresholds (0.75, 0.50, and 0.25) to assess the stability of the model’s predictions under different sensitivity settings. Additionally, Mean Absolute Error (MAE) and Root Mean Square Error (RMSE) were calculated by comparing visual inventory counts with model detections across validation plots. The field information served as a reference to assess the detection rate of the model, allowing the quantification of true positives (TP) correctly identified, false positives (FP), and false negatives (FN) generated by the algorithm.
Precision corresponds to the proportion of detections considered correct (true positives, TP) relative to the total number of detections performed by the model (true positives + false positives, FP). It represents the reliability of the detections:
Recall, also referred to as sensitivity, measures the ability of the model to correctly identify the objects of interest, expressed as the proportion of true positives (TP) in relation to the total number of actual occurrences (true positives + false negatives, FN):
The F1-score provides a balanced measure between the reliability of the detections and the model’s coverage capacity. It is particularly useful when there is an imbalance between classes or between the number of correct and incorrect detections:
These metrics were applied under three different confidence thresholds (0.75, 0.50, and 0.25), corresponding to the probability level used by the Mask R-CNN model to classify detections as true positives. Lower thresholds allowed more detections but increased the risk of false positives, while higher thresholds ensured more conservative and reliable predictions. This multi-threshold evaluation was performed to assess the stability of model performance under varying sensitivity levels, allowing a better understanding of how detection confidence influences precision and recall. By comparing results across thresholds, it was possible to identify the optimal balance between over- and under-detection, ensuring that the validation reflected realistic performance conditions for both case studies.
4. Discussion
This study explored the application of Mask R-CNN architectures for detecting fallen and newly planted trees using high-resolution RGB drone imagery in
Pinus pinaster forest stands located in the Serra da Lousã and Serra do Açor, respectively. The results demonstrated that the proposed approach can achieve high performance, with average precision scores of 90% for fallen trees identified in the storm-damaged area and 75% for recently planted trees. These outcomes are consistent with those of Han et al. [
24,
32,
42,
43], who reported similar levels of accuracy in automatic tree counting using UAV data and deep learning models. Moreover, this method significantly reduces the need for intensive field campaigns, increases the temporal resolution of monitoring, and allows integration into forest management decision systems. The findings confirm that deep learning models can effectively identify forest anomalies with high spatial resolution and precision, even in structurally complex natural environments [
44].
In comparison with current state-of-the-art methods, the proposed approach demonstrates competitive performance. Precision, selected as the primary performance indicator due to its relevance in minimizing false positives in ecological applications, exceeded values reported in comparable studies. For instance, Kislov and Korznikov [
31] employed high-resolution satellite imagery to detect windthrow, achieving only moderate accuracy in heterogeneous forest conditions. By contrast, the drone-based Mask R-CNN model presented here attained superior precision in fallen tree detection, likely attributable to the higher spatial granularity of UAV imagery and the architecture’s capacity for class-specific segmentation. Similarly, the results for detecting newly planted trees are consistent with those of Worachairungreung et al. [
34], who used Mask R-CNN to classify coconut trees from UAV imagery. The model successfully delineated trees with high spatial accuracy, even when they were irregularly shaped or partially obscured by understory vegetation and shadowing. These results suggest that the method is well-suited for identifying structural anomalies in both monoculture and mixed-species forest plantations. Beyond simple tree counting, the purpose of tree detection in this study was to assess post-fire restoration success through both quantitative and qualitative indicators. In the newly planted areas, crown size and shape were used as proxies for tree vigour and early structural development, contributing to the understanding of growth dynamics and regeneration quality. This required a model capable of instance segmentation rather than bounding-box detection, as the latter does not provide sufficient spatial precision for evaluating crown morphology or overlap. Although one-stage object detectors such as YOLO are more computationally efficient, they lack the pixel-level delineation necessary for ecological metrics derived from crown geometry. Furthermore, Mask R-CNN was selected because it is expected to perform better in heterogeneous forest environments and under complex illumination or shadow conditions, where crown boundaries are irregular or partially obscured.
A further dimension explored in this study relates to the sensitivity of Mask R-CNN performance to training dataset size. By systematically varying training set sizes, we observed that model precision remained relatively stable beyond a minimal threshold, reinforcing the findings of Soto-Vega et al. [
37] and Weinstein et al. [
38], who emphasize the importance of dataset diversity over absolute volume. This study directly addresses the research questions formulated in the introduction by linking the proposed approach to the main findings on model performance and robustness. It demonstrates that the Mask R-CNN architecture can reliably detect both fallen and newly planted trees using RGB drone imagery in
Pinus pinaster stands maintaining consistent performance even with different datasets sizes when supported by domain-specific data augmentation. Furthermore, it provides empirical evidence that UAV-based deep learning systems can be effectively implemented in operational forestry contexts, enabling large-scale, repeatable, and cost-efficient monitoring of structural anomalies in forest cover.
Nonetheless, certain limitations remain. The model’s precision tends to decline in areas characterised by severe shadowing, overlapping canopy structures, or dense understory vegetation, where target features may be partially or entirely obscured. Recent studies suggest that these limitations could be mitigated through the integration of complementary data sources, such as LiDAR, which can provide additional structural information to improve detection accuracy. Furthermore, although the model demonstrated good generalisation across two distinct forest sites, additional validation in more diverse ecological contexts and under varying seasonal conditions is necessary to fully assess its robustness and transferability.
5. Conclusions
This study addressed the challenge of detecting fallen and newly planted trees in Pinus pinaster forests, an essential component of timely forest management that has traditionally depended on manual, labour-intensive fieldwork. To overcome these constraints, we employed a deep learning approach based on the Mask R-CNN architecture applied to high-resolution RGB imagery acquired by UAVs. The methodology was tested in two ecologically and topographically distinct forest sites, achieving high detection precision in both scenarios.
The principal contribution of this research lies in demonstrating the feasibility of accurately identifying and mapping fallen and newly planted trees through UAV-based deep learning, generating outputs suitable for integration into operational forest monitoring workflows. Compared to conventional satellite-based methods or manual surveys, the proposed approach offers superior spatial resolution, reduced field effort, and greater temporal responsiveness, key advantages for adaptive forest management under increasingly dynamic disturbance regimes driven by climate change. In this context, developing more efficient methods for continuous forest assessment, as they enable timely and spatially explicit monitoring, is an essential foundation for adaptive forest management and long-term resilience planning in the face of ongoing climatic pressures.
Despite these strengths, certain limitations were observed. Model performance declined in areas with severe shadowing, overlapping canopy layers, or dense understory vegetation, where target features are visually obscured. In addition, while the model generalised well across the two study sites, its broader applicability to other forest types, structural conditions, and seasonal variability requires further validation beyond what has already been conducted. Future work should explore the integration of complementary data sources such as LiDAR and expand testing across diverse bioclimatic regions to assess model robustness and support wider adoption in forest monitoring and restoration planning.
