1. Introduction
Planting trees can improve the view of a landscape and also affect local ground wind conditions. In addition to improving the view of a local landscape, the existence of trees can also lead to a reduction in downstream near-ground wind speeds, thus improving the improving human comfort and can even improve safety in the context of gust of winds.
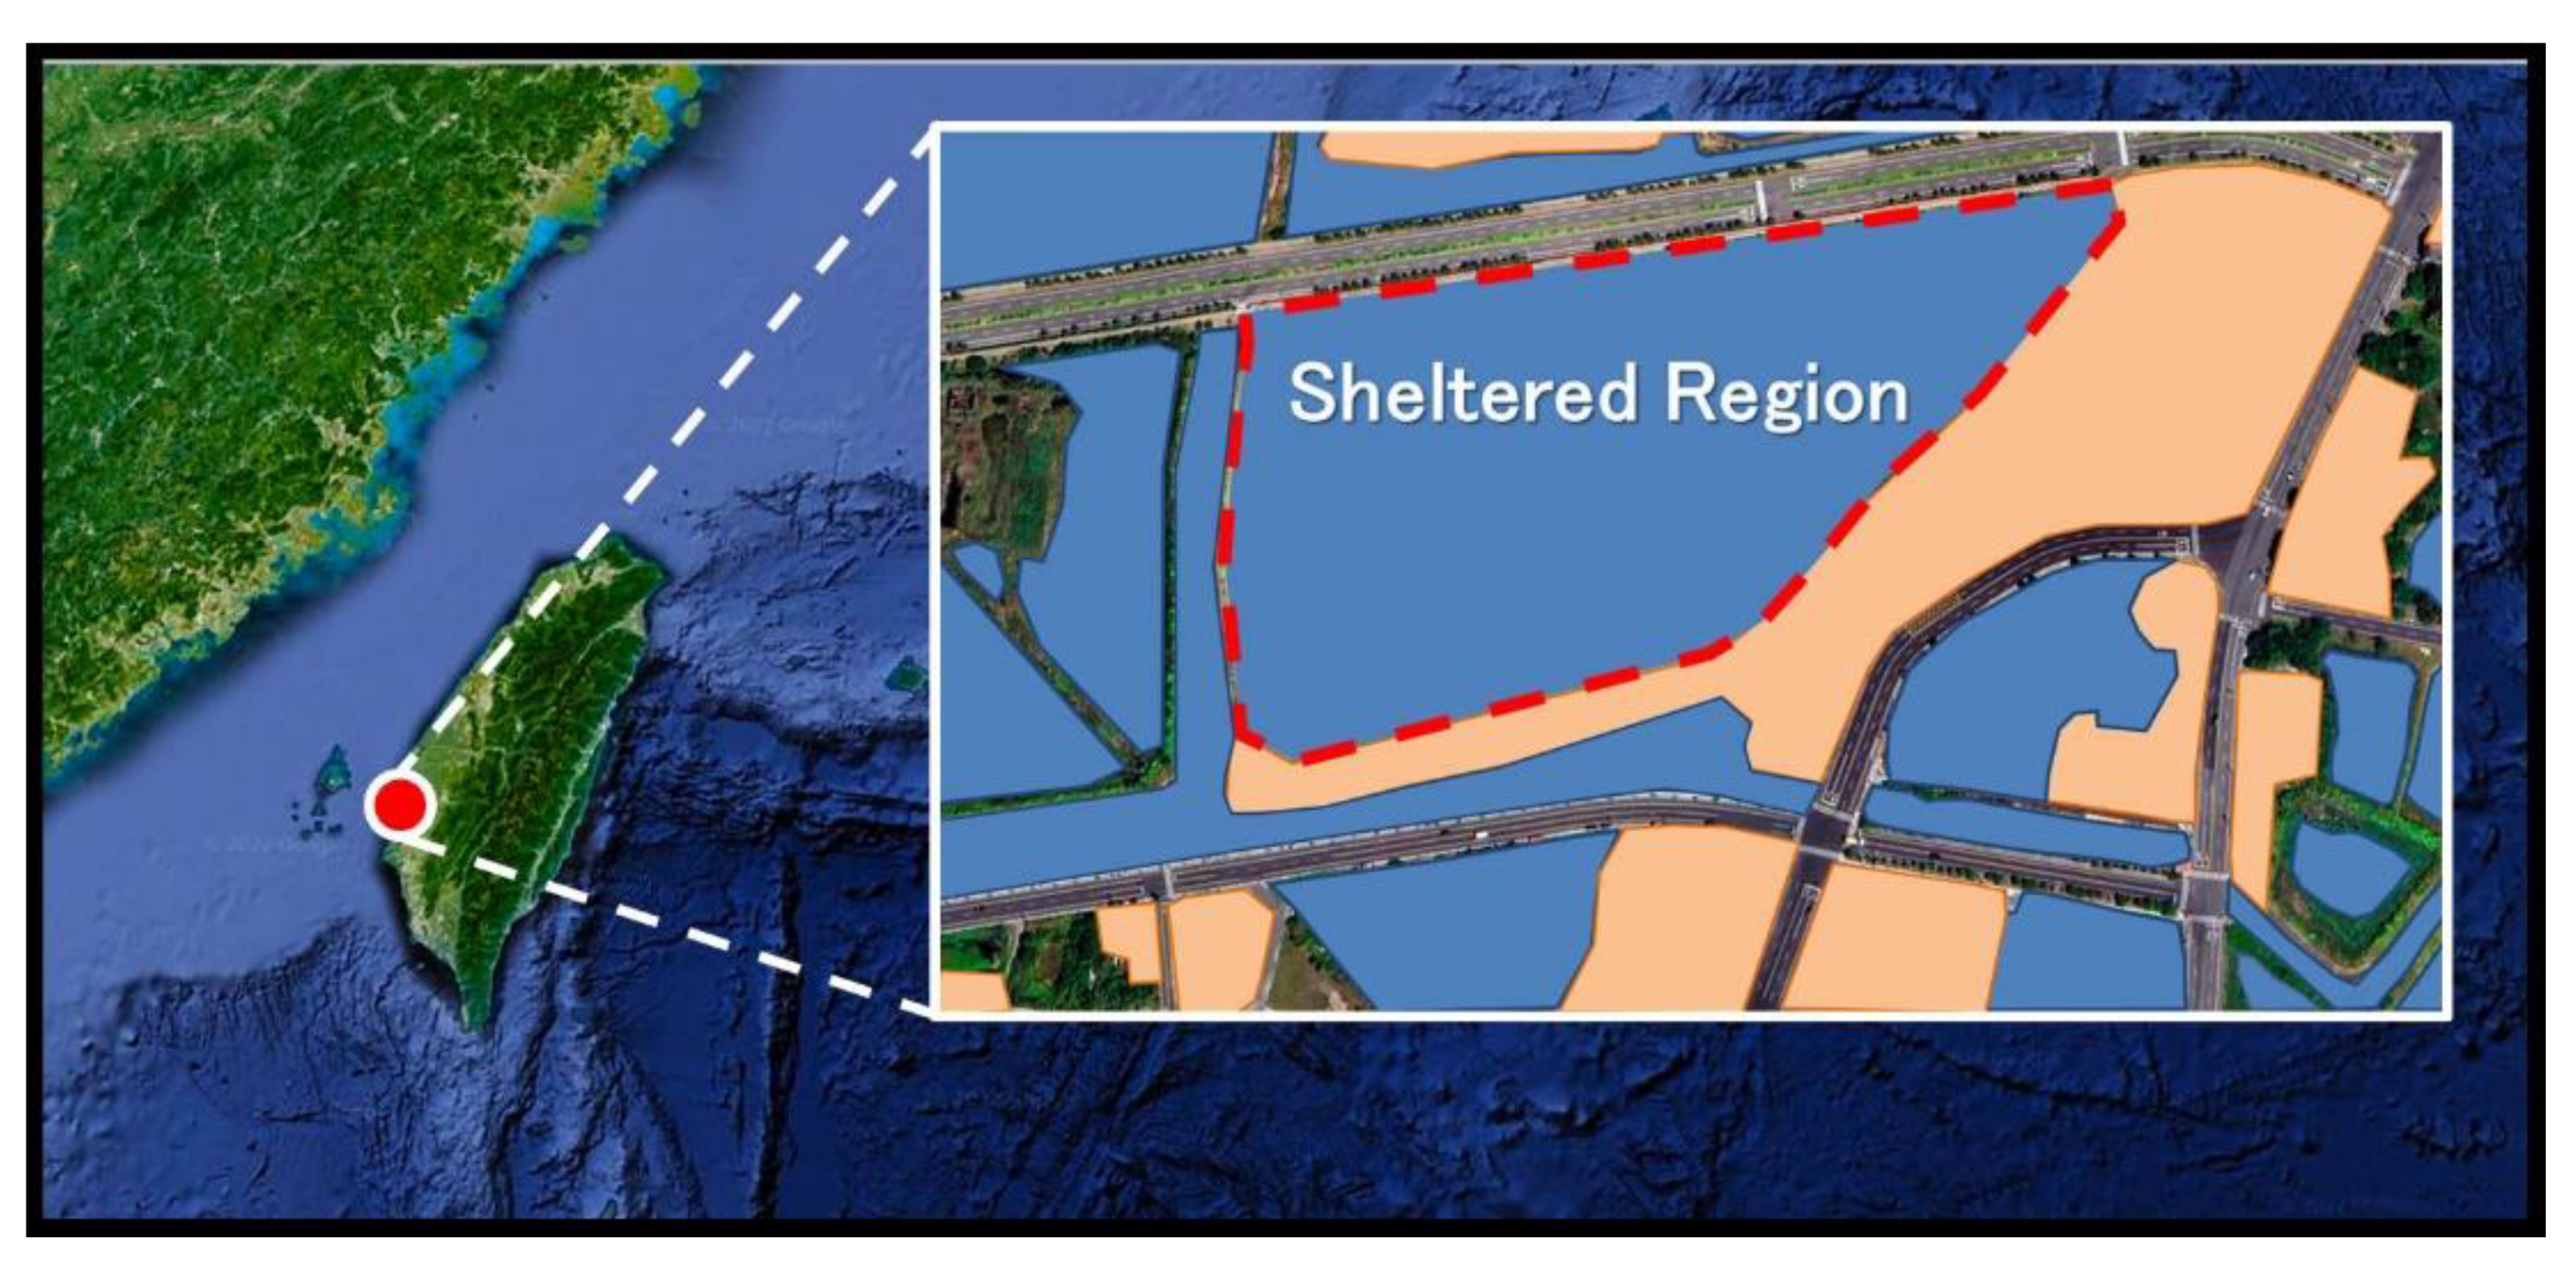
The technique of planting row trees had been frequently employed for wind protection in windy areas of Taiwan. A practical example can be found at Budai Port on the southwestern coast of Taiwan (see
Figure 1). To shelter the harbor pool region from strong winds during the fall and winter seasons, row trees were planned to be placed at the periphery of the protected region. Although landscape planners generally realize that both the local appearance and wind fields should be taken into account to determine the type of row-tree arrangement, an evaluation of the precise efficiency of ground wind reduction is considered to be difficult due to a lack of quantitative wind data to refer to.
Generally, wind fields in an open space with trees can vary according to local meteorology and ground features, such as surface roughness and the topology of terrains. In addition to the strength and patterns of oncoming wind flows, existing plants can also affect the local spatial wind-flow fields. Since parts of tree crowns are porous and allow for penetration, downstream wind flow behaves differently from the case of a non-penetrable body. Due to its complicated nature, the analysis of wind behavior behind trees has become an important task to address at the planning stage of tree planting.
2. Goal and Description of Study
By taking a simplified row-tree problem for ground-wind protection using a commonly adopted species of tree as the demonstrated case, the goal of this study is two-fold: to explore the general behavior and features of flows behind row trees to assist landscape planners, and to investigate the effects of flows behind row trees due to changes in tree heights and tree spaces to achieve general principles for the selection of row-tree arrangements.
Figure 2 illustrates a schematic of the problem. A series of numerical flow simulations were conducted to investigate near-ground wind flow behind a line arrangement of evenly-spaced row trees, in an open and flat area, at various tree heights (H = 6 m, 9 m, 12 m and 15 m) and tree spacings (S = 1.2 W, 1.5 W and 1.8 W; W is the tree crown width) on a systematic basis. The resulting downwind flow fields at a pedestrian level were further analyzed to explore the features and tendencies of stream-wise wind speed variations behind trees.
In the study, the oncoming wind flow direction was perpendicular to the line of row trees. The pattern of the oncoming wind flow was set as a boundary-layer type with a ground condition subject to type C exposure, which is considered typical in common developing territories. According to the ASCE/SEI 7-16 [
1] wind code, the corresponding gradient height and power-law α value of the oncoming wind flow are 300 m and 0.15, respectively. The strength of the oncoming flow was chosen to be a number 6 flow (strong breeze), based on the Beaufort scale.
In numerical computations, a k-ε turbulence model was employed to reflect the existing turbulence characteristics of the wind flows. Since tree crowns allow for wind penetrations, they were treated as porous media. In the porous parts of the simulated wind field, appropriate source terms were included in the associated governing equations to physically describe the penetrating behavior of the wind flow. Furthermore, to correctly simulate the retardation effect associated with tree crowns, certain tree factors, which reflect the retardation effect of the penetrable crown, had to be determined before the numerical computations were executed. In this study, values were obtained based on the comparisons between the measured wind velocity profiles downstream of a model tree in wind tunnel experiments and the predicted values.
3. Related Studies
A number of previous related studies have focused on the areas of forestry and meteorology. Using field observations, the major focus was to examine the global wind flow characteristics of trees in forests. Many originally 3-D wind-flow problems were simplified into 2-D or even 1-D cases. Finnigan [
2] pointed out that surface wind flow regions could be divided into a canopy and a surface sublayer. Based on the results of field observations, Raupach et al. [
3] found that the turbulent flow pattern within the canopy sublayer was similar to that of a mixing-layer flow. By performing wind tunnel experiments, Raupach et al. [
4] proposed a description of the wind speed profile in forest territories. Mihailovic et al. [
5] also suggested similar profiles. According to the results of wind tunnel measurements, Massman [
6] used the concept of leaf area index (LAI). Certain discussions were made regarding its influences, such as the wind speed profiles, surface shear velocities, and roughness heights. Moreover, Novak et al. [
7] concluded that a change in the spatial density of forest trees could affect the characteristics of local mean and turbulent flows, which are mainly dominated by large-scale turbulence eddies. In a wind tunnel study of wind flows past a single layer and a double layer of plants, Boldes et al. [
8] found that mixing flows occurred in the wake region and produced bleed flows due to the effects of large-scale eddies. Further experimental works were performed by Flesch and Wilson [
9,
10] to investigate the extent of wind speed reduction downstream of tree groups and the resulting protected area.
On the other hand, there are also several studies on numerical predictions of wind flow around trees. Since full descriptions of the geometries of twigs and leaves in tree crowns involve a large amount of computing time, these were considered inefficient in the execution of numerical flow computations. Uno et al. [
11] proposed a second-order turbulence model to study the role of the urban canopy layer in the formation of a nocturnal urban boundary layer. Based on the eddy-viscosity concept, Hiraoka [
12] adopted ensemble-averaging and spatial averaging techniques to simulate flows within plant and urban canopies. Shaw and Schumann [
13] proposed the inclusion of appropriate source terms in the momentum equations in flow simulations of the spatial parts of tree crowns, to physically reflect the penetration features of crowns. The introduced drag terms were the overall outcome of the drag coefficient, leaf density, and combined velocities. Moreover, Wilson and Flesch [
14] employed a 2-D numerical model to simulate flow fields in forests. In comparison, the predicted wind speed profiles agreed well with the in-field results. Moreover, Su et al. [
15] performed large eddy simulations (LES) to successfully predict neutrally stratified flows past forests. Moreover, LES computations were also carried out by Patton and Davis [
16] to investigate the dispersion mechanism of chemicals in forests. Further, Watanabe [
17] also performed large eddy computations to examine the turbulence structure of wind flows above forests. In addition, Sládek et al. [
18] numerically investigated the 2-D and 3-D wind fields of boundary-layer flows past forests in areas with complex topography, based on a k-ε turbulence model. More recently, Fang et al. [
19] extended the ideas of Shaw and Schumann [
13] to simulate flows around discrete coniferous trees. By combining the drag coefficient (C
D) and leaf area index (LAI), a factor (C
Da) was introduced to reflect the overall wind retardation effect of tree crowns. The predicting flow fields behind discrete trees compared well with measurement results.
4. Numerical Method
Ansys FLUENT software was used to perform the wind flow predictions. Essentially, the governing equations of the solver associated with the incompressible turbulent flows was in a RANS (Reynolds-averaged Navier–Stokes) form. The reliable k-ε model was selected to solve the transport equations of turbulence kinetic energy (k) and the dissipation rate (ε) to further achieve the corresponding distribution of turbulent viscosity (νt).
Generally, the Reynolds-averaged continuity and momentum equations are:
where
is the time-averaged velocity vector and t represents time. p,
, and ν are respectively time-averaged pressures, density, and kinematic viscosity of air.
is gravity.
After solving the transport equations of turbulent kinetic energy (k) and dissipation rate (ε) in index forms:
with C
1ε = 1.44, C
2ε = 1.92, and turbulent Schmidt numbers σ
k = 1.0 and σ
ε = 1.2, the turbulent diffusivity (ν
t) is then obtained as:
In the spatial part of tree crowns, particularly, certain source terms are added in the associated governing equations to reflect the corresponding retardation effects. In the momentum equation, the additional source term adopts the suggestions of Shaw and Schumann [
13] and Fang et al. [
19] as:
with C
Da = C
D × a, where C
D is drag coefficient and “a” is leaf area index (LAI) of the tree crown.
According to the suggestion of Uno et al. [
11], the additional source terms in the k and ε transport equations, in index form, s are, respectively:
In Ansys FLUENT, the treatment of the additional source terms can be addressed by including appropriate user-defined functions (UDF) during program executions. It is also noted that factor C
Da is related to the spatial densities of leaves and twigs in tree crowns. According to the work of Fang et al. [
19], this factor can be obtained by experiments.
5. Selection of Tree Type
As
Koelreuteria henryi is one of the most popular native landscape trees adopted for row trees planting in Taiwan (see
Figure 3), it was selected as the target tree species in the present study. Accordingly, a number of images of
Koelreuteria henryi were collected through field observations to estimate their shapes and crown densities, according to the evaluation procedures suggested by Schomaker et al. [
20]. The final tree shape and related properties, such as the crown density, were the averaged outcomes of the observed results from different observers.
6. Determination of CDa Value
Wind tunnel experiments were conducted at the Architecture and Building Research Institute (ABRI) in Taiwan. A model tree was set on the tunnel floor of a test section (6.6 m in width and 2.6 m in height) for downstream velocity measurements. The model tree, including a trunk, twig, and leaves, was produced using a 3-D printer. After the tree model was completed, further estimates of its crown density were repeated according to the same procedure of Schomaker et al. [
20], to ensure that the crown density of the model tree agreed with the observed averaged values of
Koelreuteria henryi.
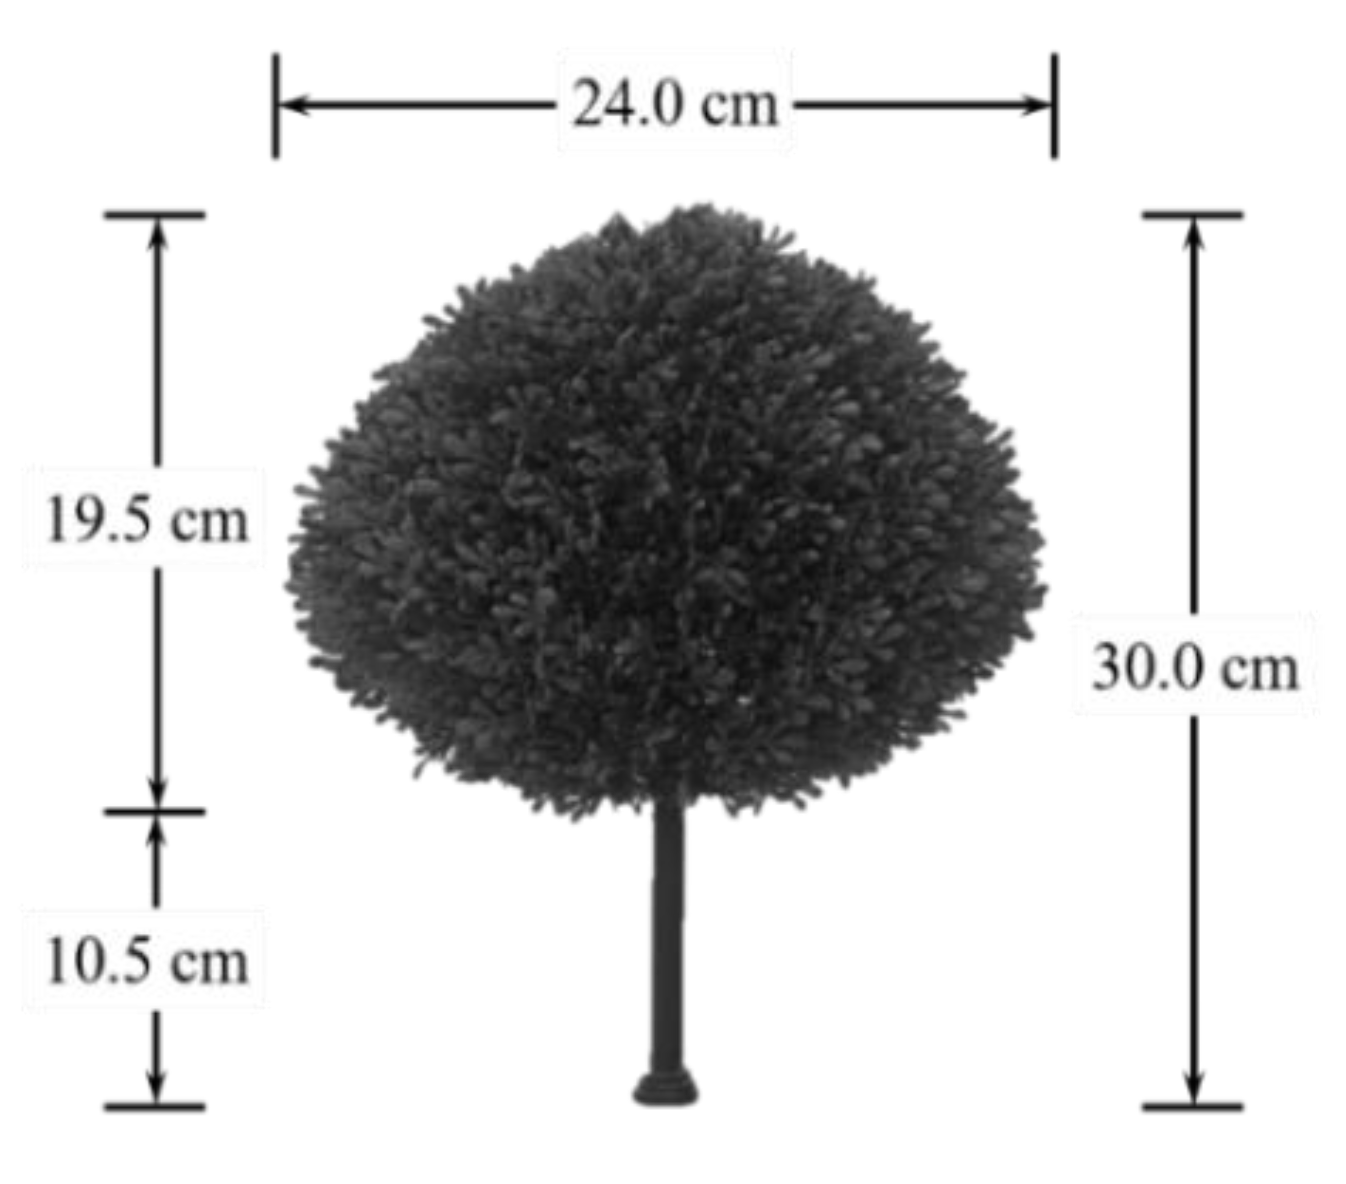
Figure 4 depicts the shape and dimensions of the tree model. Considering the consistency of the analysis results, the tree was made in an axi-symmetrical shape.
Table 1 illustrates its related properties. This model tree was taken as the standard one to perform the following numerical wind flow analyses.
Figure 5 shows the mean velocity and turbulent intensity (I
u) profiles of the oncoming flow in the wind tunnel experiments (u
H = 8.10 m/s). A TFI Cobra probe was set downstream of the tree to measure the velocity profiles at 3 H and 4.5 H, respectively, downstream. A Cobra probe is a multi-hole pressure probe that provides dynamic three-component real-time velocity measurements. It is capable of a linear frequency-response from 0 Hz to more than 2 kHz, and is available in various ranges of use, between 2 m/s and 100 m/s. In all the velocity measurements, the sampling rate was 1000 Hz and the measurement period was 64 s.
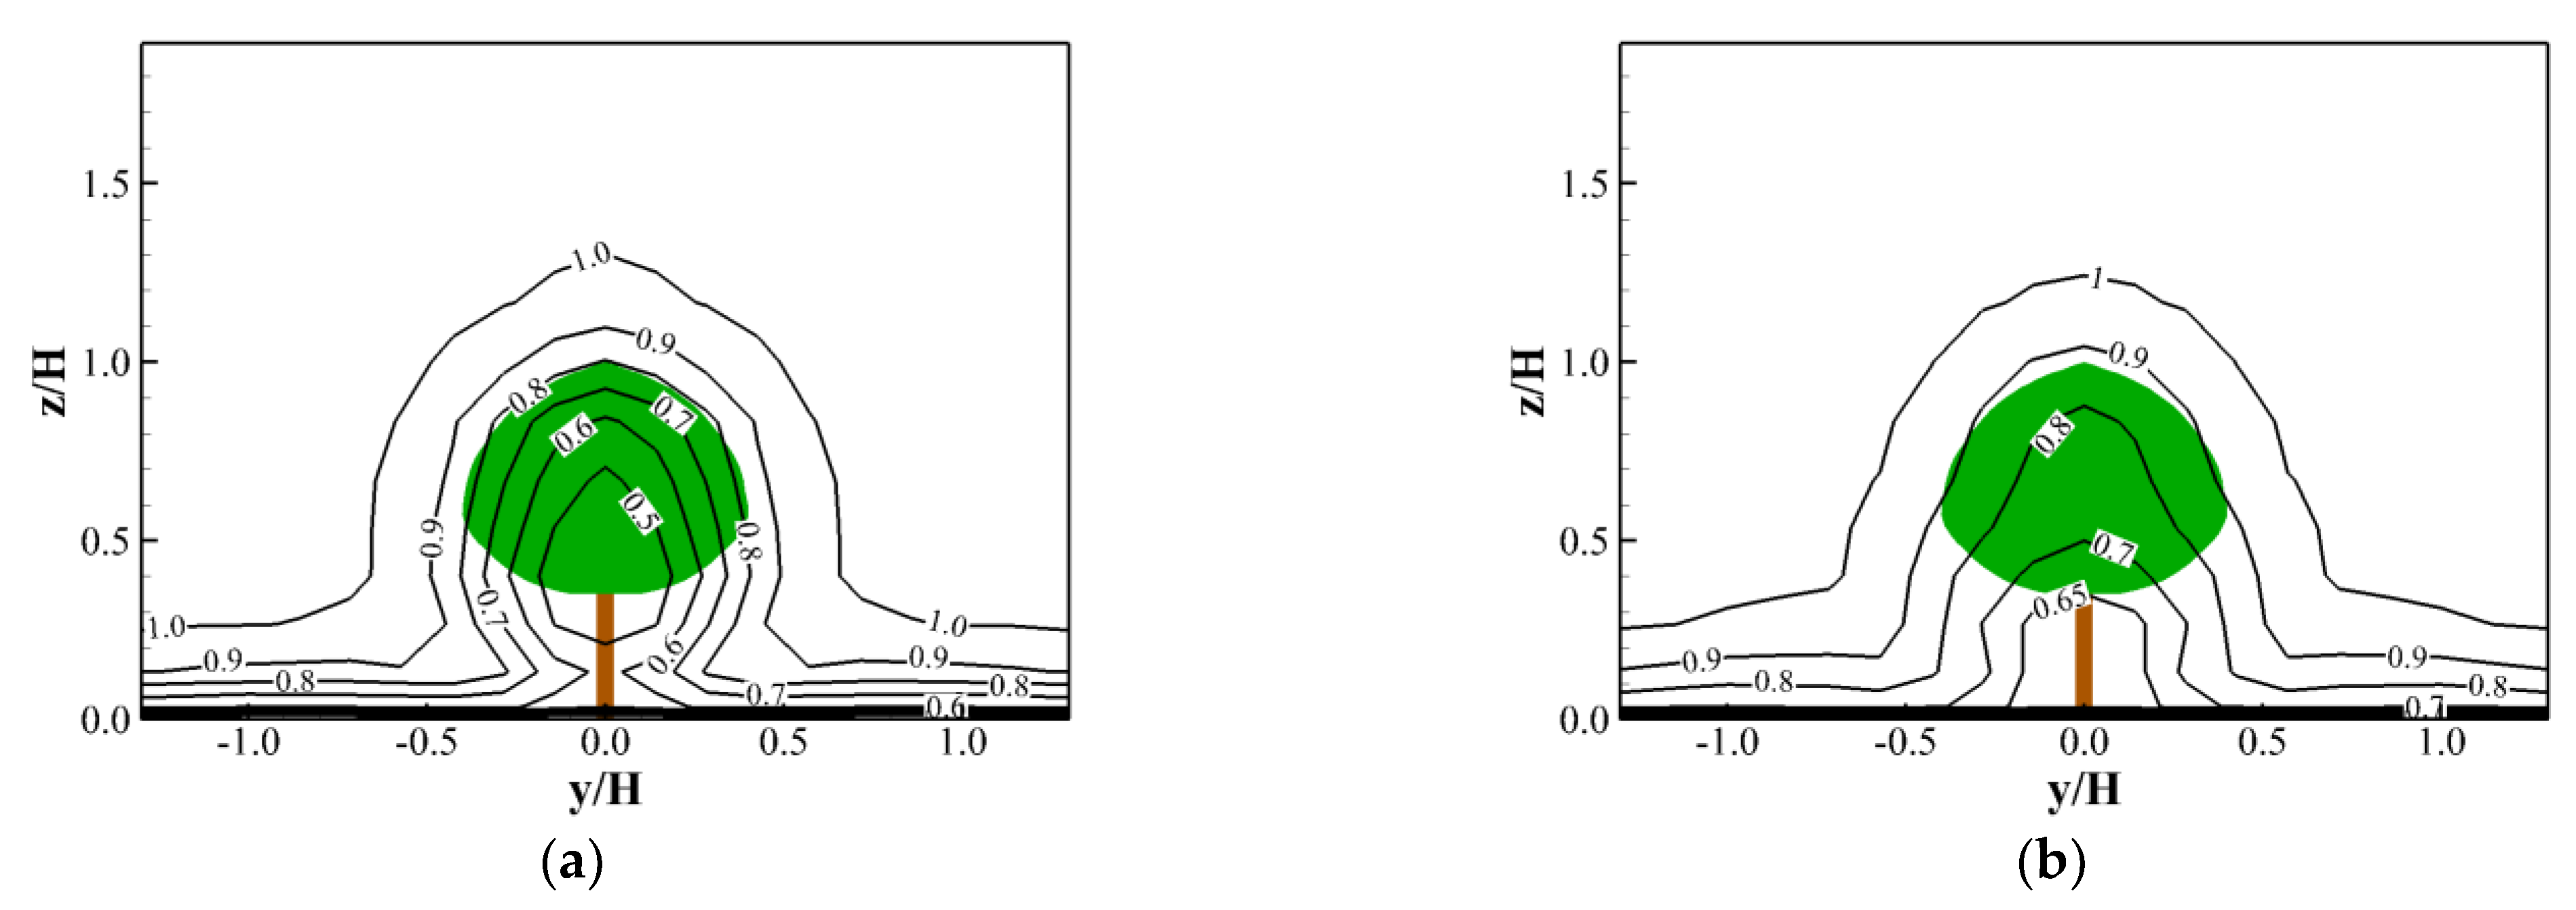
Figure 6 illustrates the measured downstream velocity profiles.
Parallel flow simulations were conducted using a number of tentative selections of the crown factors (C
Da). By comparing the predicted downstream velocity profiles with the measured ones, the C
Da value, leading to the best agreement, was then determined.
Figure 7 shows the variations of the resulting normal root-mean-square error (NRMSE), or the average relative error, in relation to the change in C
Da value. Accordingly, the best C
Da value was obtained at 0.86. The resulting relative errors of the downstream flow predictions were less than 4.2%.
Figure 8 shows the corresponding predicted downstream velocity profiles.
7. Numerical Predictions of Wind Fields around Row Trees
After the C
Da value associated with the standard tree was determined, a series of numerical flow computations were conducted in an open flat area with a line of evenly-spaced row trees of various tree heights (H = 6 m, 9 m, 12 m, 15 m) and at various tree spacings (S = 1.2 W, 1.5 W, 1.8 W; W is crown width) of row trees to examine the resulting shelter effects from the trees. As a rural territory was considered, C exposure [
1] was selected for the ground condition. The shape of the velocity profile of the oncoming flow was in a boundary-layer type with a boundary-layer thickness (δ) equal to 300 m and a power-law α value of 1.5 [
1]. The strength of the oncoming flow was chosen as number 6 (strong breeze), based on the Beaufort scale. In particular, wind speeds at 10 m and 2 m above ground were, respectively, 11.0 and 8.64 m/s.
In the numerical computations, it was assumed that trees remained the same geometric shape and had the same crown density as that of a standard tree (see
Figure 1 and
Table 1). That is, the related dimensions of the tree, such as crown length and crown width, were in fixed proportions to the tree height. Moreover, trees were considered rigid. That is, the effect of tree defections and motions due to the action of wind were not considered in the flow analyses.
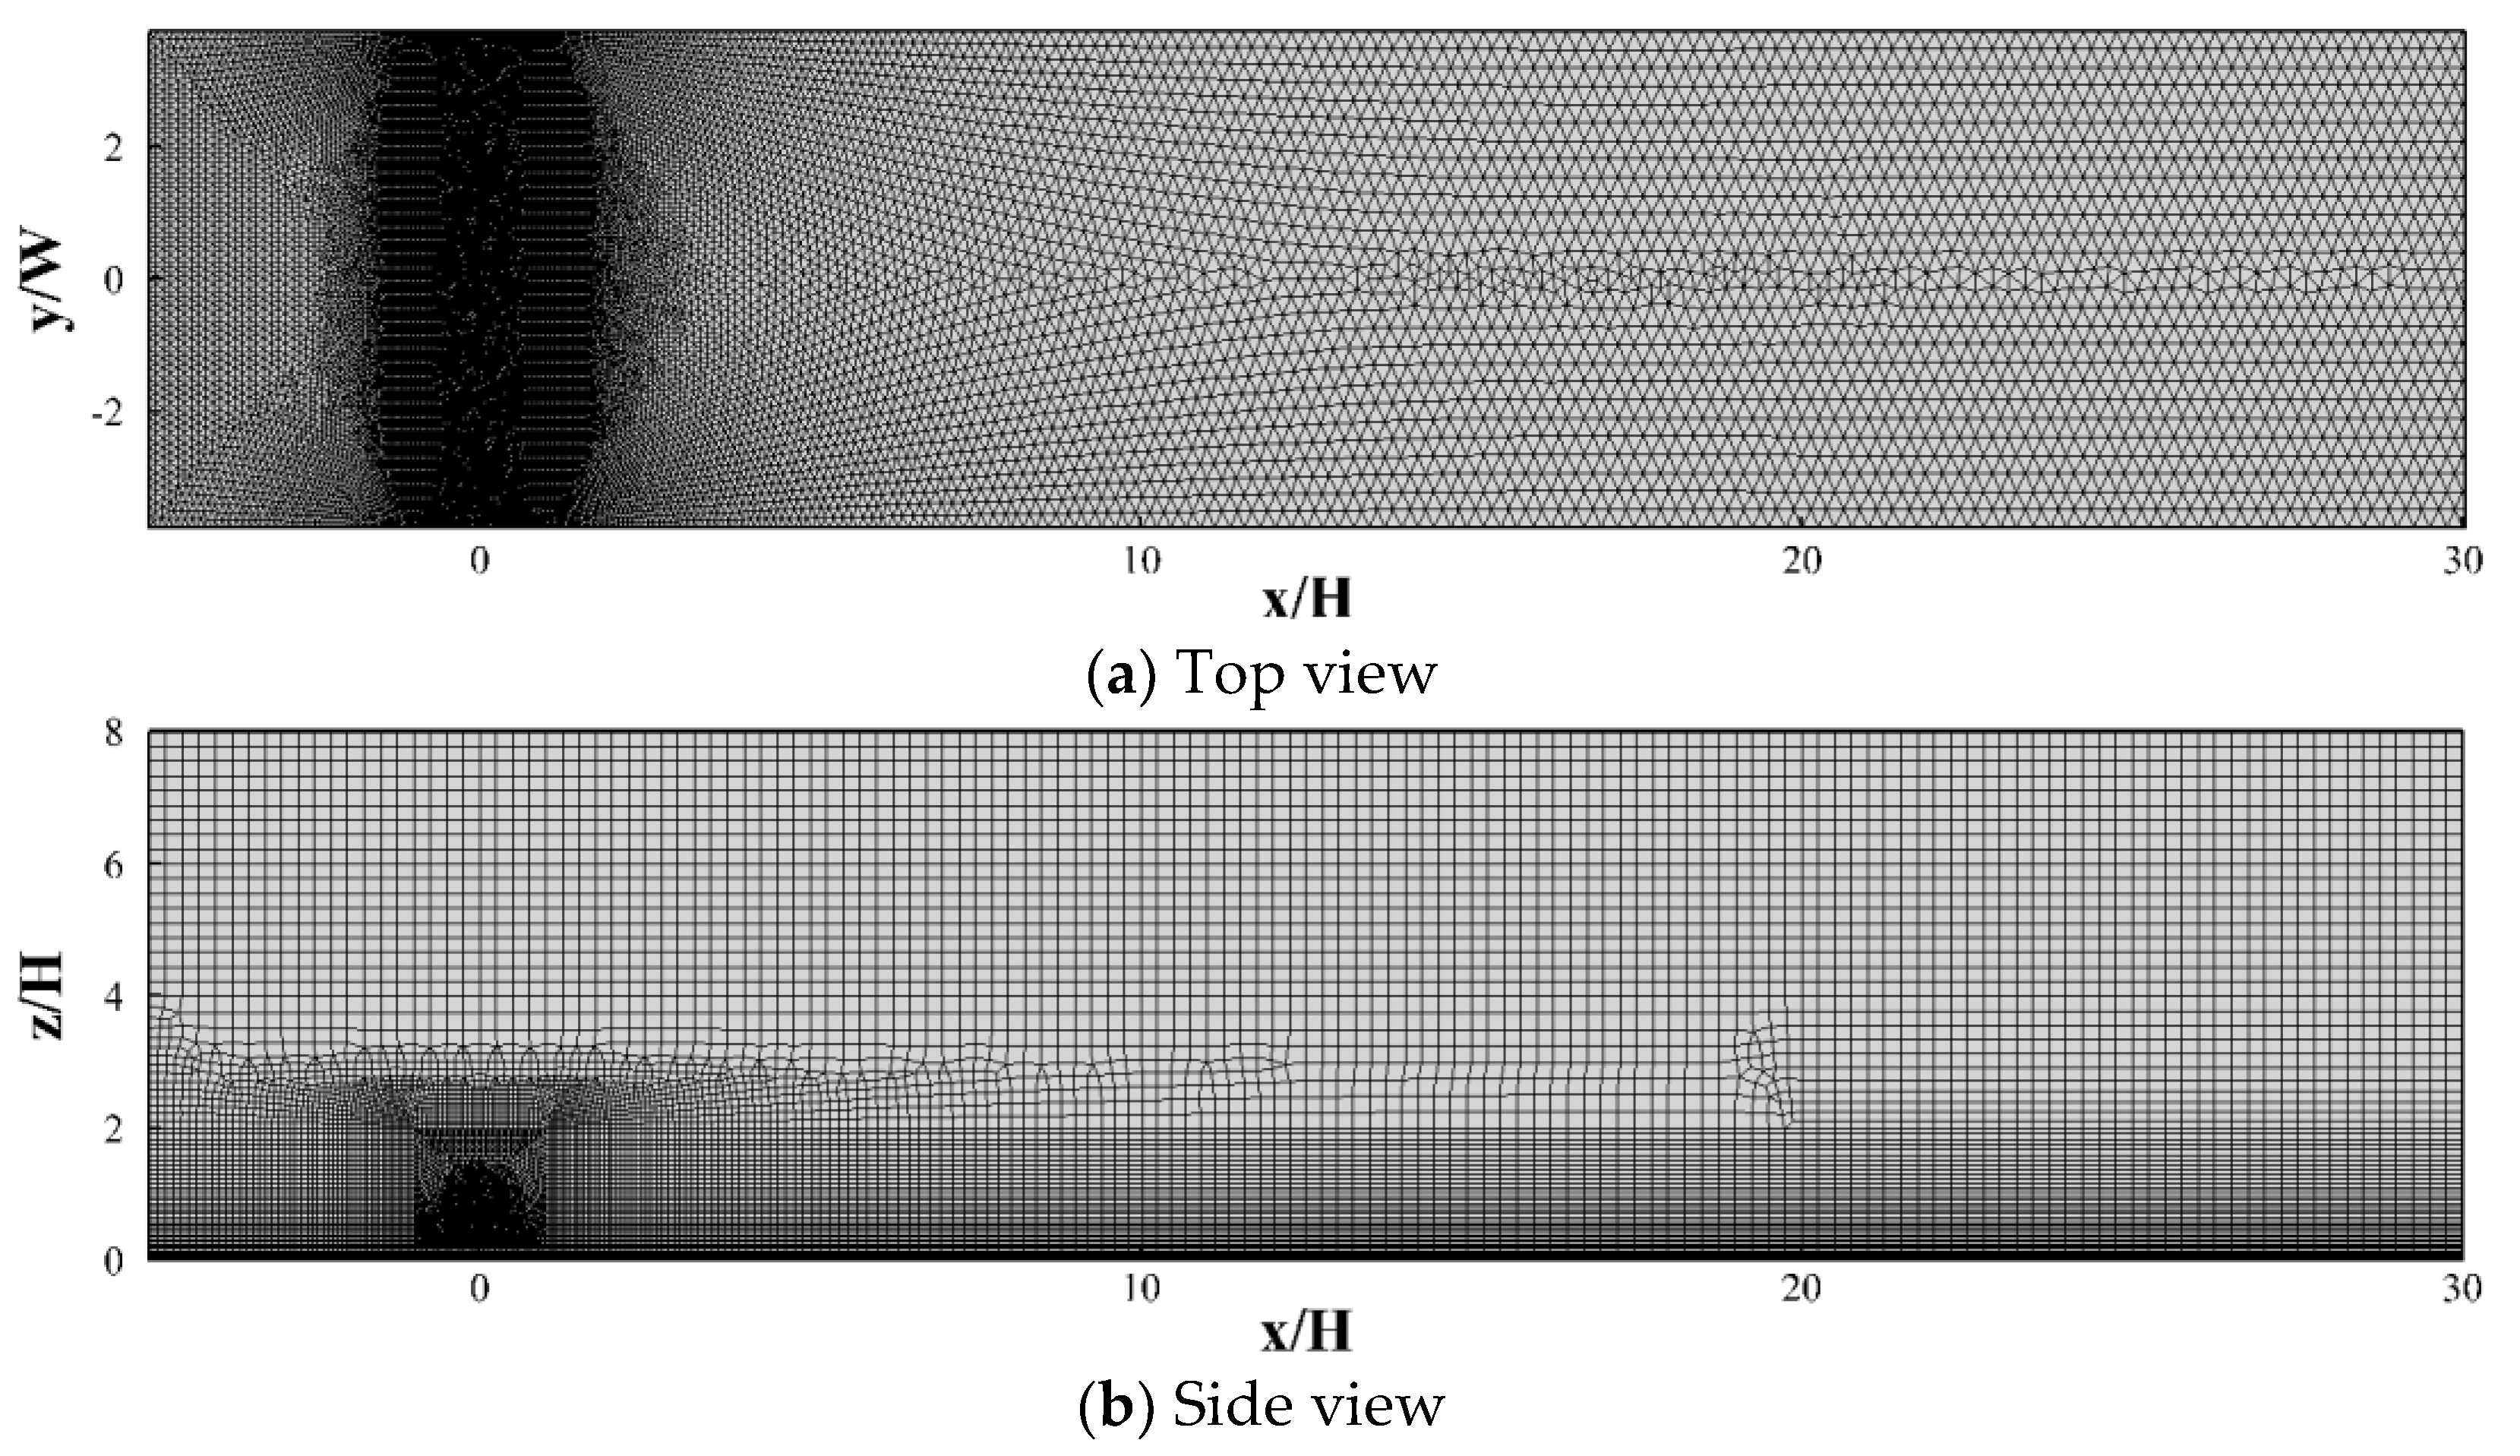
Figure 9 illustrates the computation domain in a typical case were the tree height (H) was 6 m and the tree spacing (S) was 1.5 W. The dimensions of the rectangular computation domain were 35 H, 6.4 H (or 8 W) and 8 H, respectively, in the along-wind (x), across-wind (y), and vertical (z) directions.
Figure 9 also shows the unstructured grid system used in the flow computations. The total number of the grids was nearly three million. The minimum volume of the grid was 4.7 × 10
−5 m
3. An additional examination of the flow simulations was conducted using a larger computation domain (60 H × 9.6 H × 12 H). The comparison of the calculated results indicated that the relative difference of the predicted results was within 3%.
Appropriate values of pressures, velocities, k, and ε were specified at the boundaries of the computational domain to reflect their physical natures. At the ground, a no-slip condition was used. At the upstream inlet section, a power-law velocity profile was imposed. In addition, zero-gradient specifications were employed at the side boundaries and at the downstream end.
8. Results
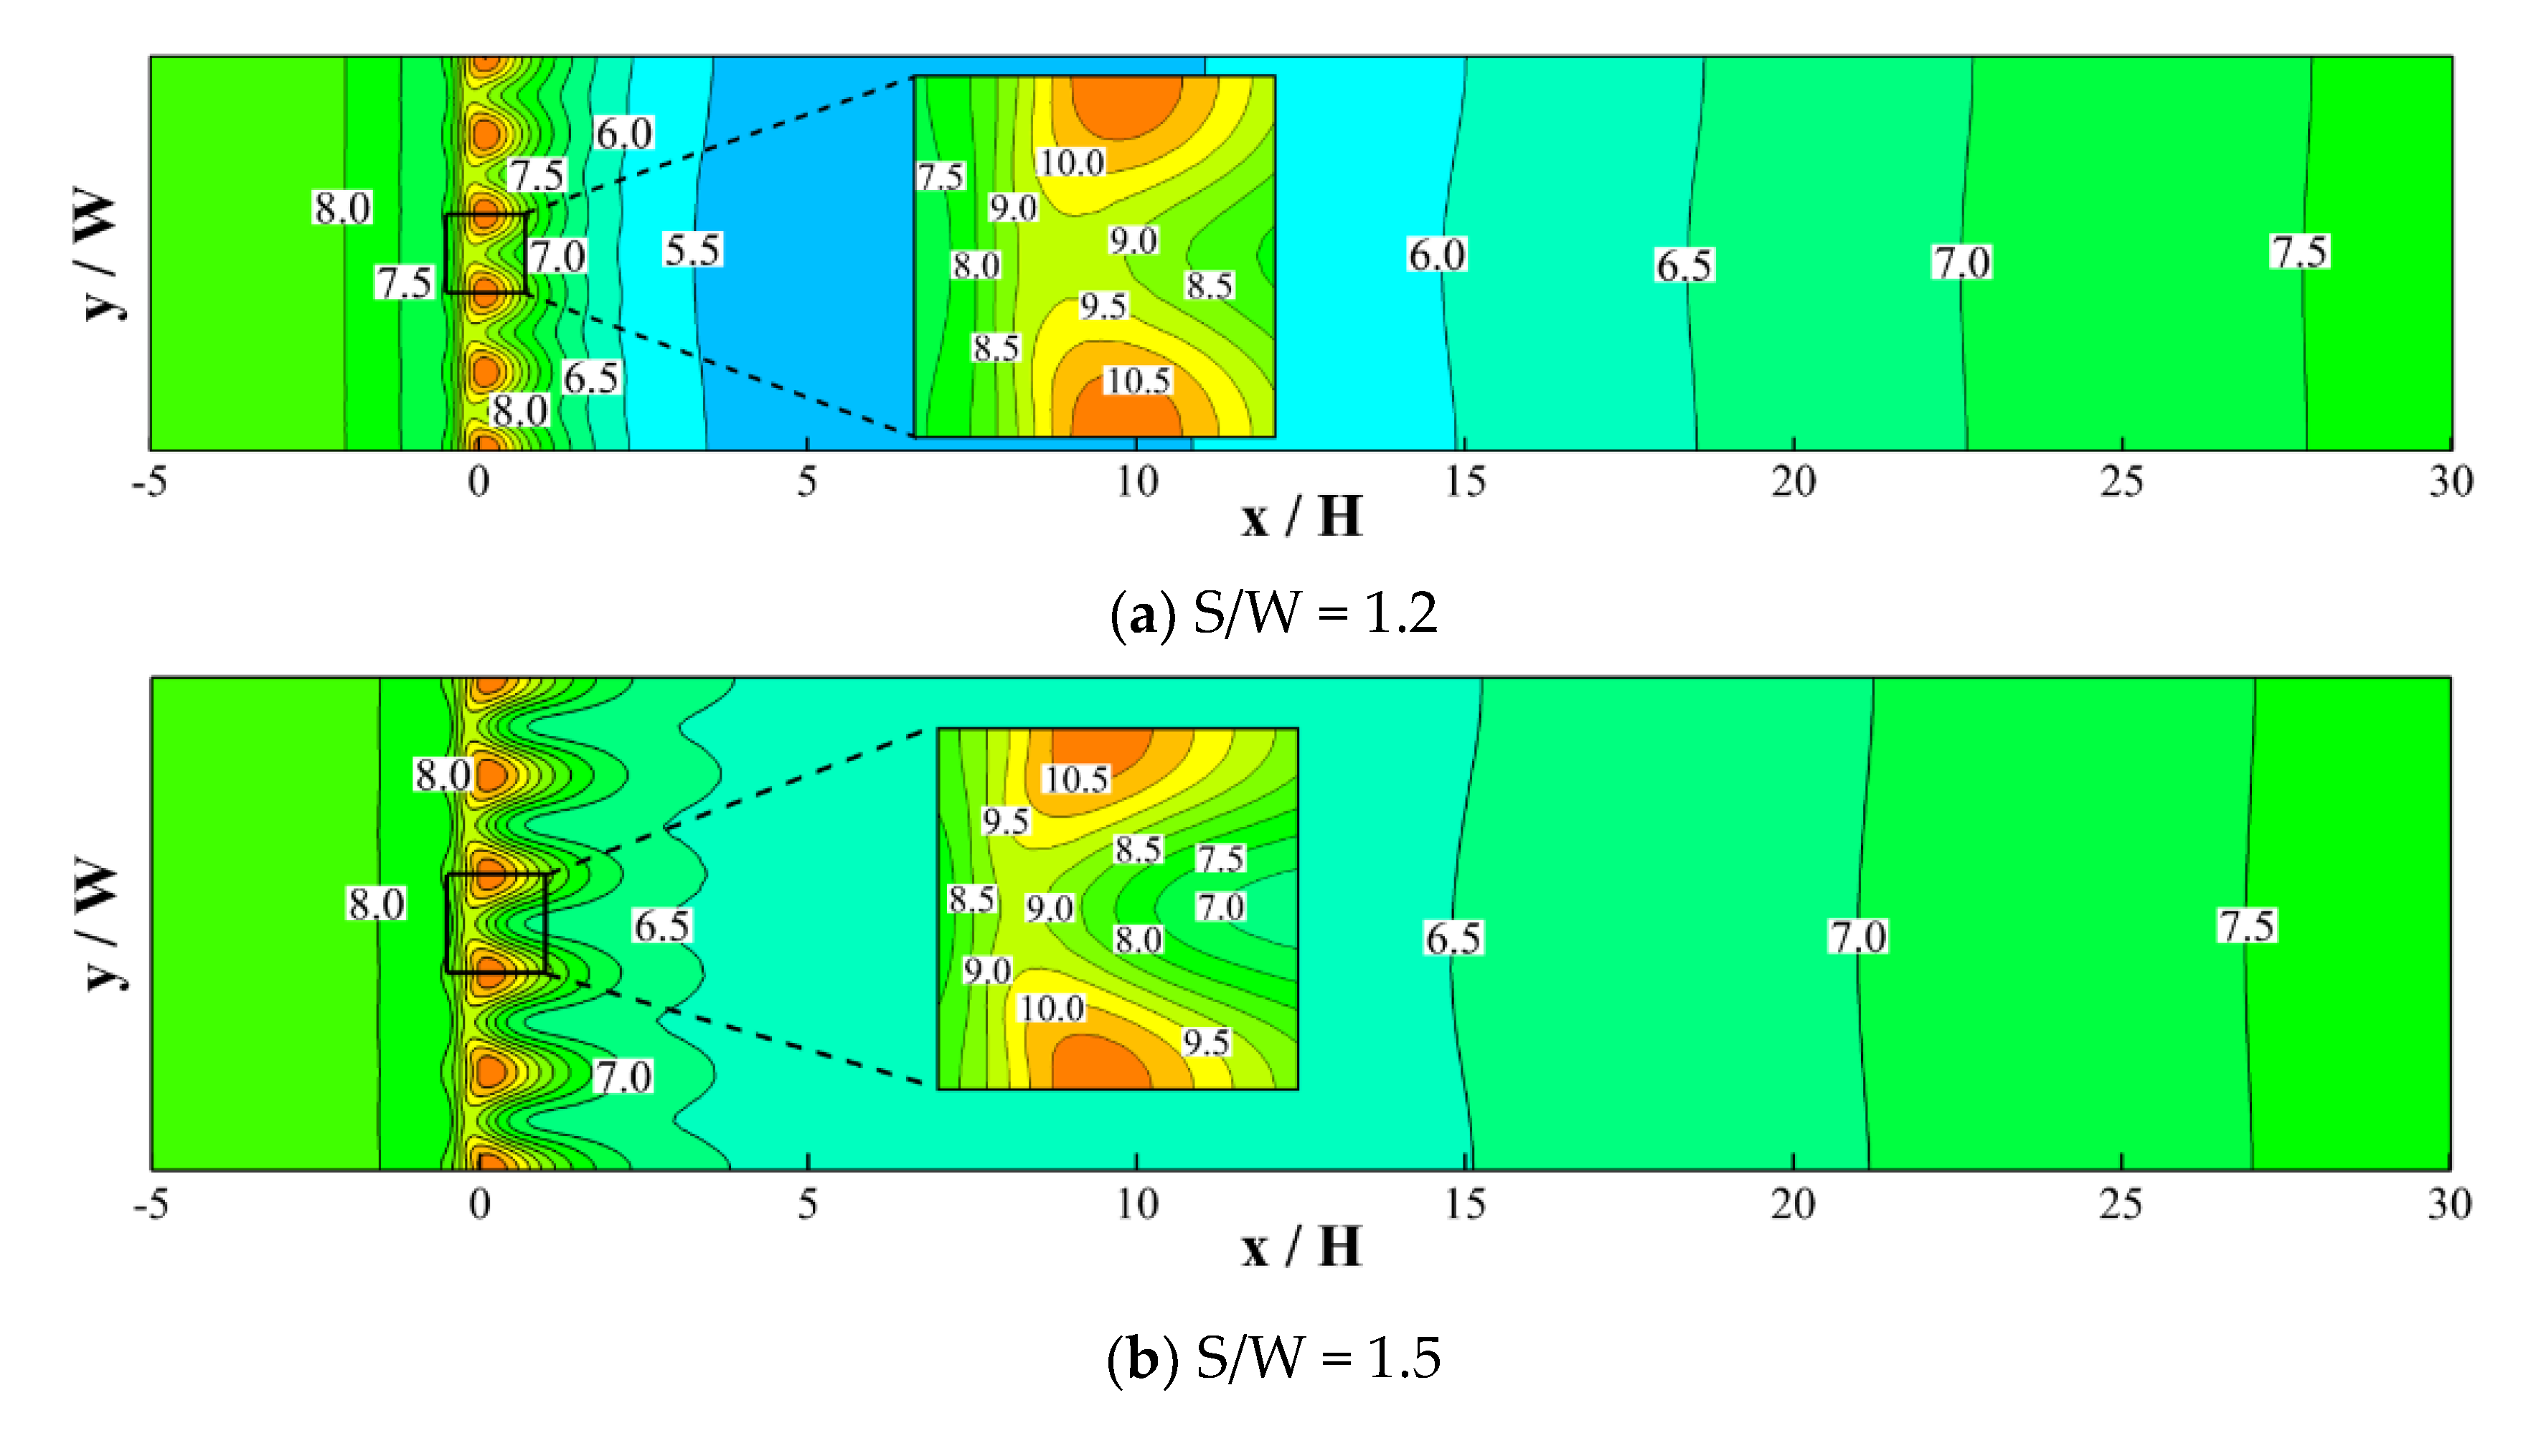
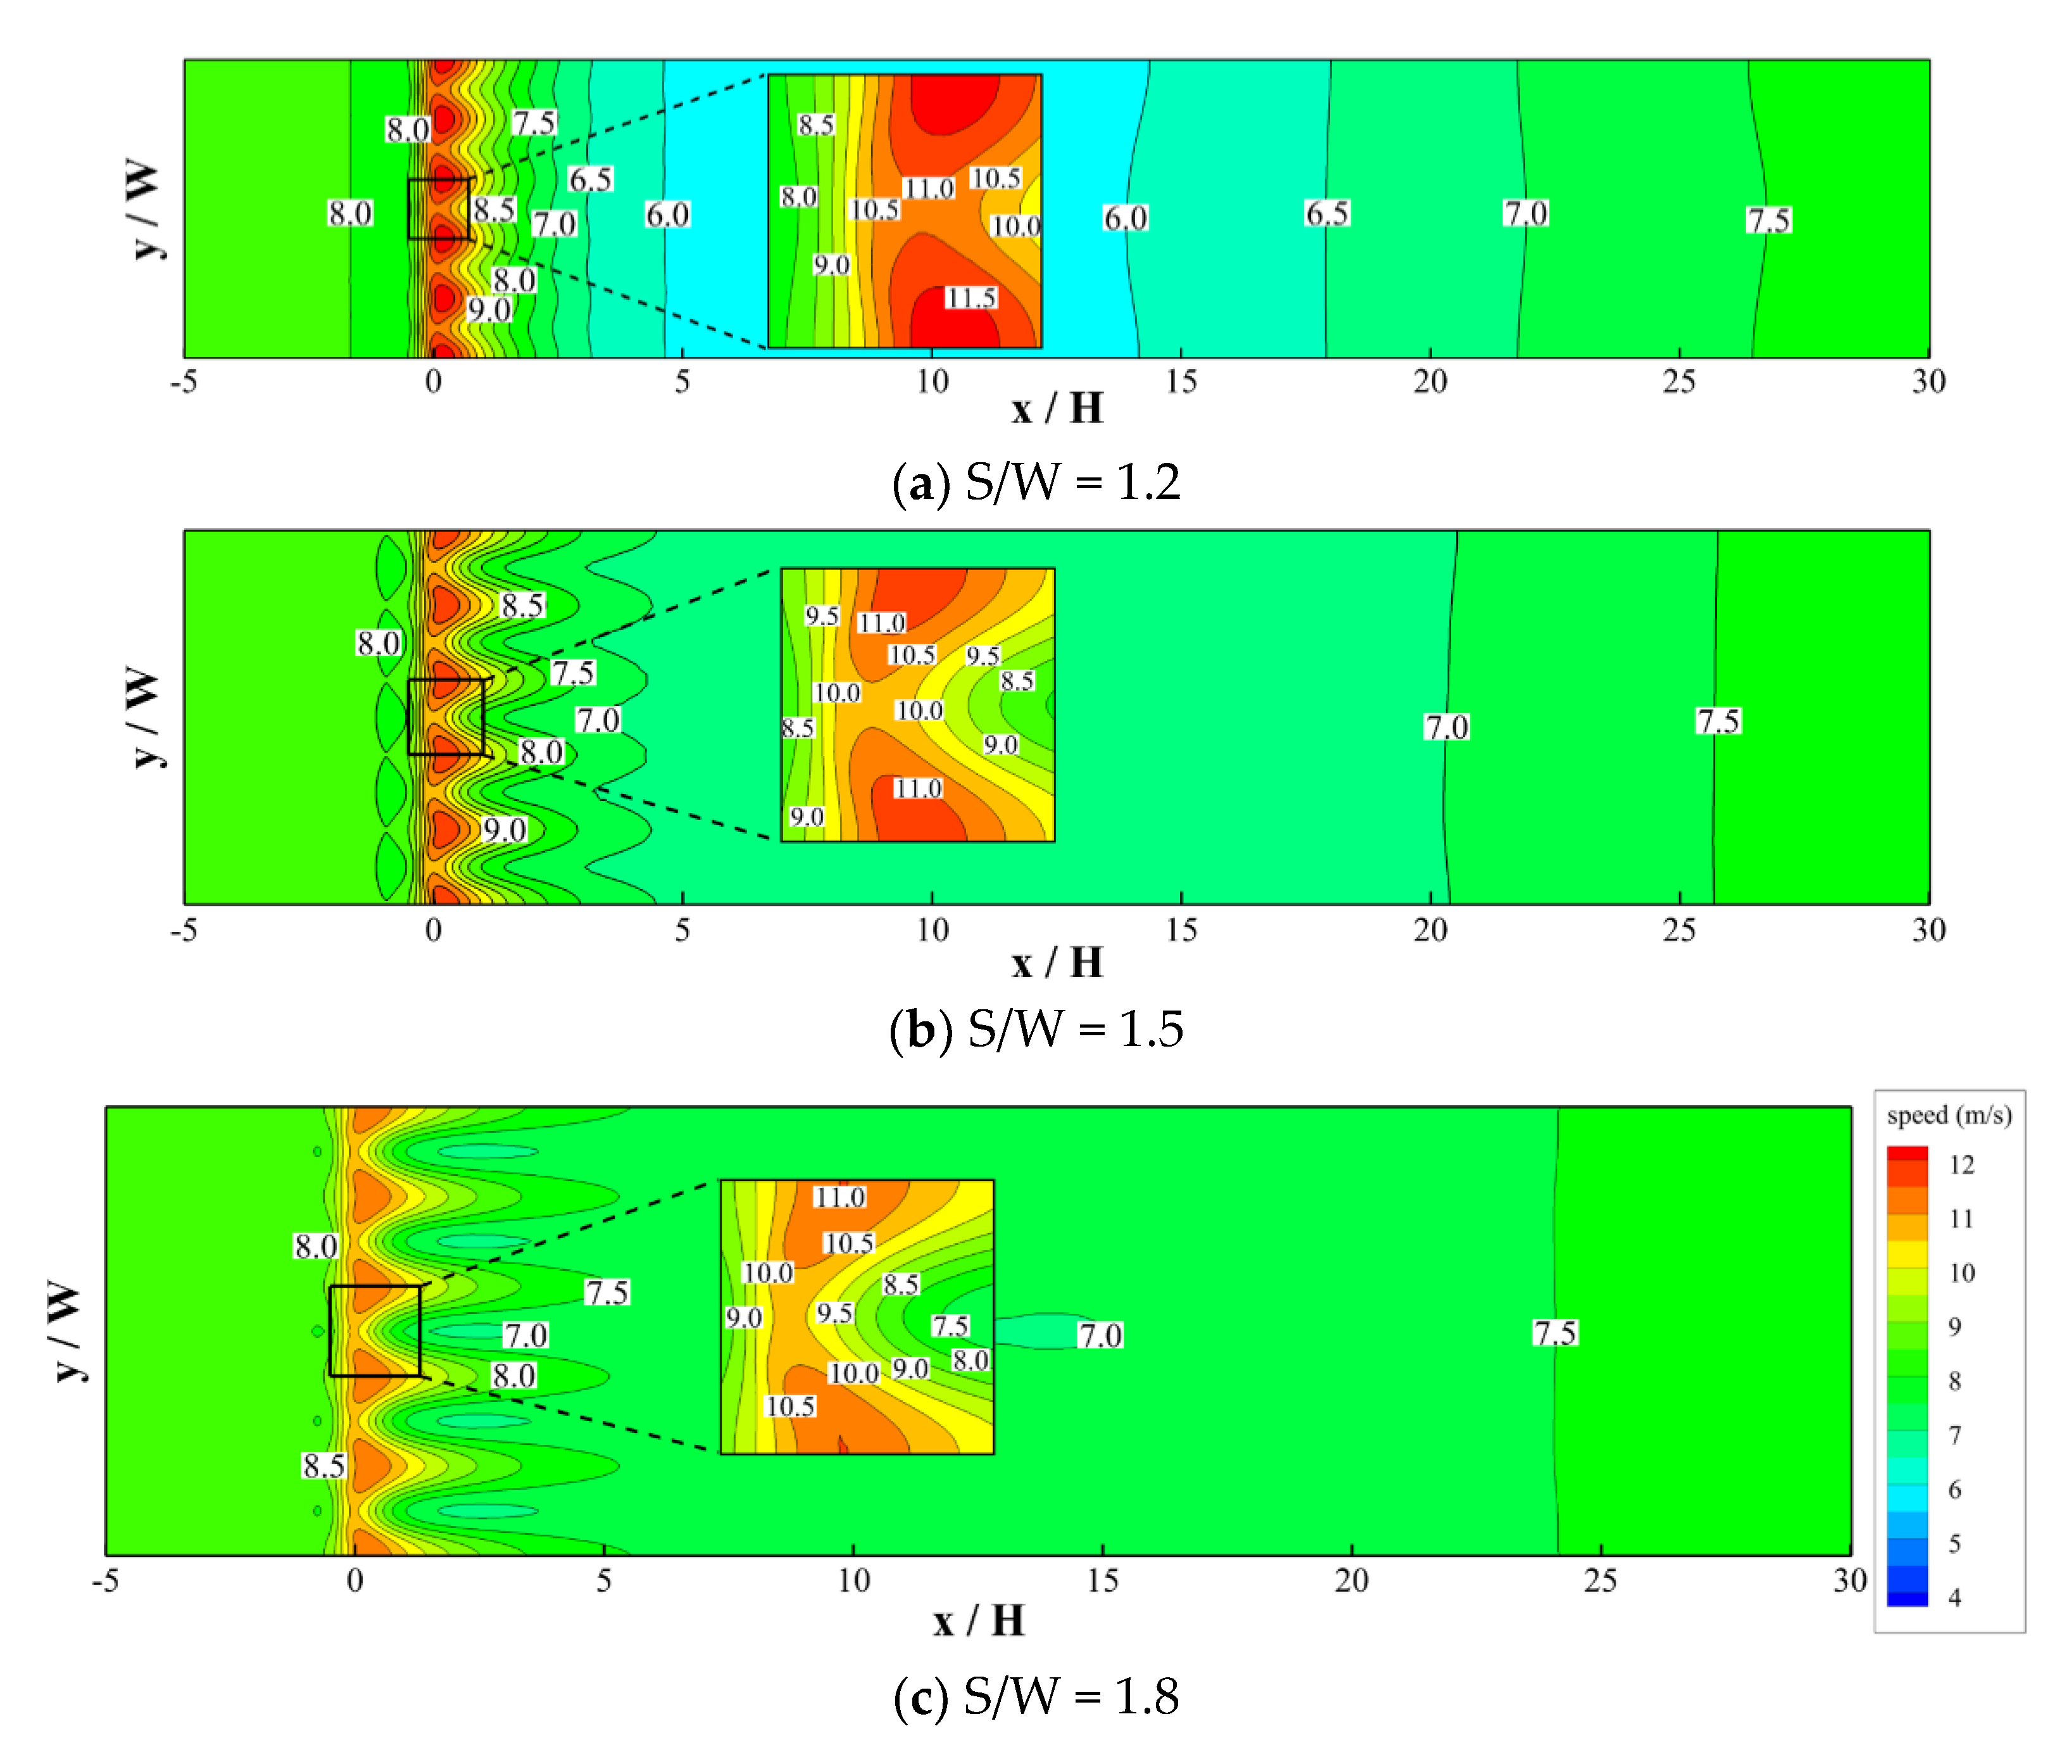
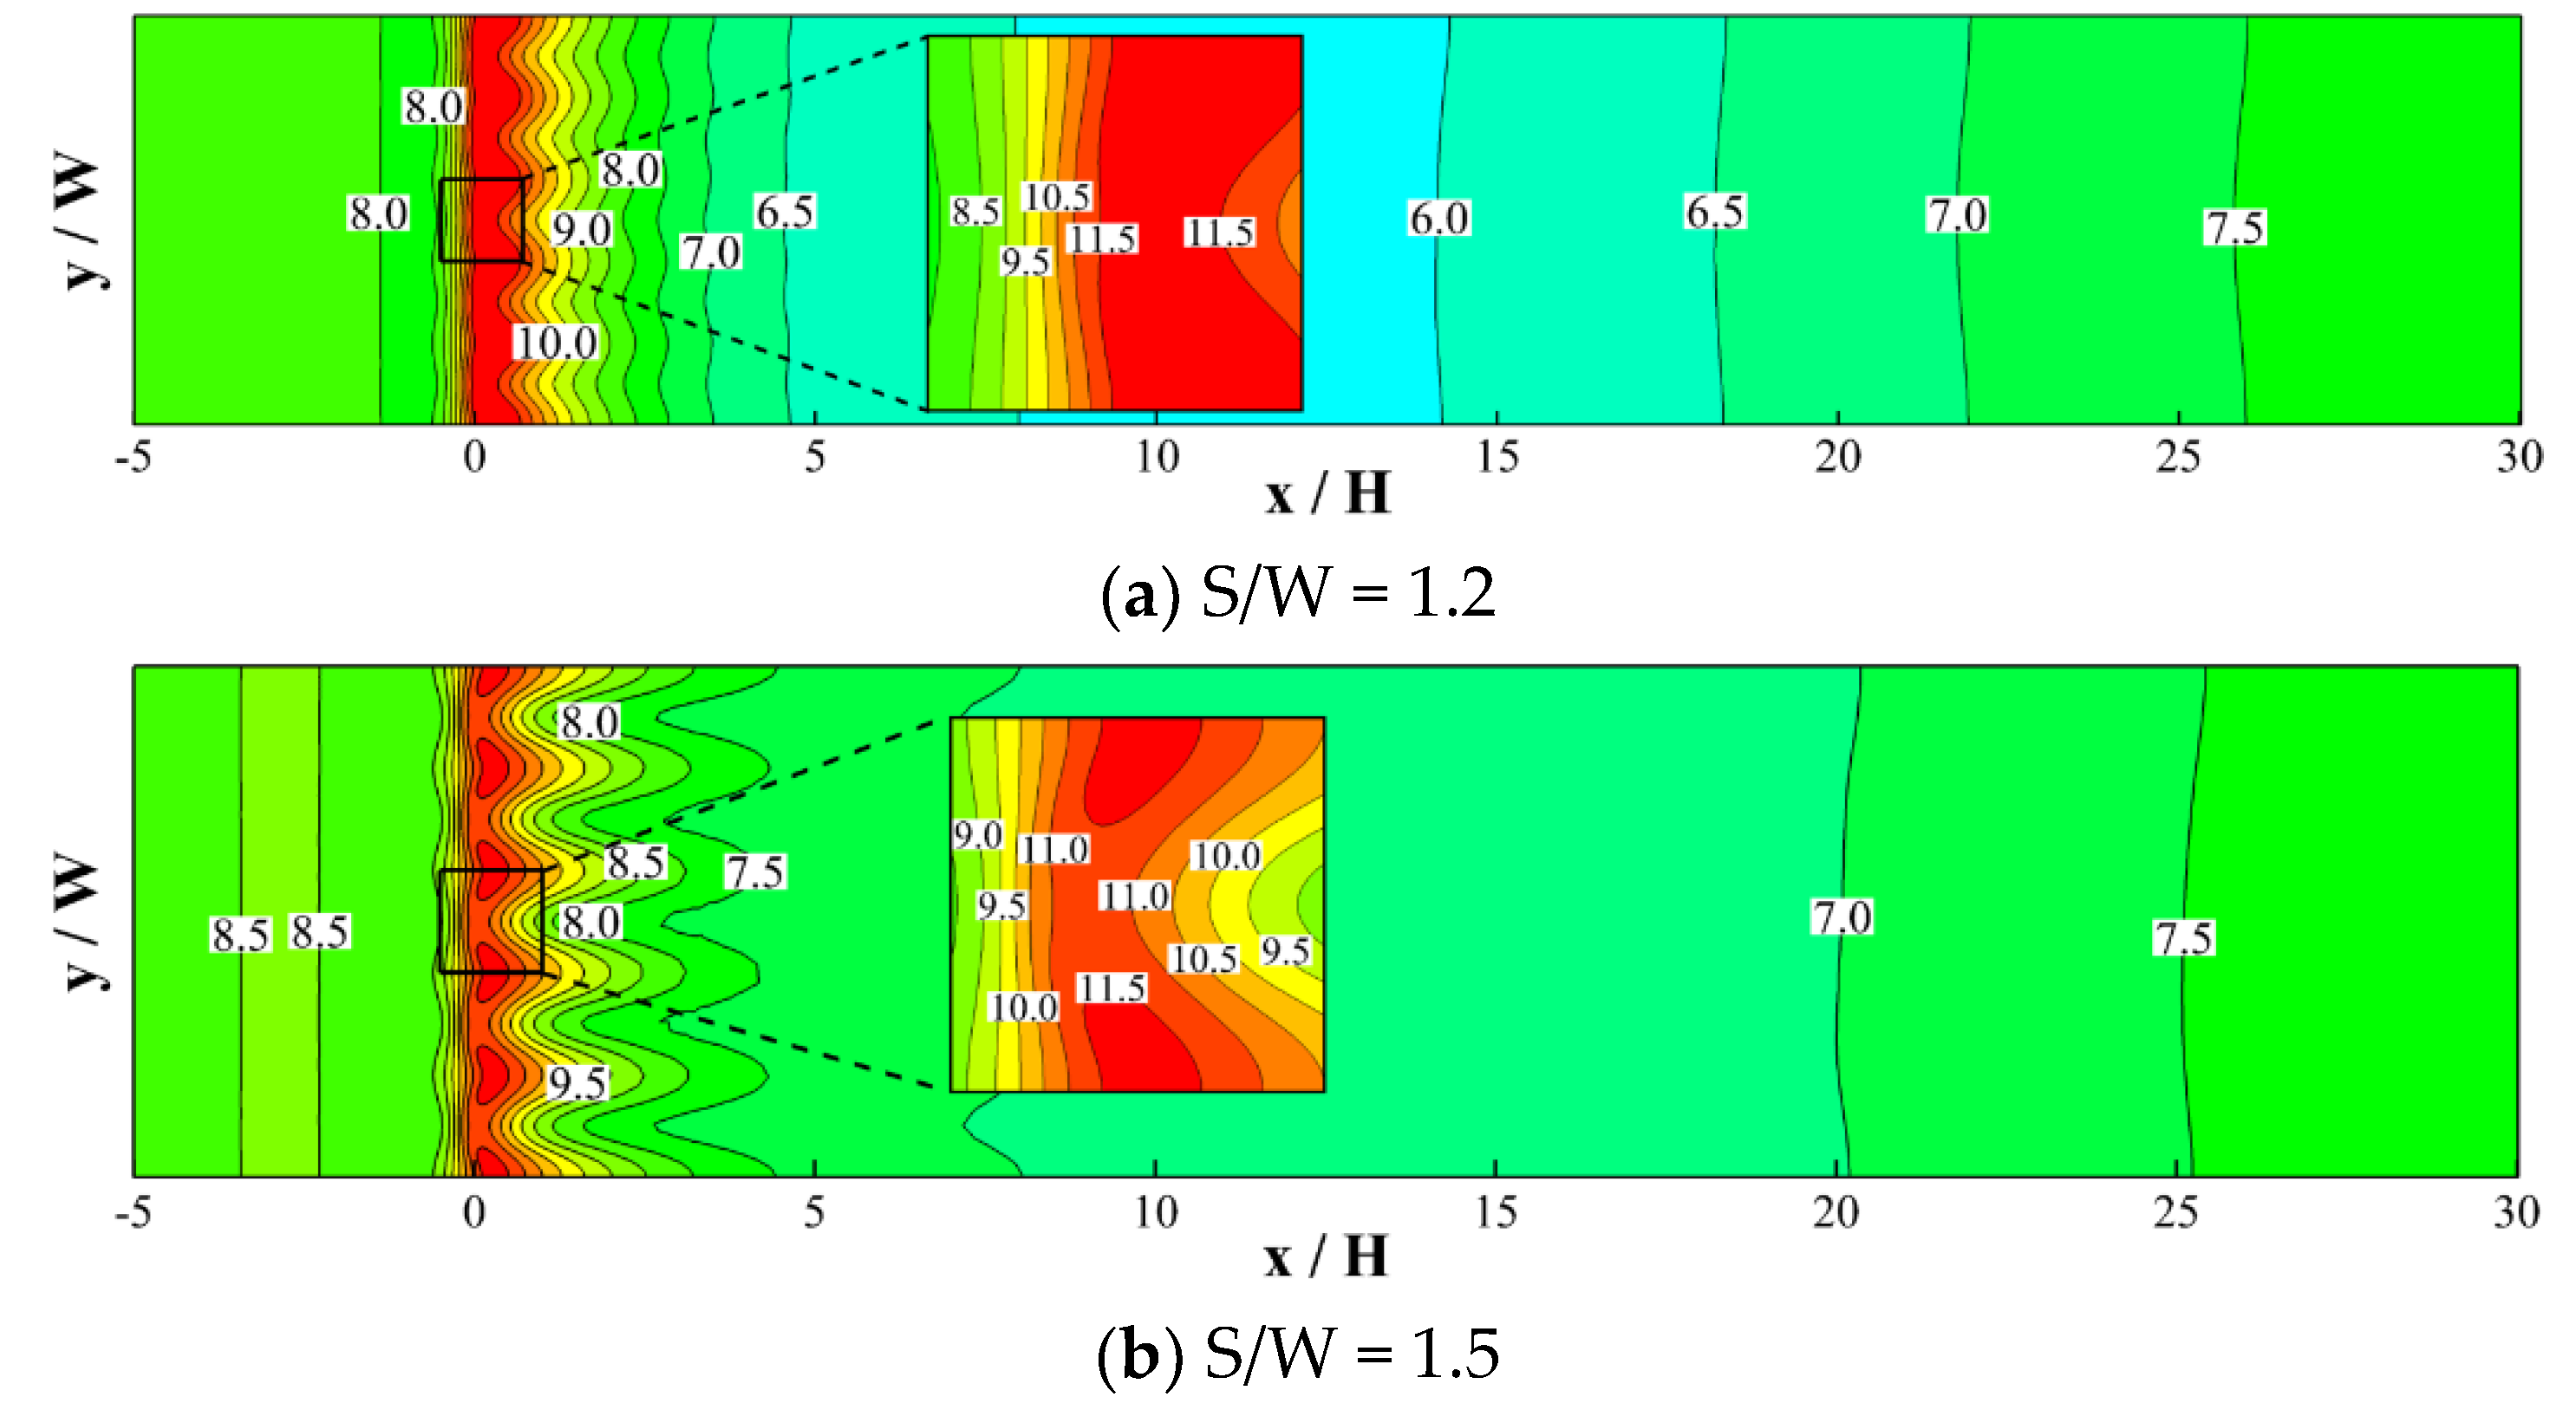
Based on the numerical results,
Figure 10,
Figure 11,
Figure 12 and
Figure 13 illustrate the wind speed contours at different tree heights (H) and tree spaces (S) at a ground level of 2 m, corresponding to a common upper limit for pedestrians. Generally, the tendency of wind speed variations at the pedestrian level shows that, as the oncoming flow approaches the trees, it tends to slow down. Lower velocities occur in part of the crowns. In the void spaces between trees, on the other hand, air flow is squeezed and speeds up. As a result, significant spatial deviations in wind speed patterns were found immediately behind the row trees. Further downstream, the extent of the speed deviation along the across-wind direction becomes milder, mainly due to the effect of flow mixing. In addition, wind speed gradually increases at greater downstream distances behind the trees.
Figure 8,
Figure 9,
Figure 10 and
Figure 11 also reveal that when tree space (S) or tree height (H) increases, the extent of across-wind velocity deviation becomes more significant and the overall downstream wind speeds tend to increase.
According to the predicted results in
Figure 10,
Figure 11,
Figure 12 and
Figure 13, the stream-wise variations of pedestrian-level wind were further analyzed by taking averages along the across-wind direction.
Figure 14 illustrates the patterns of the normalized mean stream-wise variations with respect to different tree space ratios (S/W) at different tree heights, where U
p and U
pi (=8.63 m/s) are the averaged wind speed and the starting wind speed of the oncoming flow, respectively, at a height of 2 m. These variation tendencies essentially quantitatively indicate the downstream shelter effect corresponding to different tree heights and spaces. In all cases, maximum values were found near the locations of the trees. Downstream of the locations of the local speed maxima, the cross-sectional averaged wind speeds decreased significantly until minimum values were reached. Further downstream, the wind speeds tended to recover gradually, far downstream.
By examining the magnitudes of the maximum pedestrian wind speeds at different tree heights and spaces,
Figure 15 shows that the magnitude of the local wind speed maxima appears insensitive to the change of the tree distance when H = 6 m. When the trees are taller, however, the value of the maximum wind speed becomes greater as the tree height increases or the tree space decreases. On the other hand,
Figure 16 illustrates the locations and magnitudes of the downstream minimum pedestrian wind speeds. In the cases of 6 m tree height, the location of minimum wind speed appears nearly independent of the tree space. When the tree becomes taller, the minimum value occurs further downstream with increases of the tree height and tree space. Meanwhile, the magnitude of the minimum wind speed generally increases as the tree height increases or the tree space increases.
9. Discussions
In the western coastal regions of Taiwan, many land development projects have been undertaken on certain reclaimed lands. Due to the action of strong winds that occur in the fall and winter seasons, the strength of near-ground wind speed often becomes great and thus degrades the comfort of local residents. To improve the outdoor living environment of humans on certain reclaimed lands, planting row trees has become an efficient method to reduce ground wind speeds. For the purpose of wind reduction, the appropriate selections of row-tree arrangements require more extensive studies.
The problem of wind past row trees is rather complicated since it involves a great deal of uncertainty, examples of this include concerned sheltered area, local meteorology, topography, the geometrical (shape, height) and physical properties (crown density) of trees, and so on. Even for a specific type of tree, the height, crown shape, and crown density can change at different growth ages or in different seasons. Depending on the protected region of concern, on the other hand, the selection of row-tree arrangements may be different. Therefore, to achieve definite guidelines for row-tree planting that are applicable in all real cases is somewhat impractical. Instead, by taking the problem with commonly adopted types of trees as a typical example, performing systematic analyses on the general behavior and tendency of flows behind the row trees, to achieve applicable knowledge to help the understandings of landscape planners, is considered one of the major goals of this study.
Since
Koelreuteria henryi is one of the most popular landscape trees adopted for row trees in Taiwan, it was selected as the example tree in the present study. By conducting additional analyses of the flow results, effects due to the changes in tree heights and tree spaces were extensively examined. The achieved quantitative information can be referenced in other cases of row trees with similar crown shapes and crown properties. There have been typical discussions and proposals [
21,
22,
23,
24,
25,
26] made available regarding the evaluations of the extent of pedestrian comfort under the action of wind. Accordingly, the quantitative information of the resulting spatial distributions of the pedestrian-level wind speeds at different tree heights and tree spaces (
Figure 10,
Figure 11,
Figure 12 and
Figure 13), as well as the corresponding stream-wise speed variations (
Figure 14), can be readily used to proceed with further shelter effect assessments and pedestrian comfort evaluations.
In the present study, systematic analyses were carried out based on the results of numerical flow computations. Different from other previous related studies, investigations concentrated on the wind fields behind the row trees at the pedestrian ground level. In cases with different applicable ground levels of downstream flows with different tree species, the applicability of the presented results may be limited. However, the executed procedure of the analyses should be applicable to similar related studies of wind flows behind trees
10. Conclusions
The aims of this study were to explore the features of flows behind row trees, which are beneficial to understanding landscape planning regarding ground wind protections, and to assess downstream wind shelter effects due to changes in tree heights and tree spaces on a systematic basis. Accordingly, the wind flow past a line of evenly-spaced row trees in an open territory was numerically investigated. By taking Koelreuteria henryi as the species of trees, the general behaviors of the flow behind the trees with various tree heights and tree spaces has been extensively discussed.
In the present study, tree heights and tree spaces varied from 6 m to 15 m and 1.2 to 1.8 crown widths, respectively, which should cover common reasonable ranges of practical row-tree planting. Therefore, the resulting wind fields at the pedestrian level also provided quantitative information to help in the assessment of the wind shelter effect and pedestrian comfort evaluation. In other cases, with similar crown shapes and properties for row trees, these results are considered referenceable and can be readily used to estimate the efficiency of wind protection by a selected row tree arrangement in the preliminary planning stage.
Finally, a demonstrative procedure of flow analyses behind row trees was presented. The steps of execution, including the determination of the crown factor (CDa), the numerical treatments of the crown retardation effects in the flow computations, and the assessments of the shelter effect behind row trees, can be used by future researchers and professionals dealing with such wind-flow problems.


