Abstract
Background and Objectives: As urbanisation is a significant global trend, there is a profound need for biodiversity protection in urban ecosystems. Moreover, the potential of urban green space to support urban biodiversity should be appreciated. Butterflies are environmental indicators that are sensitive to urbanisation. Therefore, it is important to identify butterfly distribution patterns and the factors influencing butterfly diversity and species composition in urban parks within cities. Research Highlights: To our knowledge, ours is the first study evaluating the effects of both land cover and local habitat features on butterfly species composition in urban parks of Beijing, China. Materials and Methods: In this study, we surveyed butterfly richness and abundance in 28 urban parks in Beijing, China. The parks differed in age and location in the urban area. Meanwhile, we investigated the green space in the surroundings of the parks at multi-spatial scales at the landscape level. We also investigated local park characteristics including the age of the park (Age), perimeter/area ratio of the park (SQPRA), area of the park (ha) (Area), green space cover within the park (Greenp), nectar plant species richness (Necpl), abundance of flowering nectar plants (Necabu) and overall plant species richness (Pl). Generalised linear models (GLMs) and redundancy discriminant analysis (RDA) were applied to relate butterfly diversity and butterfly species composition to environmental variables, respectively. Results: We recorded 3617 individuals belonging to 26 species from July to September in 2019. Parks on the city fringe had significantly higher butterfly diversity. Butterfly species richness was mostly related to total plant richness. The abundance of flowering nectar plants was closely linked to butterfly abundance. Land cover had little impact on butterfly diversity and community structure in urban parks. Conclusions: Once a park has sufficient plants and nectar resources, it becomes a useful haven for urban butterflies, regardless of the surrounding land cover. Well-planned urban parks focused on local habitat quality support butterfly conservation.
1. Introduction
By 2050, 68% of the world’s population is projected to be living in urban environments [1]. However, urbanisation is often regarded as a major threat to global biodiversity. Green space fragmentation, habitat differentiation, biotic homogenisation and even the concomitant biodiversity loss are caused by urban sprawl and the expansion of impervious surfaces [2,3]. Nevertheless, vegetation coverage in some cities has increased [4]. From 2001 to 2018, built-up areas in 325 large cities have had more than 10% of the land converted to green space [5]. Under such a scenario, urban areas, especially urban parks, still provide havens for biodiversity and have great conservation potential for numerous taxonomic groups [6,7]. This potential needs to be recognised by urban greening managers and city planners [8]. Hence, we could not ignore the biodiversity inside cities that interacts with the distinct characteristics of urban environments [9].
As a taxon of insects with certain requirements for micro-habitats, butterflies rapidly show intense responses to environment changes and so are convenient and practical indicators of environmental conditions [10,11,12,13,14,15]. In the rapid environmental changes resulting from reforestation and afforestation in built-up areas, the adaptability of butterflies to newly established parks is largely unknown. Learning how to preserve and promote diversity in urban butterflies is an important step in the sustainable development of urban ecosystems.
The negative responses of butterfly diversity to urbanisation gradients have previously been indicated in several related studies [16,17]. Conversely, other African and European studies have found no effect or positive effects [18]. The inconsistent process of urbanisation in conjunction with the historical development of cities has great effects on butterflies. Also, different species respond differently to urbanisation [19]. Generalist species, which have a wider range of larva diets, are less affected by urbanisation than specialists [10,11,20,21]. Nevertheless, some specialist species become urban adapters, for example, two Eumaeus species are following and utilising ornamental cycads to reproduce in urban areas [22]. Little is known about butterfly diversity and butterfly assemblage responses to urbanisation in fast-paced developing cities.
Previous research has suggested that landscape and local habitat characteristics shape butterfly community composition and distribution patterns [20,23,24]. Notably, vegetation composition, the abundance of nectar sources, presence and density of larval host plants and land cover at different spatial scales have been considered as potential factors influencing butterfly ecological patterns in cities [25,26,27,28,29,30]. Butterfly diversity has been claimed to have no significant relationship with landscape features [31,32,33]. Conversely, some studies have found that land cover at the landscape scale was more influential than resources at the local scale in butterfly species distribution [9,11,21]. Researchers have focused on whether butterfly diversity in urban parks is driven by land cover. Answering this question requires further analysis of local park features and surrounding landscape characteristics, and their interaction effects on butterfly diversity and species composition.
Our study focused on the urban area of Beijing. The urbanising processes within Beijing have caused significant shrinking and fragmentation of green space in the central areas of the city [34] and a decline in biodiversity in the urban area [35]. However, in the last few decades, Beijing has launched afforestation programmes and converted segments of abandoned impervious land into forests within the urban area [36]. These programmes have benefited regional biodiversity, and this is especially evident in the bird populations in Beijing’s urban centre and suburbs [37]. To our knowledge, we present the first study to evaluate the effects of both land cover and local habitat features on butterfly species composition in the urban ecosystems of Beijing, China. We hypothesised that butterfly diversity would increase with a decreasing urbanisation gradient and an increase in the completion time of the park. We expected that there may be some species that have adjusted to urban environments, and both the landscape and local scale characteristics shape butterfly species composition. The objectives of this study were: (1) to detect how butterfly diversity in urban parks responded to the urbanisation gradient; (2) to explore the distribution of butterfly species in parks along the urbanisation gradient; (3) to determine differences in the influence of land cover and local characteristics on butterfly diversity and community composition in urban parks.
2. Materials and Methods
2.1. Study Area and Sampling Sites
The study area encompassed the main urban area within the 6th ring road in Beijing. The total area is 2273 km2. Beijing (39°28′–41°05′ N, 115°20′–117°30′ E) is the capital of China, with a total area of 16,410.54 km2 and 21.54 million people in 2018 (http://nj.tjj.beijing.gov.cn/). Beijing has 88,704.05 ha of green space in total and 35,319.04 ha of these belongs to parks as of 2019 (http://yllhj.beijing.gov.cn/). Ring roads were built gradually from 1910 to 2018, and these roads present a “pancake-shaped” pattern [38]. Beijing has a north temperate zone sub-humid continental monsoon climate, with four distinct seasons, with high temperature and rain in summer and cold, dry winters (average annual temperatures in urban areas: 1.8–14.1 °C; average annual rainfall in urban areas: 450 mm–550 mm; http://bj.cma.gov.cn/).
We divided urban area of Beijing into five zones (hereafter UZs) following Su et al. 2011 [35] (Figure 1, Table 1). The divisions were based on the spatial pattern of the ring roads and the proportion of impervious surfaces (PIS) in Beijing’s urban area [39]. The division provides an obvious urbanisation gradient that urbanisation decreases from UZ1 towards UZ5 [35]. UZ1 represents the most urbanised area and urban centre, and UZ5 represents the least urbanised one and the urban fringe area.
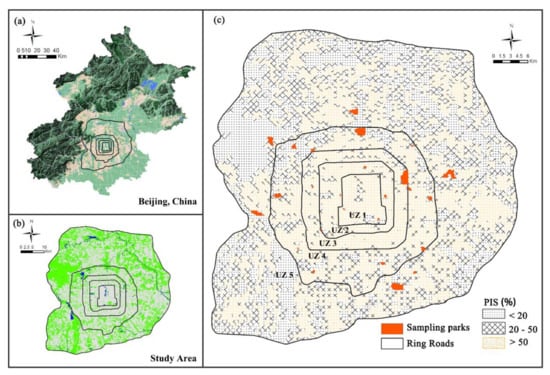
Figure 1.
(a) Map of Beijing with the study area location within the 6th ring road; (b) Land cover of study area was classified into three groups: Green (green space), Grey (impervious surface) and Blue (water); (c) 28 sampled parks located within the 6th ring road of Beijing. We overlaid an image of Beijing within the 6th ring road with grids (each grid cell 1 × 1 km). The proportion of impervious surfaces (PIS) is the proportion of impervious surface areas within each grid cell.

Table 1.
Descriptions of the five urban zones divided based on the ring-road systems of Beijing [35].
We chose 28 parks distributed evenly throughout Beijing’s urban area along eight geographical directions (Figure 1). The park areas were 1.8–268 ha, the number of parks per UZ was 3–11 and the PIS surrounding the park at the 1 km spatial scale was 13.81%–90.95% (Table A1). The age of the parks was 2–489 years. We divided park age into three groups: less than 11 years (seven parks); 11–20 years (ten parks) and more than 20 years (11 parks). More details about parks are provided in Table A1.
2.2. Butterfly Sampling
For the data to reflect all the microhabitats within the parks, we used two types of surveys: path transects and plot counting. We set up transects of different lengths from 0.5 to 9 km based on the park size (Table A1). Transects were distributed along the paths of the whole park. Two – thirteen plots of 20 × 20 m were surveyed for each park to reflect the microhabitats within the parks (Table A1). The transects and plots did not intersect. Each transect or plot was surveyed three times at monthly intervals (ranging from 2 July to 28 September 2019). A total of 76 km transects and 164 plots in 28 urban parks were investigated each survey period.
For the transect observations, we traversed the fixed transects at a constant pace and recorded all adult butterflies within 2.5 m on the left and right and 5 m above and in front of the route, and lasting 20 min for 500 m on average [42]. For plot observations, we observed each 20 × 20 m sample plot for 10 min. Butterfly recordings were performed in good weather conditions with clear sky and limited cloud cover when the temperature is above 13 °C [42]. The sampling was conducted from 8:30 to 17:00 in a day. In each survey period, we randomised the survey order of transects and plots each day. This process ensured even coverage by the survey within each day to reduce the effect of weather and time of day variations. The observation involved two researchers: one person was recording butterfly species and abundance, and the other was investigating environmental variables. Butterflies that could not be visually identified (to the species level) in flight were captured with an insect net and released after identification. If identification could not be confirmed, the butterfly was collected and taken to the laboratory for identification using butterfly guide books and local species lists [43,44,45].
To collate butterflies with similar species-specific traits in the urban environment, we classified the butterfly species based on resource utilisation patterns of the species. We used the classification system designed by Kitahara and Fujii [46] that is based on both larval resource breadth (i.e., range of host-plant species used by larvae) and voltinism (i.e., number of generations per year). We classified butterflies into four groups as follows: (1) Typical Specialists (TS), which are univoltine or bivoltine species with only one plant family as larval host plants. (2) Typical Generalists (TG), which are multivoltine species (more than two generations per year) with more than one plant family as larval host plants. (3) Rebound specialists (RS), which are multivoltine species with only one plant family as larval host plants. (4) Selective Generalists (SeG), which are univoltine or bivoltine species with more than one plant family as larval host plants.
We used the full transect and plot datasets. Butterfly diversity was measured using species richness (number of species) and abundance (number of individuals) in each park. The observations for the three surveys were summed up for each species. The cumulative number of species was species richness of each park. Due to non-uniform surveying time of each park, we standardised the abundance of each species in each park to those observed within 10 min and standardised abundance datasets were used in the analyses.
2.3. Quantification of Environmental Characteristics
The environmental variables recorded represented environmental characteristics at two spatial scales: the landscape scale and local scale. The landscape scale environmental variables were defined as the urban matrix scope beyond the park. This data reflected the influence of land cover on butterfly dispersal. The local scale environmental variables were defined as variables inside parks, reflecting the impact of the habitat characteristics on the survival and reproduction of butterflies.
Landscape variables: we used proportion of green space—defined as space primarily covered by vegetation in buffers of 50-, 150-, 250-, 500-, 1000-, 2000- and 3000-m distance around these parks to characterise the availability of potential habitats at different spatial scales. Based on previous studies on butterfly diffusion traits [40] and the effect of factors on butterfly diversity at multiple spatial scales [20,35,47,48,49], we chose these buffer sizes, which could be valid at the mesoscale and macroscale [50]. Green spaces surrounding parks would be regarded as potential habitats for butterfly dispersal. We identified and preprocessed digital images by Landsat 8 OLI_TIRS on 10 July 2017. The land cover was classified into green space/water/impervious surface (including buildings, roads, and squares) using ENVI 5.3 [51] and the supervised classification maximum likelihood method. We calculated the proportion of cover in each spatial scale from the park boundary using ArcGIS 10.2 [52]. There was multicollinearity between landscape variables at 150, 250, 500 m spatial scales and 1000, 2000, 3000 m spatial scales, respectively. Therefore, we conducted two Principal Components Analyse (PCA), one at 150, 250 and 500 m and the second at 1000, 2000 and 3000 m spatial scales. The first two principal components accounted for 97.09% (Green2) and 86.63% (Green3) of the total variance in the green space cover at 150, 250 and 500 m, and 1000, 2000 and 3000 m, respectively (Table A2). The first principal-component axis at 150, 250 and 500 m (Green2) showed the green space cover at the mesoscale as the first principal-component axis. The first principal component of the analysis at the spatial scale of 1000, 2000 and 3000 m (Green3) was the green space cover at a larger spatial scale. The green space cover at the 50 m scale did not interrelate with the other spatial scales, so it was analysed independently, creating the Green1 variable (Table 2).
Table 2.
Environmental variables were collected for each park and entered into the Generalised linear model and the redundancy analyses.
Local variables: for the local scale analysis, we chose seven variables related to park attributes and resource status (Table 2): (1) The completion time of the park (Age) is defined as years since the establishment of the park up to 2019. Park age would represent vegetation greening time, especially for trees. (2) Square root of the perimeter/area ratio of each park (SQPRA) reflects the shape index of the park with its edge effects. (3) Area covered by the park (Area) (ha). (4) Proportion of green space within the park (Greenp) reflects the overall availability of green space in the park. Based on the field survey and park information, we drew a boundary for each park, and then calculated the area (Area), and the square root of the perimeter/area ratio of each park (SQPRA) and the proportion of green space within the park (Greenp) using ArcGIS 10.2. The edible resources for adult butterflies are mainly nectar, sap and other minerals. To facilitate the quantification of resources, we selected the most important and convenient resource indicators of each park, namely: (5) nectar plant species richness (Necpl), (6) abundance of flowering nectar plants (Necabu) and (7) overall plant species richness (Pl).
During the butterfly monitoring, we investigated the plant species within each 20 × 20 m plot in each park. Due to the obvious seasonal variation in herb composition, five 1 × 1 m herb plots were investigated within each 20 × 20 m plot during each butterfly survey. Nectar plants were those recorded to have butterflies probing their flowers with proboscides [53]. Cumulative plant species richness and nectar plant species richness within each park were calculated for each park. We summed up the product of coverage ratio and the flowering ratio of each nectar plant as flowering abundance of five 1 × 1 m plots within each 20 × 20 m plot. The average flowering abundance of nectar plants of all plots within each park was applied as the abundance of flowering nectar plants (Necabu).
2.4. Statistical Analyses
Butterfly species richness and abundance were assessed for normality using the Shapiro-Wilk test prior to analysis. We used a normal log-transformed for butterfly species abundance dataset. One-way ANOVA was used to compare butterfly species richness and abundance among urban zones and park greening establishment times, respectively. If any ANOVA results contained significant differences, then we performed the LSD test for multiple pairwise comparisons. Differences were considered significant at p < 0.05.
The analyses involved the Generalised linear regression model (GLM) with a Poisson error structure and log link functions to evaluate the effect of the 10 environmental characteristics (Table 2) on butterfly species richness. We also used the Generalised linear regression model (GLM) with a Gaussian error structure and identity link function to evaluate the effects of 10 environmental characteristics (Table 2) on butterfly abundance. All models were ranked according to the Akaike Information Criterion value (AICc for small sample size) for best-fit selection [54]. △AICc is the difference between the AICc value of the ‘best’ model and the AICc value of the selected model. Since only basing an inference on the ‘best’ model can ignore other models that are also quite plausible, we listed a set of models with △AICc < 2 which are considered as good as the best fitted models [55]. To evaluate the relative importance of each variable appearing in the selected best models, we estimated cumulative weights of each variable across all models that included the variable under consideration [54].
Redundancy discriminant analysis (RDA) was used to investigate the changes in species composition of butterflies with environmental variables [56]. A Detrended correspondence analysis (DCA) was carried out preliminarily, and the result showed that the length of the first ordination axis (1.4205) was less than three, which revealed that RDA was more appropriate for this dataset than canonical correspondence analysis (CCA) [57]. A total of 999 Monte Carlo permutation tests were used to assess the significance of the relations between species distributions and environmental variables. The 10 environment variables used for the GLMs analysis were also used in the RDA analysis. Species with less than three records were removed from the RDA analysis, while abundance data were Hellinger-transformed to down-weight the influence of extreme values.
Data analyses were performed with R 3.5.1 using the packages “agricolae” [58], “MuMIn” [59], “AICcmodavg” [60], “vegan” [61], “circlize” [62], and “ggplot2” [63].
3. Results
3.1. Butterfly Abundance and Species Composition
3617 individual butterflies were observed, belonging to 26 species from four families (Table 3). Of the 26 species, 1, 5, 8 and 12 species belonged to the family Papilionidae, Pieridae, Lycaenidae and Nymphalidae, respectively. The recorded butterfly species richness per park ranged from 1–20 species. Additionally, the recorded range of butterfly abundance of each park within 10 min was 0.18–5.42 individuals.
Table 3.
The relative species abundance and frequency of the four butterfly groups. The relative species abundance relates to the proportion of the number of individuals of each species relative to the total number of butterflies. The relative frequency relates to the proportion of parks where each butterfly species was distributed relative to the total number of parks.
The butterfly group classification revealed that the ubiquitous group comprised Typical Generalists (TG). Typical Generalists accounted for 10 species and 2616 individuals. The second most abundant group comprised Rebound Specialists (RS), accounting for 7 species and 672 individuals. Selective Generalists (SeG) were widespread in all sampling parks, although the richness and abundance were lower than for the previous two groups (Table 3), with only 4 species and 279 individuals. Finally, the distribution range of Typical Specialists (TS) was limited with only 5 species and 50 individuals (Table 3). In four parks, only TG were recorded. All four butterfly functional groups were distributed in nine of the urban parks.
Species abundance was significantly correlated with the number of parks in which the species was observed (p < 0.01); common butterflies were more widely distributed among parks. More than half of the recorded butterflies were Pieris rapae (Linnaeus, 1758) (50.79%) (Figure 2). The relative abundance of 16 species (57.14% of species) was less than 1% (Table 3). Only P. rapae was observed in all 28 parks. Pontia daplidice (Linnaeus, 1758) and Polygonia c-aureum (Linnaeus, 1758) occurred in 20 parks, while Tongeia filicaudis (Pryer, 1877) was present in 17 parks. Six species (23.08% of species) including Timelaea maculata (Bremer & Grey, 1852), Neptis rivularis (Fabricius, 1807), Pieris canidia (Linnaeus, 1768), Lasiommata deidamia (Eversmann, 1851), Neptis sappho (Pallas, 1771) and Leptidea morsei (Fenton, 1882) were only observed in one park (Table 3).
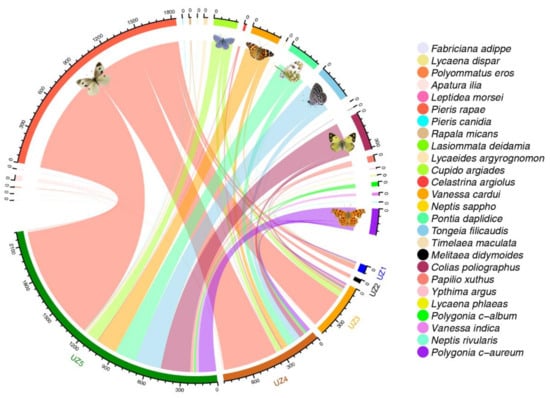
Figure 2.
Distribution of 3617 individuals within 26 butterfly species in five urban zones (UZ1–5) in Beijing, China. The presence of a link means that the species is distributed in this urban zone. The width of the links between butterfly species and each urban zone show the distribution extent of the butterfly in this urban zone. Scale numbers around the top half of the circle indicate the number of each butterfly species. Scale numbers around the lower half of the circle indicate the number of butterfly individuals distributed in each urban zone. Each relatively abundant butterfly species is graphically marked with realistic images.
3.2. Butterfly Diversity Distribution Pattern
Butterfly species richness and abundance at the urban fringe (UZ5) were significantly higher than in the urban areas (UZ1–4) (p < 0.01; Figure 3). All 26 butterfly species were recorded in UZ5, while only four species were observed in UZ2 (Figure 2). Three species (P. rapae, P. c-aureum and T. filicaudis) were widespread in all urban zones (UZ1–5). Nine species were only recorded in the urban fringe (UZ5) (Figure 2). Butterfly diversity of TS (both richness and abundance) did not vary significantly among all urban zones. Conversely, TS were not observed in the urban centre (UZ1). Butterfly diversity of the other three groups was significantly different between UZ5 and UZ1–4 (p < 0.05) (Figure A1 and Figure A2).
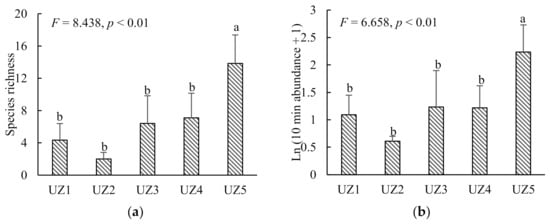
Figure 3.
Differences of butterfly species richness (a) and abundance (b) (mean ± SE) among five urban zones (UZ1, urban core; UZ5, urban fringe). Different letters above the bars indicate significant differences at p < 0.05.
Butterfly species richness and abundance were not significantly different with the age of the urban parks (p > 0.05). Fifteen butterfly species were distributed in parks of all three age groups.
3.3. Butterfly Community Response to the Urban Environment
The confidence of the best-fit models that stemmed from the multi model inference is shown in Table 4. Butterfly species richness was significantly positively affected by plant species richness, park area, and flowering nectar plants abundance at the local scale (Table 4 and Table 5). Butterfly abundance was significantly positively affected by flowering nectar plants abundance at local scale (Table 4 and Table 5). Green space cover at a 50 m spatial scale (Green1) was the only significant factor included in the ‘best’ butterfly abundance models among three landscape variables (Table 4).
Table 4.
Best-ranked Generalised linear models (GLMs) for evaluating butterfly species richness (Rich) and abundance (Abun) in urban parks of Beijing, using the AIC corrected for small sample sizes (AICc), the differences in AICc (ΔAICc = AICci − AICcbest) and model’s Akaike weight (wi). Only models with ΔAICc < 2 were considered in model averaging. The coefficients of determination (R2) of the models are also shown. Significant variables for each model and variables are marked as ‘***’: p < 0.001, ‘**’: p < 0.01, ‘*’: p < 0.05 and ‘.’ p < 0.1. The explanatory variables presented in the best models are plant species richness (Pl), park area (Area), flowering abundance of nectar plants (Necabu), park completion time (Age), the perimeter/area ratio of each park (SQPRA), the proportion of green space cover within 50 m of the park boundary (Green1) and the PCA axis explaining the highest variation in the proportion of green space cover within 1000 m, 2000 m and 3000 m from the park boundary (Green3).
Table 5.
Model-average coefficients (±SE) for all variables included in the best-ranked models (i.e., those with ΔAICc < 2) and cumulative model weights (Rich: butterfly species richness; Abun: butterfly abundance). The explanatory variables presented in the best models are plant species richness (Pl), park area (Area), flowering abundance of nectar plants (Necabu), park completion time (Age), perimeter/area ratio of each park (SQPRA), the proportion of green space cover within 50 m of the park boundary (Green1) and the PCA axis explaining the highest variation in the proportion of green space cover within 1000 m, 2000 m and 3000 m from the park boundary (Green3).
The RDA identified five significant environmental variables as explanatory variables. A total of 30.87% of the variance of the butterfly community was accounted for by the first two axes. The adjusted R2 of the model was 0.2248. Monte Carlo permutation tests demonstrated that four patch variables (Area, SQPRA, Necpl and Age) but no landscape variables significantly influenced the butterfly community structure. Nectar plant species had the greatest influence (Necpl: F = 3.0447, p = 0.006; Area: F = 2.9410, p = 0.007; Age: F = 2.484, p = 0.016; SQPRA: F = 2.4214, p = 0.028; Pl: F = 1.9396, p = 0.058; Figure 4).
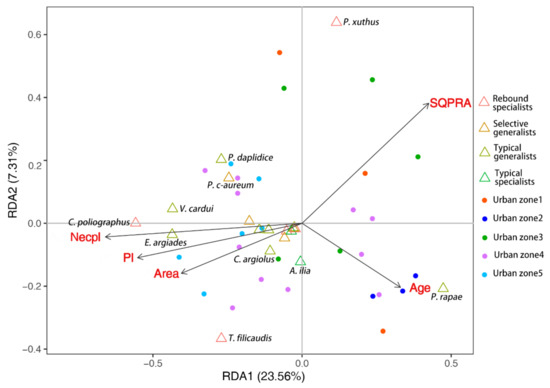
Figure 4.
Redundancy analysis plot indicating the influence of each significant explanatory variable (p < 0.05) on the butterfly community structure. The variables include plant richness (Pl), nectar plant richness (Necpl), park area (Area), age of park (Age) and the square root of the perimeter/area ratio (SQPRA). The triangles represent the butterfly species. The four butterfly groups are represented by different colors. The circles represent the sampling sites. The sites within the five urban zones are shown in different colors.
Most species such as P. daplidice, Colias poliographus (Motschulsky, 1860), Vanessa cardui (Linnaeus, 1758), T. filicaudis, Evere argiades (Pallas, 1771) and so on were mainly associated with large, simple shaped parks that were rich in plant species, especially nectar plants (Figure 4). It is worth noting that the distribution trends of the widespread butterflies (P. rapae and Papilio xuthus (Linnaeus, 1767)) were quite different from the other species. The distribution of P. rapae was negatively correlated with Necpl, Pl and Area, but positively correlated with SQPRA and Age. Similarly, the distribution of P. xuths was negatively correlated with Necpl, Pl, Area and Age, but positively correlated with SQPRA (Figure 4).
4. Discussion
Butterfly species richness (26 species) in this study was slightly lower than that recorded in previous studies in Beijing and other large cities in the East Palearctic zoogeographic region. For example, 31, 30 and 31 butterfly species were recorded in 10 Beijing urban parks in 2017 [64], in Osaka City, Japan [65], and in four urban parks in Seoul, South Korea [66], respectively. Our investigation commenced in July and, therefore, missed some spring-flying species. In the 1990s, there were more than 80 species in Beijing’s urban and suburban districts, and more than 40 species in the urban area and suburban plains [67]. In suburban areas, some species such as Eurema hecabe (Linnaeus, 1758) and Lampides boeticus (Linnaeus, 1767), which were common in the 1970s to the early 1980s, were already rare in the 1990s [67], and were not found in this study. Butterfly distribution is strongly linked to the distribution of host plants and nectar sources. The increase in impervious surfaces has resulted in the local disappearance of natural host plants. Butterflies dependent on these species are rarely found, even though there may be non-native cultivated plants in pots in some impervious areas.
4.1. Butterfly Diversity and Species Composition Response to Urbanisation
Butterfly diversity within UZ5 was significantly higher than in the other urban areas (UZ1–4) (Figure 3). All 26 species were recorded in UZ5 (Figure 2). This may be due to the relatively low ratio of impervious surface area (50.72%) in this area (Table 1). There are also many green spaces beyond the parks in UZ5. The green space cover surrounding parks at the 50 m scale and at the spatial scale larger than 1000 m in UZ5 was significantly higher than in UZ1–4 (Table A3) (p < 0.01). Furthermore, a variety of available habitats and natural mountains (rich in wild vegetation with less fragmentation) are in the urban-rural ecotone [68]. The total plant species richness and nectar plant species richness in UZ5 were significantly higher than in the other zones (p < 0.01) (Table A3). Moreover, the nectar abundance in UZ1 and UZ5 was significantly higher than in other regions (p < 0.01) (Table A3). Above all, there were significant differences in land cover and plant resources among different urbanised areas, which might have caused discrepancies in butterfly assemblages.
Like a previous study [69], specific species traits showed different responses to the urbanisation gradient (Figure A1 and Figure A2), and this makes sense for the comprehension of butterfly species distribution patterns below the community level. Typical Generalists, such as P. rapae, E. argiades and V. cardui, were well adjusted to urbanised environments. Beyond our expectations, the second adaptive group was RS, which were not predicted to occupy urban areas due to their restrictive specific larval resources. However, adult butterflies of multivoltine species have extended flight periods and may have more opportunities to disperse to find suitable habitats [46,70]. Additionally, they are more easily observed. We assumed that some larval food plants were common indigenous wild plants in Beijing or cultivated plants widely used in urban parks, such as Sichuan pepper (Zanthoxylum bungeanum), Vicia spp. and Hylotelephium erythrostictum (larval host plants of P. xuthus, C. poliographus and T. filicaudis, respectively). These ample food resources would have greatly contributed to the survival of RS butterflies. Compared to other species, the distributions of P. rapae and P. xuthus were negatively correlated with habitat resources variables namely plant species richness and nectar plant species richness. It seems they are capable of adjusting to the urban environment [17,71]. To our knowledge, P. rapae is widespread worldwide and is highly tolerant of urban environments. Furthermore, the widespread distribution of Sichuan pepper might create artificial niches for P. xuthus and the effect of specific host plant abundance should be considered in the future.
4.2. Factors Affecting Butterfly Diversity and Species Composition in Urban Parks
4.2.1. Local Variables
Contrary to our assumptions, the age of parks only showed a weak but not statistically significant negative effect on butterfly species richness. Moreover, there was no significant correlation between the urban butterfly species richness and park age in Shenzhen [72], Beijing [64] and the Federal Territory of Kuala Lumpur [73]. Well-designed newly built parks were proven to become available habitats for butterflies within a short time.
Firstly, butterfly species richness was found to be most sensitive to total plant richness (Pl), which varied significantly in the urban parks of Beijing (Table A3 and Table A4). Contrary to some studies [32,74,75], we did not confirm any influence of the richness of nectar plants on butterfly diversity. Nonetheless, nectariferous plant abundance had the strongest connection with butterfly abundance (Table 4 and Table 5). Similar positive effects were also identified by other studies [48,76]. If butterfly species are generalists and opportunists who prefer nectar, then the majority of flowering plants are suitable resources if the site also contains potential larval food [77,78]. Although diet differences among species exist, TG are the ubiquitous butterfly group in the urban parks of Beijing and most urban butterflies are generalist nectar feeders as adults (Table A4). We speculated that butterfly-nectar network structures in Beijing urban parks tend to be quite generalised, and a small number of nectar plants may support the majority of butterflies. As we recorded the nectariferous plants (Table A5), construction of the butterfly-nectar network could identify specific key nectar resources would be of great assistance in the design of urban green spaces and plant species selection.
Above all, we found that local habitat resources available through the plants had the greatest influence on butterfly diversity. Several studies have also described strong positive relationships between butterfly diversity and local plant resources in urban green space [32,71,79]. Thus, it is advisable to maintain sufficient sources of nectar and rich diversity of plant species in urban areas to maintain a high level of butterfly diversity. For instance, Guangyanggu Urban Forest Park (3.44 ha) in UZ1 has only existed for two years, and the Proportion of impervious surface (PIS) within the 1 km surrounding the landscape spatial scale was 86.73% (Table A1), but its high plant diversity and rich nectary plant resources attracted a variety of butterflies (seven species). If urban parks were constructed to promote plant diversity and abundant sources of nectar, they could also become favorable habitats and refuges for butterflies even if they are surrounded by impervious urban surfaces. The designers of Guangyanggu Urban Forest Park created plant communities modeled on the natural community. Based on high resolution imaging, studies on microhabitat structure in urban parks, such as spatial distribution of microhabitats, tree canopy and management interventions of microhabitat would provide more insight into the local drivers of butterfly diversity patterns in further study.
The best-fit models for both butterfly species richness and abundance (Table 4) also included the park area (in hectares). Conversely, Sing et al. [64] found no significant correlation between butterfly richness and park area in Beijing urban parks. In this study, we incorporated additional sampling sites distributed evenly throughout the urban area of Beijing. A similar significant positive relationship between species richness and fragment size was also found in Tokyo, Japan [80]. The urban area of Beijing is completely urbanised and, while the urban matrix is not a viable habitat for many organisms, parks could be regarded as good-quality patches for urban biodiversity conservation. The complexity of park shape (SQPRA) had a negative effect on the butterfly community (Figure 4). The more complex the patch shape, the greater the negative edge effects on the highly urbanised matrix. Therefore, a compact (low-edge) patch shape and particularly a circular patches are beneficial for biodiversity conservation [33,81].
4.2.2. Landscape Variables
Our results do not strongly support the hypothesis that both landscape variables and local habitat variables shape the butterfly community. For landscape variables, green space at multi-spatial scales had little influence on butterfly richness and abundance in the urban parks of Beijing. In contrast, some studies [21,50] concluded that land cover is more important than resources for butterfly community structure in urban areas, and the impact of adult and larvae food resources on the butterfly community was lower than that of artificial cover. Tzortzakaki et al. [21] focused on butterfly diversity in all urban land-use types, and determined that a buffer with a 200-meter radius drives butterfly diversity at all landscape scales in the urban environment. In contrast, we focused on urban parks that are primary potential butterfly habitats in the city, and selected a multi-spatial buffer zone outside the park boundary as the landscape scale. We demonstrated that butterfly diversity was significantly affected by the local characteristics of urban parks in an urban matrix. Similarly, butterfly diversity was not significantly affected by landscape characteristics in a variety of other studies [31,32,33]. It may be that the majority of butterfly species are urban adapters and landscape-sensitive species have already been locally lost in a heavily urbanised matrix [32,82]. Interestingly, as a megacity, Beijing has high urbanisation, as the PIS of each urban zone was more than 50% (Table 1). Hence, we speculate that the high urbanisation and habitat homogeneity did not make a significant difference to the diversity of urban adapters.
Although landscape variables of the green space did not strongly affect butterfly diversity in the urban parks of Beijing, we have attempted to integrate the landscape spatial range in the highly urbanised matrix by selecting different ecologically significant landscape buffer sizes and principal component analysis. We were able to generalise the scale of the small, meso and larger surrounding landscapes for butterflies. Green space cover at the 50 m spatial scale (Green1) was the only significant factor influencing butterfly abundance. The green space cover at the largest spatial scale including 1000, 2000 and 3000 m (Green 3) was included in our modelling analyses but was not statistically significant (Table 4). Generalists and common species are weakly associated with single or local or landscape characteristic [83]. Specialists and sensitive species are affected by potential habitats at larger spatial scales [20] and are strongly negatively associated with the degree of human disturbance [10,46]. Furthermore, highly mobile specialists tended to respond negatively to urbanisation at larger spatial scales [49]. These findings emphasise the need to that shape biological communities in order to better understand the extent of human-induced impacts on biodiversity. Our results also suggest that we need to consider species’ characteristics related to ecological processes [27,84] and apply different strategies to maintain a good level of common species communities and increase butterfly diversity, especially involving specialists and sensitive species.
5. Conclusions
In conclusion, butterfly species richness and abundance in parks located in the urban fringe of Beijing are significantly higher than in the urban core. Additionally, new parks with rich plant resources could quickly become effective butterfly habitats. Some butterflies, such as typical generalist species had a certain degree of adaptability to the urban environment. Local plant resources had a more significant impact on maintaining butterfly diversity than surrounding land cover. The green space quality is crucial for butterfly survival. The maintenance of butterfly diversity relies on local habitat characteristics after the butterflies have successfully diffused and colonised the urban parks [85]. Although our results did not uncover strong relationships between surrounding green space and butterfly diversity, we consider that the connection of green spaces is important for butterfly dispersal. Accordingly, attention to land use patterns within the matrix and the quality of potential habitats have different roles in the diffusion and colonisation of butterflies and the maintenance of diversity. Finally, it is of practical importance to focus on improving the quality of urban parks including the density of larval host plants, abundant plant species richness and sufficient nectar resources throughout the season. This will protect urban butterfly diversity and maintain abundance.
Author Contributions
Conceptualization, C.W. and D.H.; methodology, D.H.; software, D.H.; validation, C.W., D.H. and C.Z.; formal analysis, C.W., C.Z., L.Y., R.S.; investigation, D.H., J.S., Q.B., W.H., L.Y., R.S., X.W. and H.C.; resources, C.W. and C.Z.; data curation, D.H.; writing—original draft preparation, D.H.; writing—review and editing, C.W., C.Z., Z.S. and D.Z.; visualization, D.H.; supervision, C.Z. and C.W.; project administration, C.Z. and C.W.; funding acquisition, C.Z. All authors have read and agreed to the published version of the manuscript.
Funding
This research was funded by National Natural Science Foundation of China (No.31800608) and National Non-Profit Research Institutions of the Chinese Academy of Forestry (CAFYBB2020ZB008).
Acknowledgments
We thank anonymous reviewers for comments and suggestions that greatly improved the manuscript. We thank Hui Dong for the butterfly observation method, Zezhou Hao and Wenjun Duan for writing advice, Zezhou Hao for statistical advice, Bing Bu for butterfly identification, as well as Kaiyue Wei, Jiao Zhao, Liwen Cao, Lijie Xing, Shi Xu, Chi Zhang and Sha Wang for field investigations.
Conflicts of Interest
The authors declare no conflict of interest.
Appendix A

Figure A1.
Changes of butterfly species richness in different groups along the urbanisation gradient (UZ1, urban centre; UZ5, urban fringe). Different letters above the bars indicate significant differences at p < 0.05.

Figure A2.
Changes of observed 10-min butterfly abundance in different groups along the urbanisation gradient (UZ1, urban centre; UZ5, urban fringe). Different letters above the bars indicate significant differences at p < 0.05.
Table A1.
List of the 28 sampling urban parks in the study. Urban zones represent the location of the park (UZ1, urban core; UZ5, urban fringe). Age of park represents greening years since establishment of the park to 2019, and we classified age into three groups: A (less than 11 years), B (11–20 years), C (more than 20 years). PIS represents the proportion of impervious surface within 1 km from the boundary of the parks, and to some extent represented the environment outside the park. DTC represents the distances from park center to urban center point, i.e., Tiananmen Square and DTP represents the minimum distances between adjoining parks. Proportion of sampling area represents the proportion of butterfly surveying area occupied the area of green space within each park.
| Urban Zones | Study Site | Abbreviation | Area (ha) | Age | PIS (%) | DTC (km) | DTP (km) | Number of Plots | Length of Transcets (km) | Proportion of Sampling Area (%) |
|---|---|---|---|---|---|---|---|---|---|---|
| 1 | Guang Yang Gu park | GYG | 1.82 | A | 86.73 | 3.74 | 1.07 | 2 | 0.5 | 23.77 |
| 1 | Long Tan Xi Hu Park | LTXH | 9.91 | C | 61.33 | 5.15 | 3.69 | 3 | 1 | 11.38 |
| 1 | Xuan Wu Yi Yuan | XWYY | 6.26 | C | 80.73 | 4.13 | 1.07 | 3 | 1 | 10.67 |
| 2 | Liu Ying Park | LY | 13.08 | C | 79.44 | 4.9 | 2.98 | 3 | 1 | 7.21 |
| 2 | Ri Tan Park | RT | 17.89 | C | 80.1 | 4 | 3.91 | 3 | 1 | 4.33 |
| 2 | Yue Tan Park | YT | 7.12 | C | 90.95 | 3.8 | 2.15 | 3 | 1 | 15.15 |
| 3 | Bei Ji Si park | BJS | 4.37 | A | 83.66 | 7.7 | 2.98 | 3 | 1 | 16.18 |
| 3 | Chao Yang park | CY | 267.7 | C | 66.89 | 8.09 | 0.30 | 9 | 6 | 2.23 |
| 3 | Fu Hai park | FH | 2.09 | B | 87.44 | 7.7 | 3.89 | 2 | 0.5 | 30.18 |
| 3 | Feng Yi park | FY | 10.06 | B | 68.24 | 9.56 | 4.85 | 6 | 1 | 8.56 |
| 3 | Ling Long Park | LL | 7.75 | C | 75.52 | 8.7 | 4.83 | 3 | 1 | 9.58 |
| 4 | Olympic Forest park | AS | 207.43 | B | 40.68 | 10.6 | 2.23 | 9 | 9 | 2.94 |
| 4 | Bi Hai park | BH | 27.31 | A | 65.08 | 12.5 | 4.34 | 6 | 2 | 4.98 |
| 4 | Gao Xing park | GX | 18.8 | B | 69.7 | 15.7 | 4.17 | 6 | 2 | 7.15 |
| 4 | Hai Dian park | HD | 30.02 | B | 67.17 | 11.6 | 2.52 | 5 | 2 | 5.22 |
| 4 | Hong Ling Jing park | HLJ | 25.88 | C | 66.07 | 8.28 | 0.30 | 4 | 2 | 14.39 |
| 4 | Kan Dan Park | KD | 10.23 | A | 77.99 | 14.2 | 4.17 | 6 | 1 | 7.64 |
| 4 | Lao Shan Park | LAS | 75.44 | B | 60.53 | 14.4 | 3.48 | 9 | 4 | 3.29 |
| 4 | Liang Shan Park | LIS | 49.56 | B | 37.2 | 14.7 | 2.52 | 10 | 3 | 4.60 |
| 4 | Lao Jun Tang Park | LJT | 47.9 | B | 74.64 | 14.2 | 3.58 | 6 | 2 | 2.77 |
| 4 | Wang Jing Park | WJ | 11.01 | C | 66.8 | 12.09 | 3.95 | 3 | 1 | 6.19 |
| 4 | Xing Long Park | XL | 37.88 | C | 86.28 | 11.7 | 3.15 | 6 | 2 | 3.87 |
| 5 | Bo Da park | BD | 19.01 | B | 80.4 | 16.3 | 2.50 | 3 | 1 | 3.95 |
| 5 | Beijing Botanical Garden | BJBG | 100.79 | C | 24.09 | 18.7 | 3.23 | 10 | 5 | 3.26 |
| 5 | Dong Bai Country Park | DB | 190.34 | B | 60.09 | 15.6 | 3.90 | 13 | 9 | 2.75 |
| 5 | Dong Xiao Kou park | DXK | 109 | A | 48.57 | 14.3 | 2.23 | 9 | 5 | 2.64 |
| 5 | Nan Hai Zi Park | NHZ | 138.25 | A | 13.81 | 17.1 | 2.50 | 9 | 6 | 3.35 |
| 5 | Yong Ding He Park | YDH | 112.79 | A | 42.81 | 19 | 3.48 | 10 | 5 | 2.78 |
Table A2.
Results of PCA performed for the green space cover variables at different spatial scales used to analyse butterfly community response to urban environment. Only components with eigenvalues >1 are shown here. Green2 is the PCA axis explaining the highest variation in the proportion of green space cover with 150 m, 250 m, 500 m from the park boundary. Green3 is the most explained PCA axe axis explaining the highest variation in of the proportion of green space cover with 1000 m, 2000 m, 3000 m from the park boundary.
| Green2 | Green3 | ||
|---|---|---|---|
| Eigenvalues | 2.913 | Eigenvalues | 2.599 |
| Variance explained (%) | 97.088 | Variance explained (%) | 86.628 |
| Scores | Scores | ||
| Green space cover at 150 m | 0.575 | Green space cover at 1000 m | 0.561 |
| Green space cover at 250 m | 0.585 | Green space cover at 2000 m | 0.586 |
| Green space cover at 500 m | 0.572 | Green space cover at 3000 m | 0.585 |
Table A3.
Comparisons of environmental variables measured among urban zones were performed with ANOVA, and LSD test was used for multiple pairwise comparisons (letters indicate significant differences based on multiple pairwise comparisons; **: p < 0.01).
Table A3.
Comparisons of environmental variables measured among urban zones were performed with ANOVA, and LSD test was used for multiple pairwise comparisons (letters indicate significant differences based on multiple pairwise comparisons; **: p < 0.01).
| Variables | UZ1 | UZ2 | UZ3 | UZ4 | UZ5 | F |
|---|---|---|---|---|---|---|
| Landscape variables | ||||||
| Green at 50 m | 0.22 (0.15) b | 0.31 (0.09) b | 0.25 (0.14) b | 0.40 (0.20) b | 0.62 (0.13) a | 4.87 ** |
| Green at 150 m | 0.18 (0.15) | 0.24 (0.11) | 0.43 (0.14) | 0.34 (0.18) | 0.48 (0.19) | 2.32 |
| Green at 250 m | 0.17 (0.15) | 0.24 (0.09) | 0.42 (0.13) | 0.35 (0.17) | 0.45 (0.17) | 2.23 |
| Green at 500 m | 0.20 (0.15) | 0.20 (0.05) | 0.38 (0.14) | 0.34 (0.16) | 0.42 (0.17) | 1.75 |
| Green at 1000 m | 0.21 (0.11) b | 0.15 (0.06) b | 0.22 (0.08) b | 0.34 (0.14) b | 0.52 (0.23) a | 4.6 ** |
| Green at 2000 m | 0.20 (0.08) b | 0.16 (0.04) b | 0.23 (0.06) b | 0.30 (0.09) b | 0.46 (0.20) a | 5.12 ** |
| Green at 3000 m | 0.19 (0.07) c | 0.15 (0.02) c | 0.24 (0.03) bc | 0.34 (0.11) ab | 0.44 (0.16) a | 5.73 ** |
| Local variables | ||||||
| Age of park | 23.67 (18.82) b | 337.67 (262.12) a | 20.40 (11.63) b | 18.45 (15.15) b | 17.50 (22.54) b | 10.89 ** |
| Area of park (ha) | 6.00 (4.05) | 12.70 (5.40) | 58.39 (117.05) | 49.22 (55.81) | 111.70 (55.87) | 1.83 |
| Square root of the perimeter/area ratio | 0.46 (0.10) a | 0.38 (0.04) ab | 0.41 (0.14) a | 0.30 (0.07) bc | 0.23 (0.03) c | 5.59 ** |
| Plant species richness | 44.33 (3.79) bc | 36.67 (1.53) c | 67.20 (28.25) bc | 73.09 (24.76) b | 99.17 (29.25) a | 4.45 ** |
| Nectar plant species richness | 11.00 (4.36) bc | 5.00 (1.00) c | 12.40 (7.50) bc | 18.82 (9.01) b | 27.17 (7.83) a | 5.41 ** |
| Nectar abundance | 3.14 (1.65) a | 0.89 (0.79) b | 0.69 (0.86) b | 0.82 (0.52) b | 2.37 (1.27) a | 6.14 ** |
| Green within park | 0.75 (0.19) | 0.68 (0.11) | 0.73 (0.17) | 0.83 (0.18) | 0.89 (0.10) | 1.24 |
Table A4.
The larva plant family and flower visiting habit of butterfly species in Beijing’ urban parks.
Table A4.
The larva plant family and flower visiting habit of butterfly species in Beijing’ urban parks.
| Butterfly Species | Larva Plant Family | Flower Visiting Habit |
|---|---|---|
| Papilionidae | ||
| Papilio xuthus | Rutaceae Juss. | YES |
| Pieridae | ||
| Pieris rapae | Brassicaceae Burnett; Cleomaceae Bercht. & J. Presl; Resedaceae Martinov; Tropaeolaceae Juss. ex DC. | YES |
| Pieris canidia | Brassicaceae Burnett; Tropaeolaceae Juss. ex DC.; Apocynaceae Juss.; Capparidaceae Juss. | YES |
| Colias poliographus | Fabaceae Lindl. | YES |
| Pontia daplidice | Brassicaceae Burnett; Fabaceae Lindl. | YES |
| Leptidea morsei | Fabaceae Lindl. | YES |
| Nymphalidae | ||
| Polygonia c-album | Ulmaceae Mirb.; Saxifragaceae Juss.; Urticaceae Juss.; Moraceae Gaudich | YES |
| Timelaea maculata | Ulmaceae Mirb. | |
| Melitaea didymoides | Scrophulariaceae Juss. | YES |
| Fabriciana adippe | Violaceae Batsch. | YES |
| Lasiommata deidamia | Poaceae Barnhart; Cyperaceae Juss. | YES |
| Apatura ilia | Salicaceae Mirb. | NO |
| Vanessa cardui | Urticaceae Juss.; Malvaceae Juss.; Asteraceae Bercht. & J. Presl; Boraginaceae Juss.; Fabaceae Lindl. | YES |
| Neptis sappho | Fagaceae Dumort.; Sapindaceae Juss.; Sterculiaceae Vent.; Rosaceae Juss.; Cannabaceae Martinov; Malvaceae Juss.; Fabaceae Lindl.; Urticaceae Juss.; Ulmaceae Mirb. | YES |
| Ypthima argus | Poaceae Barnhart | YES |
| Vanessa indica | Urticaceae Juss.; Ulmaceae Mirb.; Asteraceae Bercht. & J. Presl. | YES |
| Neptis rivularis | Fagaceae Dumort.; Sapindaceae Juss.; Sterculiaceae Vent.; Rosaceae Juss.; Cannabaceae Martinov; Malvaceae Juss.; Fabaceae Lindl.; Urticaceae Juss. | YES |
| Polygonia c-aureum | Moraceae Gaudich.; Linaceae DC. ex Perleb. | YES |
| Lycaenidae | ||
| Tongeia filicaudis | Crassulaceae J. St.-Hil. | YES |
| Rapala micans | Papilionaceae Giseke; Fabaceae Lindl.; Rosaceae Juss.; Saxifragaceae Juss. | YES |
| Polyommatus eros | Fabaceae Lindl. | YES |
| Lycaena phlaeas | Polygonaceae Juss. | YES |
| Lycaeides argyrognomon | Fabaceae Lindl. | YES |
| Lycaena dispar | Polygonaceae Juss. | YES |
| Everes argiades | Fabaceae Lindl.; Cannabaceae Martinov; Papilionaceae Giseke; Cannabaceae Martinov | YES |
| Celastrina argiolus | Aquifoliaceae Bercht. & J. Presl; Cornaceae Bercht. & J. Presl; Fabaceae Lindl.; Araliaceae Juss.; Ericaceae Juss.; Rhamnaceae Juss.; Rosaceae Juss. | YES |
Table A5.
The nectar plant species visited by butterflies were recorded in Beijing’ urban parks.
Table A5.
The nectar plant species visited by butterflies were recorded in Beijing’ urban parks.
| NO. | Family | Scientific Name |
|---|---|---|
| 1. | Amaranthaceae | Gomphrena globosa Linn. |
| 2. | Amaryllidaceae | Allium senescens Linn. |
| 3. | Apocynaceae | Apocynum venetum Linn. |
| 4. | Asphodelaceae | Kniphofia uvaria (Linn.) Oken |
| 5. | Asteraceae | Zinnia elegans Sessé & Moc. |
| 6. | Leucanthemum vulgare Lam. | |
| 7. | Silphium perfoliatum Linn. | |
| 8. | Cirsium arvense var. integrifolium C. Wimm. et Grabowski | |
| 9. | Leucanthemum maximum (Ramood) DC. | |
| 10. | Coreopsis grandiflora Nutt. ex Chapm. | |
| 11. | Symphyotrichum novi-belgii (Linna.) G.L.Nesom | |
| 12. | Rudbeckia hirta Linn. | |
| 13. | Youngia japonica (Linn.) DC. | |
| 14. | Cosmos sulphureus Cav. | |
| 15. | Cirsium japonicum Fisch. ex DC. | |
| 16. | Crepidiastrum lanceolatum (Houtt.) Nakai | |
| 17. | Crepidiastrum sonchifolium (Maximowicz) Pak & Kawano | |
| 18. | Rudbeckia laciniata Linn. | |
| 19. | Coreopsis basalis (A.Dietr.) S.F.Blake | |
| 20. | Helianthus tuberosus Parry | |
| 21. | Sonchus arvensis Linn. | |
| 22. | Ixeris polycephala Cass. ex DC. | |
| 23. | Coreopsis tinctoria Nutt. | |
| 24. | Bidens bipinnata Linn. | |
| 25. | Taraxacum mongolicum Hand.-Mazz. | |
| 26. | Cosmos bipinnatus Cav. | |
| 27. | Aster pekinensis (Hance) Kitag. | |
| 28. | Heliopsis helianthoides (Linn.) Sweet | |
| 29. | Liatris spicata Willd. | |
| 30. | Echinacea purpurea (Linn.) Moench | |
| 31. | Gaillardia pulchella Foug. | |
| 32. | Tagetes erecta Linn. | |
| 33. | Erigeron canadensis Linn. | |
| 34. | Inula japonica (Miq.) Komarov | |
| 35. | Erigeron annuus (Linn.) Desf. | |
| 36. | Aster tataricus Linn.Franch. | |
| 37. | Brassicaceae | Lepidium apetalum Willd. |
| 38. | Rorippa indica (Linn.) Hiern | |
| 39. | Buddlejaceae | Buddleja davidii Franch. |
| 40. | Caprifoliaceae | Abelia chinensis R. Br. |
| 41. | Caryophyllaceae | Saponaria officinalis Linn. |
| 42. | Dianthus chinensis Linn. | |
| 43. | Convolvulaceae | Convolvulus arvensis Linn. |
| 44. | Ipomoea purpurea (Linn.) Roth | |
| 45. | Crassulaceae | Hylotelephium erythrostictum (Miq.) H. Ohba |
| 46. | Phedimus aizoon (Linn.) ’t Hart | |
| 47. | Euphorbiaceae | Euphorbia marginata Pursh. |
| 48. | Fabaceae | Trifolium repens Linn. |
| 49. | Lotus corniculatus Linn. | |
| 50. | Melilotus officinalis (Linn.) Lam. | |
| 51. | Astragalus dahuricus Linn. | |
| 52. | Lespedeza bicolor Turcz. | |
| 53. | Kummerowia striata (Thunb.) Schindl. | |
| 54. | Gueldenstaedtia verna (Georgi) Boriss. | |
| 55. | Glycine soja Sieb. et Zucc. | |
| 56. | Vicia sepium Linn. | |
| 57. | Medicago sativa Linn. | |
| 58. | Geraniaceae | Pelargonium hortorum Bailey |
| 59. | Labiatae | Physostegia virginiana Benth. |
| 60. | Salvia nemorosa Linn. | |
| 61. | Lamiaceae | Nepeta × faassenii ‘Six Hills Giant’ Linn. |
| 62. | Mentha canadensis Linn. | |
| 63. | Salvia viridis Linn. | |
| 64. | Vitex negundo var. heterophylla (Franch.) Rehd. | |
| 65. | Salvia farinacea Benth. | |
| 66. | Leonurus sibiricus Linn. | |
| 67. | Caryopteris divaricata (Sieb. et Zucc.) Maxim. | |
| 68. | Lythraceae | Lythrum salicaria Linn. |
| 69. | Malvaceae | Hibiscus syriacus Linn. |
| 70. | Oleaceae | Ligustrum × vicaryi Linn. |
| 71. | Oxalidaceae | Oxalis corniculata Linn. |
| 72. | Plantaginaceae | Pseudolysimachion longifolium (Linn.) Opiz |
| 73. | Angelonia angustifolia Benth. | |
| 74. | Polemoniaceae | Phlox paniculata Linn. |
| 75. | Ranunculaceae | Clematis heracleifolia DC. |
| 76. | Rosaceae | Potentilla supina Linn. |
| 77. | Potentilla reptans var. sericophylla Franch. | |
| 78. | Sorbaria sorbifolia (Linn.) A. Braun | |
| 79. | Rubiaceae | Leptodermis oblonga Bunge |
| 80. | Solanaceae | Petunia hybrida Vilmorin |
| 81. | Verbenaceae | Stachytarpheta jamaicensis (Linn.) Vahl |
| 82. | Zygophyllaceae | Tribulus terrestris Linn. |
References
- United Nations. Revision of world Urbanisation Prospects; United Nations: New York, NY, USA, 2018. [Google Scholar]
- Savard, J.-P.L.; Clergeau, P.; Mennechez, G. Biodiversity concepts and urban ecosystems. Landsc. Urban Plan. 2000, 48, 131–142. [Google Scholar] [CrossRef]
- Lecq, S.; Loisel, A.; Mullin, S.; Bonnet, X. Manipulating hedgerow quality: Embankment size influences animal biodiversity in a peri-urban context. Urban For. Urban Green. 2018, 35, 1–7. [Google Scholar] [CrossRef]
- Richards, D.; Belcher, R.N. Global Changes in Urban Vegetation Cover. Remote Sens. 2019, 12, 23. [Google Scholar] [CrossRef]
- Sun, L.; Chen, J.; Li, Q.; Huang, D. Dramatic uneven urbanization of large cities throughout the world in recent decades. Nat. Commun. 2020, 11, 1–9. [Google Scholar] [CrossRef]
- Norton, B.A.; Evans, K.L.; Warren, P.H. Urban Biodiversity and Landscape Ecology: Patterns, Processes and Planning. Curr. Landsc. Ecol. Rep. 2016, 1, 178–192. [Google Scholar] [CrossRef]
- Sattler, T.; Duelli, P.; Obrist, M.K.; Arlettaz, R.; Moretti, M. Response of arthropod species richness and functional groups to urban habitat structure and management. Landsc. Ecol. 2010, 25, 941–954. [Google Scholar] [CrossRef]
- Alvey, A.A. Promoting and preserving biodiversity in the urban forest. Urban For. Urban Green. 2006, 5, 195–201. [Google Scholar] [CrossRef]
- Beninde, J.; Veith, M.; Hochkirch, A. Biodiversity in cities needs space: A meta-analysis of factors determining intra-urban biodiversity variation. Ecol. Lett. 2015, 18, 581–592. [Google Scholar] [CrossRef] [PubMed]
- Kitahara, M.; Fujii, K. Biodiversity and community structure of temperate butterfly species within a gradient of human disturbance: An analysis based on the concept of generalist vs. Specialist strategies. Popul. Ecol. 1994, 36, 187–199. [Google Scholar] [CrossRef]
- Lizée, M.-H.; Manel, S.; Mauffrey, J.-F.; Tatoni, T.; Deschamps-Cottin, M. Matrix configuration and patch isolation influences override the species–area relationship for urban butterfly communities. Landsc. Ecol. 2011, 27, 159–169. [Google Scholar] [CrossRef]
- Kimberling, D.N.K.; Fore, L.S. Measuring human disturbance using terrestrial invertebrates in the shrub-steppe of eastern Washington. Ecol. Indic. 2001, 1, 63–137. [Google Scholar] [CrossRef]
- Gerlach, J.S.; Pryke, J. Terrestrial invertebrates as bioindicators: An overview of available taxonomic groups. J. Insect Conserv. 2013, 17, 831–850. [Google Scholar] [CrossRef]
- Oostermeijer, J.; van Swaay, C. The relationship between butterflies and environmental indicator values: A tool for conservation in a changing landscape. Biol. Conserv. 1998, 86, 271–280. [Google Scholar] [CrossRef]
- Ricouart, F.C.; Gers, C.; Winterton, P.; Legal, L. Influence of fire prevention management strategies on the diversity of butterfly fauna in the eastern Pyrenees. J. Insect Conserv. 2013, 17, 95–111. [Google Scholar] [CrossRef][Green Version]
- Konvicka, M.; Fric, Z.; Benes, J. Butterfly extinctions in European states: Do socioeconomic conditions matter more than physical geography? Glob. Ecol. Biogeogr. 2006, 15, 82–92. [Google Scholar] [CrossRef]
- Blair, R.B.; Launer, A.E. Butterfly diversity and human land use: Species assemblages along an urban grandient. Biol. Conserv. 1997, 80, 113–125. [Google Scholar] [CrossRef]
- Ramírez-Restrepo, L.; MacGregor-Fors, I. Butterflies in the city: A review of urban diurnal Lepidoptera. Urban Ecosyst. 2017, 20, 171–182. [Google Scholar] [CrossRef]
- Brown, K.S.; Freitas, A.V.L. Butterfly Communities of Urban Forest Fragments in Campinas, São Paulo, Brazil: Structure, Instability, Environmental Correlates, and Conservation. J. Insect Conserv. 2002, 6, 217–231. [Google Scholar] [CrossRef]
- Clark, P.J.; Reed, J.M.; Chew, F.S. Effects of urbanization on butterfly species richness, guild structure, and rarity. Urban Ecosyst. 2007, 10, 321–337. [Google Scholar] [CrossRef]
- Tzortzakaki, O.; Kati, V.; Panitsa, M.; Tzanatos, E.; Giokas, S. Butterfly diversity along the urbanization gradient in a densely-built Mediterranean city: Land cover is more decisive than resources in structuring communities. Landsc. Urban Plan. 2019, 183, 79–87. [Google Scholar] [CrossRef]
- Ramírez-Restrepo, L.; Koi, S.; MacGregor-Fors, I. Tales of urban conservation: Eumaeus butterflies and their threatened cycad hostplants. Urban Ecosyst. 2016, 20, 375–378. [Google Scholar] [CrossRef]
- Soga, M.; Kawahara, T.; Fukuyama, K.; Sayama, K.; Kato, T.; Shimomura, M.; Itoh, T.; Yoshida, T.; Ozaki, K. Landscape versus local factors shaping butterfly communities in fragmented landscapes: Does host plant diversity matter? J. Insect Conserv. 2015, 19, 781–790. [Google Scholar] [CrossRef]
- Leston, L.; Koper, N. Urban rights-of-way as extensive butterfly habitats: A case study from Winnipeg, Canada. Landsc. Urban Plan. 2017, 157, 56–62. [Google Scholar] [CrossRef]
- Thomas, J.A.; Bourn, N.A.D.; Clarke, R.T.; Stewart, K.E.; Simcox, D.J.; Pearman, G.S.; Curtis, R.; Goodger, B. The quality and isolation of habitat patches both determine where butterflies persist in fragmented landscapes. Proc. R. Soc. B Biol. Sci. 2001, 268, 1791–1796. [Google Scholar] [CrossRef] [PubMed]
- Bergerot, B.; Fontaine, B.; Renard, M.; Cadi, A.; Julliard, R. Preferences for exotic flowers do not promote urban life in butterflies. Landsc. Urban Plan. 2010, 96, 98–107. [Google Scholar] [CrossRef]
- Öckinger, E.; Dannestam, A.; Smith, H.G. The importance of fragmentation and habitat quality of urban grasslands for butterfly diversity. Landsc. Urban Plan. 2009, 93, 31–37. [Google Scholar] [CrossRef]
- Krauss, J.; Steffan-Dewenter, I.; Tscharntke, T. Landscape occupancy and local population size depends on host plant distribution in the butterfly Cupido minimus. Biol. Conserv. 2004, 120, 355–361. [Google Scholar] [CrossRef]
- Fourcade, Y.; Öckinger, E. Host plant density and patch isolation drive occupancy and abundance at a butterfly’s northern range margin. Ecol. Evol. 2017, 7, 331–345. [Google Scholar] [CrossRef]
- Santamaría, L.; Rodríguez-Gironés, M.A. Linkage Rules for Plant–Pollinator Networks: Trait Complementarity or Exploitation Barriers? PLoS Biol. 2007, 5, 0354–0362. [Google Scholar] [CrossRef]
- Collinge, S.K.; Prudic, K.L.; Oliver, J.C. Effects of Local Habitat Characteristics and Landscape Context on Grassland Butterfly Diversity. Conserv. Biol. 2003, 17, 178–187. [Google Scholar] [CrossRef]
- Matteson, K.C.; Langellotto, G.A. Determinates of inner city butterfly and bee species richness. Urban Ecosyst. 2010, 13, 333–347. [Google Scholar] [CrossRef]
- Soga, M.; Koike, S. Relative importance of quantity, quality and isolation of patches for butterfly diversity in fragmented urban forests. Ecol. Res. 2012, 27, 265–271. [Google Scholar] [CrossRef]
- Fu, G.; Xiao, N.; Qiao, M.; Qin, Y.; Yan, B.; Liu, G.; Gao, X.; Li, J. Spatial-temporal changes of landscape fragmentation patterns in Beijing in the last two decades. Shengtai Xuebao 2017, 37, 2551–2562. [Google Scholar] [CrossRef]
- Su, Z.; Zhang, R.; Qiu, J. Decline in the diversity of willow trunk-dwelling weevils (Coleoptera: Curculionoidea) as a result of urban expansion in Beijing, China. J. Insect Conserv. 2010, 15, 367–377. [Google Scholar] [CrossRef]
- Cao, S.; Li, Y.; Lu, C. A measure of the net value of ecosystem services and the evaluation of Beijing Plain Afforestation Project. Chin. Sci. Bull. 2016, 61, 2724–2729. [Google Scholar] [CrossRef]
- Pei, N.; Wang, C.; Jin, J.; Jia, B.; Chen, B.; Qie, G.; Qiu, E.; Gu, L.; Sun, R.; Li, J.; et al. Long-term afforestation efforts increase bird species diversity in Beijing, China. Urban For. Urban Green. 2018, 29, 88–95. [Google Scholar] [CrossRef]
- Wang, G.; Jiang, G.M.; Zhou, Y.; Liu, Q.; Ji, Y.; Wang, S.; Chen, S.; Liu, H. Biodiversity conservation in a fast-growing metropolitan area in China: A case study of plant diversity in Beijing. Biodivers. Conserv. 2007, 16, 4025–4038. [Google Scholar] [CrossRef]
- Ouyang, Z.; Xiao, R.; Schienke, E.; Li, W.; Wang, X.; Miao, H.; Zheng, H. Beijing Urban Spatial Distribution and Resulting Impacts on Heat Islands. In Landscape Ecological Applications in Man-Influenced Areas; Springer: Berlin/Heidelberg, Germany, 2007; pp. 459–478. [Google Scholar]
- Yang, J.; McBride, J.; Zhou, J.; Sun, Z. The urban forest in Beijing and its role in air pollution reduction. Urban For. Urban Green. 2005, 3, 65–78. [Google Scholar] [CrossRef]
- Xie, Y.; Fang, C.; Lin, G.C.; Gong, H.; Qiao, B. Tempo-Spatial Patterns of Land Use Changes and Urban Development in Globalizing China: A Study of Beijing. Sensors 2007, 7, 2881–2906. [Google Scholar] [CrossRef]
- Pollard, E.; Yates, T.J. Monitoring Butterflies for Ecology and Conservation: The British Butterfly Monitoring Scheme; Springer Science & Business Media: Berlin/Heidelberg, Germany, 1995. [Google Scholar]
- Li, C.L.; Zhu, B.Y. Butterflies of China; Shanghai Far East Publisher: Shanghai, China, 1992. [Google Scholar]
- Chou, I. Monographia rhopalocerorum sinensium (Monograph of Chinese Butterflies); Henan Scientific and Technological Publishing House: Zhengzhou, China, 2000; Volume 2. [Google Scholar]
- Wu, C.; Xu, Y. Butterflies of China; Hai Xia Shu Ju: Fu Zhou, China, 2017. [Google Scholar]
- Kitahara, M.; Fujii, K. An island biogeographical approach to the analysis of butterfly community patterns in newly designed parks. Popul. Ecol. 1997, 39, 23–35. [Google Scholar] [CrossRef]
- Schneider, C. The influence of spatial scale on quantifying insect dispersal: An analysis of butterfly data. Ecol. Entomol. 2003, 28, 252–256. [Google Scholar] [CrossRef]
- Luppi, M.; Dondina, O.; Orioli, V.; Bani, L. Local and landscape drivers of butterfly richness and abundance in a human-dominated area. Agric. Ecosyst. Environ. 2018, 254, 138–148. [Google Scholar] [CrossRef]
- Concepción, E.D.; Moretti, M.; Altermatt, F.; Nobis, M.P.; Obrist, M.K. Impacts of urbanisation on biodiversity: The role of species mobility, degree of specialisation and spatial scale. Oikos 2015, 124, 1571–1582. [Google Scholar] [CrossRef]
- Kurylo, J.S.; Threlfall, C.G.; Parris, K.M.; Ossola, A.; Williams, N.S.G.; Evans, K.L. Butterfly richness and abundance along a gradient of imperviousness and the importance of matrix quality. Ecol. Appl. 2020, 30. [Google Scholar] [CrossRef]
- Shubin, D. The Method of Processing of Remote Sensing Image Data Using ENVI; Science Press: Beijing, China, 2010. [Google Scholar]
- ESRI. ArcGIS Desktop: Release 10.2.; Environmental Systems Research Institute: Redlands, CA, USA, 2014. [Google Scholar]
- Tam, K.C.; Bonebrake, T.C. Butterfly diversity, habitat and vegetation usage in Hong Kong urban parks. Urban Ecosyst. 2015, 19, 721–733. [Google Scholar] [CrossRef]
- Burnham, K.P.; Anderson, D.R. Model. Selection and Multimodel Inference: A Practical Information-Theoretic Approach, 2nd ed.; Springer: New York, NY, USA, 2002; Volume xxvi, p. 488. [Google Scholar]
- Si, X.; Pimm, S.L.; Russell, G.; Ding, P. Turnover of breeding bird communities on islands in an inundated lake. J. Biogeogr. 2014, 41, 2283–2292. [Google Scholar] [CrossRef]
- Ter-Braak, C.J. Canonical Correspondence Analysis: A New Eigenvector Technique for Multivariate Direct Gradient Analysis. Ecology 1986, 67, 1167–1179. [Google Scholar] [CrossRef]
- Lepx, J.S.P. Multivariate Analysis of Ecological Data Using CANOCO; Cambridge University Press: Cambridge, MA, USA, 2003. [Google Scholar]
- Mendiburu, F.D. Agricolae: Statistical Procedures for Agricultural Research. R package version 1.3-2. Available online: https://CRAN.R-project.org/package=agricolae (accessed on 7 June 2020).
- Barton, K. MuMIn: Multi-Model Inference. R package version 1.9.13. 2013. Available online: http://CRAN.R-project.org/package=MuMIn (accessed on 15 April 2020).
- Mazerolle, M.J. AICcmodavg: Model Selection and Multimodel Inference Based on (Q)AIC(c). R package version 2.3-1. Available online: https://cran.r-project.org/package=AICcmodavg (accessed on 26 August 2020).
- Oksanen, J.; Blanchet, F.G.; Friendly, M.; Kindt, R.; Legendre, P.; McGlinn, D.; Minchin, P.R.; O’Hara, R.B.; Simpson, G.L.; Solymos, P.; et al. Vegan: Community Ecology Package; World Agroforestry: Nairobi, Kenya, 2019. [Google Scholar]
- Gu, Z.; Gu, L.; Eils, R.; Schlesner, M.; Brors, B. circlize implements and enhances circular visualization in R. Bioinformatics 2014, 30, 2811–2812. [Google Scholar] [CrossRef]
- Wickham, H. ggplot2: Elegant Graphics for Data Analysis; Springer: New York, NY, USA, 2016. [Google Scholar]
- Sing, K.-W.; Luo, J.; Wang, W.; Jaturas, N.; Soga, M.; Yang, X.; Dong, H.; Wilson, J.-J. Ring roads and urban biodiversity: Distribution of butterflies in urban parks in Beijing city and correlations with other indicator species. Sci. Rep. 2019, 9, 7653. [Google Scholar] [CrossRef]
- Imai, C. An Ecological Study for Enrichment of Biological Diversity in Urban Areas. Jpn. J. Environ. Entomol. Zool. 1998, 9, 55–73. [Google Scholar]
- Lee, C.M.; Park, J.W.; Kwon, T.-S.; Kim, S.-S.; Ryu, J.W.; Jung, S.J.; Lee, S.K. Diversity and density of butterfly communities in urban green areas: An analytical approach using GIS. Zool. Stud. 2015, 54, e4. [Google Scholar] [CrossRef] [PubMed]
- Yang, H.; Wang, C.; Yu, P. Beijing Butterfly; Scientific and Technical Documents Publishing House: Beijing, China, 1994. [Google Scholar]
- Snep, R.P.H.; Opdam, P.; Baveco, J.; Wallis-De-Vries, M.; Timmermans, W.; Kwak, R.; Kuypers, V. How peri-urban areas can strengthen animal populations within cities: A modeling approach. Biol. Conserv. 2006, 127, 345–355. [Google Scholar] [CrossRef]
- McKinney, M.L. Effects of urbanization on species richness: A review of plants and animals. Urban Ecosyst. 2008, 11, 161–176. [Google Scholar] [CrossRef]
- Lizee, M.-H.; Tatoni, T.; Deschamps-Cottin, M. Nested patterns in urban butterfly species assemblages: Respective roles of plot management, park layout and landscape features. Urban Ecosyst. 2015, 19, 205–224. [Google Scholar] [CrossRef]
- Koh, L.P.; Sodhi, N.S. Importance of reserves, fragments, and parks for butterfly conservation in a tropical urban landscape. Ecol. Appl. 2004, 14, 1695–1708. [Google Scholar] [CrossRef]
- Sing, K.-W.; Dong, H.; Wang, W.-Z.; Wilson, J.-J. Can butterflies cope with city life? Butterfly diversity in a young megacity in southern China. Genome 2016, 59, 751–761. [Google Scholar] [CrossRef]
- Sing, K.-W.; A Jusoh, W.F.; Hashim, N.R.; Wilson, J.-J. Urban parks: Refuges for tropical butterflies in Southeast Asia? Urban Ecosyst. 2016, 19, 1131–1147. [Google Scholar] [CrossRef]
- Loertscher, M.; Erhardt, A.; Zettel, J. Microdistribution of butterflies in a mosaic-like habitat: The role of nectar sources. Ecography 1995, 18, 15–26. [Google Scholar] [CrossRef]
- Heikkinen, R.K.; Luoto, M.; Kuussaari, M.; Pöyry, J. New insights into butterfly–environment relationships using partitioning methods. Proc. R. Soc. B Biol. Sci. 2005, 272, 2203–2210. [Google Scholar] [CrossRef]
- Curtis, R.J.; Brereton, T.M.; Dennis, R.L.H.; Carbone, C.; Isaac, N.J.B. Butterfly abundance is determined by food availability and is mediated by species traits. J. Appl. Ecol. 2015, 52, 1676–1684. [Google Scholar] [CrossRef]
- Dennis, R.L.H.; Shreeve, T.G.; van Dyck, H. Towards a functional resource-based concept for habitat: A butterfly biology viewpoint. Oikos 2003, 102, 417–426. [Google Scholar]
- Dennis, R.L.H.; Shreeve, T.G.; van Dyck, H. Habitats and Resources: The Need for a Resource-based Definition to Conserve Butterflies. Biodivers. Conserv. 2006, 15, 1943–1966. [Google Scholar] [CrossRef]
- Nagase, A.; Kurashina, M.; Nomura, M.; MacIvor, J.S. Patterns in urban butterflies and spontaneous plants across a University campus in Japan. Pan-Pac. Entomol. 2019, 94, 195–216. [Google Scholar] [CrossRef]
- Soga, M.; Koike, S. Patch isolation only matters for specialist butterflies but patch area affects both specialist and generalist species. J. For. Res. 2013, 18, 270–278. [Google Scholar] [CrossRef]
- Su, Z.; Li, X.; Zhou, W.; Ouyang, Z. Effect of Landscape Pattern on Insect Species Density within Urban Green Spaces in Beijing, China. PLoS ONE 2015, 10, e0119276. [Google Scholar] [CrossRef]
- Connor, E.F.; Hafernik, J.; Levy, J.; Moore, V.L.; Rickman, J.K. Insect Conservation in an Urban Biodiversity Hotspot: The San Francisco Bay Area. J. Insect Conserv. 2002, 6, 247–259. [Google Scholar] [CrossRef]
- Hogsden, K.L.; Hutchinson, T.C. Butterfly assemblages along a human disturbance gradient in Ontario, Canada. Can. J. Zool. 2004, 82, 739–748. [Google Scholar] [CrossRef]
- Schleicher, A.; Biedermann, R.; Kleyer, M. Dispersal traits determine plant response to habitat connectivity in an urban landscape. Landsc. Ecol. 2011, 26, 529–540. [Google Scholar] [CrossRef]
- Croci, S.; Butet, A.; Georges, A.; Aguejdad, R.; Clergeau, P. Small urban woodlands as biodiversity conservation hot-spot: A multi-taxon approach. Landsc. Ecol. 2008, 23, 1171–1186. [Google Scholar] [CrossRef]
Publisher’s Note: MDPI stays neutral with regard to jurisdictional claims in published maps and institutional affiliations. |
© 2021 by the authors. Licensee MDPI, Basel, Switzerland. This article is an open access article distributed under the terms and conditions of the Creative Commons Attribution (CC BY) license (http://creativecommons.org/licenses/by/4.0/).