Article

Nitrogen Oxides Mitigation Efficiency of Cementitious Materials Incorporated with TiO2

1
Department of Civil Engineering, Chonnam National University, Gwangju 61186, Korea
2
Bio-Housing Institute, Chonnam National University, Gwangju 61186, Korea
3
School of Chemical Engineering, Chonnam National University, Gwangju 61186, Korea
*
Author to whom correspondence should be addressed.
Materials 2018, 11(6), 877; https://doi.org/10.3390/ma11060877
Submission received: 16 April 2018 / Revised: 22 May 2018 / Accepted: 23 May 2018 / Published: 24 May 2018

Abstract

:
We explored the photocatalytic capacities of cementitious materials (cement paste and mortar) incorporating titanium dioxide (TiO2). P-25 is a commercial TiO2 preparation which, if incorporated into large civil buildings, is extremely expensive. It is essential to produce low-cost TiO2. A cheap anatase form of TiO2 powder, NP-400, manufactured under relatively low burning temperature, was considered in this paper. Addition of NP-400 to 0, 5, 10, and 20 wt % did not significantly affect the compressive strengths of mortar or cement paste. However, the compressive strengths of P-25-containing specimens were more consistent than those of NP-400-containing materials. The nitrogen oxide (NO) removal efficiencies by mortar with 5 and 10 wt % TiO2 were similar at ca. 14–16%; the removal efficiency by mortar with 20 wt % NP-400 was ca. 70%. Although the NP-400 cluster size was almost halved by ultrasonication, NO removal efficiency was not enhanced. Removal was enhanced by the presence of accessible surface area: NP-400 dispersed in these surfaces readily adsorbed NO, aided by the large surface areas of the top and bottom faces. Scanning electron microscopy coupled with energy dispersive X-ray analysis (SEM–EDX) confirmed that NP-400 tended to sink when added to cement, fine aggregates, and water because the true densities of P-25, NP-400, and cement powder differed (3.41, 3.70, and 3.15 g/mL). The true density of NP-400 was thus the highest of all ingredients. The relatively low apparent density of P-25 compared to that of NP-400 was associated with a more bulky distribution of P-25 within cementitious materials. Nevertheless, NP-400 could be a viable alternative to the definitive product, P-25.

1. Introduction

Recent rapid climate change has greatly affected the air quality of the Korean peninsula. Micro-sized industrial pollutants increasingly produced by neighboring countries are borne to Korea by wind year-round. Also, internal factors, such as power plants burning fossil fuels and diesel-powered vehicles, have significant environmental effects. Microdusts are readily adsorbed by the outer walls of civil infrastructure and residential facilities, affecting public health and the quality of city life [1,2,3]. In Japan, Italy, Belgium, China, and the United States, photocatalytic titanium dioxide (TiO2) is added to sidewalk blocks, precast external building material, and the walls of large buildings such as theaters and stadiums; TiO2 exhibits anti-fouling, deodorization, and air purification properties. Commercial TiO2 is used in the construction of such conventional structures [4,5,6,7,8,9,10]. The most common crystalline phases of TiO2 are rutile, anatase and brookite. Among these phases, the anatase is the most widely used for photocatalytic reactions because of its large surface area, stability and higher activity compared to the rutile [11]. When TiO2 is exposed to ultraviolet (UV) light, it can absorb photon energy equal to or larger than its band gap, promoting electrons to jump from the valence band to the conduction band. The activation of the electrons results in the generation of holes in the valence band. The electron-hole pairs may combine in a short time to initiate redox reactions depending on ambient conditions [12]. Optimal photocatalytic efficiency may be achieved from a mixture of anatase with a small percentage of rutile as electron hole recombination is prevented by the creation of energy wells which serve as an electron trap formed from the lower band gap of rutile, 3.0 eV against 3.2 eV for anatase [13]. Addition of TiO2 powder to cement mixes was found to significantly affect the hydration rate of cement and the properties of cement pastes and mortars. According to several authors [4,12,14,15,16], the early stage hydration rate and hydration degree of cement was significantly enhanced. Fluidity and strength at evening ages were found to decrease [17]. This leads the strength of cement mortar at early ages to increase a lot and the fluidity and strength at evening ages to decrease, obviously [17]. The workability and setting time of fresh mortar and concrete were decreased by increasing the content of TiO2 nanoparticles [12,14,15,16,17,18,19]. These aspects were consistently reported in even higher concentrations of TiO2 up to 15 wt % at the early stage of C3S hydration. The hydration product is formed on or near the surface of TiO2 particles, as well as on the C3S surface in 5, 10 and 15 wt % of TiO2 addition [14]. The compressive strength of cement mortar with 0–20 wt % of TiO2 addition are generally increased [18]. However, it is still controversial whether the added TiO2 particles have certain pozzolanic activity or they are only fine non-reactive fillers. It seems that TiO2 was inert and stable during the hydration process because the variation of relative mass ratios of TiO2 at different curing ages was very small [12]. Higher TiO2 concentration led to more TiO2 deposition on the surface of hydration products and fine aggregates and higher photocatalytic activity. Nevertheless, higher TiO2 concentration stirred up an agglomeration problem of TiO2, which led to more recombination of electron-holes and difficulties for TiO2 particles to be exposed to the photocatalytic reaction [20]. Comparing the nitrogen oxide (NO) degradation rates, the compositions in lower additions (0.5 and 1 wt %) exhibit high photocatalytic activity. Increasing TiO2 content from 2.5 to 5 wt % produced an increase in the NO degradation not sufficient to compensate for the decrease in mechanical strength of hardened cement mixes [21]. Research [22] on the different particle size effect on TiO2 in hardened cement: micro-sized TiO2 (avg. diameter—150 nm, SSA—8.7 m2/g) and nano-sized TiO2 (avg. diameter—18 nm, SSA—78.9 m2/g) was explored. Micro-sized TiO2 shows smaller and better dispersed agglomerates than nano-sized TiO2 even though the primary particle size (crystallite size) is bigger. Big particle agglomerate pores, small and highly dispersed agglomerates of micro-sized TiO2 offer a higher available surface area for adsorption and reaction of big molecules like Rhodamine B which hardly penetrate nano-sized TiO2 particle agglomerate pores. On the other hand, very small molecules like nitrogen oxides which can easily penetrate into nano-sized pores of agglomerates are better degraded by nano-sized TiO2. In this case, dispersion and the agglomerates porosity are not crucial; the available surface area is most likely to be due to the specific surface area determined by primary particle size [22]. Photocatalysis is a surface phenomenon, influenced by the chemistry of the immediate environment. The concrete surface must be engineered to maximise photocatalyst accessibility to reactants and activation. Catalyst surface area must be maximised for the target application; care must be taken to ensure particle dispersion is optimised. Agglomeration can block access to the internal surface, i.e., if pollutant molecule size is greater than pore entry diameter [23]. Photocatalytic experiments on the photocatalytic coatings on concrete and plaster substrates were carried out in two types (laminar flow, ideally-mixed flow) of flow reactors under real world conditions of temperature, relative humidity, irradiation intensity and pollutant concentrations [24,25]. However, TiO2 clusters sink slowly to the bottom of cementitious material prior to setting and hardening. This creates variations in TiO2 concentration between the top and bottom faces, especially during in situ construction. None of silica fumes, high-range water reducers, viscous agents, or blast furnace slag enhanced the dispersion characteristics of TiO2 clusters [26]. A combination of a foaming agent, a hardening accelerator, a viscous agent, and a small fine aggregate grain size aided TiO2 dispersion in cementitious materials but NO removal by the top surface was only minimally affected [26]. P-25 is a commercial TiO2 preparation which, if incorporated into large civil buildings, is extremely expensive. It is essential to produce low-cost TiO2, for example from the coagulant-containing sludge of wastewater treatment [27,28,29]. The NP-400 form of TiO2 manufactured in Korea is equivalent to P-25 in terms of mechanical and catalytic properties, but is only half the price. Here, we evaluated the compressive strengths and NO removal efficiencies of cement pastes/mortars mixed with NP-400.

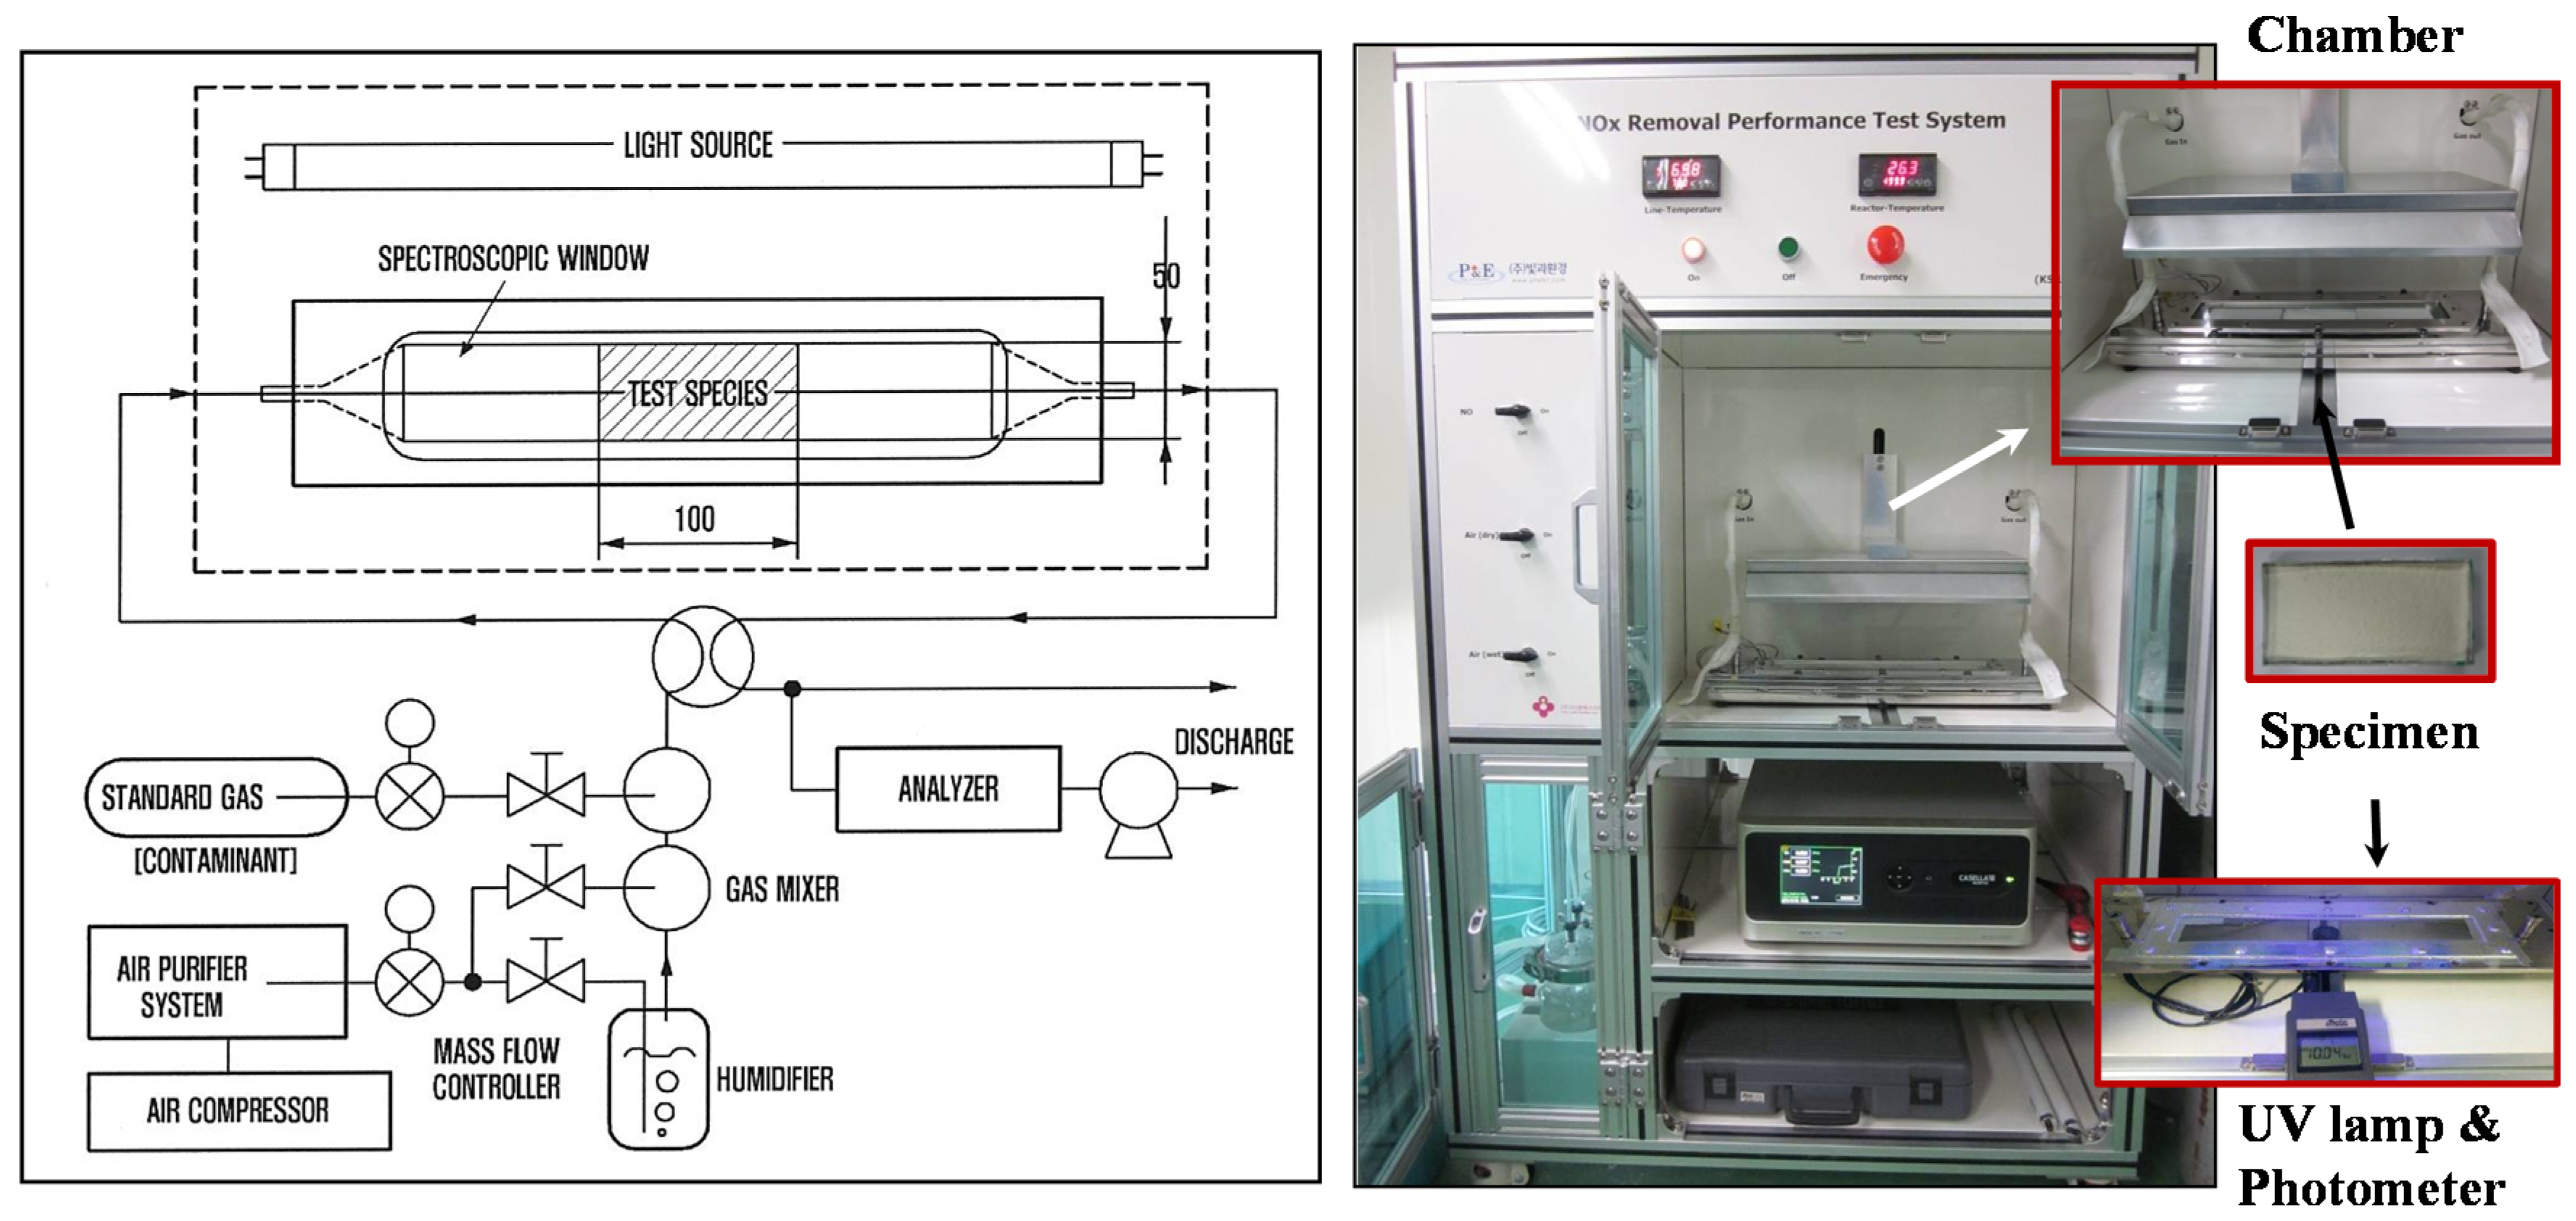
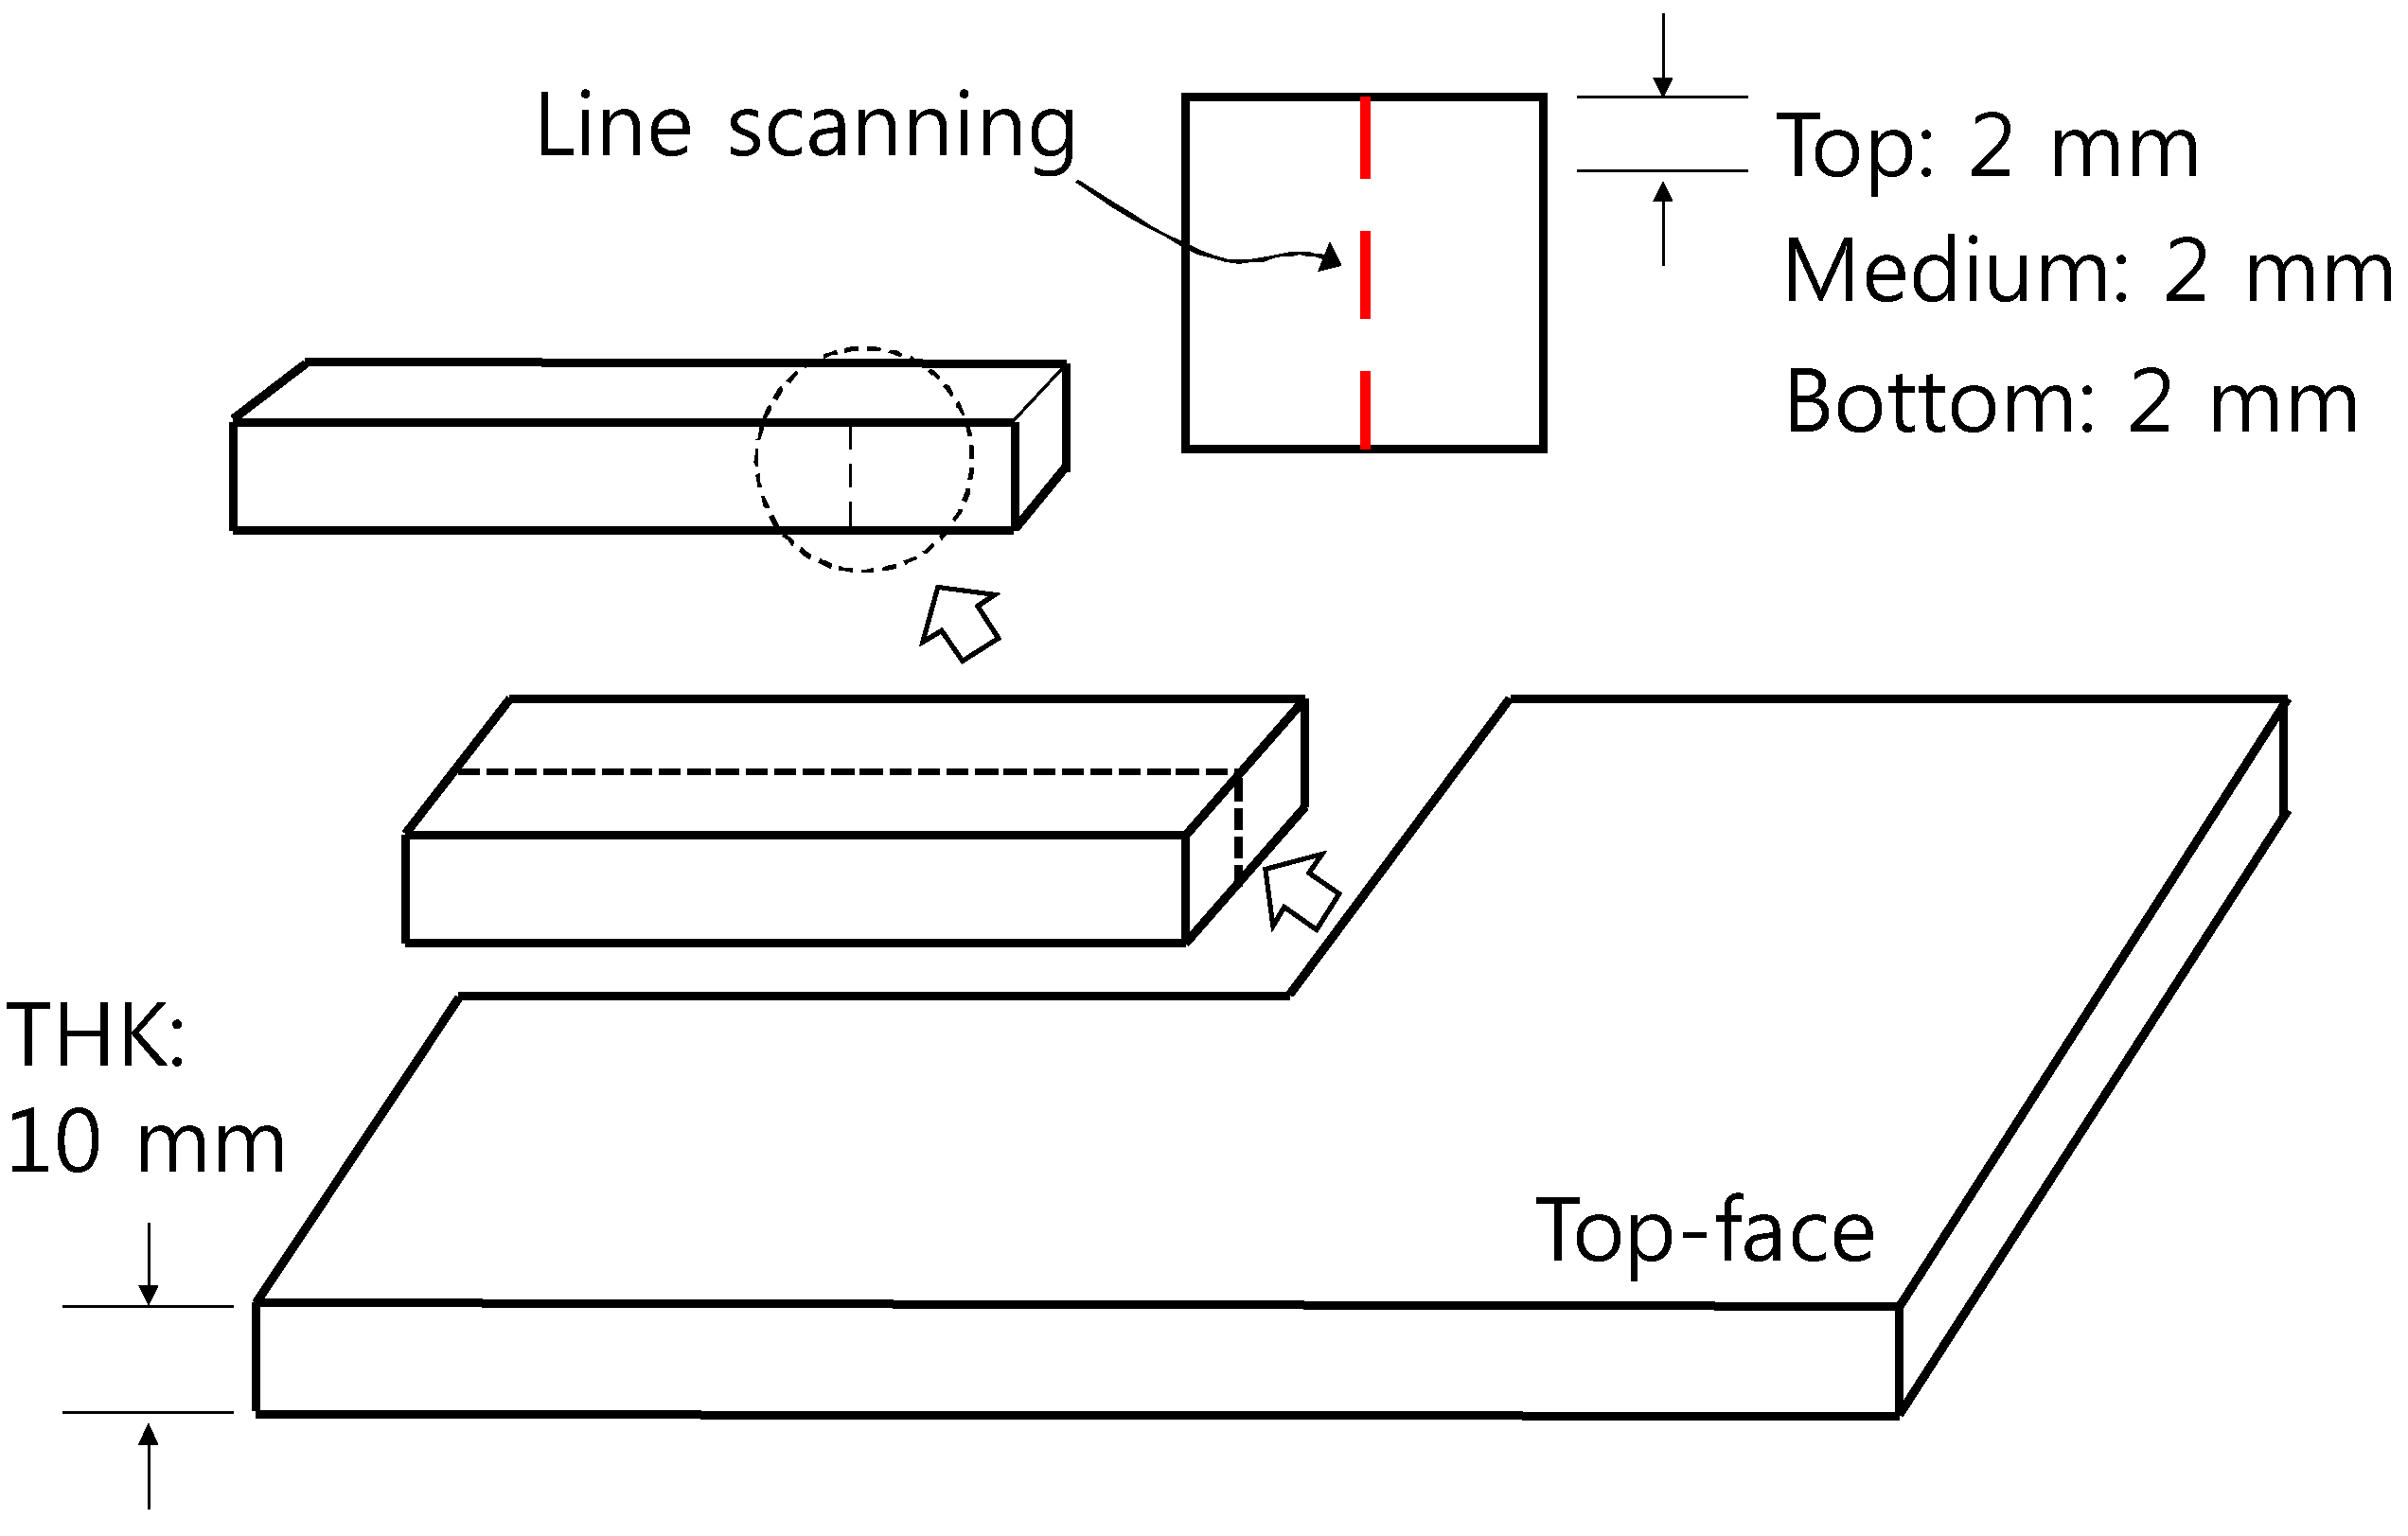
2. Materials and Methods

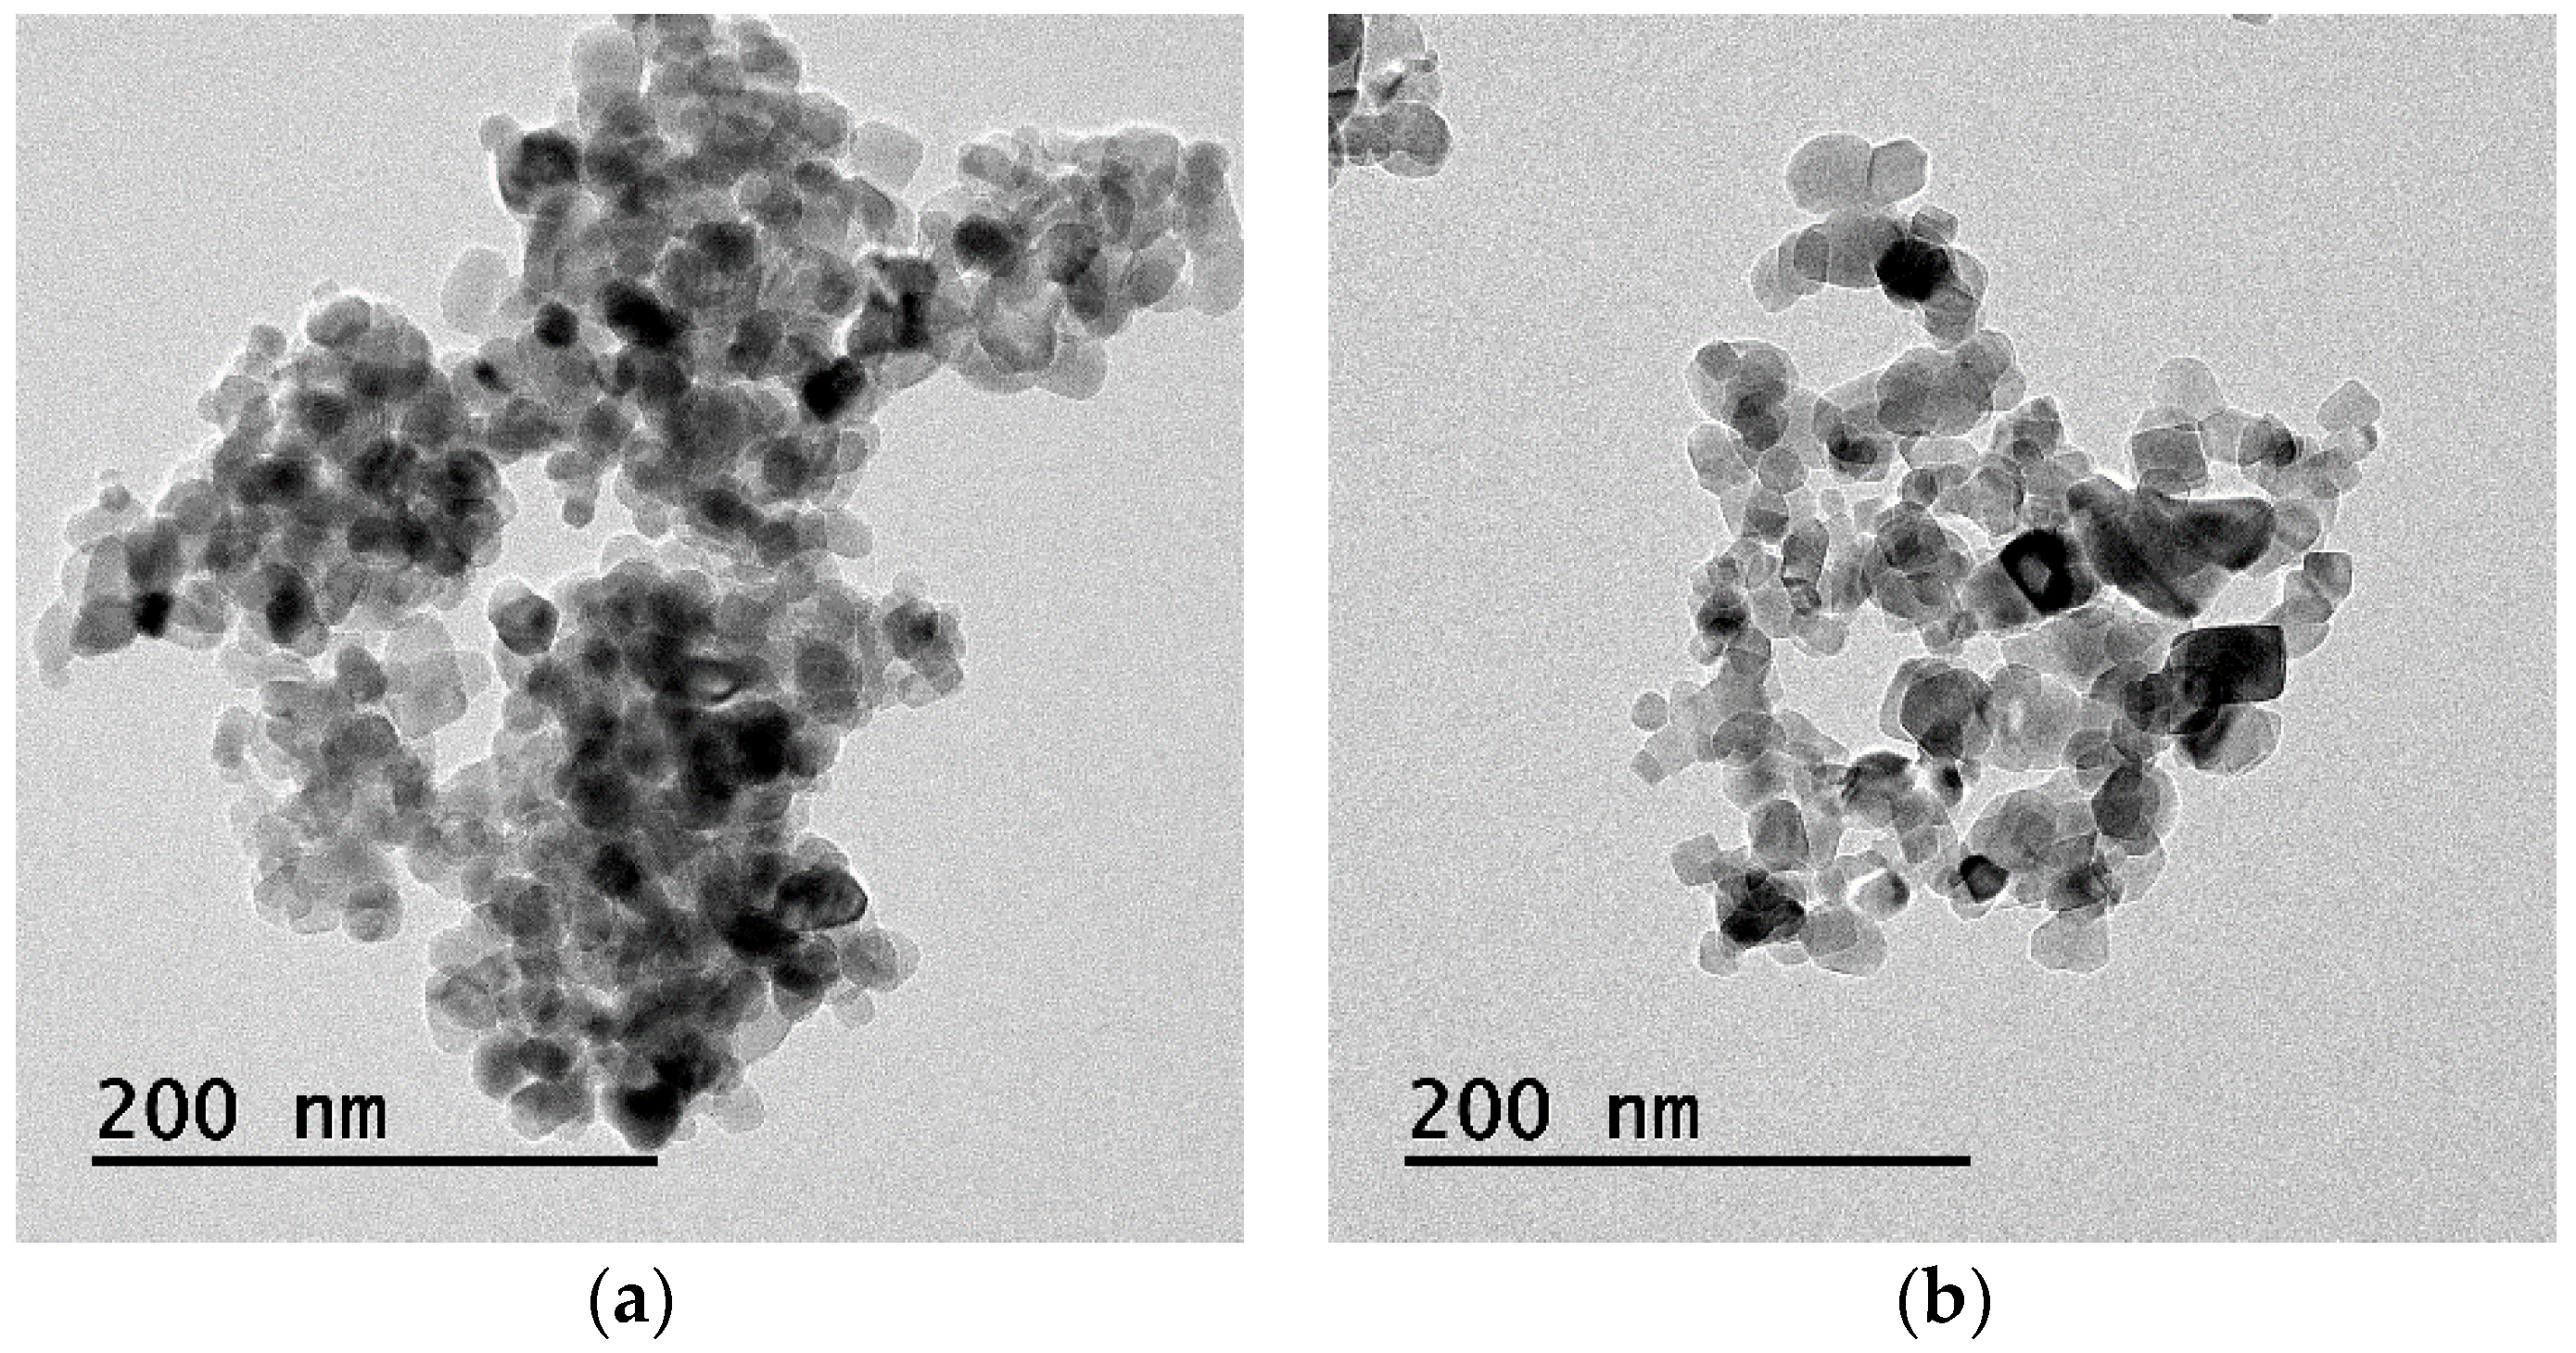
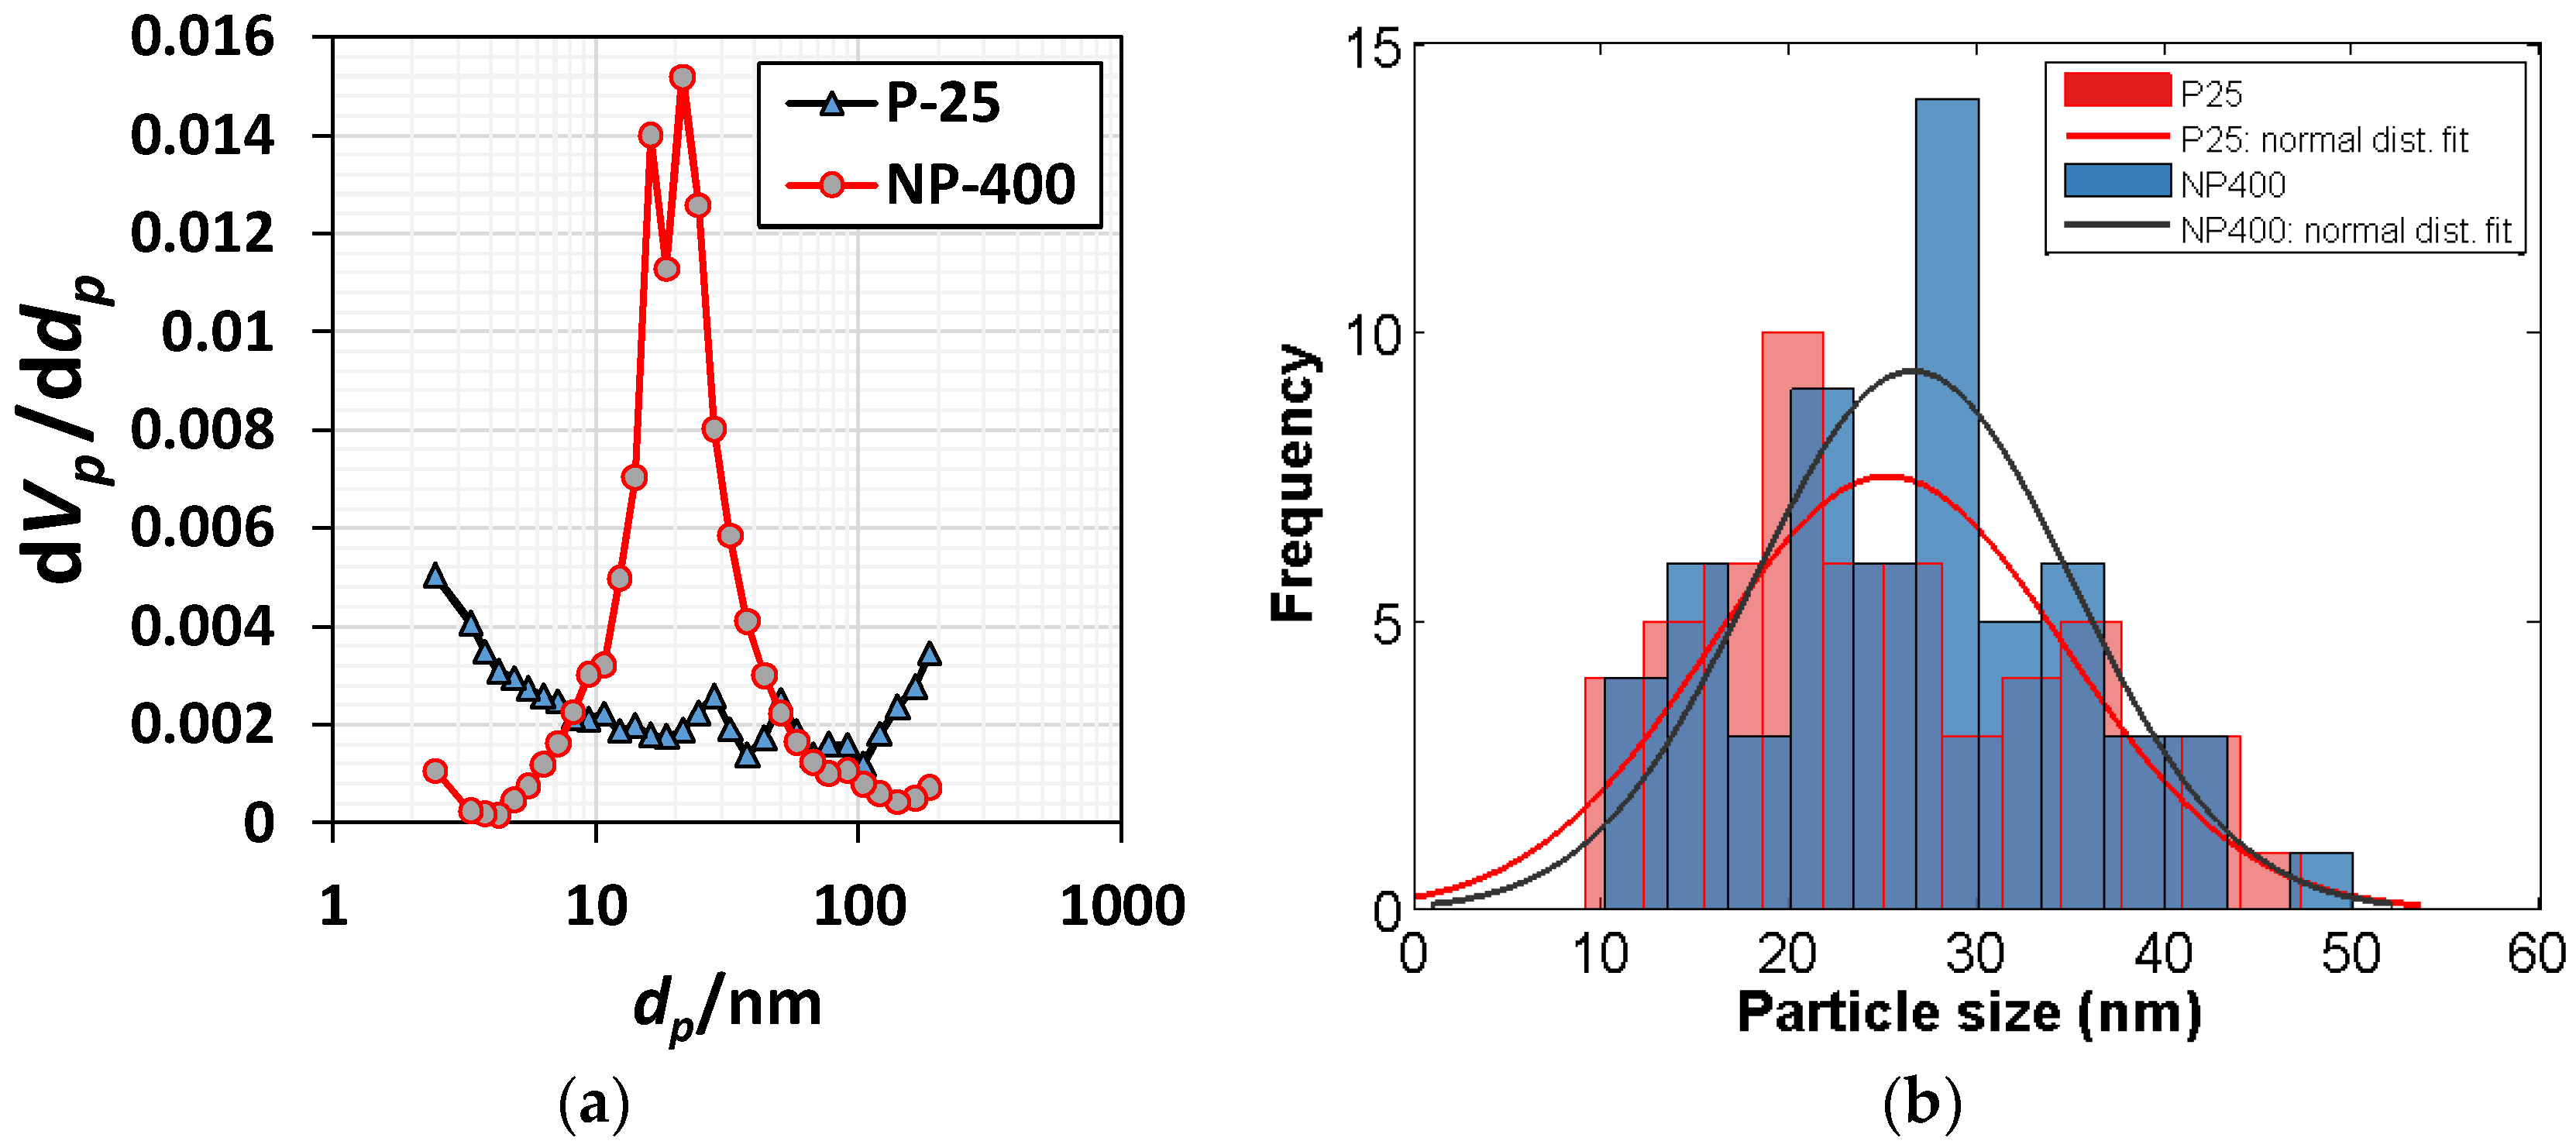
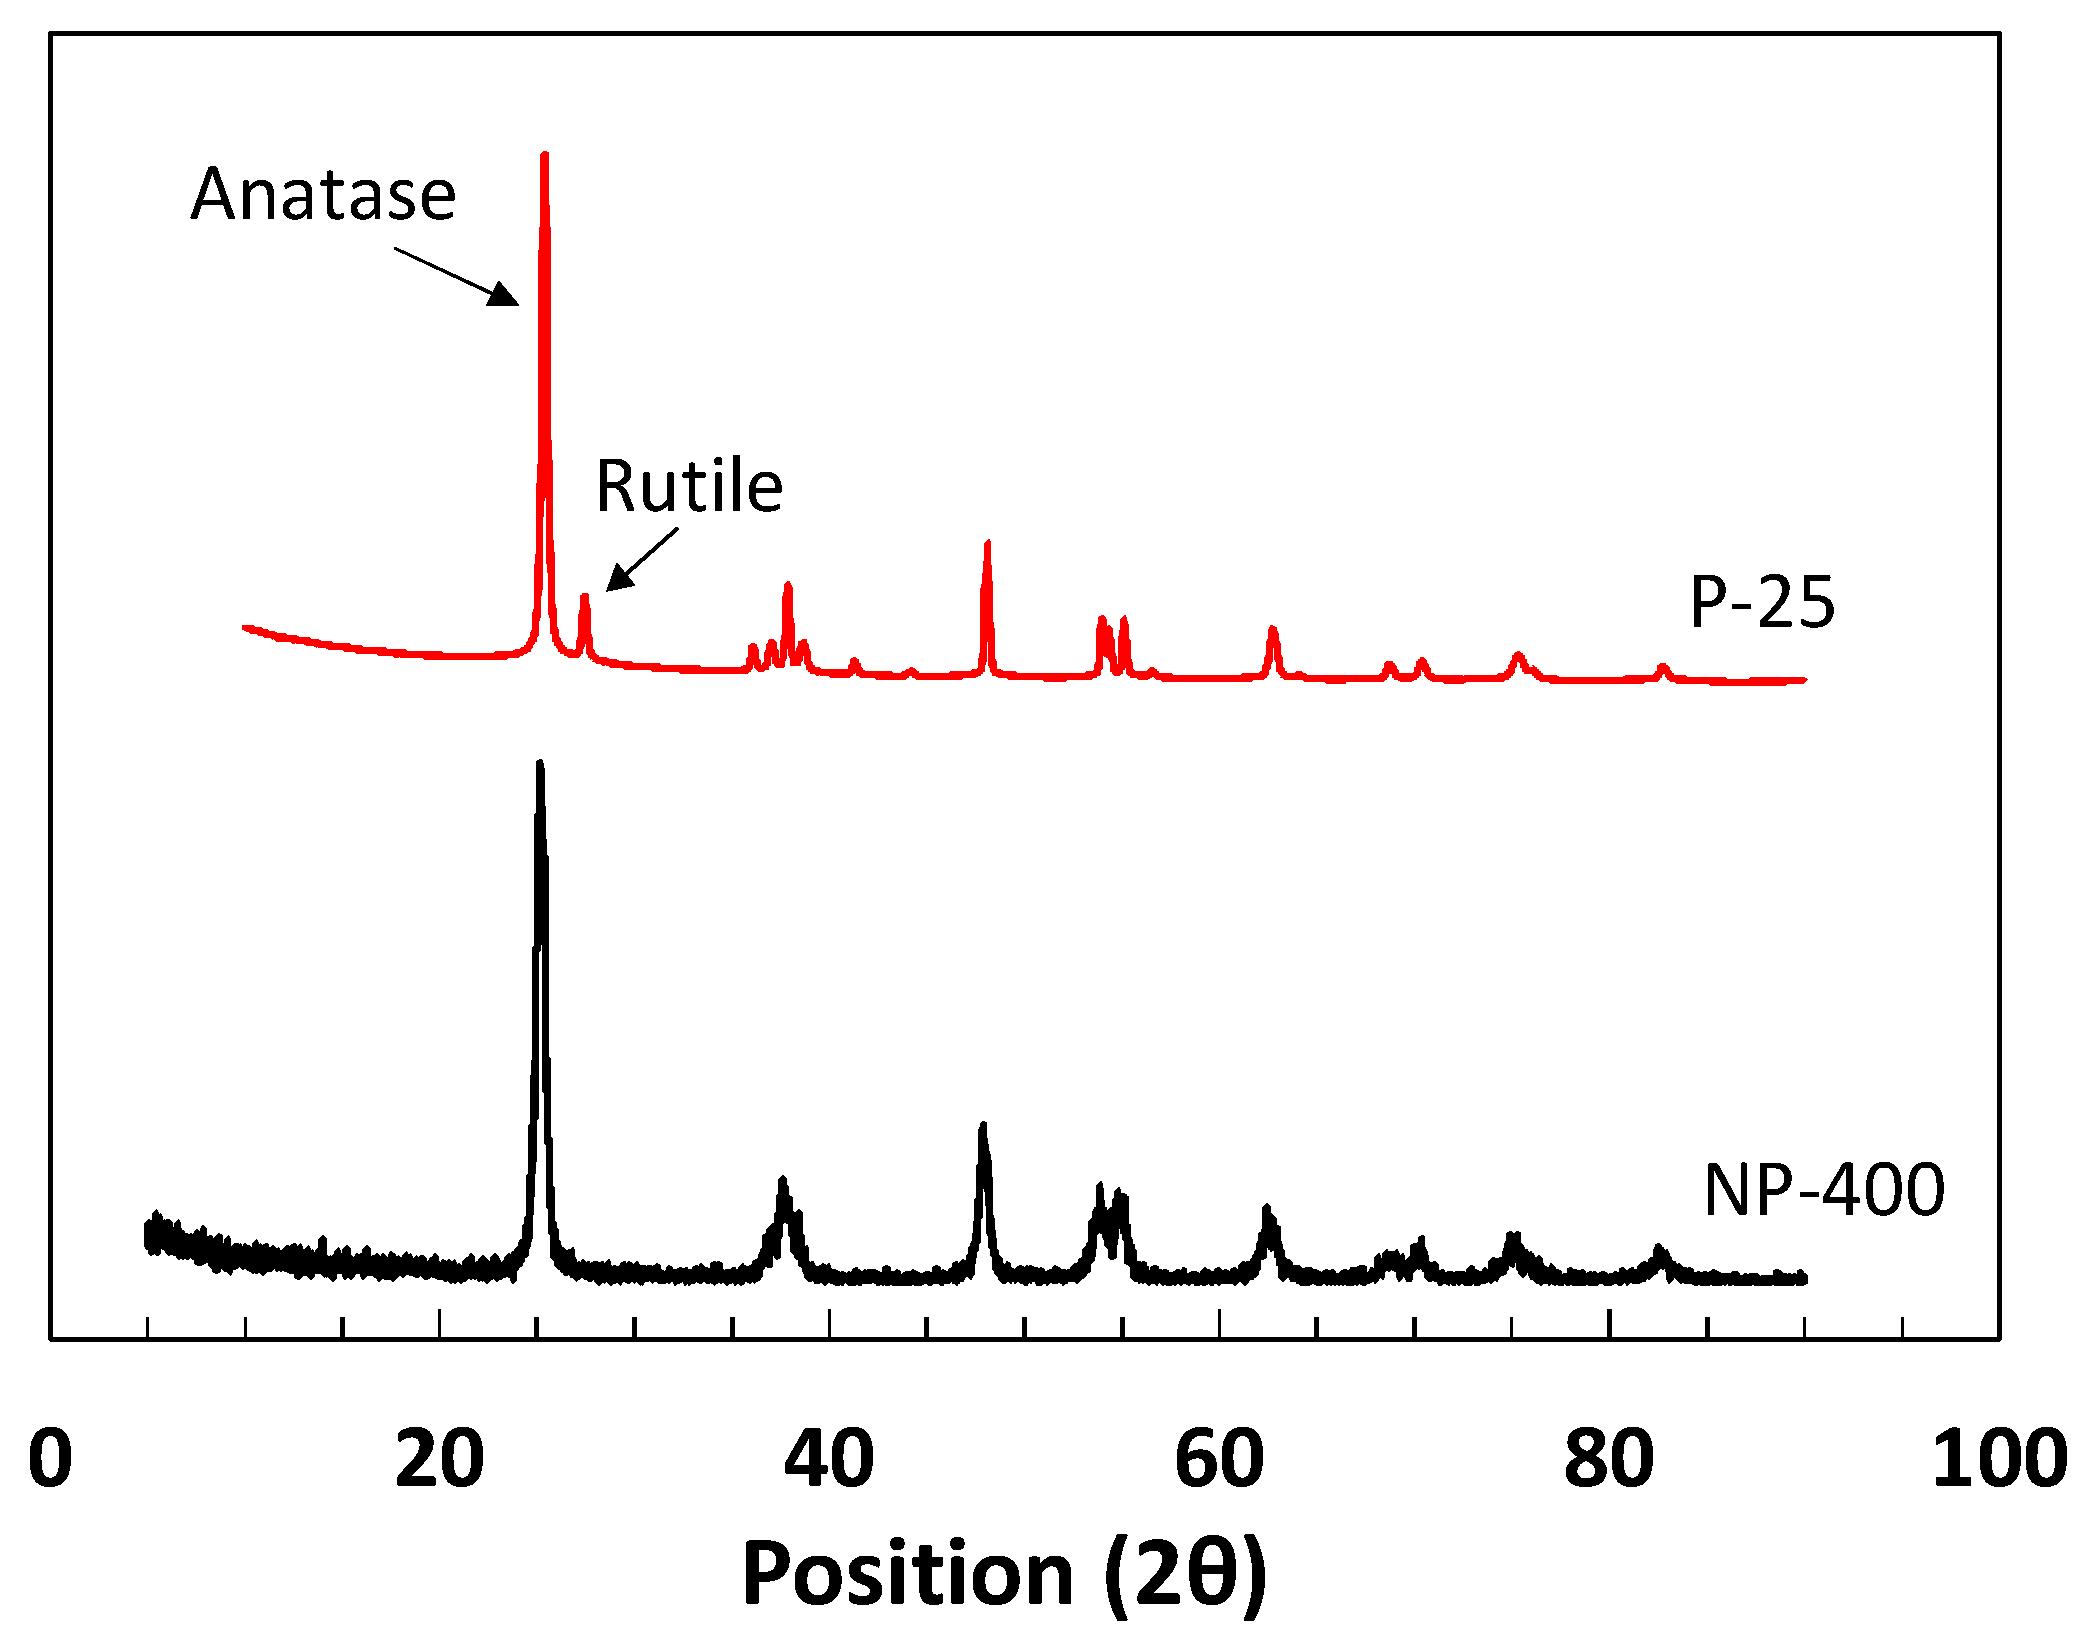
2.1. Commercial Titanium Dioxides

Titanium chloride, TiCl4, is normally extracted from titanium precursor using hydrochloric acid. When water is added, hydrolysis produces titanium hydroxide, Ti(OH)4. After drying, the Ti(OH)4 powder is held in a vertical rotary kiln at 600 °C for 4–5 h; NP-400 collects in the bottom of the kiln. P-25 is relatively bulky and fluffy, because it is rapidly produced by direct spraying of TiCl4 into the kiln at 1000–1200 °C; the particles are minimally agglomerated. As the burn temperature is lower, NP-400 is anatase-like, thus unstable; P-25 is more stable. Normally, crystallinity is crucial in terms of a higher burn temperature. However, an unstable (amorphous) structure may be more photocatalytic after hydration within cementitious materials. In large-scale civil engineering projects, the price of TiO2 is critical. The cost of NP-400 is only 50% that of P-25, but the material performances are similar. Table 1 compares NP-400 and P-25. The apparent density of P-25 (in mixed rutile/anatase phases; Evonik, Essen, Germany) is 0.18 g/mL, whereas that of NP-400 (anatase phase; Bentech Frontier, Gwangju, Korea) is 0.45 g/mL. The volume occupied by P-25 is 2.5-fold that of NP-400 within the same mass. Figure 1 shows the transmission electron microscope (JEM-2100F, JEOL, Tokyo, Japan) images of NP-400 and P-25. Fifty TiO2 particles of each of NP-400 and P-25 were evaluated (Figure 2); the average particle sizes were similar. X-ray diffraction (PANanalytical X’Pert, Almelo, The Netherlands) data (Figure 3) revealed that the peak patterns at 25.36–25.38° are similar, being those of anatase-type powders. Slight differences in the peak intensities around 27.41° indicate that rutile-type powders are also present, especially in P-25. Normally, rutile-type powders are more crystalline than anatase-type powders, affecting burn temperatures, as mentioned above.

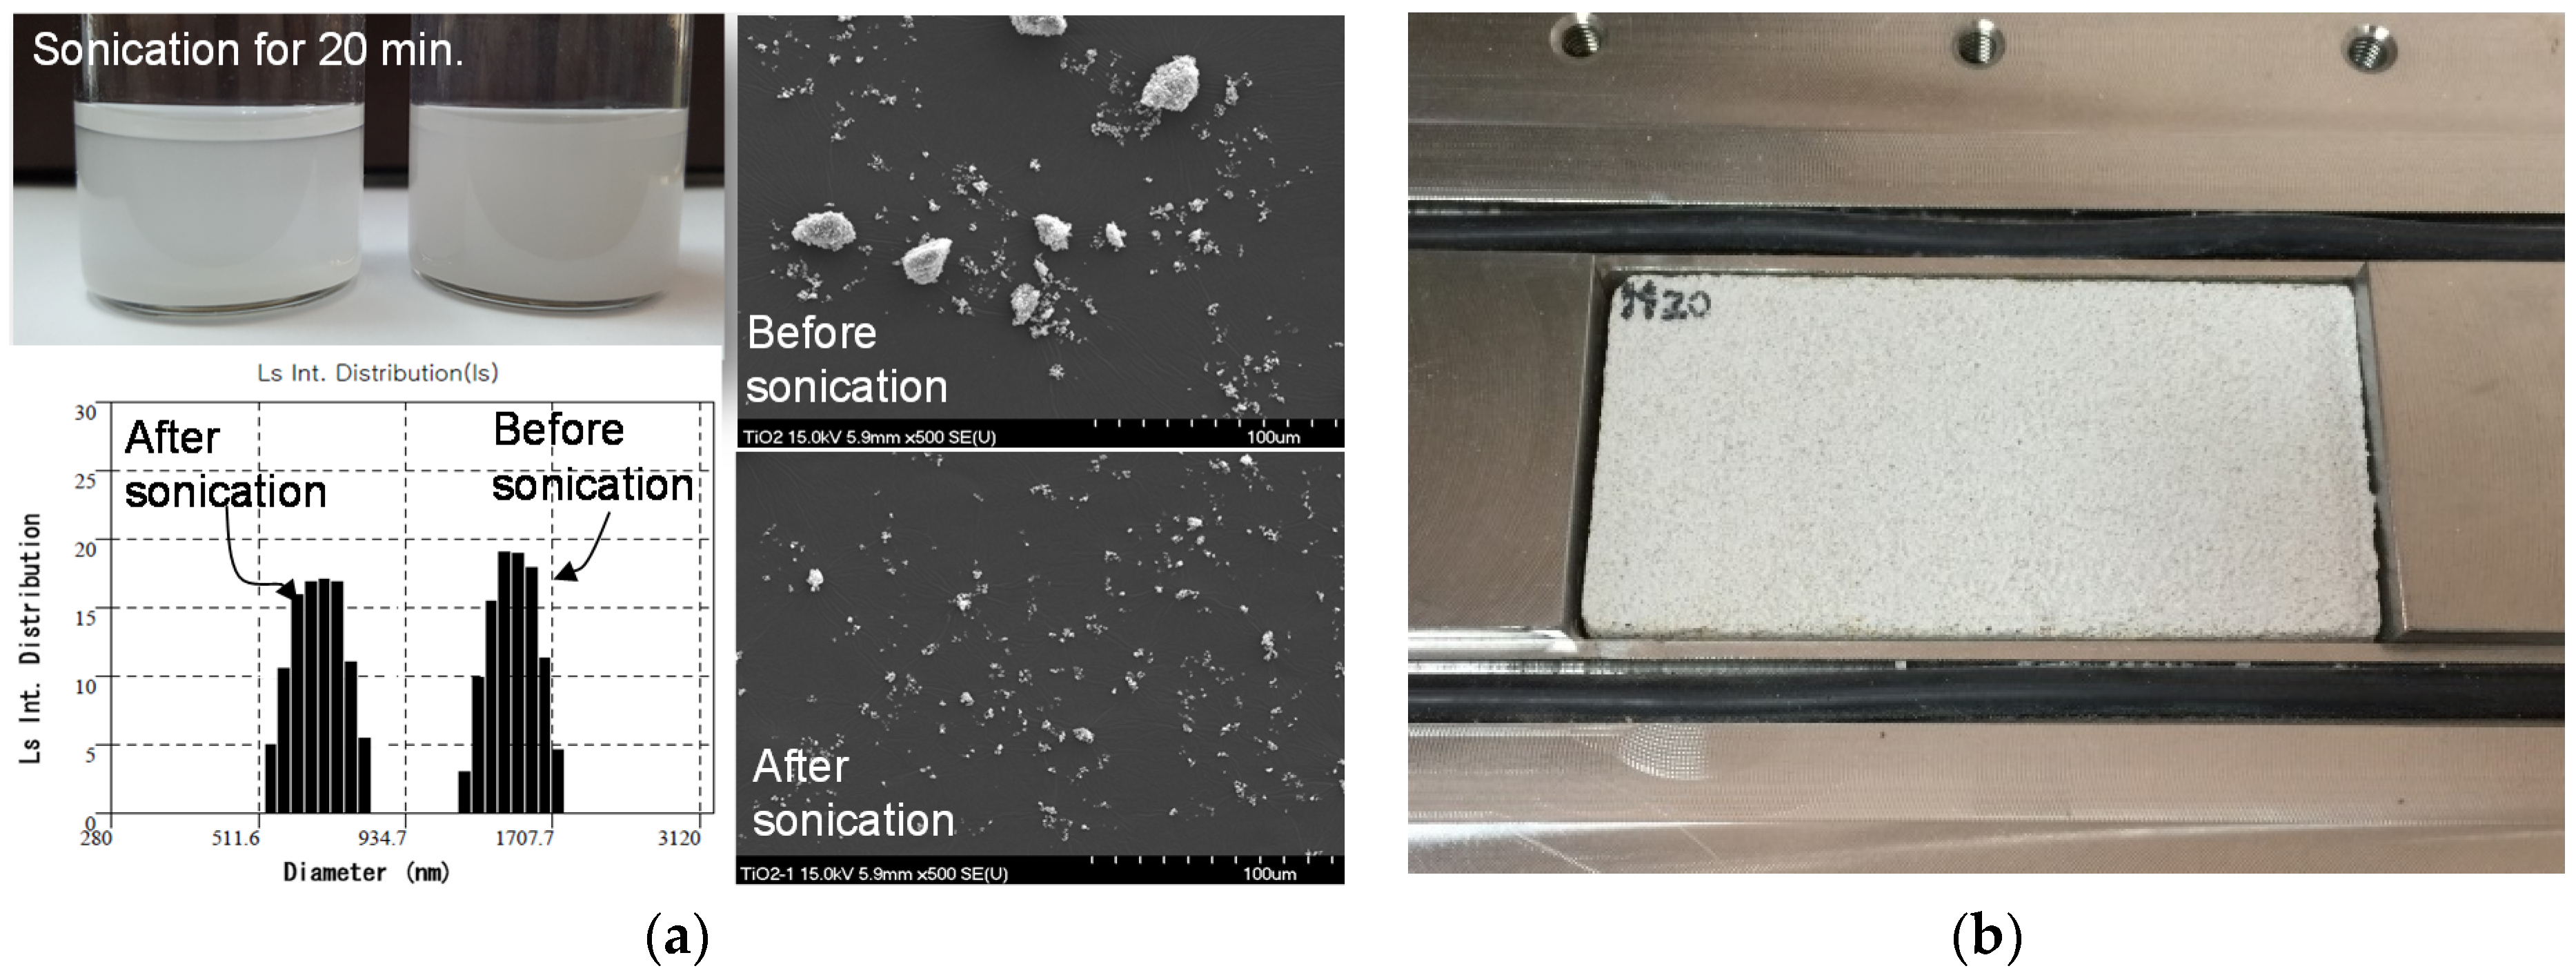
2.2. Cementitious Mixes Preparation

Because NP-400 is cheaper than P-25, the mechanical and catalytic properties of cementitious materials with NP-400 deserve attention. We explored the compressive strengths and photocatalytic sensitivities (NO removal abilities) of such materials (cement paste and mortar) containing NP-400. To ensure that NP-400 inclusion did not compromise strength, NP-400 and P-25 at 0, 5, 10, and 20 wt % were mixed with cement pastes/mortars (5-cm cubes; Table 2). The water/cement ratio of cement pastes was changed between 0.50 and 0.625 (C samples) or between 0.5 and 0.588 (CP samples) for TiO2 contents ranging from 0% to 15% or 20% while for all mortar samples, the water/cement ratio was kept constant and equal to 0.50. If TiO2 was not able to develop pozzolanic or hydraulic activity, a decreasing trend would have been detected for cement pastes added with increasing TiO2 content. In contrast, for mortars, no significant variation in compressive strength values should have been expected. The mass per volume, 0–0.4 mg/mL (Table 2) was applied in this aqueous NP-400 dispersion with ultra-sonication while an ultra-sonication was not applied to aqueous P-25 solution. Dynamic light scattering (DLS) and scanning electron microscopy (SEM) confirmed that the NP-400 clusters were disaggregated (Figure 4), possibly increasing TiO2 concentrations on the top surfaces. These aqueous TiO2 dispersion was added after 5 min–dry mix of cement and sand. Consecutively, 3 more min for wet mix and 1 min for holding were applied before casting specimens. All specimens were de-molded after 1 day of curing at room temperature and placed in water for 27 days. Compressive strengths were measured using the 100-kN universal testing machine.

3. Results and Discussion

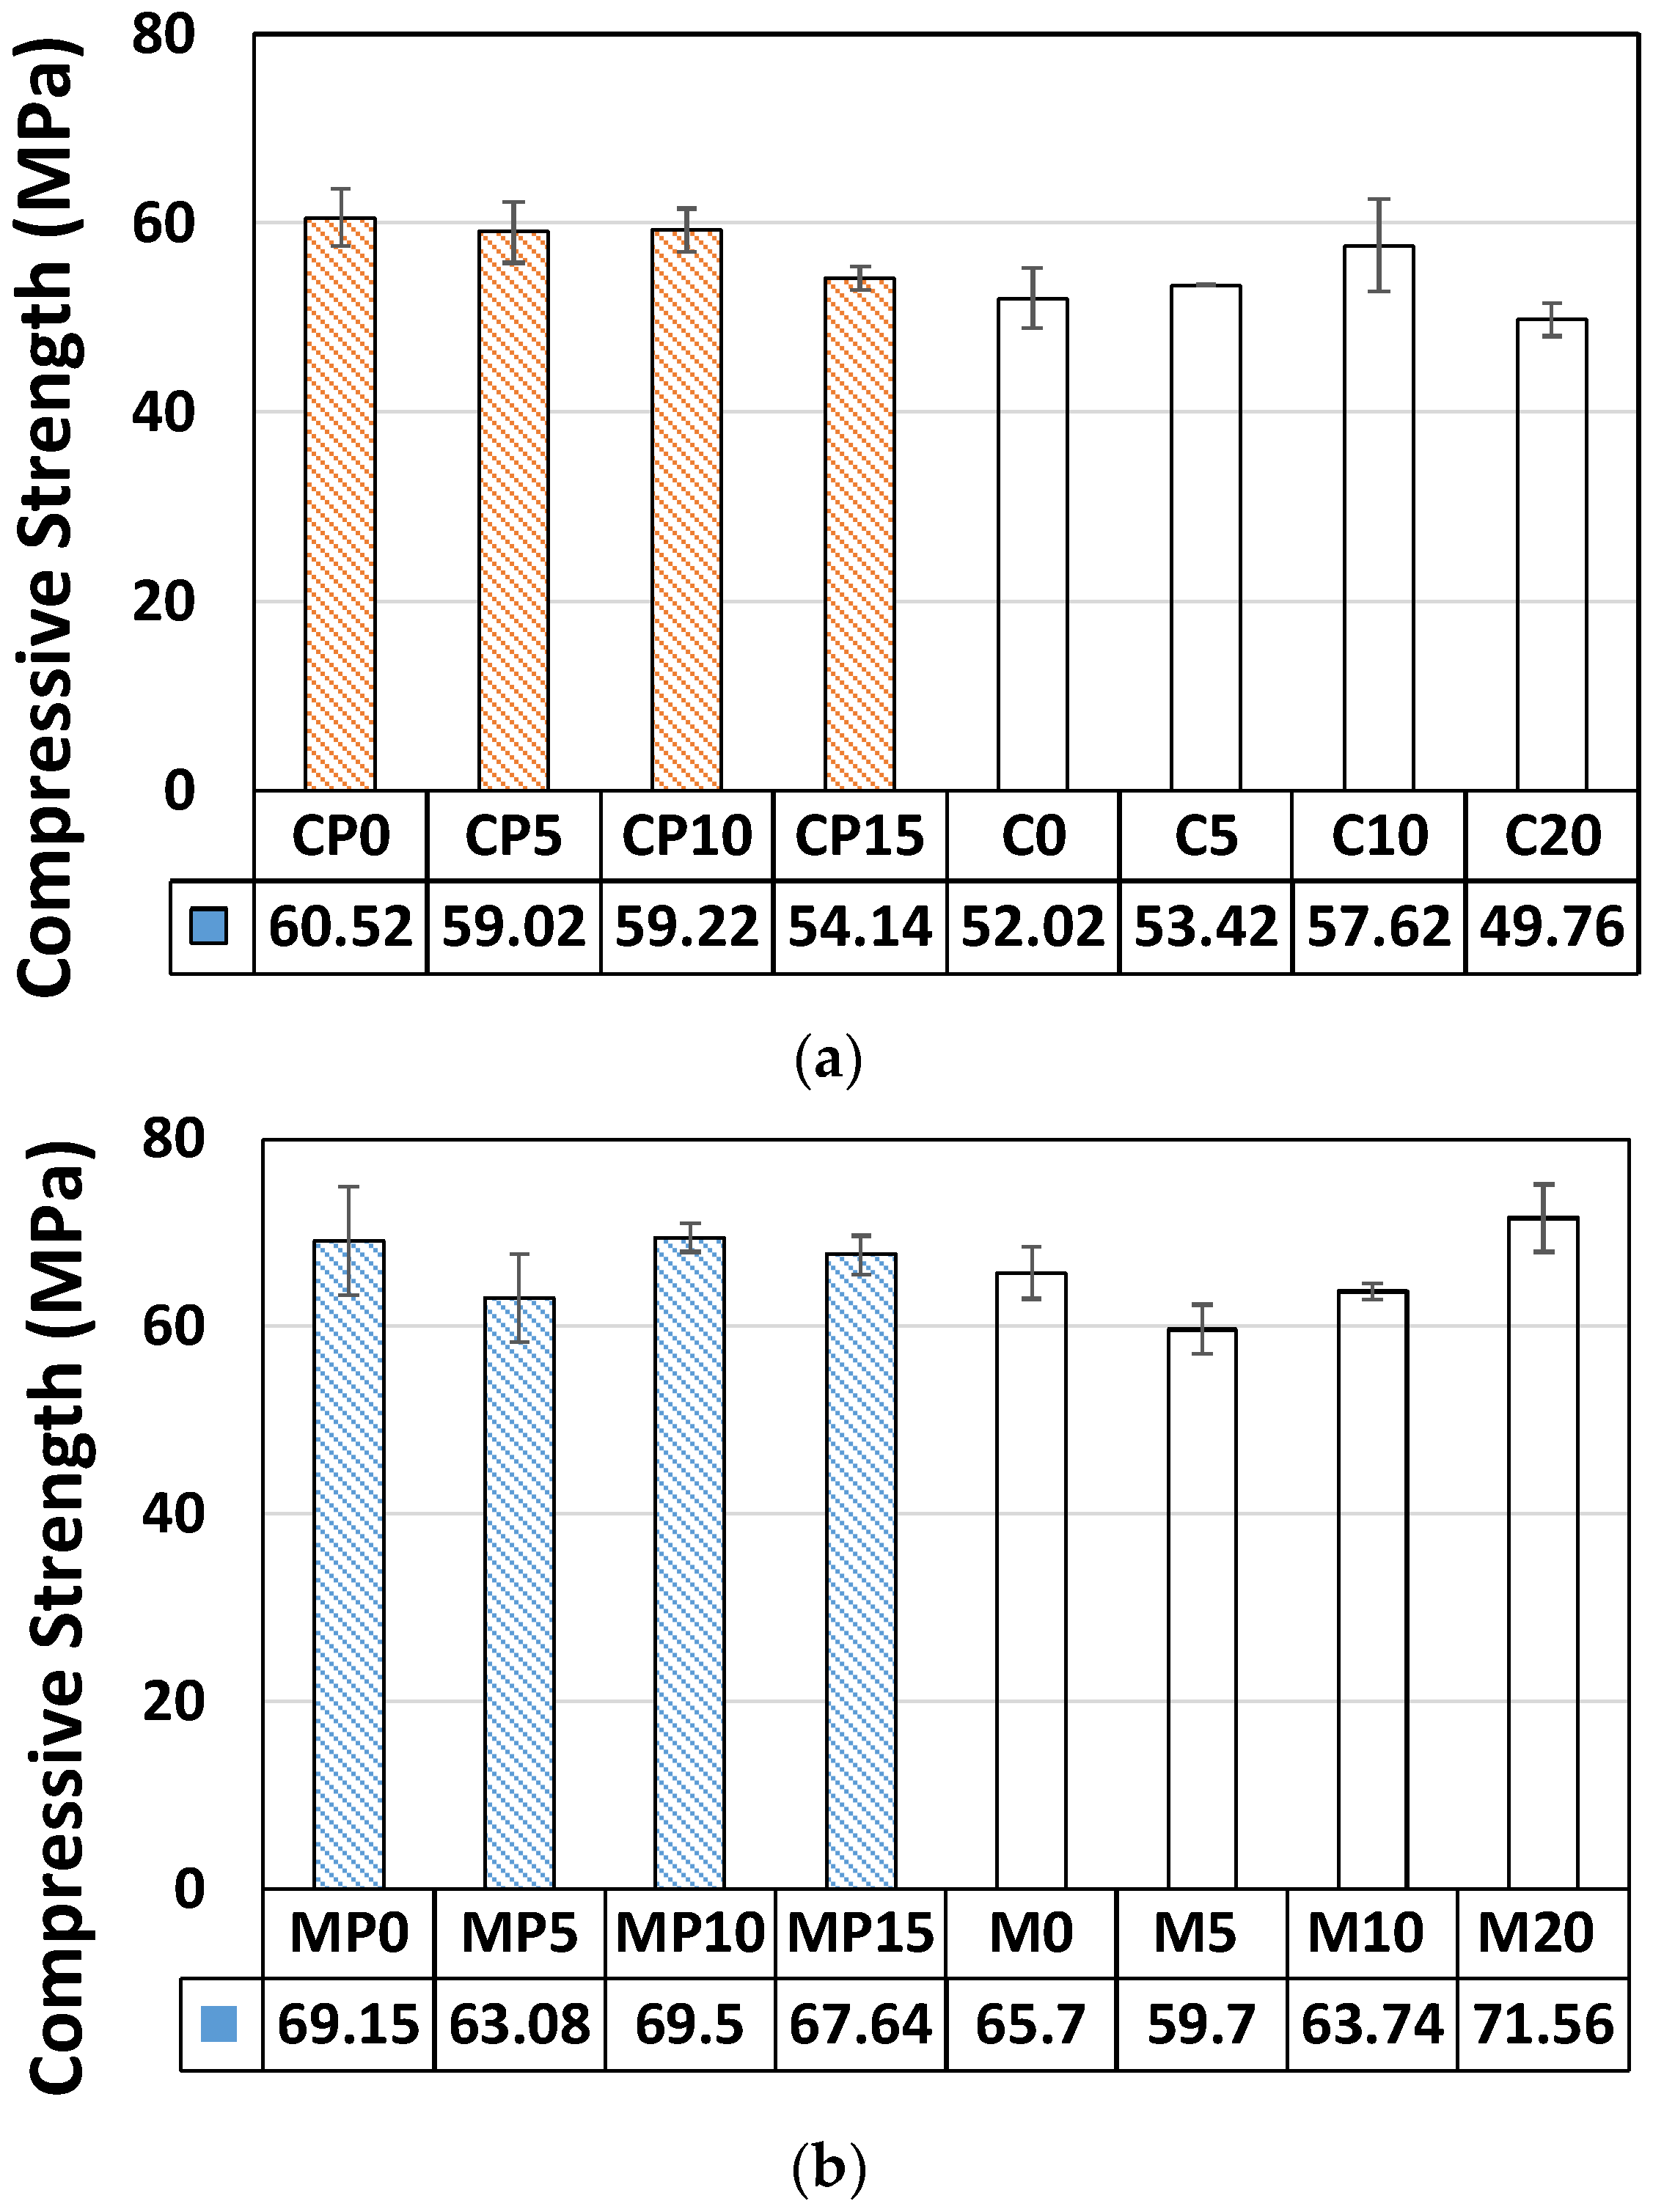
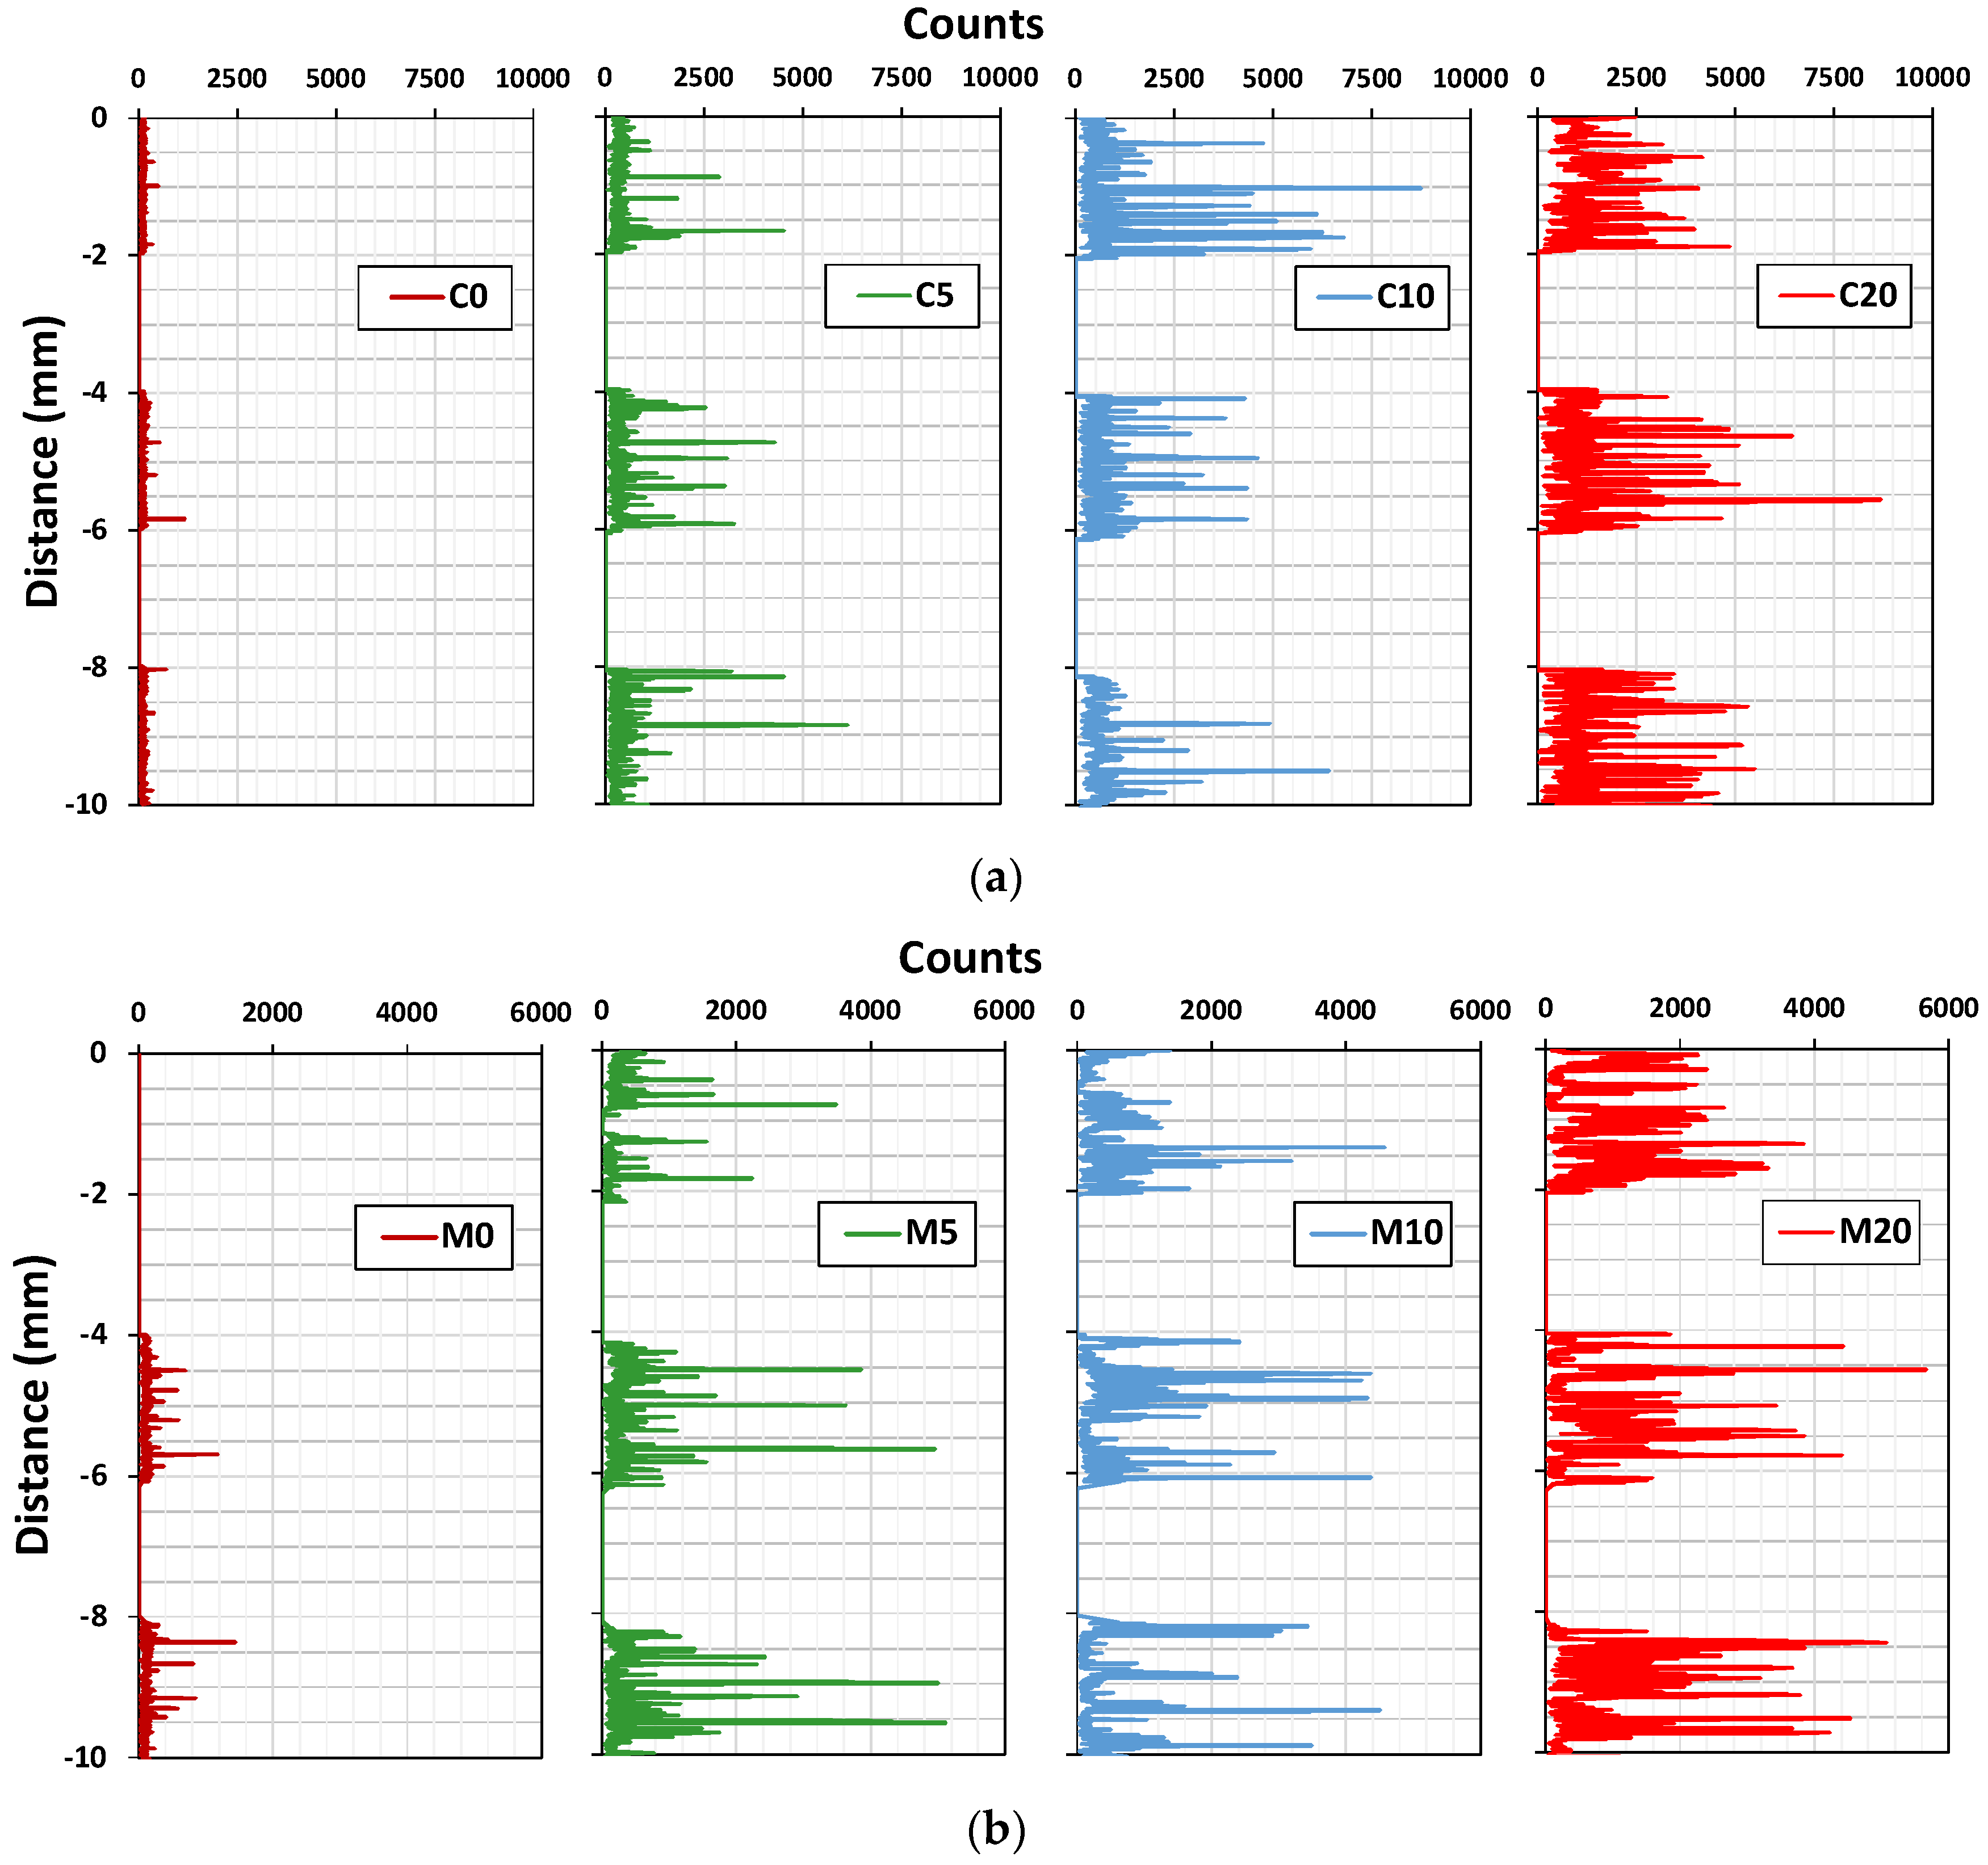
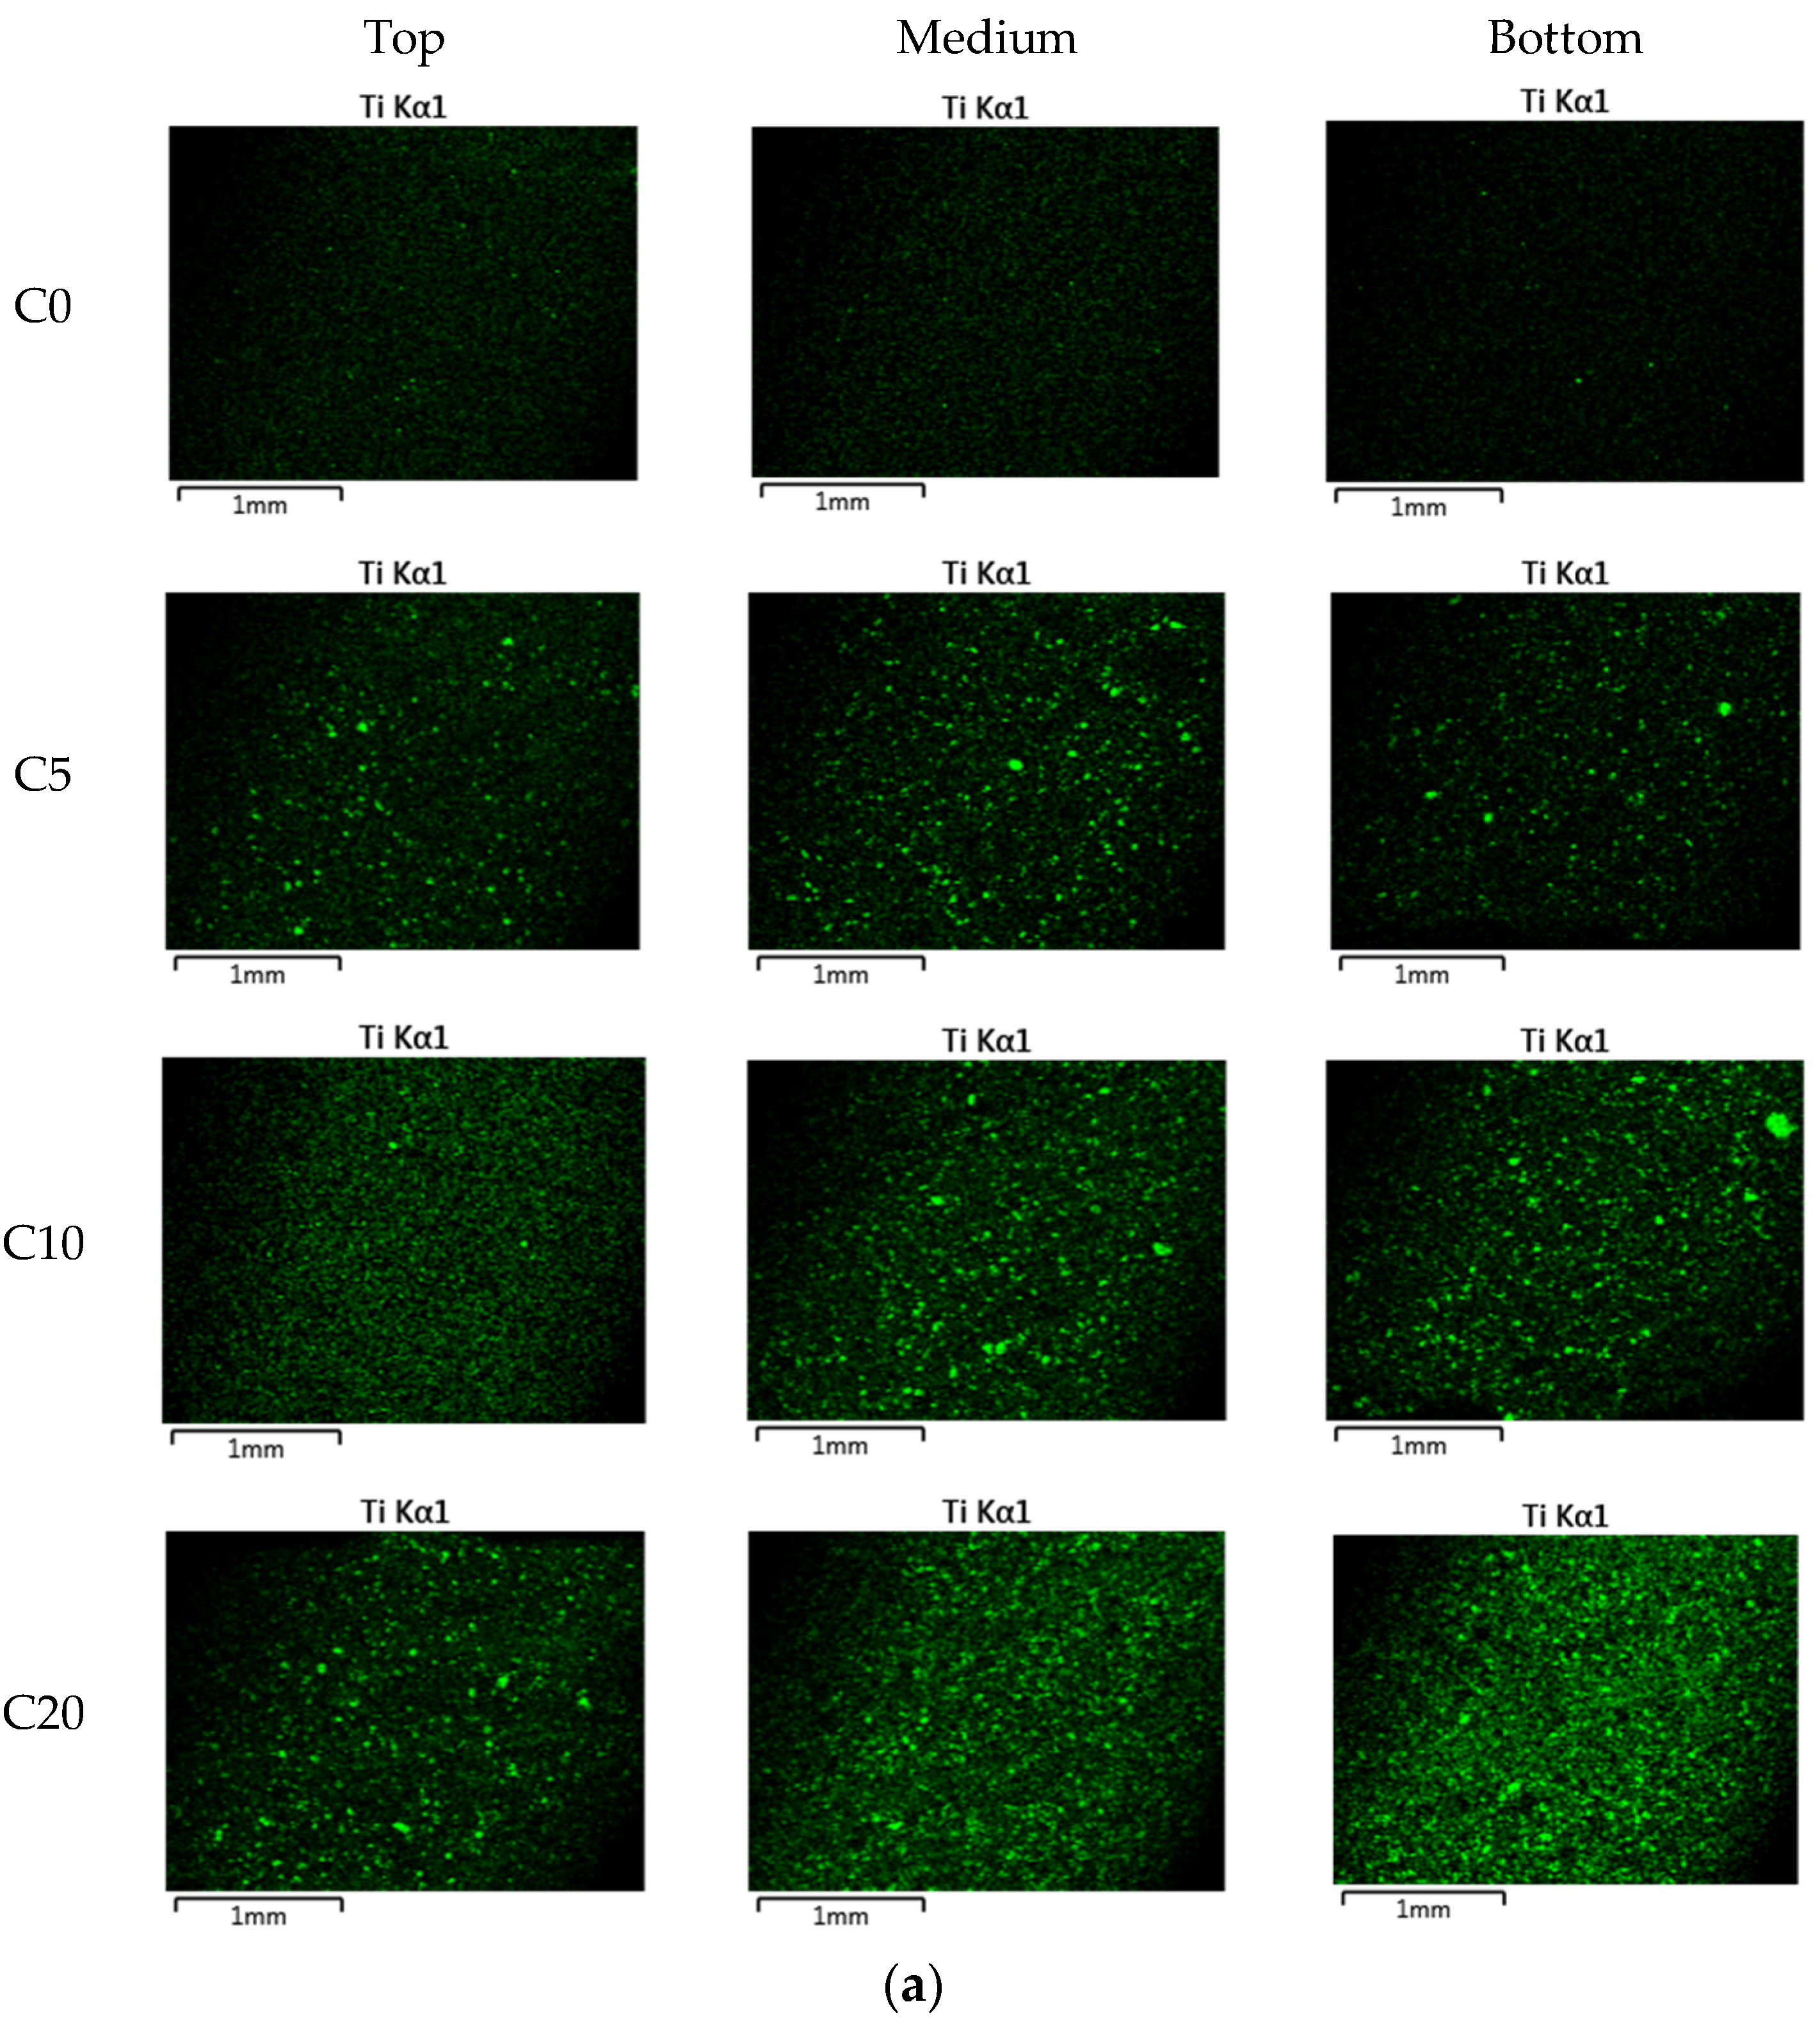
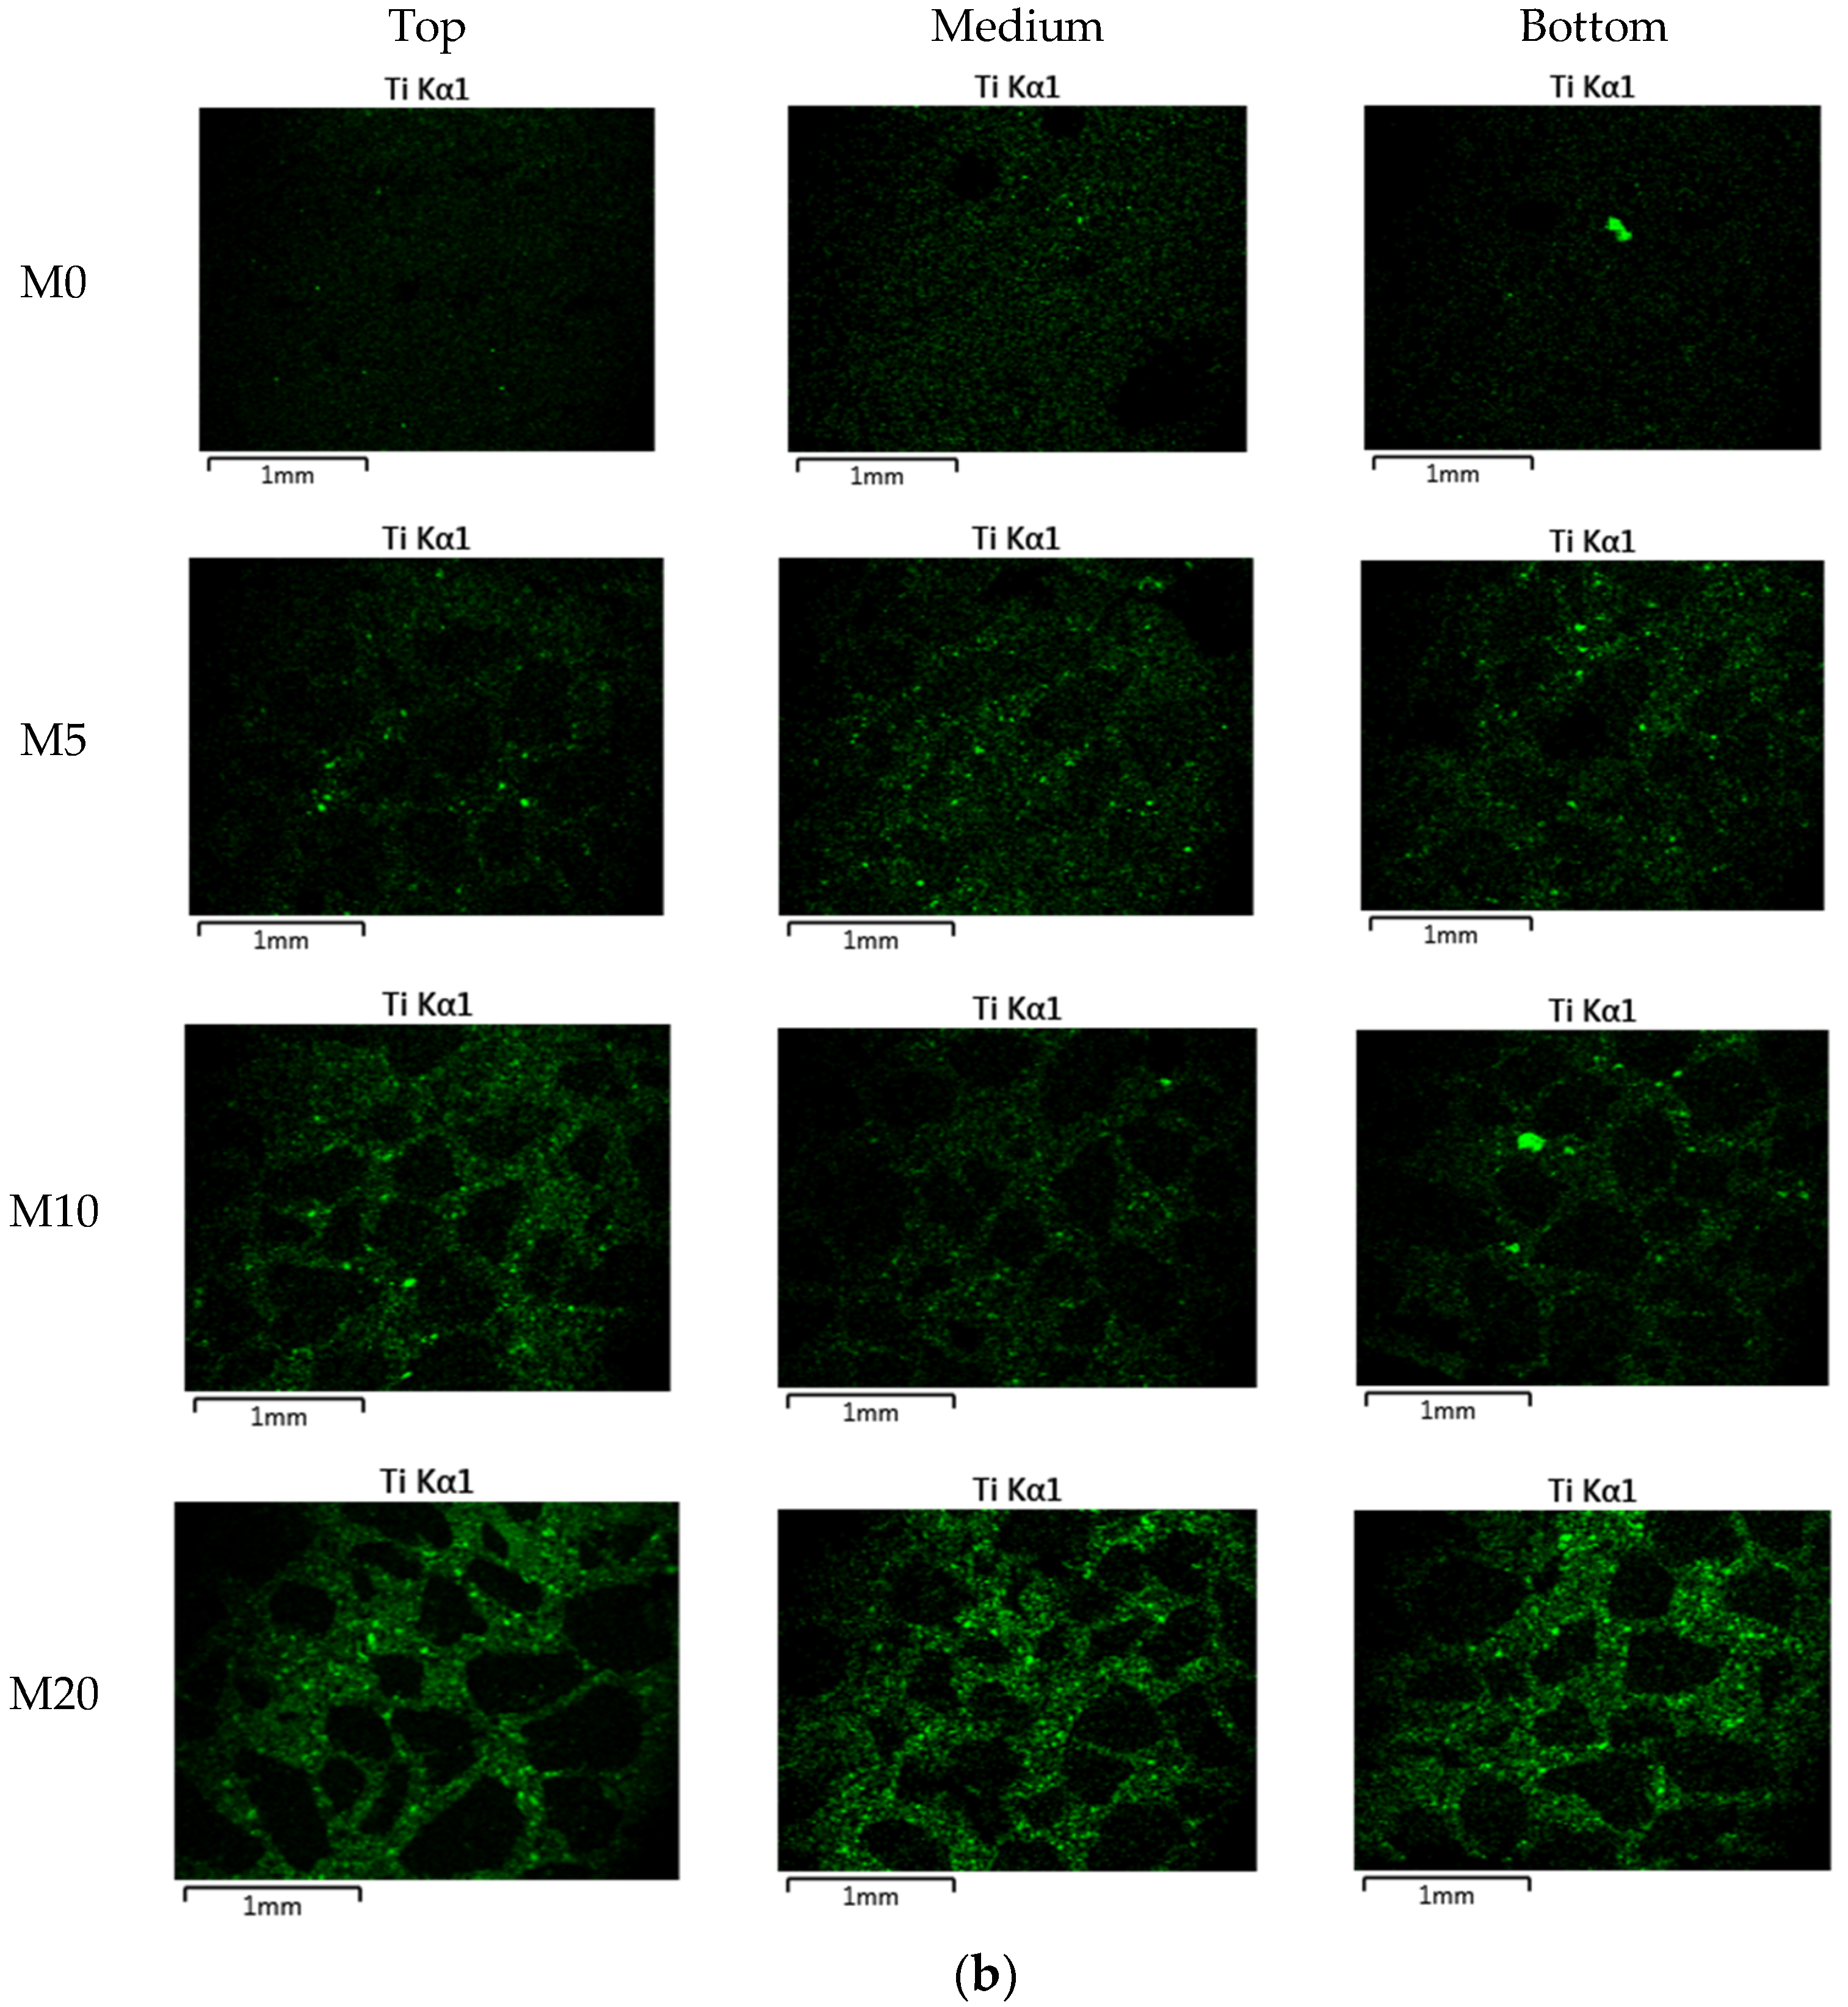
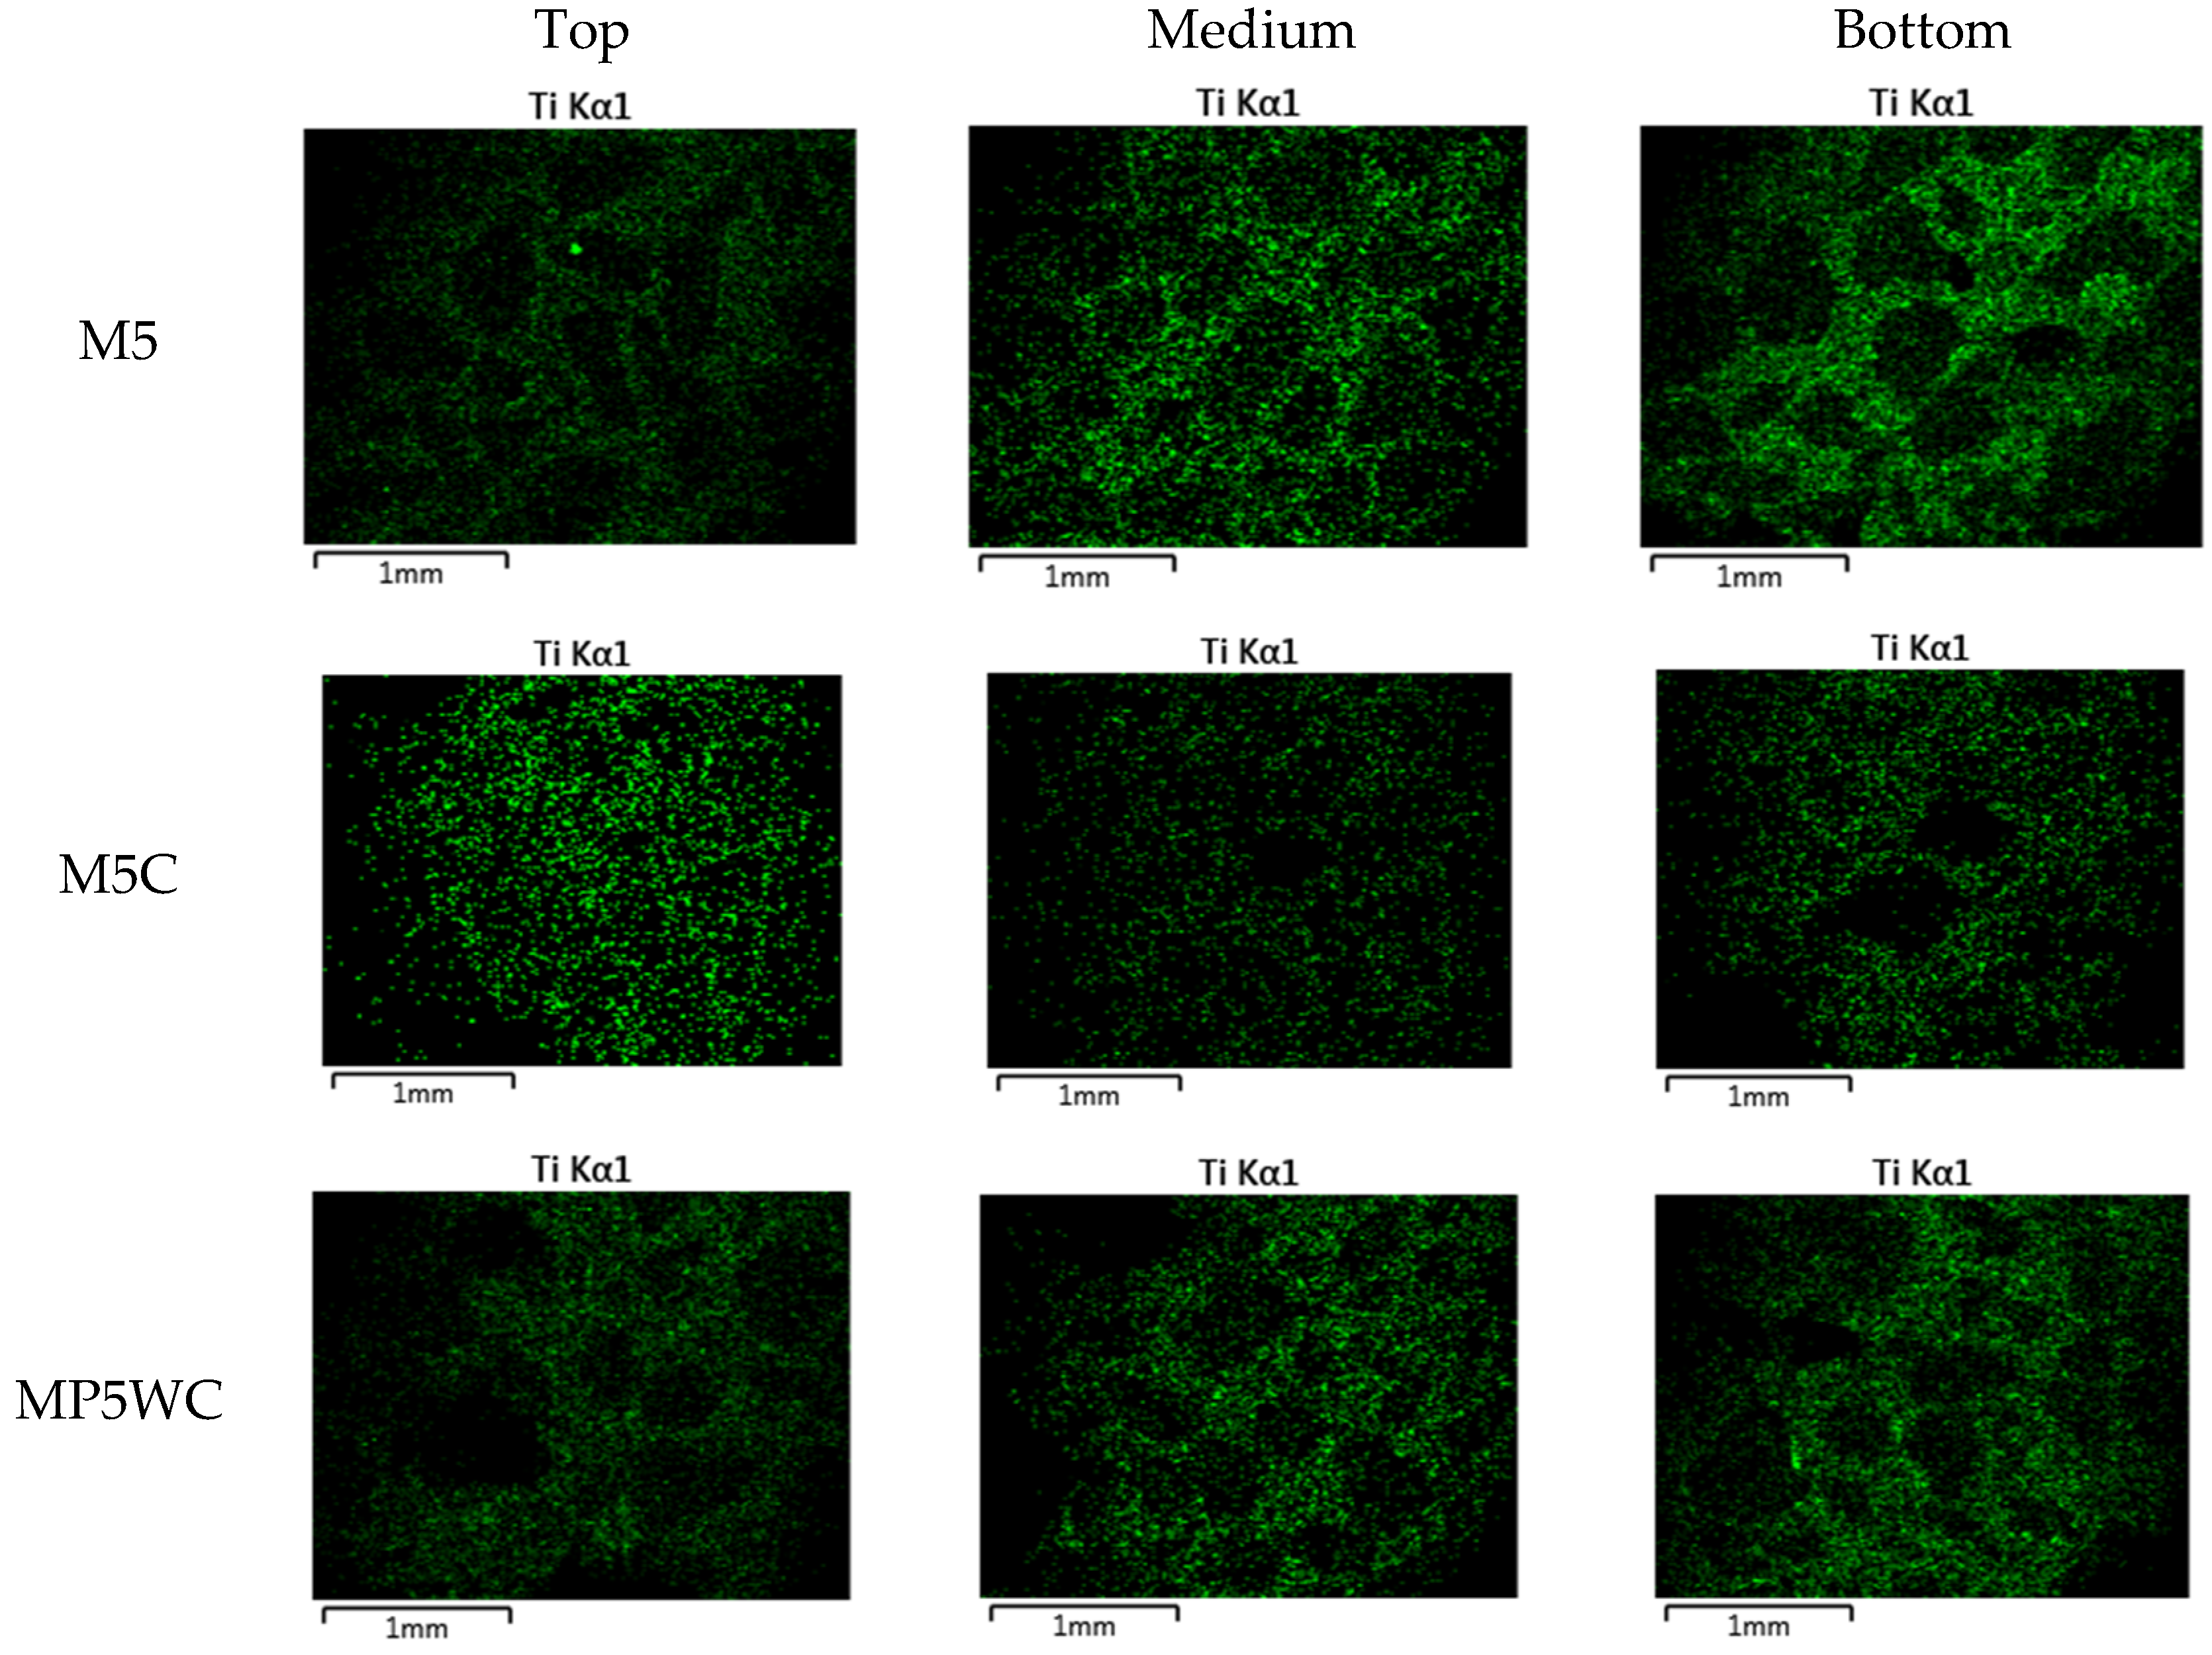
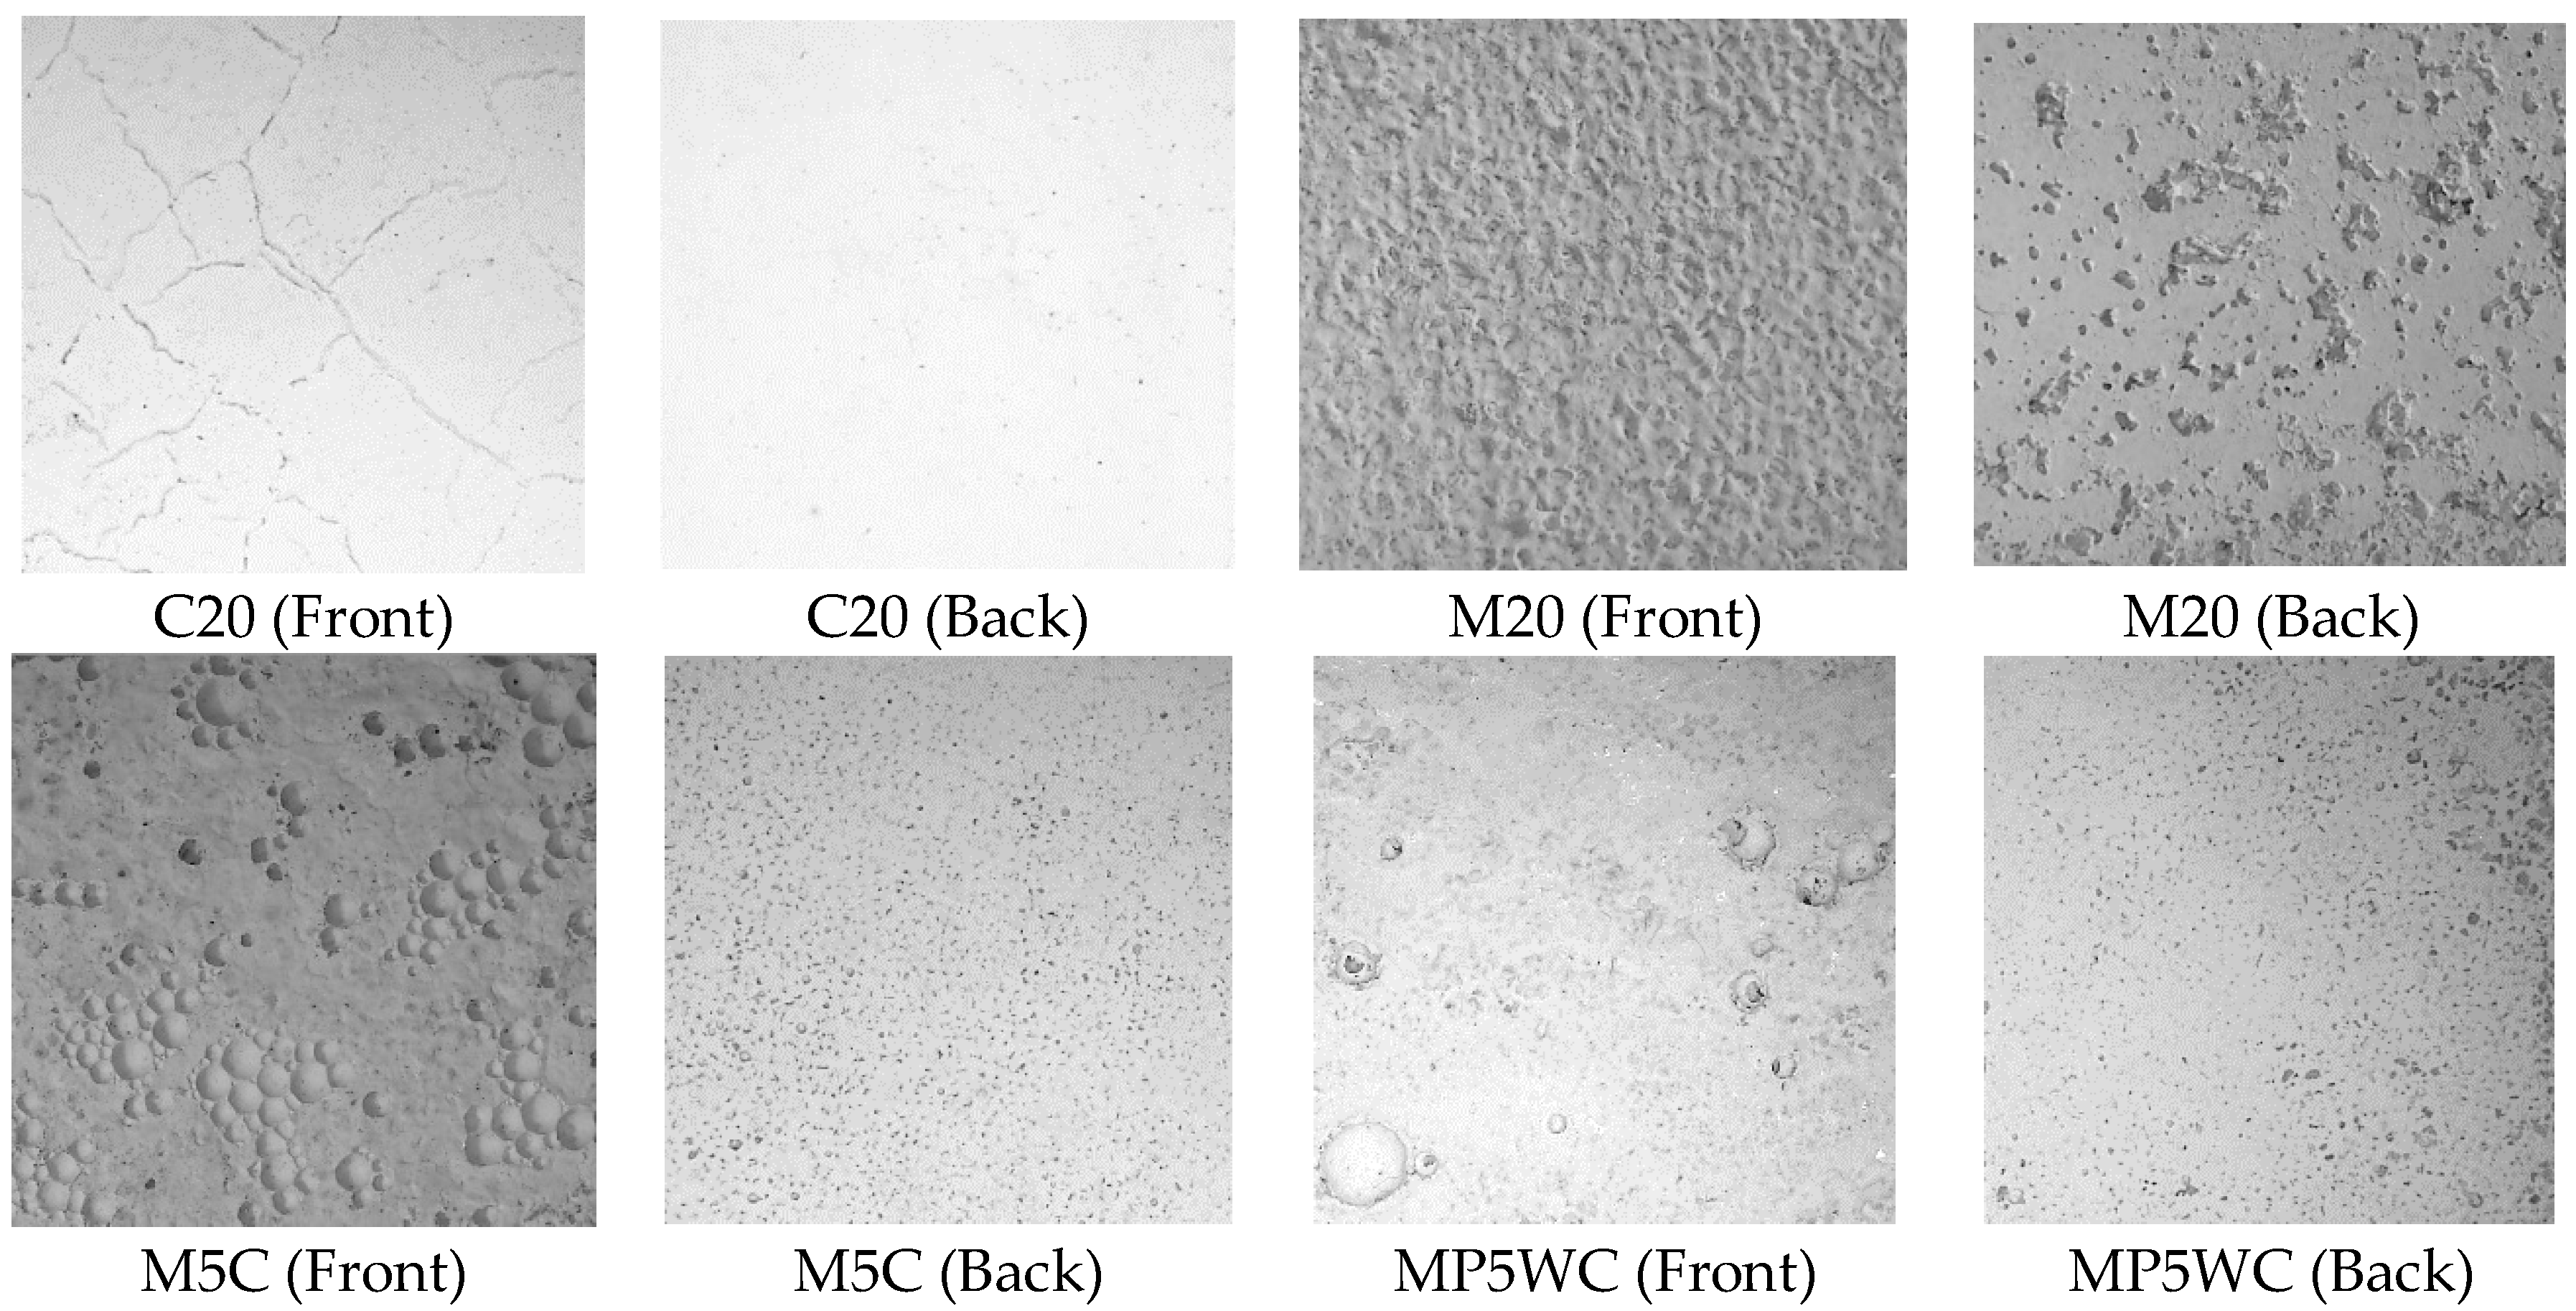
3.1. Mechanical Properties of Cement Pastes and Mortars

We tested 48 specimens (Figure 5; CP: cement paste, and MP: mortar with P-25, C: cement paste, and M: mortar with NP-400). The wt % of NP-400 that referred to the cement content of pastes and to the sand content of mortars ranged from 0–20. For P-25, the wt % values were slightly different (0, 5, 10, and 15) because the P-25 volume at 20 wt % was too large to allow specimen casting. The apparent density of P-25 was 2.5-fold lower than that of NP-400. Figure 5 shows that the compressive strengths of cement paste has descending tendencies with increasing wt % of NP-400 and P-25. This indicates that the very small pozzolanic activities of TiO2 in the hydration process [12] may lead to these strength reductions. While the wt % of TiO2 referred to the sand content of mortar specimens, no significant change of strength was shown. Locally, the standard deviations (P-25 and NP-400 groups; Figure 5) were sc-P25 = 2.95 and sc-NP400 = 4.93 for cement paste specimens, and sm-P25 = 0.93 and sm-NP400 = 2.08 for mortar specimens. The deviations from the means were better in the P-25 groups, attributable to internal microvoids in the TiO2 clusters. P-25 has more voids than NP-400; loose bonding between molecules improves dispersion within cementitious materials. NP-400 is heavier than similar volumes of P-25 and cement powder, compromising dispersion within fresh cementitious materials. The changes in the standard deviations (Δs values) for both cement paste and mortar specimens containing P-25 and NP-400 were consistently about unity. Thus, future work should seek to control NP-400 fineness.

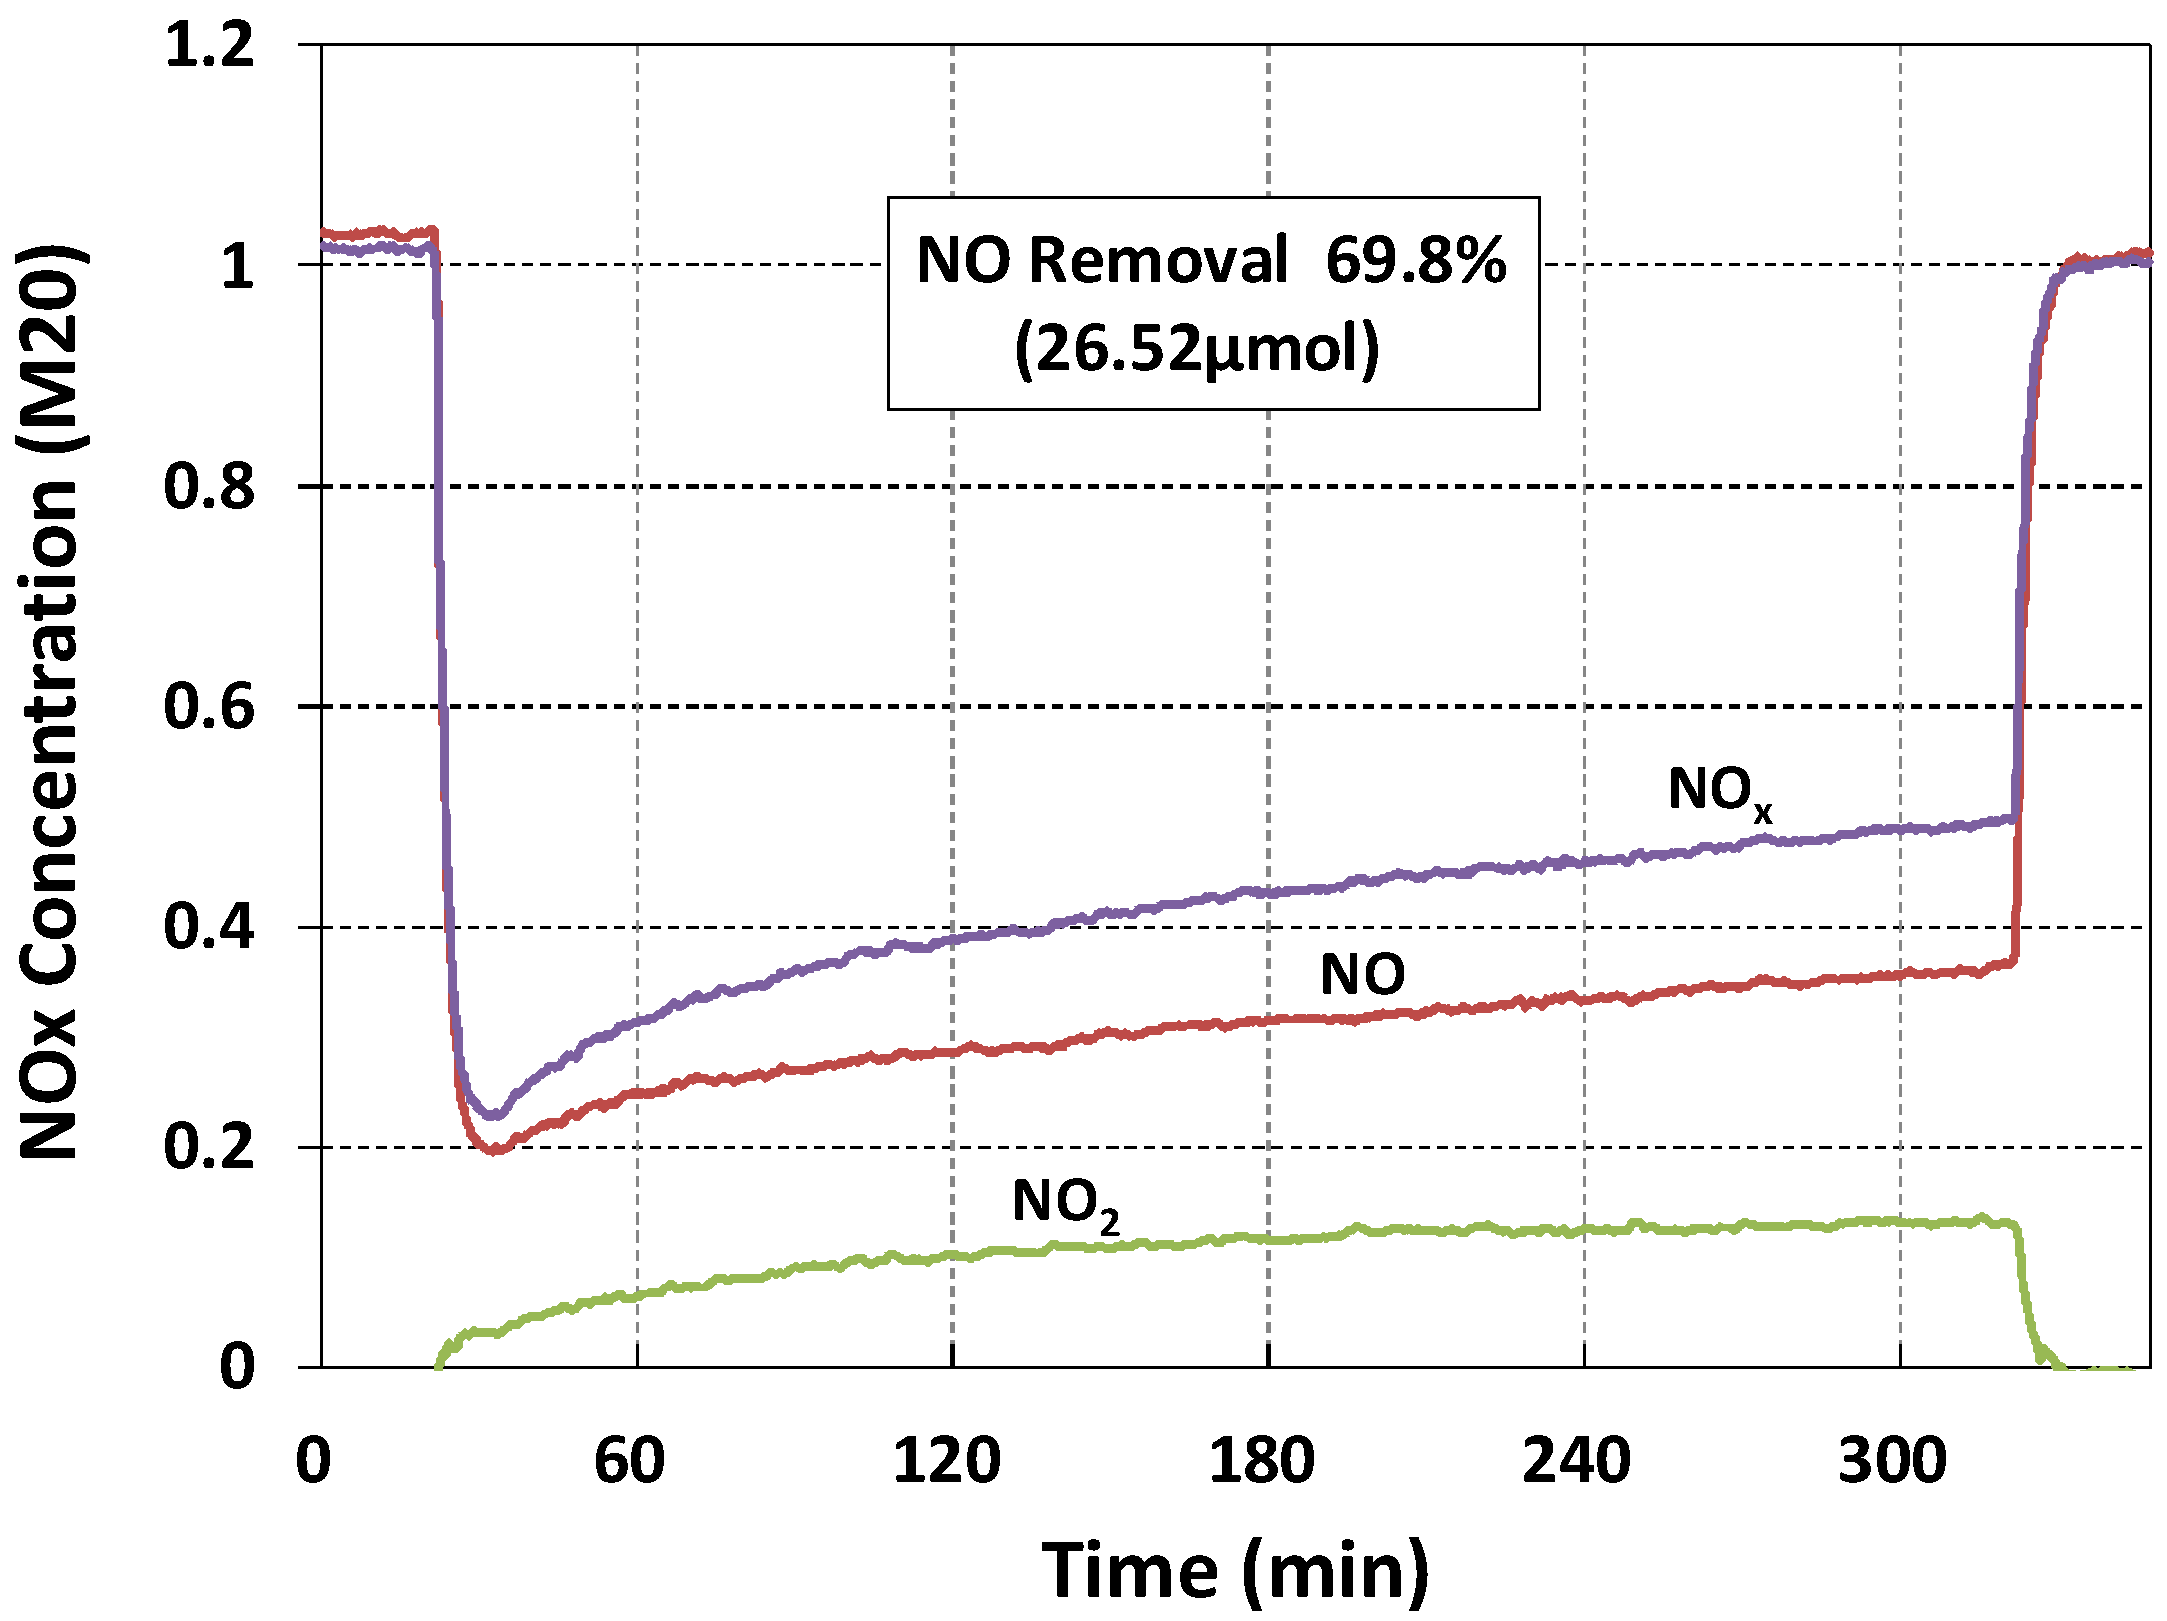
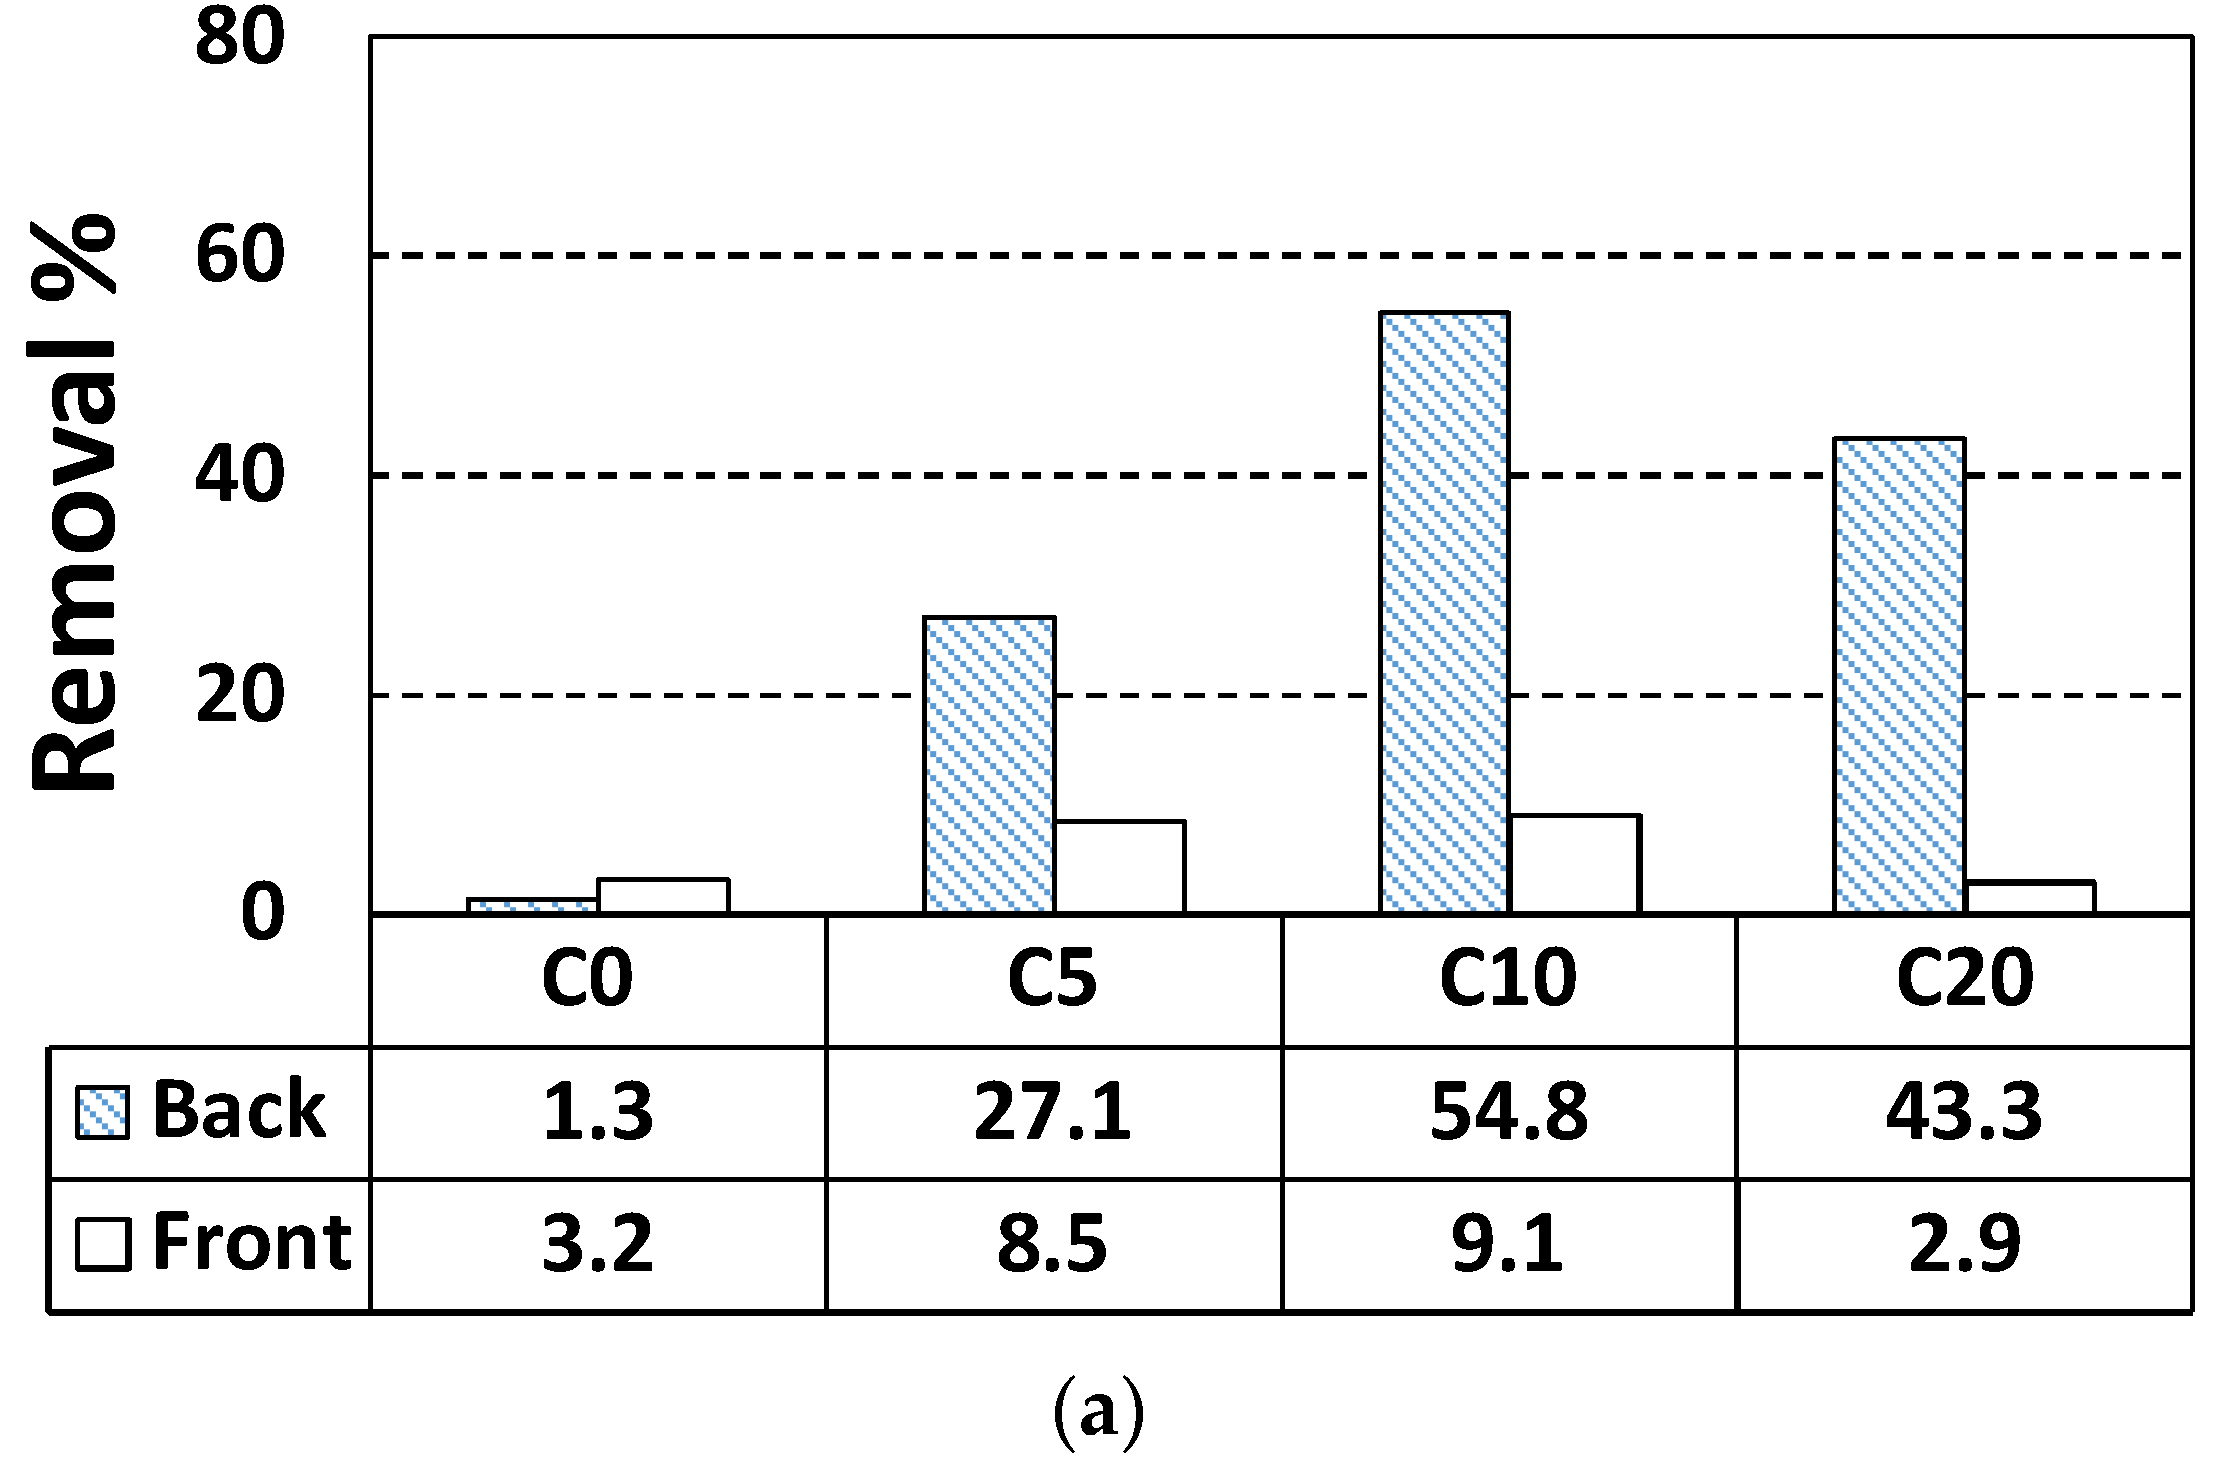
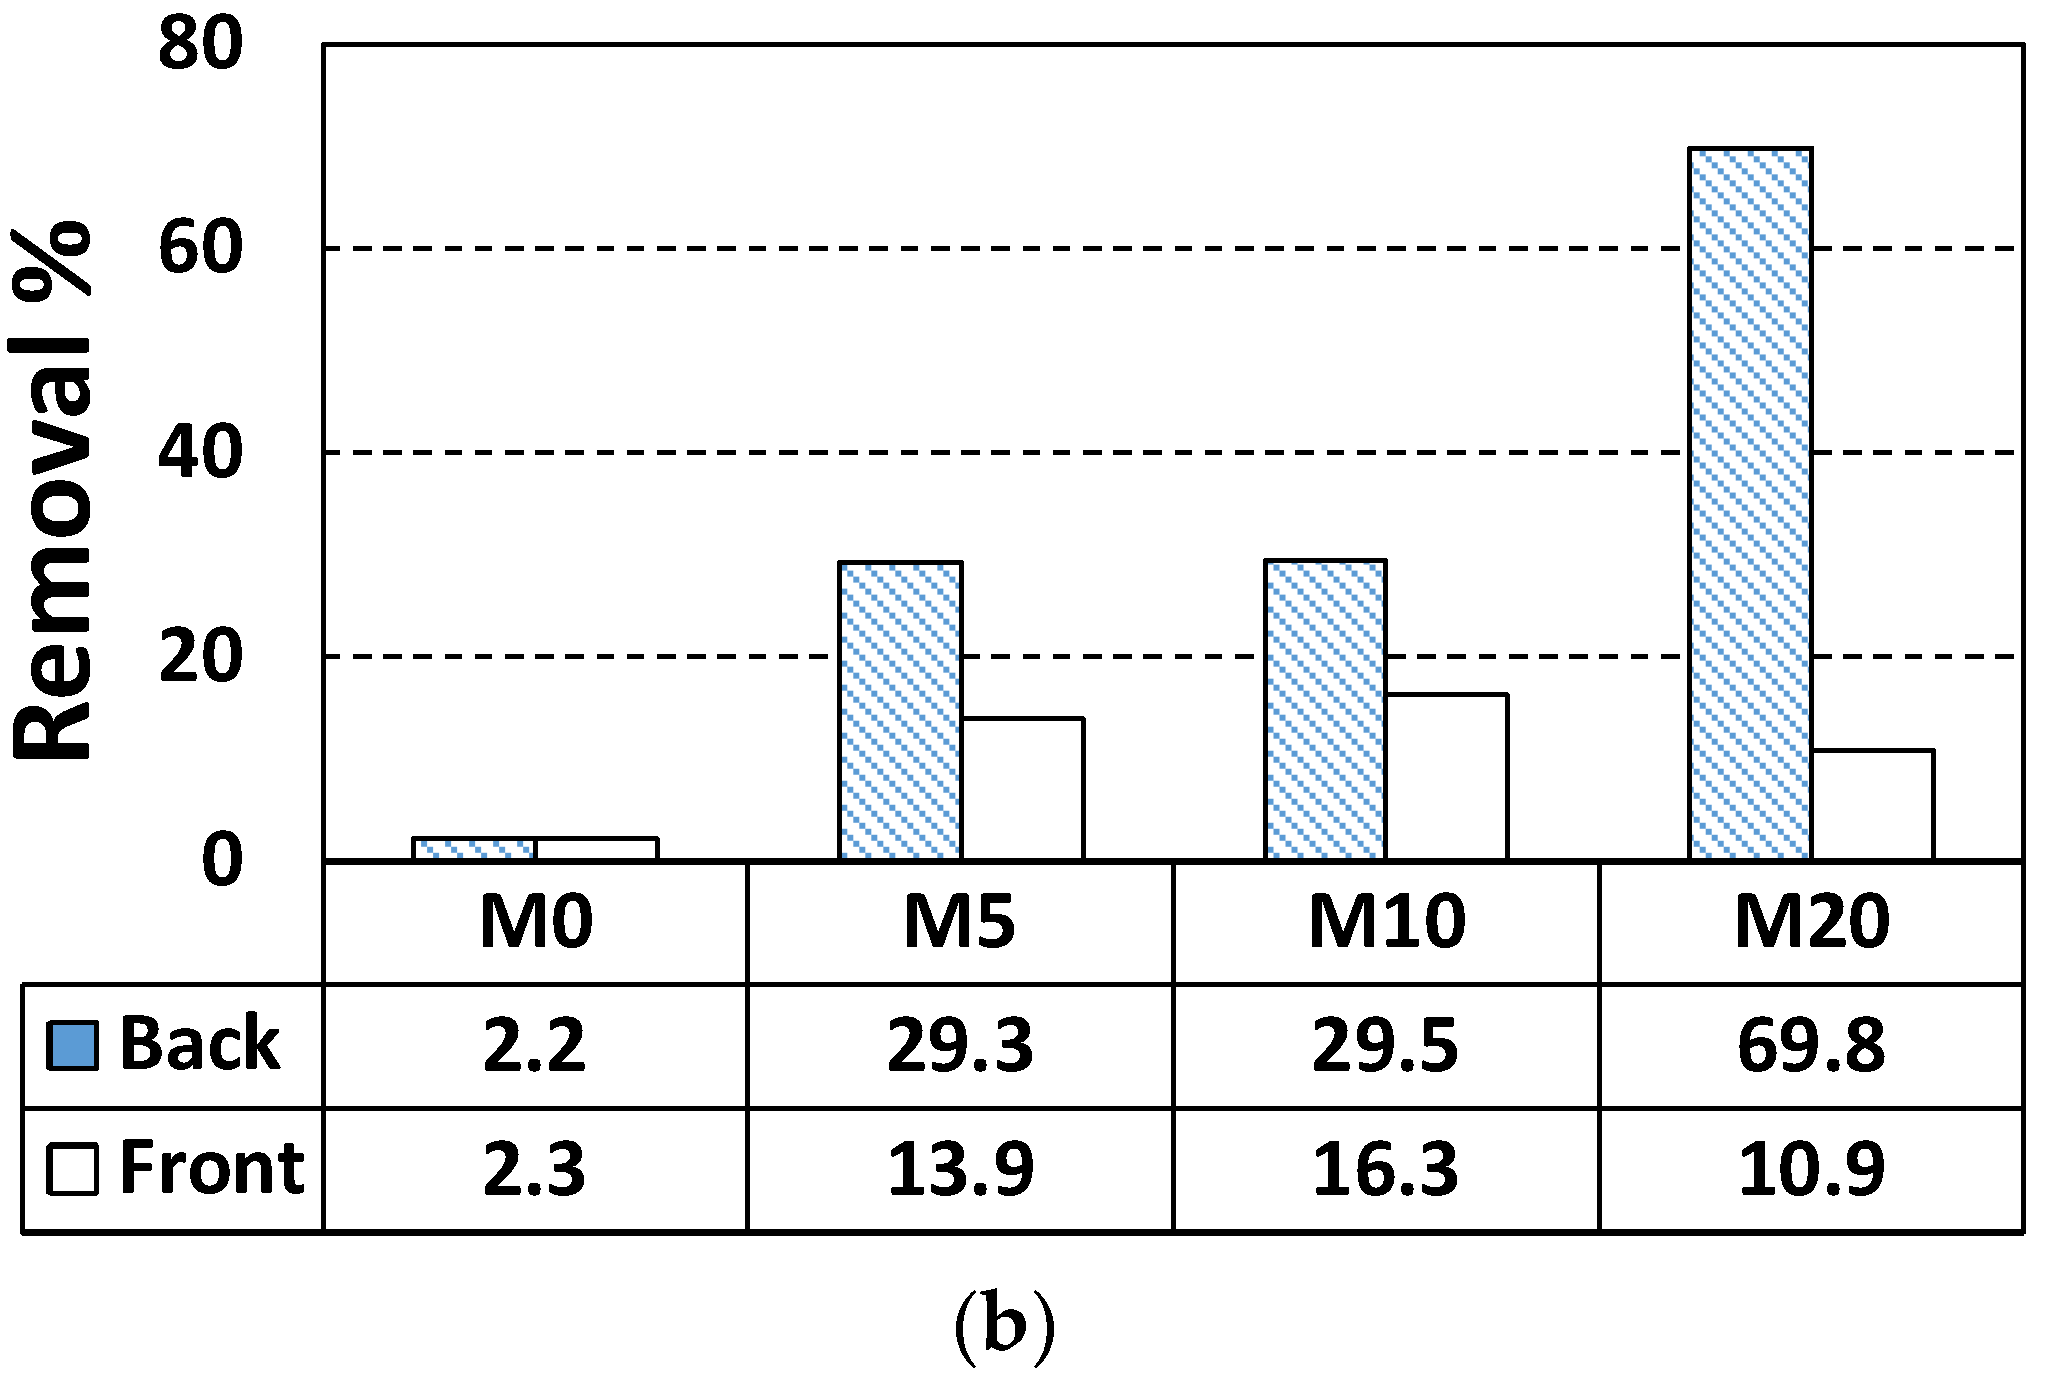
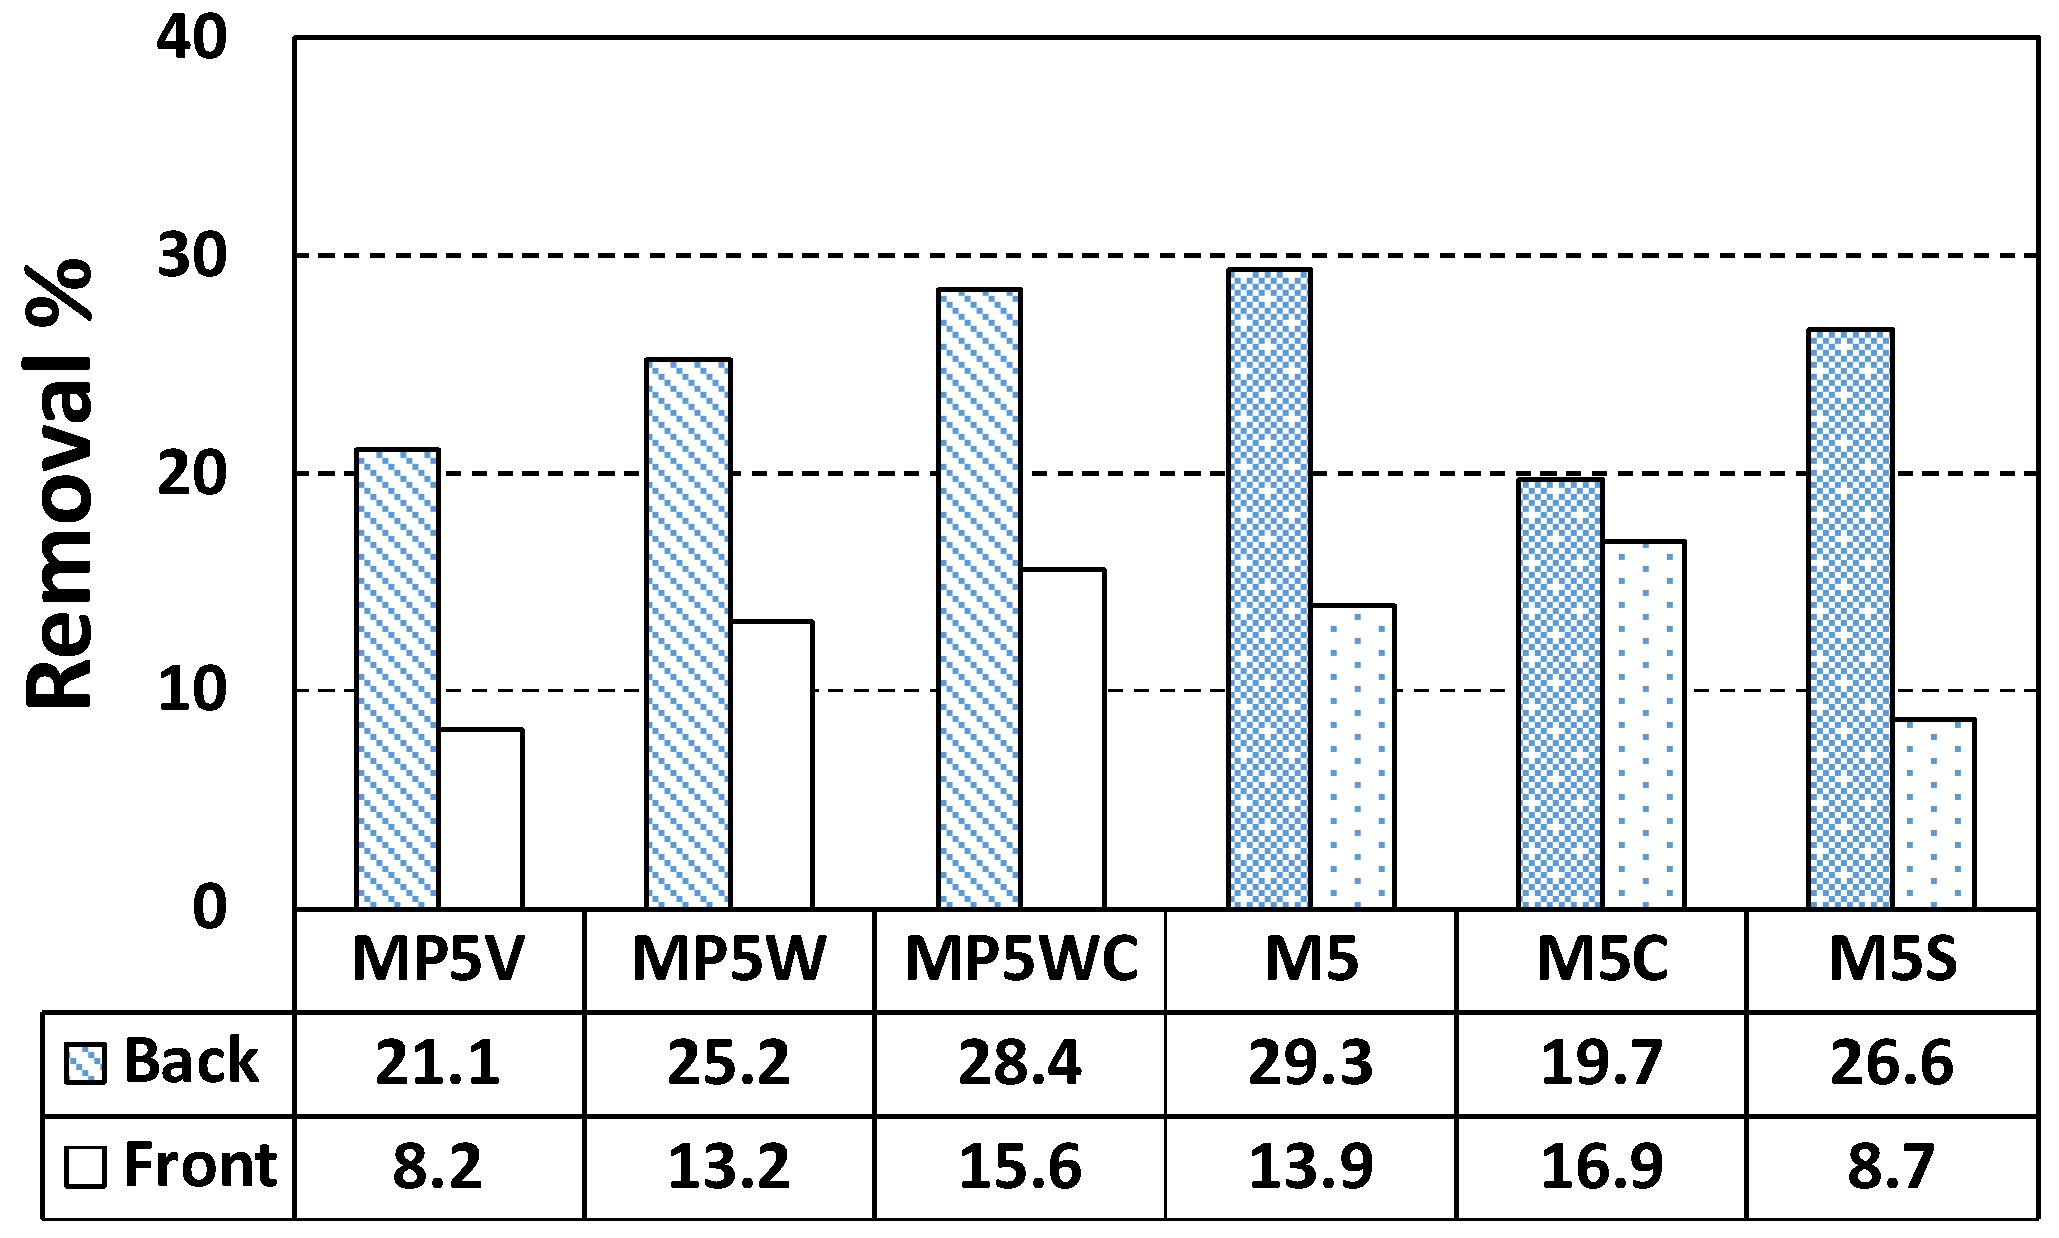
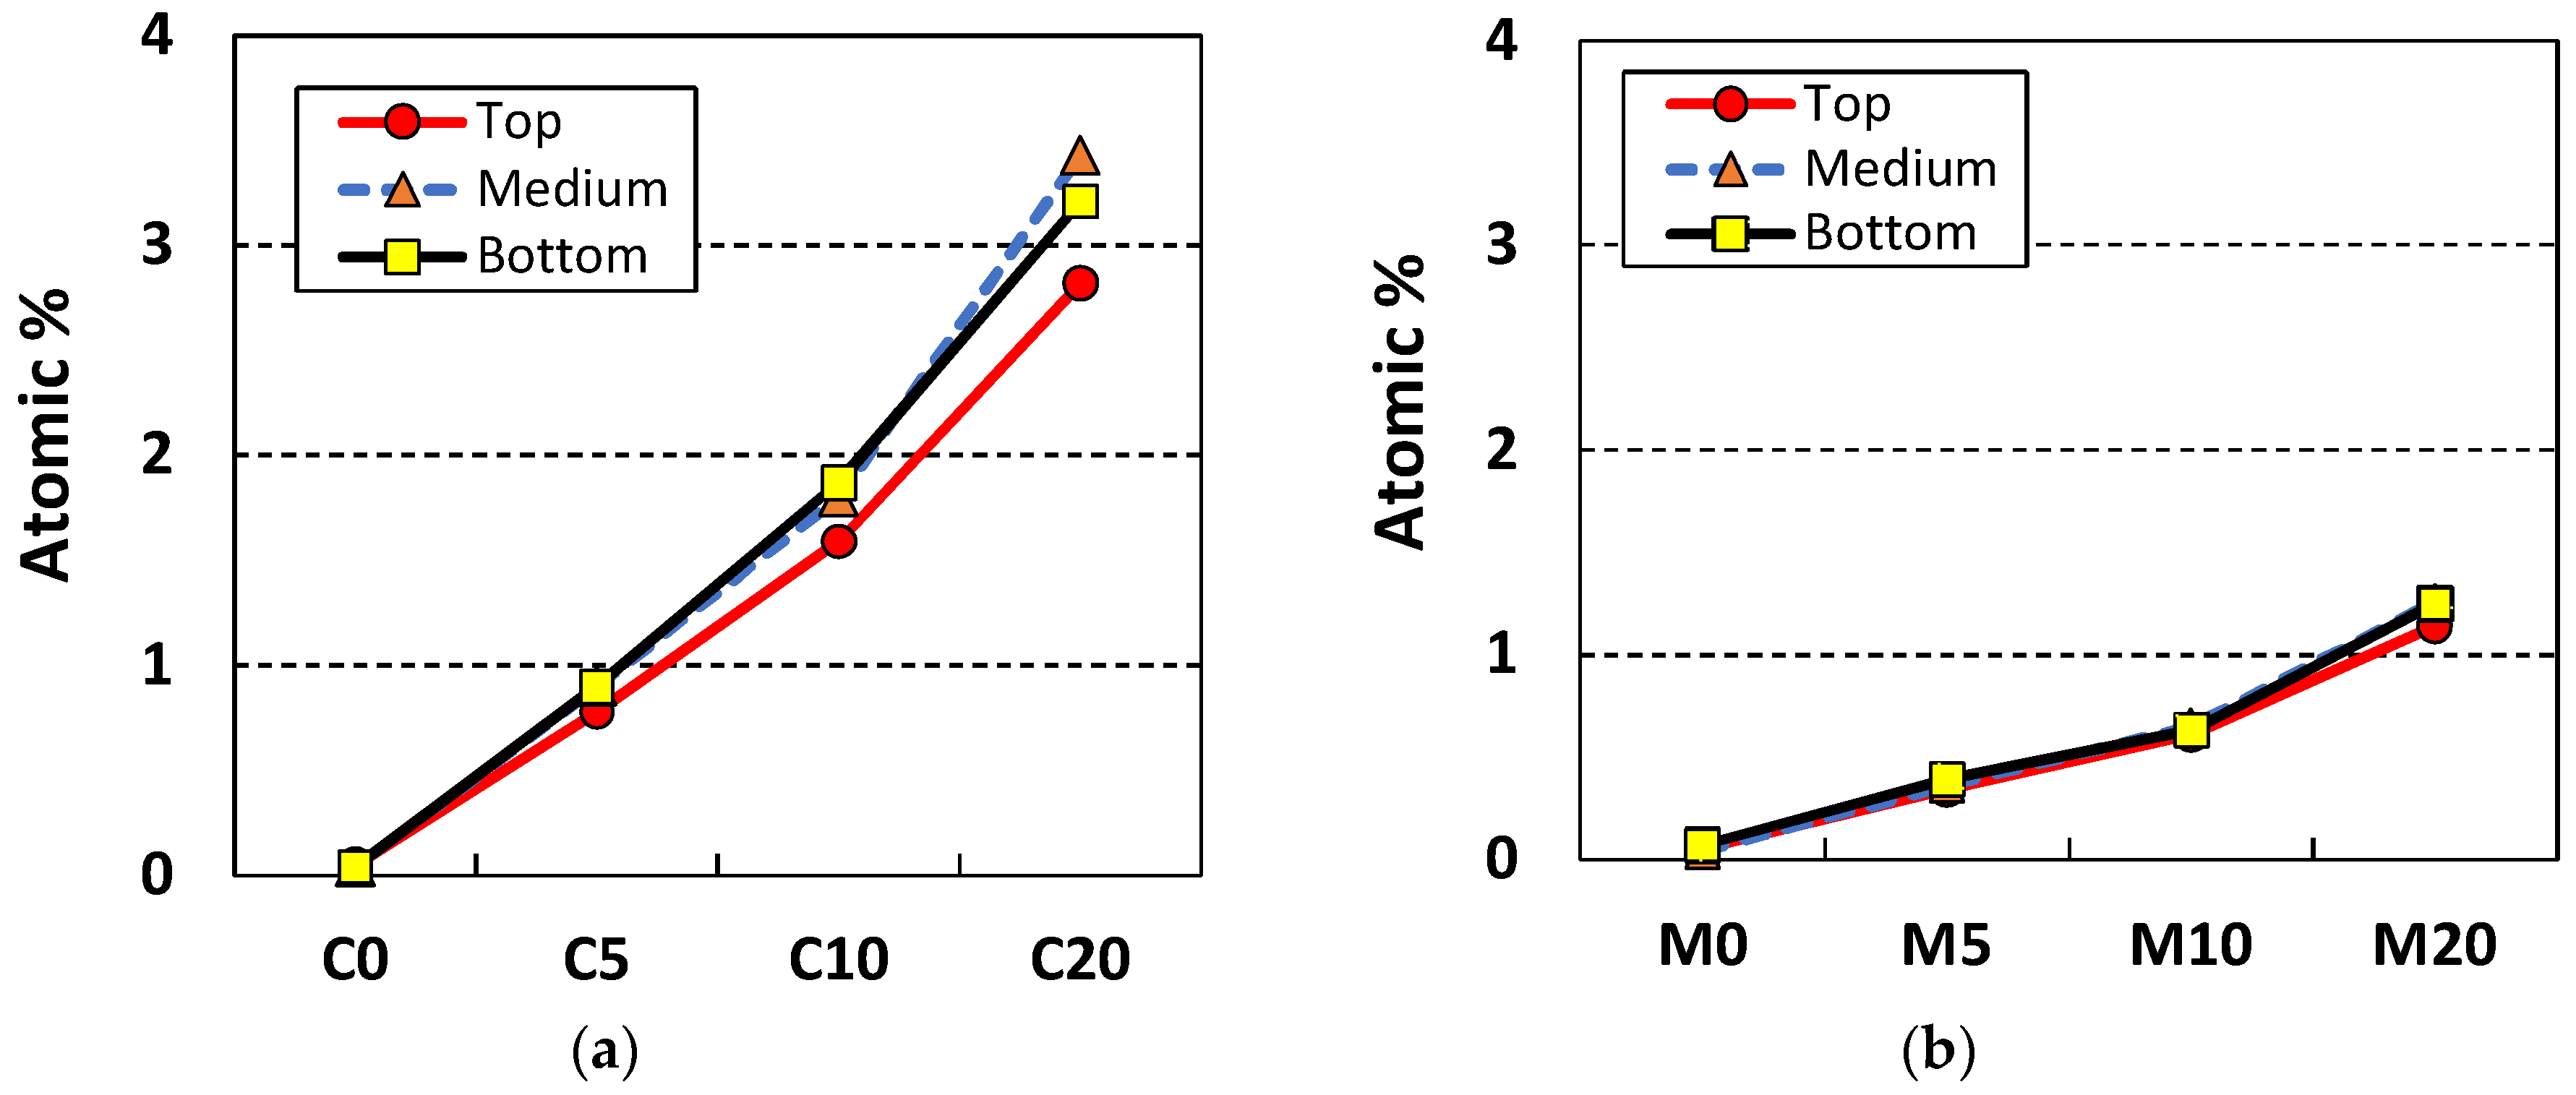
3.2. Nitrogen Oxide (NO) Removal by Cement Mixes Incorporating Titanium Dioxide

Rhee et al. [12] demonstrated that TiO2 (5 wt %) in mortar precipitated when cast; the TiO2 levels on the top and bottom surfaces of casts differed. Efforts to improve TiO2 dispersion in mortar or concrete (via the use of silica fumes or a high-range water reducer, or the addition of viscous agents, blast furnace slag, and/or foaming agents) barely affected TiO2 dispersion. Interestingly, even when TiO2 dispersion in mortar was enhanced, the NO reduction rates varied greatly by surface conditions. The surface void area affected NO adsorption and removal. However, even the creation of continuous low-frequency waves on a smooth surface did not affect the NO removal rate. We varied the TiO2 wt % values in cement paste and mortar, seeking to enhance surface photocatalytic reactions. We explored four different variables: (a) inclusion of sand or not; (b) the wt % of TiO2; (c) ultrasonication or not; and (d) compaction or not. The surface concentrations of TiO2 on cementitious materials should be maximized; this may be affected by the type of cement-based composite used (cement paste or mortar). We used 0, 5, 10, and 20 wt % cement (Table 2); each specimen had dimensions of 50 × 100 × 10 mm. Because NP-400 has a relatively large cluster size and is heavier than P-25, aqueous NP-400 solutions were subjected to ultrasonication at 750 W (20% duty cycle) for 20 min using a horn-type probe. Also, compaction during casting may alter the surface concentration of TiO2 via dynamic perturbation. Thus, specimens were placed on a plate-type vibrator operating at the maximum amplitude of 0.475 g at 20 Hz for 5 min. Eight specimens (16 surfaces) were analyzed in terms of NO removal under the same conditions. It is important to choose the right configuration of the reactor to improve the photocatalytic efficiency, allowing comparable and repeatable measurements. Even if the experimental setup includes other elements such as the light source, NOx analyzer or the gas supplier, the core of the test setup is the photoreactor, which is responsible for an effective contact among photocatalyst, pollutants, water and light [30]. Understanding the above, we adopted ISO 22197-1 specification [31] in order to measure NO photocatalytic removal. All specimens were exposed to 1 ± 0.015 ppmv NO gas at a flow rate of 3.0 L/min, under UV of 10 W/m2 (Sankyo Denki 352-nm lamp, Hiratsuka, Japan) at 25 ± 2 °C and a relative humidity of 50 ± 5% for 2 h after removal of organic matter and impurities. Next, NO flowed in the dark for 30 min and the specimen was then UV-irradiated for 5 h; the NO removal rate was measured using an NO analyzer (CM2041, Casella, London, UK) and a photometer (HD9021, Delta Ohm, Padua, Italy) (Figure 6). The NO removal rate was the ratio of the initial NO concentration, Ci, and that after 5 h of UV irradiation, Ceq (Equation (1) and Table 3). The repeatability of the NO removal test for different specimens with the same wt % of NP-400 from the same batch showed no significant change, e.g., test #1: 43.3%, and test #2: 42.3% of removal rate for C20 specimen (back-face). These were done under the same test conditions as described at the earlier paragraph. Thereby, each test for the front/back-faces of all the specimen was performed once.
NO   removal   rate ( % ) = ( C i C e q C e q ) × 100 = Δ C C e q × 100
NO removal was consistently better at the bottom of specimens (Table 3). M20 (mortar with 20 wt % NP-400) exhibited 69.8% NO removal (Figure 7). Removal by the top face was much lower. The brown line in Figure 7 indicates NO removal over the 5 h of the test. NO2 (another pollutant; green line) was adsorbed and penetrated the materials. The purple line shows the sum of these removals. Irregular staining by penetrating NO2 compromised the interaction of NO and TiO2, causing the NO removal line to slope upward. We will address only NO removal below. Such removal basically increased as the wt % of TiO2 rose (Figure 8). One another aspect is that C10 exhibits better NO removal efficiency rather than C20. This may be caused by a large NP-400 concentration inside the cement paste. The electron-hole recombination may occur when large amounts of NP-400 are present. Thus, the photocatalytic efficiency drops as a consequence of this recombination.
Notably, although removal efficiency was best at the bottom faces of all specimens, the efficiency varied. Table 2 shows that the cement paste specimens (which lack fine aggregates) contained 2.33-fold more TiO2 than the mortar specimens; the cement paste specimens should thus remove NO better than the mortars. However, the reverse was true [e.g., C20 (TiO2-56 g, NO removal rate 43.3%) and M20 (TiO2-24 g, NO removal rate 69.8%)]. We explored this phenomenon. Since 20 wt % of TiO2 is a very large percentage, such a high percentages increases the final cost of the modified materials. Besides, some problems could arise linked to the mechanical performance if a portion of cement has been replaced with TiO2. The electron-hole recombination could have happened frequently when percentages of above 5 wt % of TiO2 were added. Thus, we set the TiO2 to 5 wt % for mortar and explored the NO removal rate in terms of wt % NP-400, wt % P-25, and dynamic compaction and ultrasonication status. M5 served as the control NP-400-containing mortar specimen. MP5 contained P-25, M5C and MP5WC were compacted and non-compacted specimens, and M5S was subjected to ultra-sonication during casting. MP5V and MP5W contained 2.4 and 6 g P-25, respectively. Figure 9 shows the NO removal rates of M5, MP5V, MP5W, M5C, MP5WC, and M5S. The bottom-face NO removal efficiencies were not affected by compaction or sonication. The control M5 specimen outperformed all test samples. However, by volume, MP5V (2.4 g, 21.1% TiO2) exhibited a better performance (in a non-proportional sense) than MP5W (6 g, 28.4% TiO2) by weight; P-25 may be a better photocatalyst than NP-400. Dynamic compaction improved the performances of the top faces of MP5WC and M5C. We further explored TiO2 distribution throughout the specimens (thickness 10 mm). Each specimen was bisected both vertically and horizontally and then cut horizontally once more through the center, and the final specimens were subjected to scanning electron microscopy with energy dispersive X-ray analysis (SEM–EDX), scanning from the top to the bottom (Figure 10). However, the thickness of 10 mm was excessive; we thus examined three 2-mm-long lines from the top, middle, and bottom (Figure 10).
Figure 11 shows that content of Ti (wt %) measured at different depth of cement paste and mortar specimens containing NP-400. As the NP-400 levels rose from 0 to 20 wt %, the NP-400 concentrations increased in all sections. Figure 11a,b show the variations in NP-400 concentrations. Those of the top and bottom cement paste sections varied considerably (Figure 11a). The variations in the M5 series were minor, except for MP5V, which had a 2.5-fold lower level of NP-400 than the others. Figure 12 shows the line scanning results from the top, middle, and bottom of all specimens. The Ti intensity increased as the NP-400 wt % rose. The differences between the top and bottom sections were moderate; the Ti concentration was generally higher at the bottom face. Figure 13 and Figure 14 show the SEM–EDX mapping photographs. Green indicates Ti in 2 × 2 mm squares of the top, middle, and bottom faces, and the results confirm that NP-400 tends to sink when added to cement, fine aggregates, and water, because the true densities of P-25, NP-400, and cement powder were 3.41, 3.70, and 3.15 g/mL (Table 1); thus, NP-400 had the highest true density.
Figure 14 shows the effects of dynamic compaction on the top surfaces, especially that of M5C. The surfaces exhibit many green dots. NO removal efficiency did not differ between the C- and M-series of NP-400 specimens, as discussed above. Although the NP-400 levels in mortars were 2.33-fold less than those in cement paste specimens, NO removal by mortars was much better than removal by cement pastes, probably because mortars have a greater photocatalytic surface area. Figure 15 shows the top and bottom faces of C20, M20, M5C, and MP5WC. M20 exhibited the best NO removal; the bottom surface area was greater than that of the top. In contrast, the bottom surface of C20 was smooth. This explains why the lower TiO2 concentration in M20 was actually better than the 2.33-fold larger level in C20. Dynamic compaction of M5C created many bubbles on the top surface (Figure 15), improving NO removal.
In summary, two major factors affect NO removal efficiency: TiO2 density and surface roughness. The former can be improved using higher incineration temperatures. However, the latter is paradoxical: higher surface roughness absorbs air pollutants more efficiently but also collects dust associated with staining, which blocks photocatalysis.

4. Conclusions

We evaluated how four different variables: (a) inclusion of sand or not; (b) the wt % of TiO2; (c) ultrasonication or not; and (d) compaction or not, affected NO removal by the type of cement-based composite used (cement paste or mortar) in accordance with the ISO 22197-1 standard (a 5-h test). Addition of NP-400 to 0, 5, 10, and 20 wt % did not significantly affect compressive strength. However, the compressive strengths of P-25 specimens were more consistent. The compressive strengths of cement paste have descending tendencies with increasing wt % of NP-400 and P-25. This indicates that the very small pozzolanic activities of TiO2 in the hydration process may lead these strength reductions. While the wt % of TiO2 referred to the sand content of mortar specimens, no significant change of strength was shown. The highest removal efficiency was ca. 70% by mortar with 20 wt % NP-400. Accessible surface roughness aid NP-400 action; such roughness readily adsorbs NO, given the large surface areas of the top and bottom faces. M20 exhibited the best NO removal efficiency and the bottom surface was larger than the top. Such removal basically increased as the wt % of TiO2 rose. However, C10 exhibits better NO removal efficiency than C20. This may be caused by a large NP-400 concentration inside the cement paste. The electron-hole recombination may occur when large amounts of NP-400 are present. Thus, the chance to combine with the calcium in cement pastes might be reduced due to excessive TiO2 concentration on the surface. SEM-EDX confirmed that NP-400 tended to sink when added to cement, fine aggregates, and water. The true densities of P-25, NP-400, and cement powder are 3.41, 3.70, and 3.15 g/mL. The relatively low apparent density of P-25 (compared to NP-400) creates a more bulky distribution inside cementitious materials. In sum, there were two main contributing factors to enhance the NO removal efficiency. One is the density of TiO2 and the other is the surface roughness. The former could be elaborated by applying higher incineration temperature in the kiln. However, the latter has a paradoxical aspect in that the greater surface roughness can absorb the air pollutants efficiently; at the same time, more dust/stain can sit on the surface. This dust-captured environment with high surface roughness can block the continuous chain of photocatalytic action. Also, a large amount of TiO2 addition would be affected by electron-hole recombination as well as some durability issues, especially for the freeze-and-thaw resistance of cement composites. Therefore, the trade off wt % of TiO2 should be selected by considering the strength, NO removal efficiency and durability concerns. Nevertheless, NP-400 could be a viable alternative to the definitive product, P-25.

Author Contributions

Conceptualization, I.R. and J.-H.K.; Methodology; I.R.; Experiments, J.-S.L. and J.B.K.; Data Curation, I.R.; Writing-Original Draft Preparation, I.R.; Writing-Review & Editing, I.R.; Supervision, J.-H.K.

Funding

This research was funded by the Technology Innovation Program of the Ministry of Trade, Industry & Energy (MOTIE, Korea) under grant number 10080342 and by the National Research Funds, Korean Ministry of Education under grant number NRF-2016R1D1A3B04930497.

Acknowledgments

The opinions expressed in this article are those of the authors and do not necessarily reflect those of any funding agency.

Conflicts of Interest

The authors declare no conflict of interest.

References

  1. Aoa, C.H.; Lee, S.C.; Zoub, S.C.; Makc, C.L. Inhibition effect of SO2 on NO and VOCs during the photodegradation of synchronous indoor air pollutants at parts per billion (ppb) level by TiO2. Appl. Catal. B Environ. 2004, 49, 187–193. [Google Scholar] [CrossRef]
  2. Allen, N.S.; Edge, M.; Verran, J.; Stratton, J.; Maltby, J.; Bygott, C. Photocatalytic titania based surfaces: Environmental benefits. Polym. Degrad. Stab. 2008, 93, 1632–1646. [Google Scholar] [CrossRef]
  3. Chen, J.; Poon, C.-S. Photocatalytic construction and building materials: From fundamentals to applications. Build. Environ. 2009, 44, 1899–1906. [Google Scholar] [CrossRef]
  4. Chen, M.; Chu, J.-W. NO photocatalytic degradation on active concrete road surface—From experiment to real-scale application. J. Clean. Prod. 2011, 19, 1266–1272. [Google Scholar] [CrossRef]
  5. De Marco, T.; Fava, G.; Guerrini, G.L.; Manganelli, G.; Moriconi, G.; Riderelli, L. Use of photocatalytic products for sustainable construction development. In Proceedings of the Third International Conference on Sustainable Construction Materials and Technologies, Kyoto, Japan, 18–21 August 2013. [Google Scholar]
  6. Boonen, E.; Beeldens, A. Recent Photocatalytic Applications for Air Purification in Belgium. Coatings 2014, 4, 553–573. [Google Scholar] [CrossRef]
  7. Ma, B.; Li, H.; Mei, J.; Li, X.; Chen, F. Effects of Nano-TiO2 on the Toughness and Durability of Cement-Based Material. Adv. Mater. Sci. Eng. 2015, 2015, 583106. [Google Scholar] [CrossRef]
  8. King, D. Surface and Microstructural Properties of Photocatalytic Cements for Pavement Applications. Master’s Thesis, University of Illinois at Urbana-Champaign, Champaign, IL, USA, 2016. [Google Scholar]
  9. Staub de Melo, J.V.; Triches, G. Study of the influence of nano-TiO2 on the properties of Portland cement concrete for application on road surfaces. Road Mater. Pavement Des. 2017, 19, 1011–1026. [Google Scholar] [CrossRef]
  10. Akhnoukh, A.K. Implementation of nanotechnology in improving the environmental compliance of construction projects in the United States. Part. Sci. Technol. 2018, 36, 357–361. [Google Scholar] [CrossRef]
  11. Ola, O.; Mercedes Maroro-Valer, M. Review of material design and reactor engineering on TiO2 photocatalysis for CO2 reduction. J. Photochem. Photobiol. C 2015, 24, 16–42. [Google Scholar] [CrossRef]
  12. Chen, J.; Kou, S.; Poon, C. Hydration and properties of nano-TiO2 blended cement composites. Cem. Concr. Compos. 2012, 34, 642–649. [Google Scholar] [CrossRef]
  13. Bouras, P.; Stathatos, E.; Lianos, P. Pure versus metal-ion-doped nanocrystalline titania for photocatalysis. Appl. Catal. B 2015, 73, 51–59. [Google Scholar] [CrossRef]
  14. Lee, B.Y.; Kurtis, K.E. Influence of TiO2 nanoparticles on early C3S hydration. J. Am. Ceram. Soc. 2010, 93, 3399–3405. [Google Scholar] [CrossRef]
  15. Nazari, A.; Riahi, S. The effects of TiO2 nanoparticles on properties of binary blended concrete. J. Compos. Mater. 2010, 45, 1181–1188. [Google Scholar] [CrossRef]
  16. Teixeira, K.P.; Rocha, I.P.; Carneiro, L.D.S.; Flores, J.; Dauer, E.A.; Ghahremaninezhad, A. The effect of curing temperature on the properties of cement pastes modified with TiO2 nanoparticles. Materials 2016, 9, 952. [Google Scholar] [CrossRef] [PubMed]
  17. Meng, T.; Yu, Y.; Qian, X.; Zhan, S.; Qian, K. Effect of nano-TiO2 on the mechanical properties of cement mortar. Constr. Build. Mater. 2012, 29, 241–245. [Google Scholar] [CrossRef]
  18. Hasebe, M.; Edahiro, H. Experimental studies on basic properties of concrete using TIO2 as admixture. In Proceedings of the Thirteenth East Asia-Pacific Conference on Structural Engineering and Construction (EASEC-13), Sapporo, Japan, 11–13 September 2013; pp. 1–8. [Google Scholar]
  19. Martins, T.; Torgal, F.P.; Miraldo, S.; Aguiar, J.B.; Jesus, C. An experimental investigation on nano-TiO2 and fly ash based high performance concrete. Ind. Concr. J. 2016, 1, 23–31. [Google Scholar]
  20. Zhao, D.; Wang, F.; Liu, P.; Yang, L.; Hu, S.; Zhang, W. Preparation, physicochemical properties, and long-term performance of photocatalytic ceramsite sand in cementitious materials. Appl. Sci. 2017, 7, 828. [Google Scholar] [CrossRef]
  21. Lucas, S.S.; Ferreira, V.M.; Barroso de Aguiar, J.L. Incorporation of titanium dioxide nanoparticles in mortars—Influence of microstructure in the hardened state properties and photocatalytic activity. Cem. Concr. Res. 2013, 43, 112–120. [Google Scholar] [CrossRef] [Green Version]
  22. Folli, A. TiO2 Photocatalysis in Portland Cement System: Fundamentals of Self Cleaning Effect and Air Pollution Mitigation. Ph.D. Thesis, University of Aberdden, Aberdden, UK, 2010; pp. 91–149. [Google Scholar]
  23. Macphee, D.E.; Folli, A. Photocatalytic concretes—The interface between photocatalysis and cement chemistry. Cem. Concr. Res. 2016, 85, 48–54. [Google Scholar] [CrossRef]
  24. Qin, Z.B.; Zhang, W.T.; Qian, G.P.; Wu, X.L.; Li, Y. The effects of different ways of adding nano-TiO2 to concrete on the degradation performance of NO2. Mater. Res. Innov. 2015, 19, S10-148–S10-154. [Google Scholar] [CrossRef]
  25. Zouzelka, R.; Rathousky, J. Photocatalytic abatement of NOx pollutants in the air using commercial functional coating with porous morphology. Appl. Catal. B Environ. 2017, 217, 466–476. [Google Scholar] [CrossRef]
  26. Rhee, I.; Kim, J.H.; Kim, J.-H.; Roh, Y.S. Sensitivity of NO removal on recycled TiO2 in cement mortar. J. Korean Recycl. Constr. Res. 2016, 4, 388–395. (In Korean) [Google Scholar]
  27. Shon, H.K.; Vigneswarn, S.; Kim, I.S.; Cho, J.; Kim, G.J.; Kim, J.B.; Kim, J.H. Preparation of titanium dioxide (TiO2) from sludge produced by titanium tetrachloride (TiCl2) flocculation of wastewater. Environ. Sci. Technol. 2007, 41, 1372–1377. [Google Scholar] [CrossRef] [PubMed] [Green Version]
  28. Okour, Y.; Shon, H.K.; El Saliby, I.J.; Naidu, R.; Kim, J.B.; Kim, J.H. Preparation and characterisation of titanium dioxide (TiO2) and thiourea-doped titanate nanotubes prepared from wastewater flocculated sludge. Bioresour. Technol. 2010, 101, 1453–1458. [Google Scholar] [CrossRef] [PubMed]
  29. Park, S.M.; Chekli, L.; Kim, J.-B.; Shahid, M.; Shon, H.K.; Kim, P.S.; Lee, W.-S.; Lee, W.E.; Kim, J.-H. NO removal of mortar mixed with Titania produced from Ti-salt flocculated sludge. J. Ind. Eng. Chem. 2014, 20, 3851–3856. [Google Scholar] [CrossRef]
  30. Angelo, J.; Andrade, L.; Madeira, L.; Mendes, A. An overview of photocatalysis phenomena applied to NOx abatement. J. Environ. Manag. 2013, 129, 522–539. [Google Scholar] [CrossRef] [PubMed]
  31. International Organization for Standardization. Fine Ceramics (Advanced Ceramics, Advanced Technical Ceramics)—Test Method for Air-Purification Performance of Semiconducting Photocatalytic Materials—Part 1: Removal of Nitric Oxide; ISO 22197-1:2016; International Organization for Standardization: Geneva, Switzerland, 2016. [Google Scholar]
Figure 1. TiO2: transmission electron microscope (TEM) images of (a) NP-400, Bentech Frontier, Korea; and (b) P-25, Evonik, Germany.
Materials 11 00877 g001
Figure 2. Pore distribution and particle size: (a) Barrett–Joyner–Halenda (BJH) plots to characterize the frequency distribution of pores; and (b) particle size distribution (nm) from TEM images.
Materials 11 00877 g002
Figure 3. X-ray diffraction data for NP-400 and P-25 (Anatase: 2θ = 25.37°, Rutile: 27.41°).
Materials 11 00877 g003
Figure 4. Specimen preparation: (a) sonicated aqueous TiO2 with particle size and distribution (dynamic light scattering (DLS)) and scanning electron microscopy (SEM) data; and (b) the specimen in the guide table in NO test machine.
Materials 11 00877 g004
Figure 5. Compressive strengths of cementitious materials with different wt % values of P-25 and NP-400. (a) Cement paste. (b) Mortar. (C: cement paste, MP: mortar with P-25, M: mortar with NP-400).
Materials 11 00877 g005
Figure 6. Apparatus meeting ISO 22197-1 specifications used to measure NO photocatalytic removal.
Materials 11 00877 g006
Figure 7. NO removal (ca. 70%) by M20.
Materials 11 00877 g007
Figure 8. NO removal by cement paste and mortar: (a) cement paste; (b) mortar with NP-400.
Materials 11 00877 g008aMaterials 11 00877 g008b
Figure 9. NO removal % by mortar (5 wt % TiO2) with and without ultra-sonication and dynamic compaction after casting (C: with compaction, S: with ultrasonication).
Materials 11 00877 g009
Figure 10. Specimen preparation for low vacuum (LV) SEM analyses: 25 × 10 × 10 mm.
Materials 11 00877 g010
Figure 11. Atomic wt % values of slices of the 5 cm × 10 cm × 1 cm specimens: (a) cement paste specimens without compaction; (b) mortar specimens without compaction; (c) mortar specimens with compaction and sonication.
Materials 11 00877 g011aMaterials 11 00877 g011b
Figure 12. Ti counts on the top, middle, and bottom surfaces of sliced sections 10 mm in thickness (the line scans are at 2-mm intervals): (a) C-series samples, (b) M-series samples.
Materials 11 00877 g012
Figure 13. Ti distribution as revealed by LV-SEM with energy dispersive X-ray analysis (EDX) in cement paste and mortar specimens (green: Ti, measured in 2 mm-squares of the top, middle, and bottom faces): (a) C-series samples, (b) M-series samples.
Materials 11 00877 g013aMaterials 11 00877 g013b
Figure 14. Ti distribution as revealed by LV-SEM/EDX for 5 wt % TiO2 mortar specimens subjected to dynamic compaction (Green: Ti, measured in 2 mm-squares of the top, middle, and bottom surfaces).
Materials 11 00877 g014
Figure 15. Front and back surfaces of selected specimens (25-mm squares).
Materials 11 00877 g015
Table 1. TiO2 preparations mixed with cementitious materials.
Ingredients Crystal PhaseAverage Particle Size (nm)Specific Surface Area (m2/g)Apparent Density (g/mL)True Density (g/mL)
NP-400Anatase26.6 (s = 8.52%) *66.50.453.70
P-25Rutile/Anatase25.2 (s = 9.45%) *54.90.183.41
CementPortland Type I>44 μm0.33-3.15
* s: standard deviation.
Table 2. Test specimens, wt % values with respect to cement content.
Sample TypeLabelCement (g)Sand (g)Water (mL)TiO2 (g)
Mortar (NP-400)M0120240600
M52346
M1022812
M2021624
Mortar (P-25)MP02400
MP52346
MP1022812
MP1522218
Cement paste (NP-400)C0280-1400
C526614
C1025228
C2022456
Cement paste (P-25)CP02800
CP526614
CP1025228
CP1523856
Table 3. NO removal rates by cement paste (C) and mortar (M) (unit: μmol/(50 cm2∙5 h)).
Specimen LabelFaceNO Removal Rate (%)NO Concentration Change, ΔC (μmol)NO Initial Concentration, Ci (μmol)
C0Back1.30.5038.38
Front3.21.2539.13
C5Back27.110.4838.65
Front8.53.2538.21
C10Back43.316.4738.04
Front2.91.1138.17
C20Back54.821.1838.65
Front9.03.4938.81
M0Back2.20.8739.46
Front2.30.8737.87
M5Back29.311.6039.59
Front13.95.5539.94
M10Back29.511.5038.97
Front16.36.3639.01
M20Back69.826.5238.00
Front10.94.2238.71

