Abstract
Modern protection relays require accurate and fast phasor estimation under harsh transient conditions, including a decaying DC component, harmonics, interharmonics, noise, and frequency instability. The original CCHDF (Cleaned Characteristic Harmonic Digital Filter) produced a harmonic cleaned signal using the Biunivocal Frequency Relationship of Phasors (BFRP) technique, but relied on DFT, Hanning windowing, and peak detection to identify interharmonic components. This paper replaces that spectral estimation block with the Modified Covariance Method (MCM) estimator, a high resolution autoregressive (AR) spectral estimator capable of superior frequency, magnitude, and phase estimation of non-harmonic components even with a short data window. The result is an improved filter named MCCCHDF (Modified Covariance CCHDF), preserving the original algorithmic pipeline, but achieving higher accuracy and faster convergence in the presence of closely spaced harmonics/interharmonics and noisy decaying DC conditions.
1. Introduction
Digital numerical relays form a core element of modern protection and monitoring systems in electric power networks. Their operation relies on internal computational routines that process phasors derived from appropriately conditioned and digitized power system signals, following antialiasing filtering and analog to digital conversion. By applying digital signal processing techniques, these relays extract the phasors associated with actual system frequencies, most commonly the fundamental components, through analysis of the signal’s harmonic content.
Digital signal processing presents the way in which the numerical relays function copes with the settings of an electrical network. This is a key element of how we keep our electrical systems safe today. Instead of conventional electromechanical and static relays, these smart electronic devices today use microprocessor-based systems that can undertake complicated computational analysis [1]. We now keep things safe in a different way. The main job of these devices is to receive phasor data from digital waveforms of voltage and current. Then, algorithms use this information to figure out how to keep something safe.
When one converts from analogue to digital protection systems, there are new issues and opportunities. Digital relays can achieve more, are more accurate, and can achieve more than one outcome at a time. But they also have to deal with complicated signal conditions that can make them less effective. The most crucial component of how protective relays work is figuring out phasors, which are mathematical representations that show the magnitude and phase of sinusoidal quantities [2].
During fault conditions, the electrical signals deviate significantly from ideal sinusoidal characteristics. Several parts change the waveform at the same time, making it hard to estimate. One of these parts is the exponentially decaying DC component. When power systems fail, steady-state conditions are suddenly interrupted, which creates transient DC components that become smaller and smaller over time. The time constant, or the rate of this decay, depends on the system’s X/R ratio (reactance-to-resistance ratio). Circuits with larger inductances have slower decay rates. This trait is extremely worrying because traditional Discrete Fourier Transform (DFT) algorithms assume periodic signals and do not work well when non-periodic parts are present [3].
Harmonic distortion means that harmonic frequencies are added to the power system by nonlinear loads, power electronic converters (like inverters), and circuits that show magnetic saturation. These harmonics integer multiples of the fundamental frequency can cause a lot of problems with phase estimation if they are not filtered correctly. The growing use of renewable energy systems, which depend a lot on inverter-based interfaces, has made these kinds of distortions even more common in modern electrical networks [4].
Interharmonic frequencies are not integer number multiples of the fundamental frequency, unlike harmonics. These parts come from a variety of reasons, such as arc furnaces, rotating frequency converters, and wind turbines, as well as asynchronous switching operations in high-power electronic devices. When one does frequency-domain analysis, these interharmonics cause something called “spectral leakage”, which makes it harder to accurately estimate both the fundamental and harmonic components [5]. Occurrences like Electromagnetic Interference (EMI), sensor imprecision, and quantization errors that happen during the Analog-to-Digital (A/D) conversion process make the signal processing chain even more confusing and unclear [6].
Protection systems have to work quickly because of severe time constraints. To keep the power system stable and avoid damaging equipment, they have to “detect, classify, and isolate faults” within very strict time limits, which are usually measured in “cycles” or “milliseconds.” Due to this time pressure, we need to use “algorithms that converge quickly” without losing accuracy. This makes it hard to find the right “balance between speed and precision.”
When there are high-magnitude fault currents, Current Transformers (CTs) are likely to reach a state of saturation. This saturation causes severely distorted secondary currents, which have both harmonic content and extra exponential components. This saturation effect causes complex, nonlinear distortions that make it very hard for traditional filtering methods to work [6].
If a digital filter lacks the essential characteristics required for the correct operation, protection, and monitoring, devices will be unable to comply with applicable performance standards. Furthermore, to achieve a reliable and timely operation, the filtering algorithm must incorporate properties that closely approximate those of an ideal digital filter. To ensure the operation is correct, the digital filter is required to deliver parameter values for protection and fault location functions with complete accuracy and reliability. The calculations should be carried out as quickly as possible so that the relay can respond as quickly as possible. The method should be independent of the fault inception instant, implying that no additional unknown parameters are introduced in the governing equations. Moreover, it must operate correctly under pre-fault, fault, and post-fault conditions.
Researchers have put forward a number of ideas over the years to make phasor estimation more reliable in unsatisfactory circumstances. Some of them are focused on finding and sorting faults [2]. There are many different ways to carry out methods in this field, such as Matrix-Based Least-Squares. Some methods use least-squares estimation (LSE) to find unknown phasor parameters by treating the signal model as a system of linear equations [7,8]. These methods are mathematically sound, but they often have problems with numerical stability because of irregular matrices, especially when the decaying DC time constant is unknown or when noise is present. Mimic filters work like analog circuits that get rid of the decaying DC component before using DFT-based phasor extraction [9]. Their performance is contingent upon prior knowledge of system parameters (e.g., time constant τ), which is seldom accessible during unpredictable fault conditions, despite being effective in idealized scenarios. There have been a number of improvements to the standard DFT, such as offset compensation using extra samples or recursive formulations [10,11,12]. These procedures help in scenarios with DC-induced errors, but they also make things more sensitive to noise and need very precise timing for faults to start, which makes them less useful in real-world relaying situations [13]. Methods based on Wavelet Transform (The Discrete Wavelet Transform—DWT), especially through multiresolution analysis (MRA), gives time–frequency localization that is helpful for transient analysis [14,15,16]. Wavelet-based estimators, on the other hand, usually need longer data windows and more processing power, which makes them less useful for protection schemes that work quickly and only last a few post-fault cycles.
Researchers have looked into using ANNs for fault detection and classification [17,18], but they haven’t been used much for precise phasor estimation yet. They can’t be used in adaptive protection systems because they need a lot of training data and can’t work with different grid topologies and fault types. Researchers have also looked into combining methods, like wavelet-ANN or LSE-DFT hybrids, to take advantage of their different strengths [19,20,21,22,23]. But many of them are not strong enough to handle interharmonics or do not give both magnitude and phase estimates correctly when there are noisy transients.
Different ways to process signals like new techniques that use mathematical morphology [24,25] or iterative computational schemes [26] look promising, but they are still experimental and have not been frequently tested in real-time relay settings. A significant deficiency in the majority of current literature is the oversight of interharmonic and subharmonic components, non-integer multiples of the fundamental frequency generated by power electronics, variable-speed drives, and other nonlinear loads [27]. Most phasor estimation algorithms assume that signals only have harmonics and DC transients, even though standards like IEC 61000-4-7 recognize that they are becoming more common. Due to this, spectral leakage from interharmonics makes DFT-based estimates very inaccurate, which can cause protection to fail [28].
Recent attempts to identify interharmonics utilizing adaptive windowing [29], iterative DFT [30], or adaptive notch filters [31] frequently necessitate 10 or more cycles of data, surpassing the conventional fault-clearing window in transmission systems. This makes them useless for protection in real time. In response, Vazquez et al. [32] created a filter that uses a sliding technique to get rid of decaying DC components while keeping harmonic information. But this is still open to interharmonic distortion. The CCharmDF method builds on this foundation by explicitly modeling and extracting interharmonics, which makes it possible to recover clean harmonic phasors even in very transient situations.
The original CCHDF digital filter introduced in the literature provided a robust multi-stage procedure for eliminating exponential decay and separating harmonic and interharmonic phenomena through auxiliary wave construction and biunivocal frequency relationships (BFRP). However, the interharmonic estimation stage reliant on the DFT, combined with windowing and zero-padding, is used to detect interharmonic frequencies. While functional, such an approach suffers from resolution limitations, sensitivity to noise, and difficulty in tracking components that lie very close to harmonic bins or have low amplitude.
To address these limitations, this paper introduces an enhanced version of the technique, referred to as the MC-CCHDF (Modified Covariance CCHDF). This improved approach preserves all the mathematical foundations of the CCH method sliding window filtering, auxiliary wave generation, and BFRP relations but replaces the DFT-based interharmonic evaluation with a high-resolution autoregressive spectral estimation, the Modified Covariance Method (MCM). It offers strong advantages: excellent resolution of closely spaced sinusoids, reliable frequency estimation with short data windows, and accurate phasor reconstruction for interharmonic components.
With these advantages, MC-CCHDF provides a higher precision, faster converging method suitable for real-time relay applications, even under transient conditions described in the original paper.
2. Methodology Flowchart
The proposed MC-CCHDF algorithm uses a multi-stage process for signal decomposition and estimation. As shown in the flowchart in Figure 1, the process begins with the raw digitized input signal. First, this signal is processed using a Sliding Technique Filter (STF) to create the Wave Dirtied Characteristic Harmonic (DCH) signal, which removes the decaying exponential component. Then, a Removed All Harmonics (RAH) signal is created to isolate the interharmonic components. After that, the Modified Covariance Method (MCM) is applied to the RAH signal to estimate the frequency and phasor values with high precision. Finally, the Cleaned Characteristic Harmonic (CCH) signal is obtained, allowing for accurate estimation of the fundamental phasor.
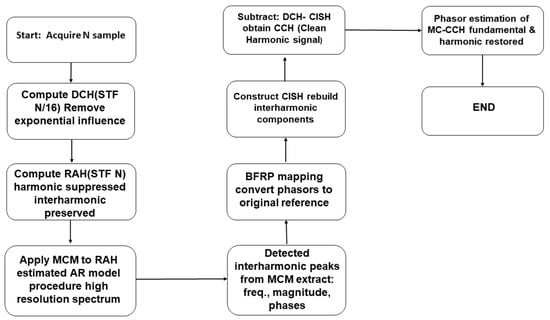
Figure 1.
MC-CCHDF Wave Methodology Flowchart.
3. Proposed Algorithm
A fault signal was taken into account that had a continuous offset, decreasing exponential components, the network signal’s fundamental frequency , and both harmonic and interharmonic components, as well as noise. The digitized signal at a sampling frequency of , which adheres to the Nyquist–Shannon sampling theorem [1], resulting in the following expression:
where denotes the constant (continuous) offset, and represent the magnitude and time constant of decaying exponential component, respectively, the term corresponds to additive noise, and describes the interharmonic content associated with the fundamental frequency, modeled as a summation of sinusoidal components.
In this formulation, , are the amplitudes and , are corresponding phase angles of harmonic components (with h = 1 representing the fundamental) and the periodic interharmonics, respectively.
The DFT is a highly effective tool for estimating the amplitudes and phases of pure sinusoidal signals whose periods are integer multiples of the observation window. Under such conditions, the spectral energy of each sinusoidal component is concentrated at a single frequency bin, appearing as an impulse (Dirac delta) at its corresponding frequency. The presence of continuous offset does not adversely affect the DFT, as it manifests solely as a zero-frequency (DC) component that remains isolated from the other spectral components. However, when analyzing a signal of the form given in (1), the accuracy of the DFT-based phasor estimation for the fundamental component or its harmonics deteriorates due to the presence of non-synchronous signal components relative to the analysis window. Specifically, exponentially decaying terms introduce broadband spectral content that interferes with the estimation of other frequency components. In practical fault scenarios, the unknown magnitude and exact mathematical form of these exponential transients further degrade the reliability of the resulting phasor estimates. In addition, the presence of interharmonic components leads to spectral leakage, causing energy to spread across multiple frequency components of interest [31]. As illustrated in Figure 2a, the combined effect of decaying exponential terms and interharmonics results in a significant distortion of the spectral components that are otherwise synchronous with the analysis window, affecting not only their magnitudes but also their phase angles, and Figure 2b, the frequency spectrum, respectively.
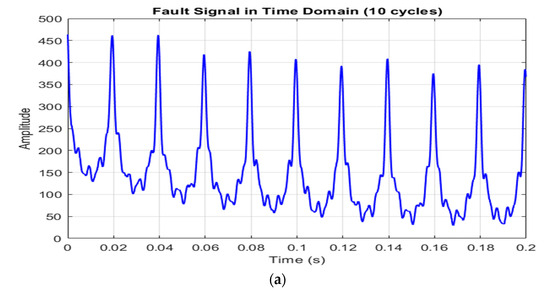
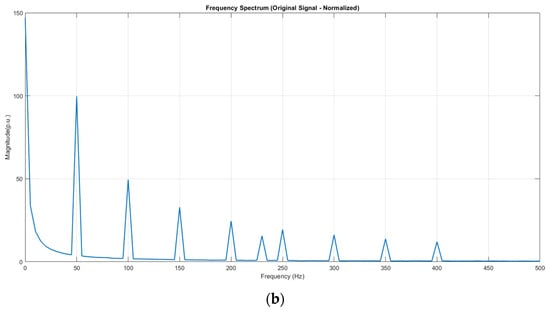
Figure 2.
(a) Frequency magnitudes of signal with continuous offset, decreasing exponential, and harmonic and interharmonic components and (b) Frequency Spectrum.
The proposed Modified Covariance Cleaned Characteristic Harmonic digital filter (MC-CCHDF) is funded on the generation of an auxiliary signal that is deliberately free from components capable of distorting the fundamental and harmonic quantities used for phasor estimation. This auxiliary signal is constructed such that constant (DC) offset, exponentially decaying transient components and interharmonic terms are effectively removed from the original waveform. At the same time, the essential periodic harmonic information of the original signal is preserved, enabling accurate and stable estimation of harmonic phasors in subsequent stages. Beyond simply refining the estimation of fundamental and harmonic phasors, the proposed framework introduces the capability to accurately resolve interharmonic components. Crucially, this is accomplished without degrading the fidelity of the standard harmonic content, marking a significant methodological improvement over traditional techniques.
The original Cleaned Characteristic Harmonic Digital Filter (CCHDF), introduced in earlier work, focused on constructing an auxiliary signal that retained harmonic information while being immune to exponential transients. Although that approach is recognized for its robustness and relatively low computational burden, its performance degrades when interharmonic components are present in the signal. Under such a condition, the efficacy of the filtering process degrades, resulting in errors within the phasor estimation. To mitigate this, this study introduces the concept of the CCH wave. This variable is defined as a pure harmonic representation of the original, effectively purged of all non-harmonic elements, including interharmonics signal derived from the original wave, devoid of any non-harmonic components.
The suggested MC-CCHDF (Modified Covariance Clean Characteristic Harmonic Digital Filter) method enhances the original CCHDF approach by integrating the Modified Covariance Method for superior interharmonic detection and characterization. The fundamental architecture remains based on obtaining an auxiliary signal that is free of components that can affect the fundamental and/or harmonic components of which the phasor estimation will be carried out.
3.1. Biunivocal Frequency Relationship of Phasors (BFRP)
The STF (Sliding Technique Filter) method operates by processing pairs of data points from a sinusoidal signal that are separated by a fixed interval, referred to as the “slip” (s). By subtracting these sample pairs, the method reveals a deterministic link between the phasors of the input and the output signals, known as the BFRP. Crucially, this operation alters the amplitude and phase of the signal but preserves the original frequency, ensuring a direct spectral correspondence. As depicted in Figure 3a, this process transforms an acquired sinusoidal signal (with frequency and window length N corresponding to period ) into derived signal as in Figure 3b, respectively.
Figure 3.
(a) STF Process transforms original signal , and (b) derived signal .
The first sample of the signal corresponds to the first instant, and the sample does the same for the instant, where the signal starts to be formed, where . The u[n] signal gets these values analytically:
In the phasor representation shown in Figure 4, the phasor diagram illustrates the geometric phasor relationship for the BFRP between the original signal and the derived signals. The phasor (shown in green) represents the magnitude and the phase of the original signal at time instant corresponding to sample . The phasor (shown in blue) represents the same signal at time instant , corresponding to sample , where S is the slip parameter. The phasor (shown in red) represents the derived signal at instant , obtained as the vector difference between and . The angular displacement denotes the phase shift between samples separated by slip S, while θ represents the half-angle relationship defined by the BFRP geometry. The angle and are the phases of the derived and original signal phasors, respectively, referenced to the same time origin, demonstrating how STF preserves the frequency while transforming the amplitude and phase according to the Equations (12) and (13).
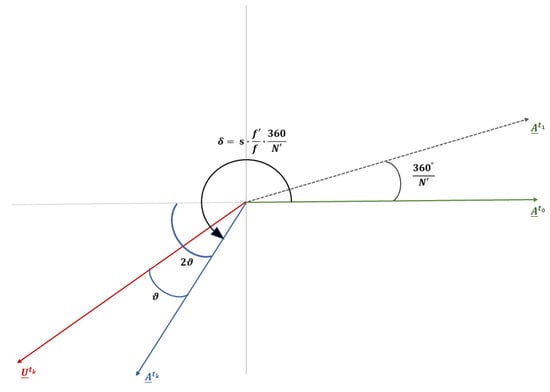
Figure 4.
x[n] and u[n] signal phasor representation.
Given that a full period of the signal is represented by samples, the phase increment (or equivalent angle) separating two adjacent phasors, and is calculated as:
Accordingly, the angular displacement between the samples and , which corresponds to the phase shift between the phasors and , is given by:
For a given sampling frequency , the time length of the data window can be expressed as the number of samples multiplied by the sampling period :
Similarly, with a duration of the x[n] signal, we have:
Using the expressions given in Equations (7) and (8), the following relation can be derived:
Consequently, the expression given in Equation (6) can be reformulated as:
From the geometric relationships among the phasors illustrated in Figure 4, the phase displacement between the phasors and can be determined as:
Here, the angle is constrained to interval (0°, 360°) (using a wrap-to-360 operation) in order to generalize scenarios where is greater than 180° or is less than 180°, to ensure that the numerator in the subtraction remains positive.
Under these conditions, a BFRP in the phase of the terms of phase is established between the signals and :
with .
After determining the angular position of the phasors shown in Figure 4, it becomes possible to relate the magnitude of the phasors of the , , and . The vector subtraction expressed in (4) yields a triangular geometric configuration formed by these magnitudes, employing the law of sines along with straightforward trigonometric identities. A BFRP with respect to the magnitude can be established between the phasors of corresponding signals:
K can be represented as a function of (11):
Accordingly, when the STF is applied to a sinusoidal signal, the amplitude and phase of the resulting phasor U can be uniquely determined through the BFRP at any time instant, provided that the phasor A of the original signal is known, and vice versa.
3.2. Obtaining the MC-CCH Wave Integration
The acquisition of the MC-CCH signal is delineated into two essential components, with the key enhancement being the integration of MCM for interharmonic detection. Initially, beginning with the original signal as specified in (1), the goal is to derive a signal devoid of the exponential component. This signal is referred to as the Wave Dirtied Characteristic Harmonic Wave (DCH) because it comprises characteristic signals formed by harmonic terms, although it is “dirty” due to the presence of interharmonic components. The STF approach will be employed to obtain this signal by the successive subtraction of sample pairs that are separated by a distance or slip of .
By applying a first-order McLaurin polynomial approximation to the exponential component in the original signal expression (1) at an initial generic time , the following expression is obtained:
Moreover, at a later instant , associated with a slip of s samples, the corresponding expression becomes:
The DCH signal results from subtracting (16) and (15). For consecutive sample pairs, this signal is generally given by:
In this context, represents the cumulative difference between the global contributions of all harmonic and interharmonic contributions over a span of s samples, while accounts for the intrinsic white noise within the transformed signal.
Consequently, the derived DCH signal is synthesized from three distinct elements consisting of a function incorporating harmonic and interharmonic periodic components, noise, and a continuous offset defined as . The magnitude of this offset term is governed by specific parameters. Its influence is minimized by a slower exponential decay (indicated by a larger time constant , the reduced initial amplitude , or a smaller value for the slip . Furthermore, the sampling frequency is a critical factor; a higher sampling rate corresponds to a shorter sampling period , which directly attenuates the impact of this offset term.
Given the indeterminacy of the exponential component values ( and ), the system optimization relies exclusively on adjusting the sampling and the slip . The practical upper limit of is dictated by the digital signal processor (DSP) performance specifications, particularly its ability to execute the necessary algorithms within the available time window between consecutive samples. Consequently, we rationally consider minimizing the value of the slip .
While it may be presumed that the optimal slip value is (indicating two consecutive samples), it is essential to consider that subtracting samples that are in close proximity may obscure the inherent noise in the signal, thereby distorting the measurement of the estimated wave. In this scenario, the noise may dominate the signal’s value, resulting in an undesirable signal to noise ratio (SNR) that complicates the phasor estimation.
Consequently, the selection of the optimal slip parameters necessitates a strategic trade-off between minimizing the exponential offset and mitigating the signal noise. Extensive simulations corroborate that a slip value of s = N/16 specifically within the context of N = 128 samples per period, standard for modern protection relay DSPs, is optimal. This configuration not only ensures an acceptable SNR but also maintains robust filter performance in the presence of fast decaying exponentials, while simultaneously minimizing the latency required to generate the auxiliary signal.
After generating DCH signal, the subsequent key step consists of deriving a signal that contains exclusively the interharmonic periodic components associated with the network fundamental frequency. This is achieved by applying a procedure analogous to the previous one, based on the Sliding Technique Filter (STF), in which pairs of samples are subtracted using a slip value s = N. As a result, the Removed All Harmonics wave (RAH wave) is obtained, in which the harmonic components as well as any remaining constant terms present in the DCH signal are effectively eliminated.
For a subsequent instant, corresponding to a fundamental period T, that is a slip samples, the DCH signal is given by:
Computing the difference between expressions (18) and (17) achieves a dual filtering effect. Primarily, it nullifies the continuous offset associated with the exponential component of the original signal. Simultaneously, the operation eliminates all periodic components that are synchronous with the fundamental period T. Consequently, the resulting RAH signal is defined as:
For sample pairs spaced by N, reflects the residual interharmonic difference found in the DCH signal, accounting for the signal’s white noise. The relationship between the original signal and the derived DCH and RAH waves is illustrated in Figure 5.
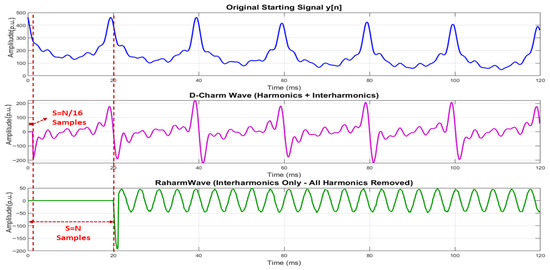
Figure 5.
The relationship between the original signal and the derived DCH and RAH waves.
The theoretical derivation RAH and DCH components assumes a perfect alignment where the sampling window N samples correspond to one fundamental period. However, in practical grid scenarios, the fundamental frequency f often deviates from the nominal f0. This results in a “slip”, where the window length , is no longer an integer multiple of the actual signal period T = 1/f. This asynchrony can potentially lead to spectral leakage, which might degrade the performance of harmonic cancellation techniques that rely on exact periodicity. To verify the robustness of the proposed DCH/RAH methodology, and to evaluate the robustness of the proposed algorithm under off-nominal operating situations, its performance was examined using a frequency deviation of +200 mHz. Figure 6 displays the resultant fundamental magnitude and phase estimates for this test case.
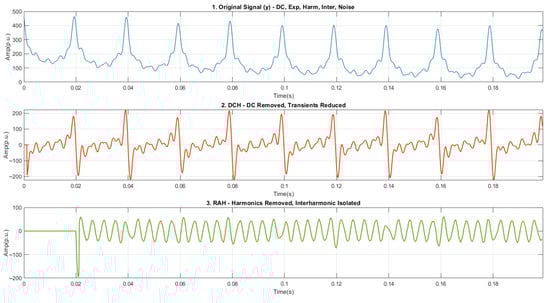
Figure 6.
Robustness of DCH/RAH when fundamental frequency is off-nominal.
The results obtained demonstrate that the harmonic cancellation mechanism remains effective despite a frequency drift from its nominal value. The RAH waveform, created with a constant slip of N samples (corresponding to the nominal period T), results in frequency deviations that manifest as residual signals in the harmonic components of the RAH wave instead of being entirely eliminated. As a result, the harmonic components are not entirely eradicated but instead appear as a low-amplitude residual term alongside the RAH signal. The integrated components of the Modified Covariance Method facilitate high-resolution spectrum estimation, enabling the identification of residual components at their actual shifted frequencies (e.g., 50.2 Hz) instead of being limited to nominal frequency bins.
At this stage, the aim is to estimate the interharmonic components contained in the RAH signal in order to construct a new signal whose phasor values are referenced to the DCH signal. To this end, the BFRP is applied to the phasor quantities estimated from the RAH signal. The resulting signal represents the interharmonic and subharmonic characteristic content of the original waveform and is referred to as the CISH wave (Characteristical Inter/Sub-Harmonic Wave). Finally, the MC-CCH signal is computed by subtracting the CISH wave from the DCH wave, thereby isolating the desired harmonic components.
If the set of interharmonics in the RAH signal is represented by , then each phasor can be uniquely described by its modulus, phase angle, and corresponding interharmonic frequency:
Starting from the identified interharmonic frequencies and applying Equation (10), the corresponding BFRP for each phasor referenced to a DCH signal can be determined. Considering that the slip value employed to generate the RAH signal from the DCH signal is s = N, and that the fundamental frequency f is set equal to the network nominal frequency (50 Hz), Equation (10) can be rewritten as follows:
Consequently, the parameters and can be directly obtained from Equations (11) and (14). Using these parameters, the relationships defined in (12) and (13) are then applied to the phase and magnitude of the RAH signal phasors. The resulting quantities constitute the phasor set , which defines the CISH signal:
The estimation of the phasors, which correspond to the potential interharmonic components present in the RAH signal, is performed using the MCM. In contrast to the original CCHDF approach where the interharmonic estimation relied on the DFT combined with peak detection, the proposed methodology adopts the Modified Covariance Method (MCM) to achieve superior interharmonic estimation performance. As it achieves high-resolution spectral analysis using significantly reduced data sets, MCM is particularly well adapted for the protective relaying environment. It effectively addresses the critical need for the fast response times and robust real-time performance required in modern electrical power systems [33,34]. Once the RAH signal contains sufficient samples, specifically a minimum of N/8 samples, which enables the detection of interharmonic components up to 400 Hz, the following estimation procedure is applied:
- 1.
- Signal Preparation: the RAH signal segment is prepared for analysis without windowing or zero-padding, as MCM provides superior resolution without the techniques mentioned.
- 2.
- Autoregressive Modeling: a linear predictor is an adaptive filter that forecasts the amplitude of the signal at time m, x(m), using a linear combination of P previous samples [x (m − 1), …, x (m − P)] aswhere is the prediction of the signal x(m), and the vector is the coefficient vector of a predictor of order P. The prediction error e(m), i.e., the difference between the actual sample x(m) and its predicted value , is defined as:where is the AR coefficient and e(m) is the prediction error [34]. In this work, P is selected = 30 in order to receive accurate results for all three cases.
- 3.
- Modified Covariance Optimization: the MCM minimizes the sum of the forward and backward prediction errors:This approach provides superior frequency resolution compared to standard covariance methods.
- 4.
- Frequency Estimation: the AR polynomial roots are calculated:Frequencies of sinusoidal components correspond to the angles of roots lying close to the unit circle:where is the angle of root of .
- 5.
- Amplitude and Phase Estimation: for each detected frequency, the amplitudes and phases are estimated using the least squares technique.
- 6.
- Adaptive Window Processing: for each new RAH sample, steps 2–5 are iteratively executed; an adaptive observation window expands by one sample at each iteration while preserving the required spectral resolution. The window length is progressively increased until the estimated magnitude, phase, and frequency values satisfy predefined convergence criteria, at which point the window size is considered stabilized.
- 7.
- Change Detection: if the estimated values change significantly after stabilization, the process restarts from step 1 to detect new signal components.
This process provides highly accurate interharmonic frequency, magnitude, and phase estimation, even with short data windows. Once the phasors of the RAH signal have been estimated, the CISH signal is constructed by applying the phasor relationships defined in (22). The generation of the CISH is performed over a window of samples, corresponding to one fundamental period , extending backward from the instant at which the interharmonic estimation process is initiated. This backward windowing strategy enables the reconstruction of signal values at a previous time instant using the information available at the current instant. The procedure is then applied successively for subsequent time steps. Accordingly, the general expression of the resulting signal, formulated in terms of the estimated phasors, is given by:
Ultimately, the CCH signal is derived by calculating the difference between the DCH baseline and the synthesized CISH signal. As illustrated in Figure 7, the resulting waveform is effectively purged of both interharmonic distortions and exponential decay components, leaving a clean representation of the system’s harmonic characteristics:
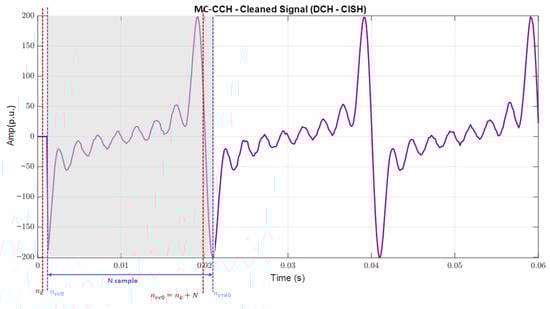
Figure 7.
MC-CCH Wave.
To receive the right answer for the subtraction, we need to know the lengths of the samples and the time interval that goes with the CISH window. Figure 7 shows a simplified version of the whole process. The DCH signal must match the window that goes with the samples and .
3.3. Derivation of Original Signal Phasors
The CCH signal isolates the harmonic components, allowing for a direct mapping to the original signal’s components via the BFRP technique. This step involves estimating the phasors of the CCH wave denoted as through , consistent with the antialiasing filter’s suppression of higher order harmonics. To reference these values back to the original timeline, a constant sample displacement of is applied. This relationship is mathematically formalized by adapting Equation (10) as follows:
In this formulation, represents the discrete harmonic frequencies, where f denotes the nominal fundamental frequency (50 Hz) and the harmonic index h is constrained to the integer , reflecting the bandwidth limitations imposed by the antialiasing filter.
With the requistite parameters ϑ and in Equations (11) and (14), the BFRP transformation outlined in (12) and (13) is applied to the CCH signal phasors. This procedure facilitates the recovery of following the original signal phasors, , through the following derived relationships:
The derivation of the original signal phasors is synchronized with the calculation of the CCH signal. As the CCH waveform is periodic with period , applying a standard one-cycle DFT over a window of samples allows for the seamless extracting of fundamental and harmonic components. As the analysis window advances by the sampling interval , the estimation process converges toward stable values, ensuring the reliability required for protective relaying functions.
A parallel methodology is employed to quantify the interharmonic phasors. However, whereas harmonic estimation relies on the CCH signal, interharmonics analysis utilizing the referenced phasor of the CISH signal is used. Following the logic established in Equation (29), the formulation is adapted as follows:
Here, denotes the set of estimated interharmonic frequencies identified in Equation (20). By invoking the established BFRP relationships, the phasors , representing the interharmonic components of the original signal, are derived as follows:
4. Results and Discussion
This section illustrates the operation of the proposed filter through the analysis of its performance under different types of electrical signals. Two signals’ categories are considered, and in both cases the sampling frequency is selected to match that commonly employed in modern DSP-based numerical protection relays, namely 6400 Hz, corresponding to 128 samples per fundamental cycle.
The results clearly demonstrate that the incorporation of the Modified Covariance Method (MCM) into the CCH filtering structure provides a substantial improvement in phasor estimation performance. The proposed MC-CCHDF algorithm exhibits a stable dynamic response, high resolution in interharmonic extraction, and superior magnitude/phase accuracy, even under harsh transient and spectral interference conditions. This behavior validates the stability of the proposed algorithm for practical relay applications, where fast and reliable phasor estimation is essential for secure and dependable protection decision-making. The graphics show them for each case:
- Signal Integrity: a temporal comparison between the original input signal and the extracted MC-CCHDF signal.
- Magnitude Estimation: a comparative assessment of the fundamental phasor modulus, benchmarking proposed algorithm against standard DFT techniques.
- Phase Estimation: an evaluation of the fundamental phase angle accuracy, contrasting the tracking capabilities of the proposed method with those of the DFT.
The analysis of the obtained results was conducted in strict accordance with IEC 61000-4-30 and 61000-4-7 standards [35,36], which established the protocols for measuring and interpreting harmonic and interharmonic distortion. While the IEC standards prescribe an observation window of 10 cycles (equivalent to 200 ms at 50 Hz) for accurate spectral analysis, the proposed filter technique demonstrates a significant advantage by achieving precise phasor estimation within only a few fundamental cycles. Furthermore, the specific interharmonic components identified during the filtering process are presented in the subsequent tables for each respective test case.
4.1. Evaluation of the Method for the Test Signals
The performance of the proposed MC-CCHDF algorithm was evaluated using multiple transient scenarios characterized by the presence of interharmonics, exponentially decaying DC components, and measurement noise. For comparison purposes, the following approaches were examined:
- Table 1 (Case 1)—the analyzed signal includes an interharmonic component.
 Table 1. Case 1: characteristics of signal for one interharmonic component.
 - Table 2 (Case 2)—the analyzed signal contains two interharmonic components, one of which is a subharmonic.
Table 2. Case 2: characteristics of signal for two interharmonic components.
- Table 3 (Case 3)—the analyzed signal comprises three interharmonic components.
Table 3. Case 3: characteristics of signal for three interharmonic components.
To evaluate the robustness and selectivity of the proposed estimation framework under progressively more demanding operating conditions, three synthetic test cases were defined. All cases share a common baseline structure consisting of a DC offset, two decaying exponential components, a fundamental component at 50 Hz with multiple harmonics up to the 8th order, and additive noise set to 1% of the fundamental amplitude. This baseline configuration is consistent with widely accepted modeling practices for faulted current and voltage signals in protection studies.
Across the three cases, the progression from a signal interharmonic to multiple interharmonics highlights the increasing complexity faced by phasor and spectral estimation algorithms in protection relays. While Case 1 primarily validates correctness, Case 2 and Case 3 stress resolution limits, convergence behavior, and sensitivity to spectral congestion. Such a structured test hierarchy ensures that performance improvements are observed and this is not limited to idealized conditions but remains valid under realistic and adverse operating scenarios.
The defined cases directly align with the objectives of protection-oriented signal analysis, where rapid and accurate estimation under non-stationary conditions is critical. Importantly, the selected parameter ranges for harmonics, interharmonics, and noise are consistent with internationally recognized power quality and compatibility standards, ensuring that the conclusions drawn from these tests remain practically meaningful:
- Figure 8 for Case 1 illustrates the original signal with the associated MC-CCHDF Wave, and calculated modulus and angle, respectively.
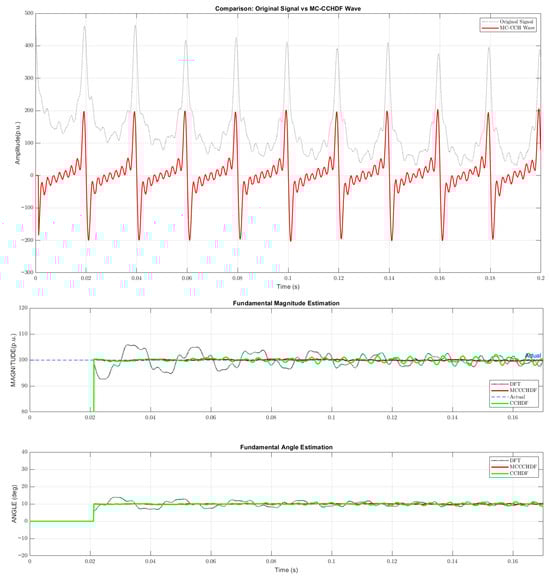 Figure 8. Original signal vs. MC-CCHDF signal and Fundamental Amplitude and Angle for Case 1.
 - Figure 9 for Case 2 illustrates the original signal with its MC-CCHDF Wave, and the calculated modulus and angle, respectively.
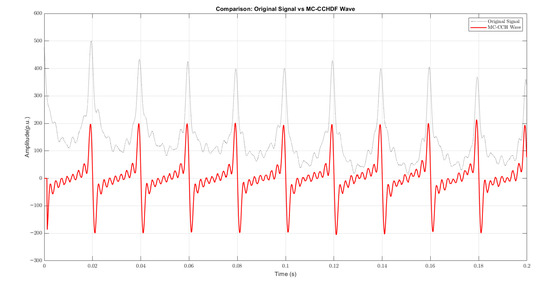
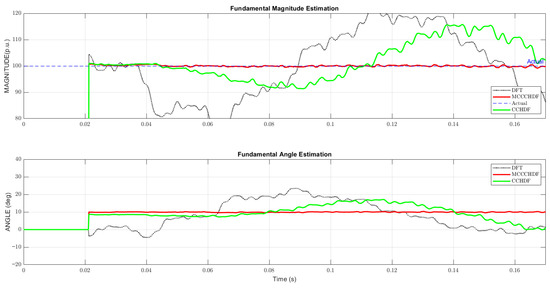 Figure 9. Original signal vs. MC-CCHDF signal and Fundamental Amplitude and Angle for Case 2.
 - Figure 10 for Case 3 illustrates the original signal and its MC-CCHDF Wave, and calculated modulus and angle, respectively.
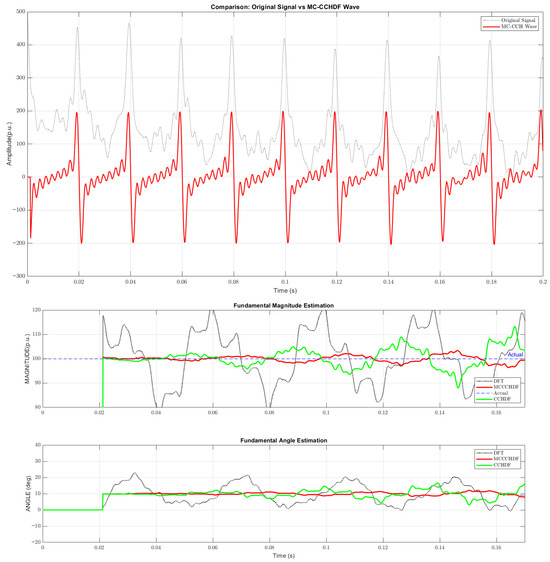 Figure 10. Original signal vs. MC-CCHDF signal and Fundamental Amplitude and Angle for Case 3.
The test results obtained under the various signal disturbances confirm that the behavior of the proposed algorithm remained consistent even when the analyzed waveforms exhibited severe transient features. In all evaluated conditions, the following conclusions can be drawn:
- Response Time: the processing delay of the method does not depend on the characteristics of the waveform under analysis. As illustrated in Figure 6, the output becomes available after approximately (N + N/16 + N/8) samples are processed, which corresponds to slightly more than one fundamental cycle from the time the signal begins to be sampled. Consequently, the algorithm starts delivering valid amplitude and phase estimates just after one cycle of data acquisition.
- Fast Convergence: once the output is initiated, the estimates of both magnitude and phase approach the correct values rapidly and remain stable thereafter.
- Stable Steady State Behavior: after convergence, the algorithm maintains the estimated phasors without noticeable oscillatory deviations, even under adverse conditions involving multiple interharmonics and noise.
- Superiority over Existing Approaches: the conventional approaches (including DFT) were unable to provide accurate phasor values for the transient used; whereas the proposed approach delivered reliable estimates for all test cases.
Further analysis enabled the following additional observations:
- Noise and Multiple Exponentials: the inclusion of multiple exponentially decaying components as well as noise had minimal impact both on the accuracy of the estimates and on the convergence time. The robustness of the algorithm remained preserved.
- Effect of Interharmonics on the Convergence Speed: the Convergence rate is strongly influenced by the number and frequency range of interharmonic components. In general, higher-frequency interharmonics contributed to a faster and cleaner convergence. Low-frequency interharmonics (including subharmonics) required more time to be detected, since a greater window of data is required for reliable estimation. Additionally, increasing the number of interharmonics makes detection more challenging, particularly in the lower-frequency range, which can increase the convergence time.
The behavior for each case can be summarized as follow:
- Case 1: with a signal high-frequency interharmonic component, the convergence occurred almost immediately after the processing delay.
- Case 2: the presence of the subharmonic resulted in convergence occurring roughly one cycle after the required delay, since additional data were needed before the estimations became reliable.
- Case 3: in this situation, the signal included three interharmonics, one of which was close to the fundamental frequency. This slowed the convergence process, and correct phasor estimation was achieved at slightly more than one and a half cycles.
In all three cases, the method converged well within three cycles from the moment the signal data were first received, demonstrating the suitability of the approach for protection applications that require fast dynamic tracking.
Table 4 summarizes the interharmonic components detected in each waveform. The estimated phasors closely match the actual interharmonic values, showing the precision of the proposed estimation method.
Table 4.
Actual and estimated interharmonic components in three cases.
Where Ai, fi, αi, and , , and are represented as the actual and estimated interharmonic components, respectively, the sampling frequency of 6400 Hz (128 sample per 20 ms period) was adequate to achieve the required accuracy. This sampling density is consistent with the capabilities of digital signal processors commonly used in industrial numerical relays. Nevertheless, the proposed technique is not restricted to this sampling rate and remains applicable for lower or higher sampling frequencies.
Increasing the number of samples per cycle N necessarily increases the sampling frequency , assuming that a full-cycle window is maintained. Higher sampling frequencies imply reduced processing time between samples, which can be a drawback with respect to real-time operation constraint in digital relays. However, several practical benefits can be obtained when using more samples per cycle:
- Improve Exponential Suppression: with higher time resolution, the STF stages can further suppress the decaying exponential terms, although the influence of noise must be carefully considered in selecting an appropriate slip value. Thus, a trade-off between protection speed and noise sensitivity must be made.
- Higher Maximum Detectable Interharmonic Frequency: increasing the sampling frequency expands the theoretical detectable frequency range under the Nyquist criterion. Nevertheless, in protection equipment this is not critical, since antialiasing filters prevent frequencies above approximately 400 Hz from entering the relay.
- Improved Spectral Resolution: higher sampling frequencies narrow the frequency resolution of the modified covariance spectrum, which results in more precise interharmonic detection and consequently, more accurate phasor estimation. However, greater resolution does not imply faster detection, since temporal information not spectral resolution determines the convergence time. For this reason, the algorithm employs an adaptive RAH window to obtain sufficient temporal content for reliable interharmonic extraction.
To further quantify the dynamic performance of the estimators, the cumulative estimation error (CEE) as illustrated in Figure 11 and the quality of estimation, the selection of the most suitable window function is made according to the criterion of the minimum cumulative estimation error, given by the expression:
where v(j) denotes the actual value of the parameter, and the estimated value of the parameter. The cumulative estimation error is also a discrete variable. It is determined at every time instant nTs, on every sample of the estimated object. It should emphasize that the MCM does not require spectral windowing or zero-padding. The reference to “window selection” in the CEE analysis refers exclusively to the temporal evaluation interval over which estimation errors are accumulated and compared, not to spectral windowing applied to the signal. IEEE C37.118 [37] performance indices: TVE, FE and ROCOF are evaluated, given by the expressions:
where and are the difference between measured and synchro-phasor components at the same instant (t), respectively. In a similar way, FE in Hz and ROCO in Hz/s, are given as follows, respectively:
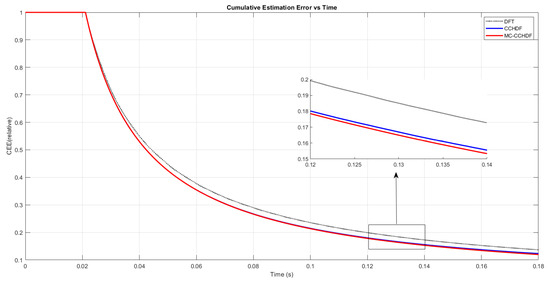
Figure 11.
CEE comparative for DFT, CCHDF, and MC-CCHDF.
As shown in Figure 12, the DFT-based estimator exhibits persistent oscillations in TVE and FE. The original CCHDF approach reduces the oscillations but remains sensitive under increased spectral distortion. In contrast the proposed MC-CCHDF method achieves rapid stabilization of TVE and FE, resulting in the lowest CEE and smooth ROCOF trajectories across all scenarios. These results confirm that the proposed method provides superior long-term stability and dynamic accuracy compared to existing approaches [38,39].
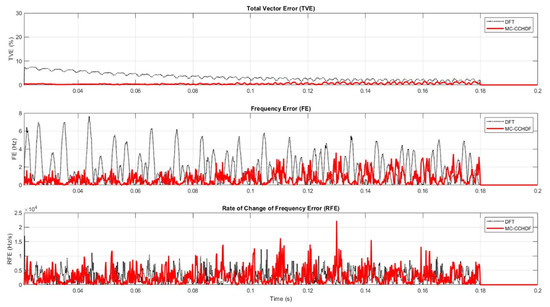
Figure 12.
IEEE indices TVE, FE, and RFE.
The Frequency Error (FE) was observed to be larger than the corresponding magnitude/angle error despite strong phasor accuracy. This outcome is expected because frequency is defined from the time-derivation of the signal phase, hence residual distortions or noise that have limited impact on TVE can be amplified in the phase-slop computation used for the FE and ROCOF. In addition, the MC-CCHDF filtering chain employs slip tuned to a nominal-cycle sample count (e.g., N = 128 at 50 Hz). Under off-nominal frequency, perfect harmonic cancellation is no longer exact and resulting structured residual behaves analogously to spectral leakage in the fixed-window DFT, introducing bias and variance in the derived frequency trace. The effects are exacerbated when short data windows are used to achieve protection-grade response times, reflecting the well-known tradeoff between speed and frequency precision.
To highlight the practical advantages of the proposed MC-CCHDF algorithm, Table 5 compares its characteristics with those of commonly use phasor estimation techniques in numerical protection relays. The comparison focuses on criteria that are critical for relay operation, including data window length, robustness against DC offset and interharmonics, sensitivity to frequency deviation, computational burden, and real-time applicability.
Table 5.
Comparison of MC-CCHDF with traditional phasor estimation techniques.
As shown in Table 5, conventional DFT-based and cosine filter estimators suffer from significant performance degradation in the presence of DC offsets, interharmonic, and frequency deviations, which are common during fault transients. Although wavelet-based approaches provide improved robustness, their long data windows and higher computational burden limit their applicability in fast protection functions.
4.2. Simulation Enviroment and Implementation
To evaluate the performance of proposed MC-CCHDF algorithm under realistic operation conditions, extensive simulations were conducted using the MATLAB 2023a programming environment. The computational framework was designed to replicate the signal processing chain of a modern numerical protection relay. It processed data at a sampling frequency (fs) of 6400 Hz, which corresponds to 128 samples per fundamental cycle (at 50 Hz). This sampling rate follows the Nyquist criterion for the 8th harmonic and is consistent with the specifications of industrial-grade Digital Signal Processors (DSPs). Although the theoretical Nyquist limit for this sampling rate is 3200 Hz, the effective analysis bandwidth is limited to about 400 Hz. This limitation is imposed by the analog antialiasing filters and front-end circuitry of the relay hardware, which attenuate higher-order components prior to digitization, and also the fact that the most important harmonics in the power system network are of orders 5 and 7.
The test signal represents a phase current derived from a 132 kV transmission network model. The system topology consists of a 264 km main transmission line operating in parallel with a 78 km line. A single phase-to-ground fault was applied at a distance of 100 km from the sending-end substation. Current Transformers (CTs) were modeled with a ratio 2000:5 A, and the protection relay was configured as an ANSI 87 L (Line Differential) element with a rated current 1000 A. This configuration captures the complexities of a high-voltage transmission fault, including mutual coupling effects from the parallel line.
The fault signals were synthesized according to the mathematical formulation presented in Equation (1). The parameters in the simulation script were explicitly chosen to correlate with the terms in the analytical model, ensuring a direct mapping between the theoretical equations and the implemented script.
4.3. Evaluation of the Method Fault in Network
The analyzed fault signal has been generated using a MATLAB-based numerical script derived from a verified transmission network model. The signal represents the phase current of a 246 km three-phase line operation in parallel with a 78 km line, with a single phase-to-earth fault applied within 100 km of the main line. The waveform clearly includes two operating systems: a steady state pre-fault interval and a transient post-fault interval characterized by a DC offset and decaying exponential components.
Figure 13 shows the original fault current and the corresponding MC-CCH wave. While the original signal exhibits severe distortion immediately after fault inception, the MC-CCH wave maintains a stable fundamental oscillation, indicating effective suppression of exponential and non-synchronous components. This behavior is essential for protection relays, as it enables reliable signal conditioning during the most critical post-fault interval.
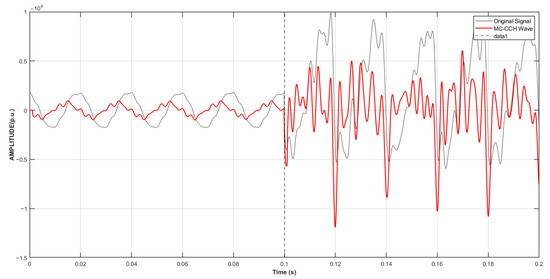
Figure 13.
Original and MC-CCH waves.
The fundamental magnitude and phase estimates shown in Figure 14 further confirm this behavior. Both quantities remain stable in the pre-fault interval and converge rapidly after fault inception without sustain oscillations. This rapid stabilization is particularly important for relay elements that depend on accurate phasor information such as directional, distance, and differential protections.
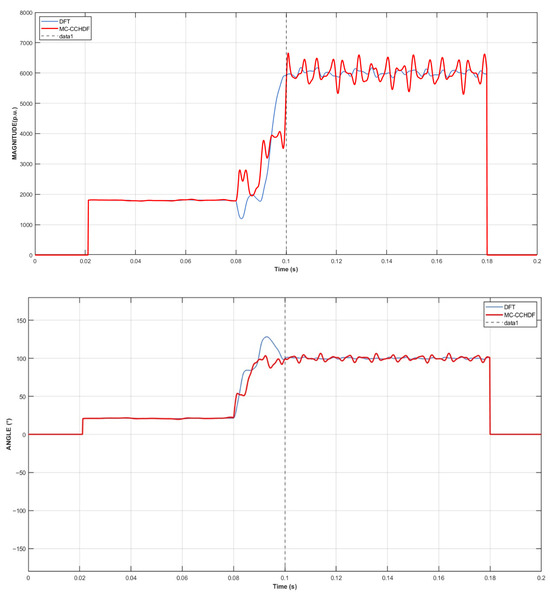
Figure 14.
Fundamental Magnitude in Amperes and Phase.
5. Conclusions
A novel method, the Modified Covariance-assisted Clean Characteristically Harmonic Digital Filter (MC-CCHDF), has been developed and presented in this work to provide a more stable and accurate way to estimate fundamental and interharmonic phasors during power system faults. The proposed approach was evaluated using numerically generated signals representative of realistic transmission line fault conditions, including harmonics, interharmonics, decaying DC components, and measurement noise.
The proposed method achieves a characteristic harmonic signal that is effectively free from both exponential and interharmonic components, enabling reliable phasor estimation under highly non-stationary conditions. By integrating the Modified Covariance spectral estimation technique within the established DCH, RAH, CISH, and CCH signal decomposition structure, the method significantly enhances frequency resolution and robustness compared to classical DFT-based implementation. This improvement is particularly evident in scenarios involving closely spaced or multiple interharmonic components, where conventional estimators exhibit oscillatory behavior and show convergence.
The results demonstrate that the MC-CCHDF framework preserves the essential periodic information of the original signal while minimizing the influence of noise and transient disturbances. The estimated magnitude and phase of the fundamental components converge rapidly after the fault inception and accurately remain as stable phasors, even under severe spectral distortion.
Performance assessment using cumulative estimation error and IEEEC37.118 dynamic indices (TVE, FE, and ROCOF) confirms the superior behavior of the proposed approach. The MC-CCHDF method consistently exhibits reduced instantaneous errors and negligible long-term error accumulation, indicating strong numerical stability and suitability for protection-oriented applications. Compared with the conventional DFT and the original CCHDF- based method, the MC-CCHDF framework achieves improved dynamic tracking and smoother frequency-related responses.
An important advantage of the MC-CCHDF lies in its structural flexibility. The MC-CCHDF framework is open and modular, allowing alternative spectral estimation techniques to be incorporated within the same signal decomposition architecture while preserving the biunivocal frequency relationship of the phasors. Furthermore, the method is independent of the fault inception instant and remains valid for different sampling rates, making it compatible with modern DSP platforms employed in numerical protection relays.
The reduced data window required for stable estimation makes the proposed method particularly attractive for protection and post-fault analysis applications, where only a limited number of samples may be available between fault inception and clearing. Consequently, the MC-CCHDF approach can support a reliable operation of protection, monitoring, and fault location functions under both steady-state and transient conditions.
Overall, the obtained results confirm that the proposed MC-CCHDF method provides a precise, stable, and computationally viable solution for advanced digital protection and surveillance systems, offering a clear improvement over existing techniques reported in the literature.
The increased computational demands of the MC-CCHDF algorithm over traditional DFT and cosine filtering techniques are counterbalanced by significant improvements in protection performance under current grid conditions. The method’s improved accuracy during transients, superior interharmonic rejection, and faster convergence make the additional hardware requirements justified, especially as next-generation DSPs and FPGAs continue to advance in capability while decreasing in cost. Practical deployment in commercial relays is ensured by implementation strategies such as hybrid architectures, algorithmic optimizations, and selective activation during transient conditions. As power systems increasingly incorporate inverter-based resources and experience reduced inertia, these sophisticated estimating methodologies transition from being supplementary enhancements to essential operational prerequisites for maintaining the security and reliability of protection systems.
Author Contributions
Methodology, N.A. and V.P.; Validation, N.A.; Investigation, N.A. and V.P.; Writing—original draft, N.A. and V.P.; Writing—review & editing, N.A. and V.P.; Supervision, V.P. All authors have read and agreed to the published version of the manuscript.
Funding
This research received no external funding.
Data Availability Statement
The original contributions presented in this study are included in the article. Further inquiries can be directed to the corresponding author.
Conflicts of Interest
The authors declare no conflicts of interest.
References
- Phadke, A.G.; Thorpand, J.S. Computer Relaying for Power Systems; John Wiley & Sons: Hoboken, NJ, USA, 2009. [Google Scholar]
- Jia, T.; Yao, L.; Yang, G. A new fault location method for high-voltage transmission lines based on ICEEMDAN-MSA-ConvGRU model. IET Gener. Transm. Distrib. 2024, 18, 2650–2668. [Google Scholar] [CrossRef]
- Parpaei, M.; Abyaneh, H.A.; Razavi, F. An innovative method to eliminate multiple exponentially decaying DC components based on the discrete Fourier transform in the numerical distance relay. IET Gener. Transm. Distrib. 2022, 16, 3617–3635. [Google Scholar] [CrossRef]
- Vlahinić, S.; Brnobić, D.; Vučetić, D. Measurement and analysis of harmonic distortion in power distribution systems. Electr. Power Syst. Res. 2009, 79, 1121–1126. [Google Scholar] [CrossRef]
- Altintasi, C.; Aydin, O.; Taplamacioglu, M.C.; Salor, O. Power system harmonic and interharmonic estimation using Vortex Search Algorithm. Electr. Power Syst. Res. 2020, 182, 106187. [Google Scholar] [CrossRef]
- Ghafari, C. Innovative Numerical Protection Relay Design on the Basis of Sampled Measured Values for Smart Grids. Ph.D. Thesis, Université Grenoble Alpes, Grenoble, France, 2016. [Google Scholar]
- Rana, M.M. Least mean square fourth based microgrid state estimation algorithm using the internet of things technology. PLoS ONE 2017, 12, e0176099. [Google Scholar] [CrossRef] [PubMed]
- Riahinia, S.; Ameli, A.; Ghafouri, M.; Yassine, A. Recursive Least-Square-Based Parameter Estimation for Dynamic State Estimation in Power Grids. In Proceedings of the 2023 IEEE 2nd Industrial Electronics Society Annual On-Line Conference (ONCON), Online, 8–10 December 2023; IEEE: New York, NY, USA, 2023. [Google Scholar]
- Silva, K.M.; Küseland, B.F. Phasor estimation using a modified sine filter combined with an adaptive mimic filter. In Proceedings of the International Conference on Power Systems Transients, Delft, The Netherlands, 14–17 June 2011. [Google Scholar]
- Ogar, V.N. Modelling of a Protective Scheme for AC 330 kV Transmission Line in Nigeria. Ph.D. Thesis, University of Glasgow, Glasgow, UK, 2023. [Google Scholar]
- Tîrnovan, R.A.; Cristea, M. Advanced techniques for fault detection and classification in electrical power transmission systems: An overview. In Proceedings of the 2019 8th International Conference on Modern Power Systems (MPS), Cluj-Napoca, Romania, 21–23 May 2019; pp. 1–6. [Google Scholar] [CrossRef]
- Arboleda, E.R.; Daang, J.A.M.; Omas-as, A.M. Advancements in Fault Detection Techniques for Transmission Lines: A Literature Review. Int. J. Res. Publ. Rev. 2024, 5, 553–572. [Google Scholar] [CrossRef]
- Vannesjö, A. Using DFT-Based Filter Topologies for High Power Transformer Analysis: Theoretical and Experimental Assessment of Windowing Techniques in DFT-Based Filters. Bachelor’s Thesis, KTH Royal Institute of Technology, Stockholm, Sweden, 2025. [Google Scholar]
- Ray, P.K.; Panigrahi, B.K.; Rout, P.K.; Mohanty, A.; Dubey, H. Detection of faults in a power system using wavelet transform and independent component analysis. In Computer, Communication and Electrical Technology; CRC Press: Boca Raton, FL, USA, 2017; pp. 227–231. [Google Scholar]
- Charfi, F.; Haddad, K.; Francois, B. Power system fault monitoring using wavelet transform. In Proceedings of the 2004 IEEE 35th Annual Power Electronics Specialists Conference (IEEE Cat. No. 04CH37551), Aachen, Germany, 20–25 June 2004; IEEE: New York, NY, USA, 2004. [Google Scholar]
- Ahmed, N.; Hashmani, A.A.; Khokhar, S.; Tunio, M.A.; Faheem, M. Fault detection through discrete wavelet transform in overhead power transmission lines. Energy Sci. Eng. 2023, 11, 4181–4197. [Google Scholar] [CrossRef]
- Mohd Amiruddin, A.A.A.; Zabiri, H.; Taqvi, S.A.A.; Tufa, L.D. Neural network applications in fault diagnosis and detection: An overview of implementations in engineering-related systems. Neural Comput. Appl. 2020, 32, 447–472. [Google Scholar] [CrossRef]
- Heo, S.; Lee, J.H. Fault detection and classification using artificial neural networks. IFAC-PapersOnLine 2018, 51, 470–475. [Google Scholar] [CrossRef]
- Muthamizhan, T.; Aijaz, M.; Sekhar, D.C. Wavelet-ANN based detection of fault location of hybrid renewable energy sources connected power transmission system. Int. J. Renew. Energy Res. 2024, 14, 551–562. [Google Scholar] [CrossRef]
- Shekar, S.C.; Salkuti, S.R. Wavelet-ANN Based Detection of Fault Location of Renewable Energy Sources Integrated Power Transmission System. In Energy and Environmental Aspects of Emerging Technologies for Smart Grid; Springer: Berlin/Heidelberg, Germany, 2024; pp. 599–627. [Google Scholar]
- Karmacharya, I.M.; Gokaraju, R. Fault location in ungrounded photovoltaic system using wavelets and ANN. IEEE Trans. Power Deliv. 2017, 33, 549–559. [Google Scholar] [CrossRef]
- Singh, S.V.P.; Prasad, T.; Kamila, S.; Agnihotri, P. Fault detection and classification using wavelet and ANN in DFIG and TCSC connected transmission line. arXiv 2023, arXiv:2308.09046. [Google Scholar] [CrossRef]
- Ankar, S.; Yadav, A. Wavelet-ANN based fault location scheme for bipolar CSC-based HVDC transmission system. In Proceedings of the 2020 First International Conference on Power, Control and Computing Technologies (ICPC2T), Raipur, India, 3–5 January 2020; IEEE: New York, NY, USA, 2020. [Google Scholar]
- Morais, A.; Cardoso, G.; Mariotto, L.; Ferreira, G. Numerical distance relaying algorithm based on Mathematical Morphology and Least-Squares Curve Fitting method. Electr. Power Syst. Res. 2011, 81, 1144–1150. [Google Scholar] [CrossRef]
- Narang, J.K.; Bag, B. Detection of cyber-attacks in smart power transmission system using mathematical morphology and autoencoder. In Proceedings of the 2022 2nd Asian Conference on Innovation in Technology (ASIANCON), Pune, India, 26–28 August 2022; IEEE: New York, NY, USA, 2022. [Google Scholar]
- Wu, Q.-H.; Lu, Z.; Ji, T. Protective Relaying of Power Systems Using Mathematical Morphology; Springer: Berlin/Heidelberg, Germany, 2009. [Google Scholar]
- Marz, M.B. Interharmonics: What They Are, Where They Come from and What They Do; Minnesota Power System Conference Paper; American Transmission Company: Waukesha, WI, USA, 2016. [Google Scholar]
- Chen, L.; Zhao, W.; Wang, F.; Wang, Q.; Huang, S. An interharmonic phasor and frequency estimator for subsynchronous oscillation identification and monitoring. IEEE Trans. Instrum. Meas. 2018, 68, 1714–1723. [Google Scholar] [CrossRef]
- Xiang, P.; Duan, D.; Zhao, X.; Zhang, X.; Zheng, X.; Zou, H.; Wu, J.; Liu, X. A Phasor Estimation Algorithm Based on Iterative Filtering to Remove the Decaying Direct Current Component. IEEE Access 2024, 12, 165253–165264. [Google Scholar] [CrossRef]
- Dam, H.; Nordholm, S.; Cantoni, A.; Dehaan, J. Iterative method for the design of DFT filter bank. IEEE Trans. Circuits Syst. II Express Briefs 2004, 51, 581–586. [Google Scholar] [CrossRef]
- Mojiri, M.; Karimi-Ghartemani, M.; Bakhshai, A. Estimation of power system frequency using an adaptive notch filter. IEEE Trans. Instrum. Meas. 2007, 56, 2470–2477. [Google Scholar] [CrossRef]
- Vazquez, J.; Miñambres, J.F.; Zorrozua, M.A.; Lázaro, J. Phasor Estimation of Transient Electrical Signals Composed of Harmonics and Interharmonics. Energies 2021, 14, 5166. [Google Scholar] [CrossRef]
- Kay, S.M. Modern Spectral Estimation; Pearson Education India: Chennai, India, 1988. [Google Scholar]
- Vaseghi, S.V. Advanced Digital Signal Processing and Noise Reduction; John Wiley & Sons: Hoboken, NJ, USA, 2008. [Google Scholar]
- IEC Std. 61000-4-30; Power Quality Measurement Methods, Testing and Measurements Techniques, 1.0 ed. International Electrotechnical Commission (IEC): Geneva, Switzerland, 2003.
- IEC 61000-4-7; General Guide on Harmonics and Interharmonics Measurements, for Power Supply Systems and Equipment Connected Thereto. International Electrotechnical Commission (IEC): Geneva, Switzerland, 2010.
- IEEE Std C37.118.1-2011; IEEE Standard for Synchrophasor Measurements for Power Systems. IEEE: New York, NY, USA, 2011.
- Papic, V.; Djurović, Z.M.; Kovacevic, B. Adaptive Doppler–Kalman filter for radar systems. IEE Proc.-Vis. Image Signal Process. 2006, 153, 379–387. [Google Scholar] [CrossRef]
- Martin, K.; Hamai, D.; Adamiak, M.G.; Anderson, S.; Begovic, M.; Benmouyal, G.; Brunello, G.; Burger, J.; Cai, J.Y.; Dickerson, B.; et al. Exploring the IEEE standard C37.118–2005 synchrophasors for power systems. IEEE Trans. Power Deliv. 2008, 23, 1805–1811. [Google Scholar] [CrossRef]


Disclaimer/Publisher’s Note: The statements, opinions and data contained in all publications are solely those of the individual author(s) and contributor(s) and not of MDPI and/or the editor(s). MDPI and/or the editor(s) disclaim responsibility for any injury to people or property resulting from any ideas, methods, instructions or products referred to in the content. |
© 2026 by the authors. Licensee MDPI, Basel, Switzerland. This article is an open access article distributed under the terms and conditions of the Creative Commons Attribution (CC BY) license.