Abstract
Partitioning is an important characteristic of the biomass gasification process in a downdraft fixed-bed gasifier, so simulating the partition characteristics has practical guiding significance for revealing the essence of gasification reactions. In this paper, based on the real gasifier, a fluid-solid interfacial reaction method was proposed to simulate heterogeneous reactions based on a holistic gasification model. The partition characteristics, such as the boundary, position, step points, and area of zones, were explored and defined through analyzing the species concentration field, kinetic rate field of reactions, and temperature field. The results indicate that the partition characteristics of kinetic rate distributions are the root cause for zoning in fixed-bed gasification. On the center line of the fixed-bed gasifier, the change nodes of CO concentration tend to be consistent with the nodes of the high kinetic rate of reactions. These results provide a theoretical foundation for the online monitoring of and intervention in biomass gasification.
1. Introduction
Biomass gasification in a fixed bed can be used to transform low-energy density biomass into high-grade energies, such as inflammable gas, thermal energy, electricity, and fuel. Meanwhile, a series of related major fields have emerged, including revealing the essence of the gasification process in a fixed bed in order to optimize the structural and technological parameters of fixed-bed gasifiers. Given that it is impossible to obtain a comprehensive understanding of the flow field, concentration field, chemical reactions, and other information about gasification through measurement, simulation has become an important approach for studying gasification [1,2].
The key to simulation lies in guaranteeing consistency between numerical results and the characteristics of a real gasification system. The gasification steps of a downdraft fixed-bed gasifier, from top to bottom, are drying, pyrolysis, oxidation, and reduction. Thus, investigating the partition characteristics of these zones poses an important task in fixed-bed gasifier simulation. Currently, a number of simulation models for downdraft fixed-bed gasifiers have been built by researchers based on different modeling methods, and they can be classified into two types, i.e., zoning models and holistic models.
In a zoning model, according to different partition theories, chemical reactions of the gasification process are separated in advance into different zones, and different models and simulation methods are adopted in various zones due to different reaction mechanisms. In these systems, mass and heat are transferred among zones by setting different parameters.
Considering the difficulty of reaching equilibrium, Jayah [3] built two-partition simulation models, including the pyrolysis zone and reduction zone. The generalized pyrolysis zone, including drying, pyrolysis, and oxidation, is simulated using equilibrium models, and the chemical kinetic model is adopted to describe the reduction zone. For the sake of simplicity, two-partition simulation models are usually used to investigate the influence of parameters on gasification performance. As the understanding of the complexity of gasification has deepened, the number of zones in fixed-bed gasification has gradually risen. Ratnadhariya [4], Biagini [5], and Dejtrakulwong [6] put forward a three-partition model and a four-partition model. Kumar and Paul [7,8] proposed a downdraft gasifier with four-zone modeling using computational fluid dynamics (CFD). However, simulating more zones requires more complex calculations. In order to simplify the calculations, the gasification process is usually idealized by modularization. In this respect, Aspen plus, relying on its strong modular functions, is an advantageous fixed-bed gasification partition model, and is conducive to understanding the influence of gasification temperature, equivalence ratio (ER), and gasification parameters on gas component, calorific value, gasification efficiency, and so forth [9,10]. The Aspen plus partition model focuses on process module selection and parameter setting, both of which rely on experience and prior experimental accumulation. This inevitably weakens the general applicability of this model, but results produced with this model still provide some guiding significance for technological optimization.
Relative to partition modeling, the absence of partitioning is the main characteristic of holistic modeling, which partitions the gasification process into fixed beds by analyzing the simulation results. For the sake of brevity, holistic modeling usually involves a 1D model. Tinaut [11] and Blasi et al. [12] built holistic models for describing 1D chemical kinetics in a fixed-bed gasification process. Changes in the concentration, particle diameter, gas velocity, and temperature of the solid phase and gas component in gasification reactors were analyzed, and the partition characteristics of downdraft fixed-bed gasification were investigated by analyzing the temperature field. Chaurasia [13,14] built a downdraft gasifier model, which was coupled with a single-particle model, to analyze the effects of particle geometries, such as slab, cylindrical, and spherical, on different biomass gasification parameters.
At present, holistic models mostly use CFD simulations, which produce a 2D or 3D temperature field of the gasifier [15,16,17]. Rogel [18] used a CFD for a holistic gasification model to predict temperature profiles, and, through the analysis of results, found that the drying, pyrolysis, and oxidation zones were concentrated in a narrow region at the top of the fixed bed, while the reduction zone occupied the middle and bottom of the gasifier with declining temperature. Janajreh [19] built a holistic open-center model for analyzing the 2D temperature field in fixed-bed gasification, and defined the boundary of the drying layer; biomass solid particles were simulated using a discrete phase, and a basis for partitioning drying, oxidation, and reduction layers was determined. Wei-Cheng Yan [20] developed a 3D downdraft fixed bed, determined its kinetic parameters through experiments, increased simulation accuracy, and roughly defined the partitioning of four gas zones using temperature curves. Gonzalez [21,22] and Gomez [23] modeled a fixed-bed gasifier as a porous zone in which the solid phase is simulated by user-defined functions (UDFs), coupled with C++-programmed ones, and studied the thermo-chemical transformation phenomenology of biomass into a combustible gas.
In fact, a real gasification process should be an integral whole, and partitioning is manually conducted by analyzing the temperature field, reaction field, and other distinguishable boundary information, so the temperature field is not the sole basis for partitioning in gasification. In this paper, a holistic gasification model capable of describing heterogeneous reactions and the influence of gasification parameters on partitioning in downdraft fixed beds was simulated using FLUENT 17.0. Changes in the reaction-dynamics velocity field, species concentration field, and temperature field, as well as the partitioning mechanism, were determined. Partition characteristics of the gasification process were studied based on multi-field analysis.
2. Models
2.1. Model Geometry
Figure 1 displays the small laboratory downdraft fixed-bed gasifier. The internal diameter of the reactor is 0.2 m, and the height is 1.2 m. A raw materials and gasifying agent injector is located at the top, and the gas flows downward and exits the gasifier from the outlet at the bottom. As shown in Figure 2, a 2D geometric model was built which has the same size with laboratory downdraft fixed-bed gasifier. Biomass particles were fixed in the particle-gasification reaction zone, which was designed as a whole. Wood was used as the raw material, and its elemental analysis and industrial analysis are shown in Table 1. The particle-gasification reaction zone was 0.9 m high, and circular wood particles with a particle size of 30 mm were used.
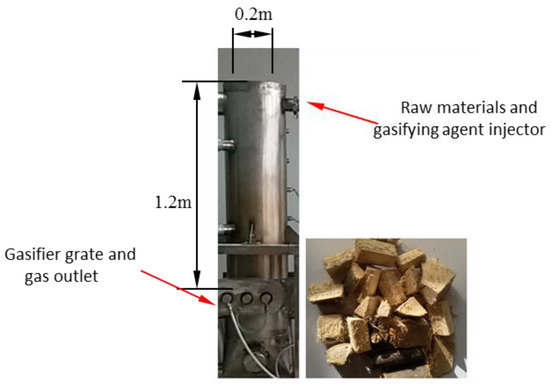
Figure 1.
A laboratory downdraft fixed-bed biomass gasifier and raw material.
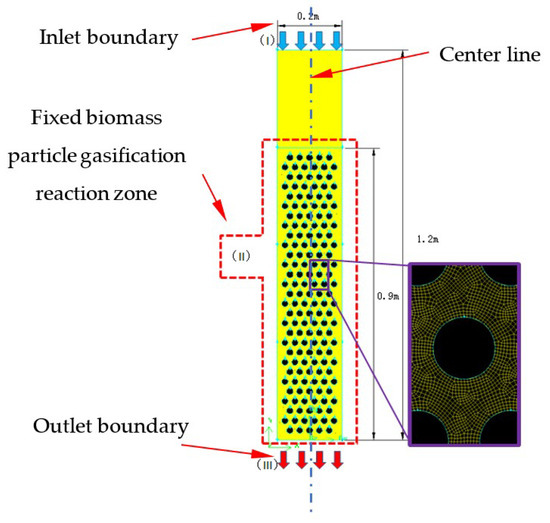
Figure 2.
Geometric model and discrete grid of a stratified downdraft fixed-bed gasifier.

Table 1.
Elemental analysis and industrial analysis of raw material (dry basis).
2.2. Reaction Model
Biomass gasification is a complicated reaction system composed of several independent heterogeneous and homogeneous chemical reactions. Table 2 lists the main reactions involved in it. Heterogeneous reactions R2 and R3 are special in fixed-bed gasification. First, biomass particles in the gasifier have fixed positions and large sizes, and are different from discrete-phase particles, which can flow with the gas. Second, heterogeneous reactions in a downdraft fixed-bed gasifier require mass and heat transfer between fluid (continuous phase) and fixed particles (solid phase), which are accompanied by a series of processes, like biomass particle shrinkage, surface adsorption, desorption, constitutive reaction, solid-phase multi-species transformation, etc. Most of these processes occur on the surface of solid particles.
Table 2.
List of gasification reaction equations [24,25,26,27].
A heterogeneous reaction model called “fluid-solid interfacial reaction” method was proposed in this paper. Under this model, wood and solid product C(s) are set to be a fluid continuous phase, and heterogeneous reactions are set to be a surface reaction model. The solid product C(s) of secondary reactions includes biochar and soot. In this way, wood, C(s), and other gas species are forced to flow and diffuse to the surfaces of solid particles, while fluid–solid heterogeneous reactions are compelled to occur on the surfaces of solid particles. Table 2 lists the chemical reaction models for the different reactions taking place during the gasification process. Meanwhile, in this study, homogeneous reactions were defined as volume reactions suitable for simulating reactions between gas species.
Reaction rate Kr [24,27] is expressed by the Arrhenius equation:
Ar is a pre-exponential factor, βr is a temperature index, Er is the reaction activation energy, R is the universal gas constant, and a and b denote the velocity indices of reactants A and B, respectively. and are the stoichiometric number for the reactant species in the reaction. Table 3 [24,25,26,27] shows the reaction kinetic parameters corresponding to Table 2.
Table 3.
Parameters of chemical reaction dynamics [24,25,26,27].
2.3. Governing Equations
Mass conservation, momentum transfer, energy, and species transfer are solved numerically under the steady-state and turbulent flow conditions. The conservation equations regarding mass, momentum, and energy are described with the following general equations:
where ρ, p, T, , , and R denote density, pressure, temperature, velocity, stress, and universal gas constant, respectively.
In Equation (3), k is the thermal conductivity of the fluid, Ci is the volume concentration of species i, D is the diffusion coefficient of species i, E is energy, Srad is a radiation source term in the energy equation, and Sh, rxn is the energy source term incurred by gas-phase reactions in the energy equation. The key to solving a governing equation lies in properly describing the source terms. In Equation (4), Ri denotes the source term incurred by gas-phase reactions. Considering the characteristics of biomass gas flow around solid particles and turbulent flow, the RNG κ-ε turbulence model was used to describe Ri. The DO radiation model was used to describe thermal radiation in the furnace.
In this paper, according to the “fluid-solid interfacial reaction” method mentioned in Section 2.2, the FLUENT 17.0 basic modules regarding species transfer and reactions are adopted; furthermore, when selecting the reaction type, the heterogeneous reactions are described by wall surface reaction models, where the wall surface is a particle surface, which is one of the boundary conditions. The homogeneous reactions were defined as volumetric reactions which occur in the fixed biomass particle-gasification reaction zone shown in Figure 2. Considering the characteristics of biomass gas flow around solid particles and turbulent flow, the RNG κ-ε turbulence model was used, and the DO radiation model was employed to describe thermal radiation in the furnace.
2.4. Boundary Conditions and Solving
In this paper, ER ranged from 0.2 to 0.6. A premixing model was used in the simulation. The inlet velocity ranged from 0.5 to 1.1 m/s, and the inlet temperature was set to 25 °C. The wall surface temperature was held constant at 500 °C. An uncoupled solving algorithm was used to solve continuity, momentum, energy, and transfer equations in succession; the residual of the energy equation converged to 1.0 × 10⁻⁶.
3. Result Analysis and Discussion
3.1. Model Verification
Gasification tests were performed to verify the accuracy of the simulation results. Figure 3 illustrates the measured temperatures from top to bottom in the gasifier at the velocity of 0.8 m/s. As indicated by a comparison with simulated temperatures in Figure 4, the simulated temperatures obtained with the “fluid-solid interfacial reaction” method and measured temperatures were consistent, both exhibiting gentle development, fast rise, and slow decline. However, when simulating without the “fluid-solid interfacial reaction” method, the temperature rose rapidly after a steady increase stage, and there was no temperature-dropping zone, as shown in Figure 5. Meanwhile, as can be seen in Figure 6, the measured and simulated values of biomass gas species at the gasifier outlet were also well-fitted with each other. It is evident that the “fluid-solid interfacial reaction” method provided higher accuracy results.
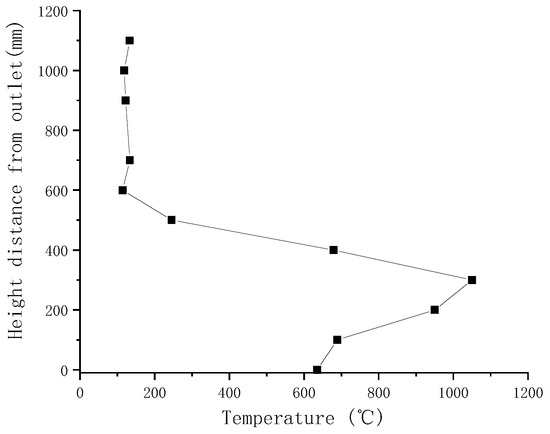
Figure 3.
Measured temperatures along the laboratory downdraft fixed-bed biomass gasifier.
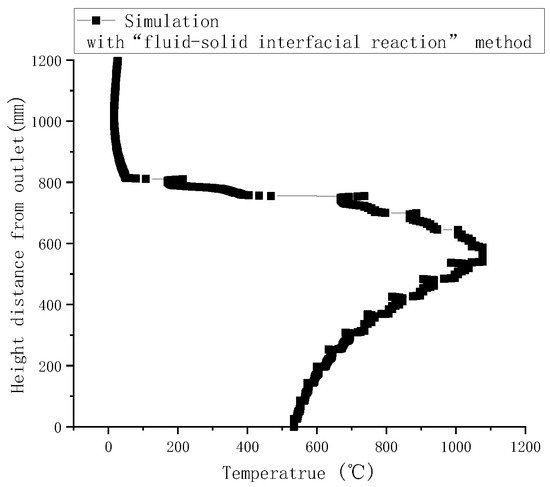
Figure 4.
Simulated temperature along the center line of the gasifier with the “fluid-solid interfacial reaction” method.
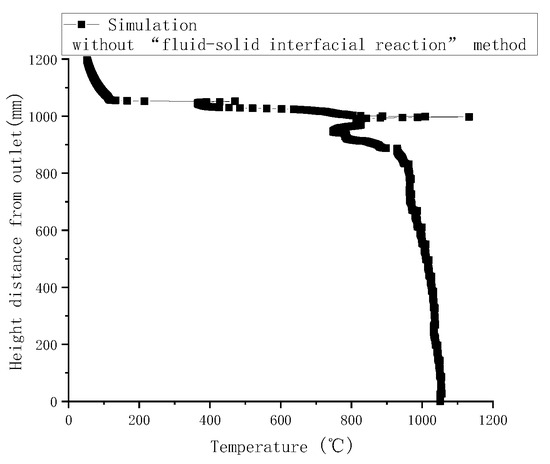
Figure 5.
Simulated temperatures along the center line of the gasifier without the “fluid-solid interfacial reaction” method.
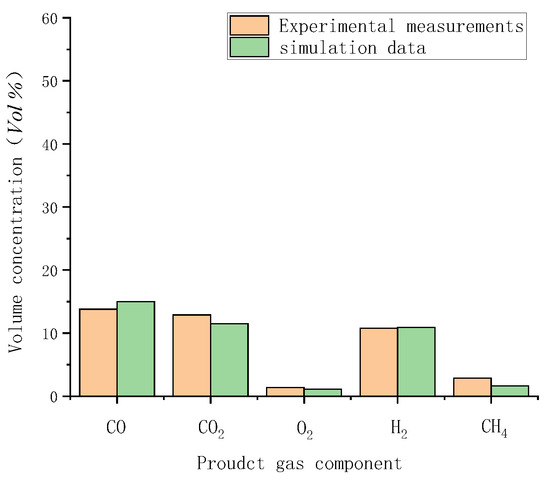
Figure 6.
Comparison of measured and simulated data with the “fluid-solid interfacial reaction” method.
As shown in Table 4, the grid independency test was carried out for the tank, and four various grid sizes were considered: 92,313, 121,481, 190,609, and 211,481. Simulations were performed for these grid sizes and found that the 190,609 and 211,481 mesh cases produced the same results. Hence, the 190,609 mesh was chosen to enhance the precision of the calculations.
Table 4.
Grid independent test.
3.2. Partitioning of the Concentration Field
The pyrolysis zone is where biomass material engages in pyrolysis reactions, which depletes biomass. Figure 7a shows the biomass distribution field, and Figure 7b shows the biomass mass concentration data curve along the center line. After curve derivation, the change rate of biomass mass concentration is obtained, as shown in Figure 7c.
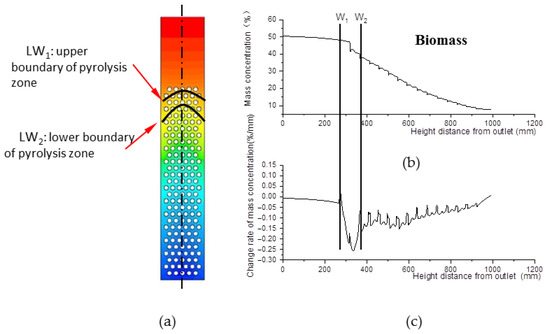
Figure 7.
Biomass distribution field. (a) Biomass mass concentration field inside the gasifier. (b) Biomass mass concentration along the center line of the gasifier. (c) Change rate data of mass concentration along the center line of the gasifier.
Obviously, the change rate of biomass mass concentration declines from W1 to W2. Step point W1 indicates the beginning of pyrolysis, and W2 indicates the end. In Figure 7a, the W1 of all lines that are parallel to the center line compose curve LW1, defined as the upper boundary of the pyrolysis zone. Similarly, curve LW2 is defined as the lower boundary of the pyrolysis zone. The zone between LW1 and LW2 is defined as the pyrolysis zone.
The decline of oxygen concentration is a feature of the oxidation zone. As shown in Figure 8b,c, Q1 and Q2 are step points. Curve LQ1, composed of the step points (Q1) of oxygen concentration, is defined as the upper boundary of the oxidation zone shown in Figure 8a; similarly, curve LQ2 is defined as the lower boundary of the oxidation zone. The zone between LQ1 and LQ2 is defined as the oxidation zone. The area between the upper boundary LQ1 of the oxidation zone and the lower boundary LW2 of the pyrolysis zone is the overlapping region between the two zones.
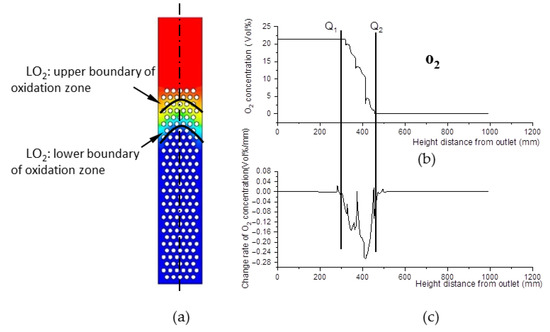
Figure 8.
O2 concentration field. (a) O2 concentration field inside the gasifier. (b) O2 concentration and its change rate data along the center line of the gasifier. (c) Change rate data of O2 concentration along the center line of the gasifier.
The essential characteristic of the reduction zone is the generation of CO. For this reason, CO concentration was investigated and was found to exhibit three step points (C1, C2, and C3), as shown in Figure 9b,c. Thus, three boundary curves, LC1, LC2, and LC3, were produced and are shown in Figure 9a. Compared with Figure 7a and Figure 8a, LC1 almost coincides with LW1 of the pyrolysis zone, and LC2 almost coincides with LQ1 or LW2 in terms of position. As a consequence, a slight increase in CO concentration between LC1 and LC2 is generated by pyrolysis reactions.
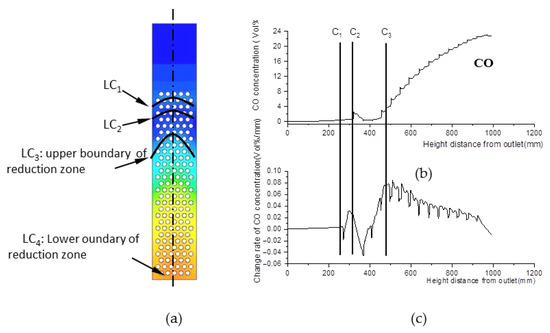
Figure 9.
CO concentration field. (a) CO concentration field inside the gasifier. (b) CO concentration along with its change rate data at the center line of the gasifier. (c) Change rate of CO concentration data at the center line of the gasifier.
LC3 is a curve composed of the step points C3 in the CO concentration field. Below this curve, CO concentration increases rapidly due to reduction reactions. Thus, LC3 is defined as the upper boundary of the reduction zone, while the outlet boundary is its lower boundary.
As shown in Figure 10, Figure 11 and Figure 12, the concentration distributions of species (such as biomass, O2, and CO) along the center line of the gasifier at various inlet velocities are presented in the order of velocities. In Figure 10, with the increase in the inlet velocity, the positions of the upper and lower boundary step points W1 and W2 of the pyrolysis descend, which indicates that the whole pyrolysis zone descends while the area of the zone remains unchanged. As shown in Figure 11, the oxidation zone also shows a similar variation to that of the pyrolysis zone.
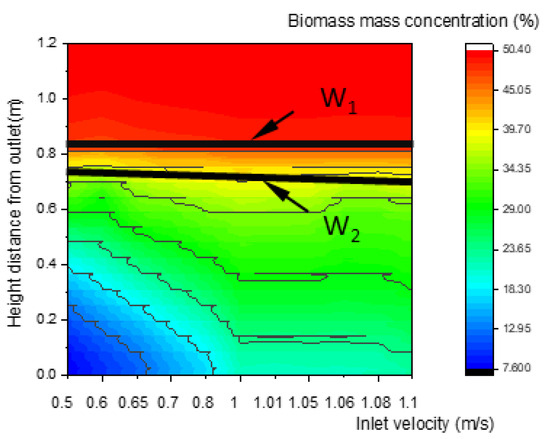
Figure 10.
Relationship between inlet velocity and the characteristics of biomass concentration along the center line of the gasifier.
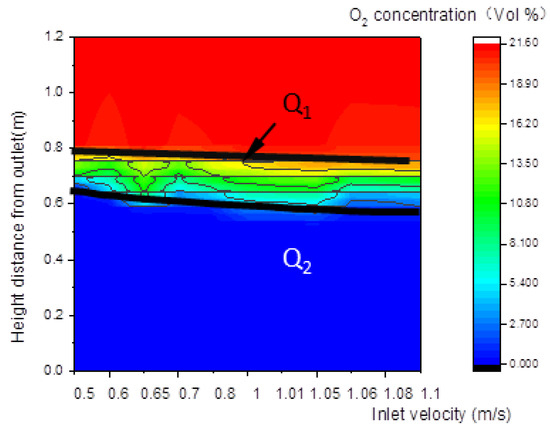
Figure 11.
Relationship between inlet velocity and the characteristics of O2 concentration along the center line of the gasifier.
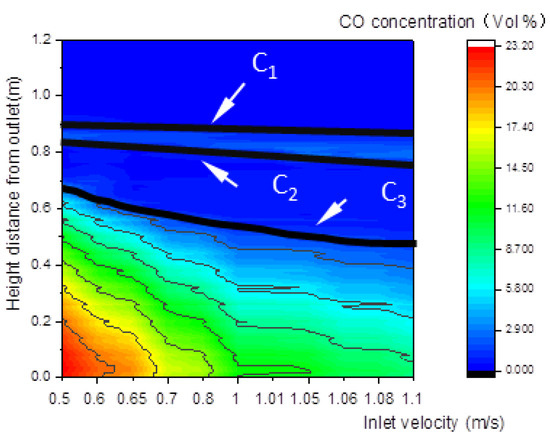
Figure 12.
Relationship between the inlet velocity and the CO concentration along the center line of the gasifier.
Figure 12 shows that the upper and lower boundary step points C3 of the reduction zone descend, which indicates that the whole reduction zone descends. This leads to the decline of H2, CO, and CH4 concentrations of gas at the outlet (Figure 13), and the decline of the calorific value of gas.
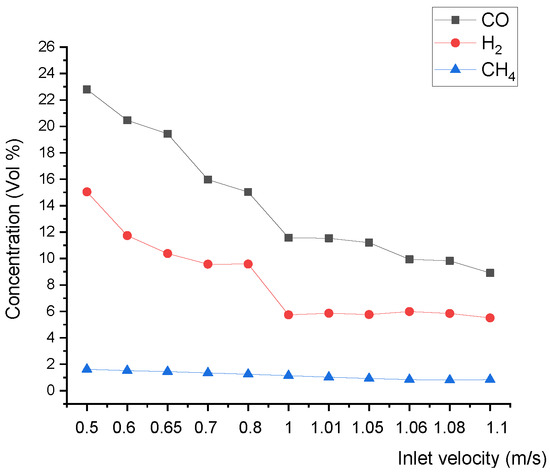
Figure 13.
Relationship between the inlet velocity and product gas species concentration at the outlet.
Figure 14 and Figure 15 show that, with the increase in ER, the pyrolysis zone area decreases while the oxidation zone area increases. This was because, at a given inlet velocity, the total amount of biomass participating in pyrolysis reactions and the particle surface area required for pyrolysis decreased as ER increased. Conversely, the total amount of oxygen participating in oxidation reactions increased as ER increased, and the volume required for oxidation reactions also increased, which further increased the oxidation zone area. In contrast, the reduction zone area decreased, as shown in Figure 16. With the increase in ER, the oxidation zone area increased while the reduction zone area decreased; meanwhile, H2, CO, and CH4 concentrations decreased, as shown in Figure 17. All these results indicate that it is combustion, instead of gasification, that is occurring inside the downdraft fixed-bed gasifier.
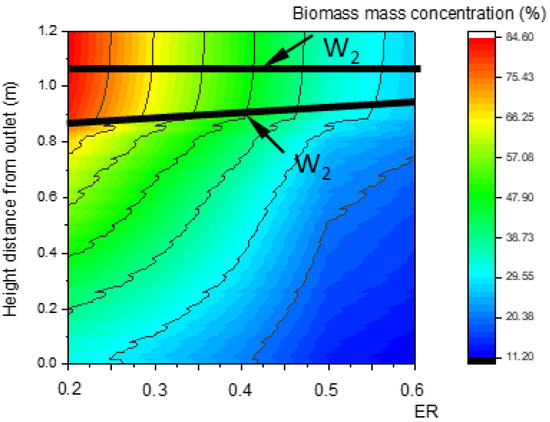
Figure 14.
Relationship between ER and the biomass concentration field along the center line.
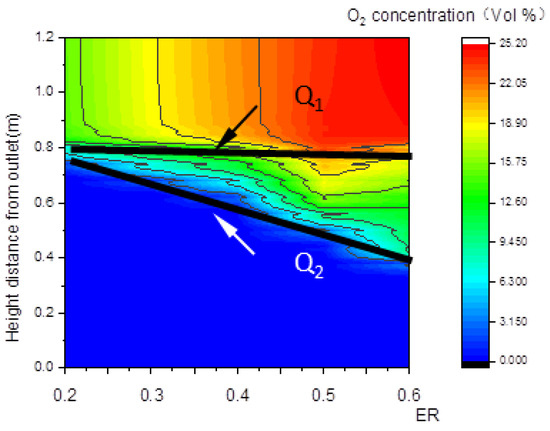
Figure 15.
Relationship between ER and the O2 concentration along the center line.
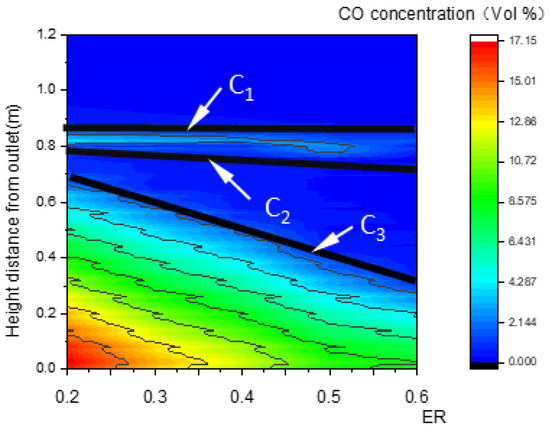
Figure 16.
Relationship between ER and the CO concentration field along the center line.
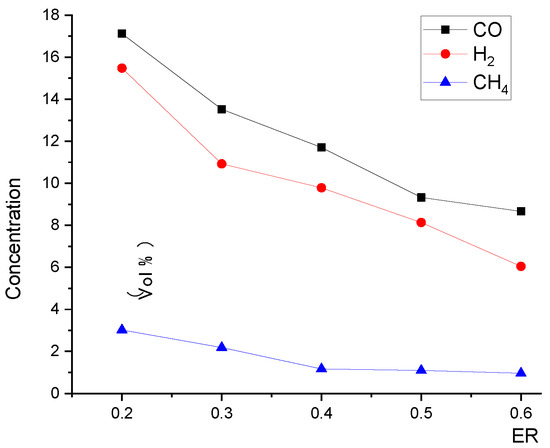
Figure 17.
Relationship between ER and product gas species concentration at the outlet.
3.3. Partition of Reaction Kinetic Rate Field
Under a holistic gasification model, reactions can occur at any height as long as reaction conditions are mature; the kinetic rate distributions zones of reactions R2, R4, and R5 along the center line of the gasifier exhibit evident partition characteristics, as shown in Figure 18. However, the kinetic rate distributions of reactions R1 and R3 have no boundary, but instead demonstrate step points r1-1, r1-2, and r3-1. As shown in Figure 18a, the zone between r1-1 and r1-2 is the R1 pyrolysis reaction zone, where the biomass concentration on the particle surface is high, and the required heat is supplied by oxidation reactions, which is favorable for the progress of the R1 reaction. Together with oxygen, the R1 reaction product C flows to particle surfaces and engages in heterogeneous reaction R2, which is controlled by the fluid-solid interfacial reaction method. The R1 and R2 reaction zones overlap with each other, and this is consistent with the conclusion drawn in Section 3.2. In the middle of the gasification reactor, CO and H2 see a gradual increase in concentrations, and engage in combustion reactions R4 and R5 with oxygen; R4 and R5 reaction zones have obvious upper and lower boundaries and step points r4-1, r4-2, r5-1, and r5-2, which form oxidation reaction zones. CO2, C, and heat are transferred to the bottom of the gasifier, which provides the conditions for reduction reaction R3. Thus, the upper boundary r3-1 of the R3 reaction zone and outlet boundary r3-2 form the reduction reaction zone.
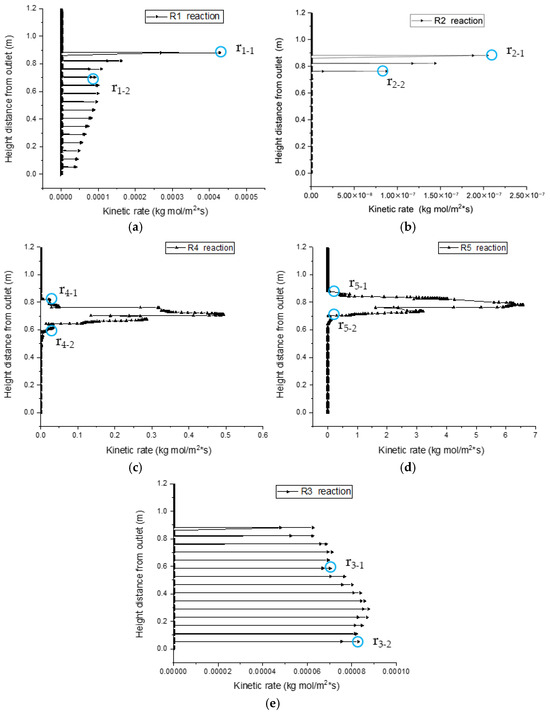
Figure 18.
Linear sweep of the reaction kinetic rate along the center line. (a) Linear sweep of R1 reaction kinetic rate along the center line. (b) Linear sweep of R2 reaction kinetic rate along the center line. (c) Linear sweep of R4 reaction kinetic rate along the center line. (d) Linear sweep of R5 reaction kinetic rate along the center line. (e) Linear sweep of R3 reaction kinetic rate along the center line.
Figure 19 shows changes in the kinetic rate distributions along the center line of the gasifier at various inlet velocities. There is no obvious change in the upper boundary step points of R1 or R2 heterogeneous reaction zones, but their lower boundaries descend steadily. In contrast, the upper and lower boundary step points of R4 and R5 descend with the increase in inlet velocity. With the increase in inlet velocity, the total amount of biomass and O2 increases, and heterogeneous reactions R1 and R2 require more particle surfaces. In contrast, homogeneous reactions R4 and R5 can occur during fluid flow, so the areas of R4 and R5 reaction zones remain unchanged. The upper boundary step points of the R3 reaction zone descend as the inlet velocity increases, which reduces the area of the R3 reaction zone.
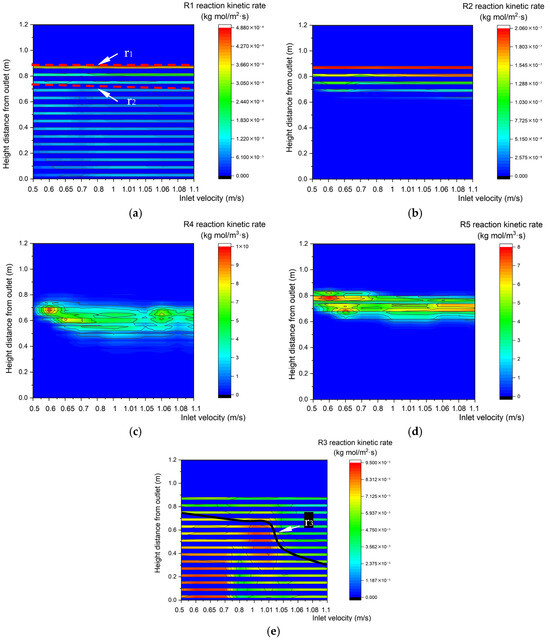
Figure 19.
Reaction kinetic rate fields with different inlet velocity. (a) Relationship between inlet velocity and the characteristics of the R1 reaction kinetic rate along the center line. (b) Relationship between inlet velocity and R2 reaction kinetic rate along the center line. (c) Relationship between inlet velocity and R4 reaction kinetic rate along the center line. (d) Relationship between inlet velocity and R5 reaction kinetic rate along the center line. (e) Relationship between inlet velocity and R3 reaction kinetic rate along the center line.
As shown in Figure 20a, due to the decrease in the biomass concentration, the upper boundary step points of the pyrolysis reaction zone descend with the increase in ER. In Figure 20b–d, oxidation reactions R2, R4, and R5 require a larger reaction area to consume increased oxygen, so the areas of the R2, R4, and R5 oxidation reaction zones all increase. As shown in Figure 20e, the area of the R3 reaction zone decreases with the increase in ER. In summary, the heat and mass transfer rates in the gasification reaction both increase with the increase in inlet velocity, which is accompanied by an increase in reaction rate. That is to say, the inlet velocity to some extent determines the gasification efficiency in fixed beds. In contrast, with the increase in ER, a larger proportion of C generated by pyrolysis is engaged in oxidation reaction rather than reduction reaction. Clearly, ER determines the main reaction in fixed beds.
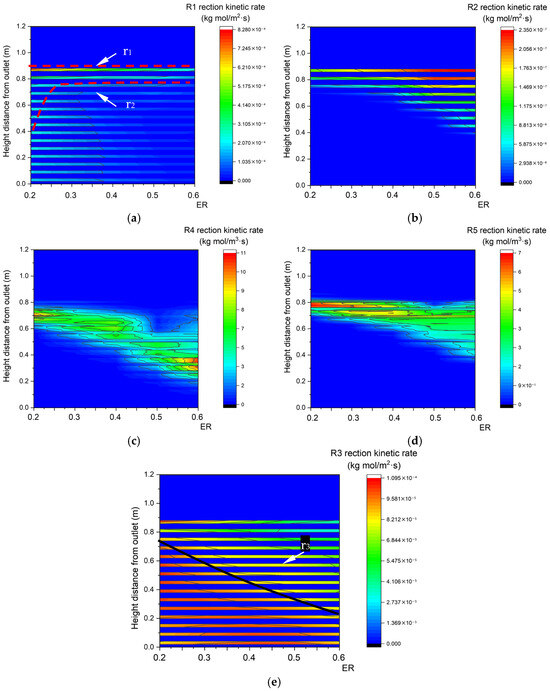
Figure 20.
Reaction kinetic rate fields with different ER. (a) Relationship between ER and R1 reaction kinetic rate along the center line. (b) Relationship between ER and R2 reaction kinetic rate along the center line. (c) Relationship between ER and R4 reaction kinetic rate along the center line. (d) Relationship between ER and R5 reaction kinetic rate along the center line. (e) Relationship between ER and R3 reaction kinetic rate along the center line.
3.4. Partition of the Temperature Field
In a real gasification process, temperature is an important basis for partitioning. Gasification experiences endothermic reaction (drying and pyrolysis), exothermic reaction (oxidation), and endothermic reaction (reduction) in sequence. Correspondingly, the temperature field shown in Figure 21 was separated into the temperature-rising zone, the high-temperature zone, and the temperature-dropping zone. The temperature-rising zone, where the temperature ranged from 100 to 800 °C, corresponded to a pyrolysis reaction zone. The high temperature zone, where the temperature ranged from 800 to 1400 °C, had upper and lower boundaries LT1 and LT2.
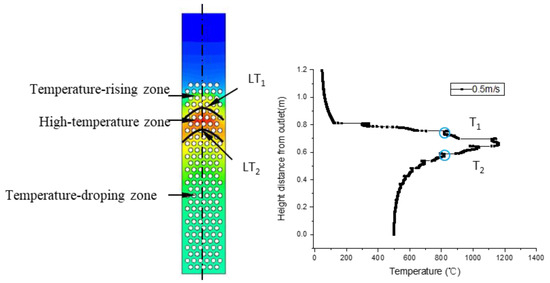
Figure 21.
Temperature field and temperature distributions along the center line.
As shown in Figure 22, the upper and lower boundary step points of the high-temperature zone descended with the increase in inlet velocity, resulting in a downward movement of the high-temperature zone. Meanwhile, due to the downward movement of the high-temperature zone, a large amount of heat was brought by gas to the reactor outlet, leading to a rise in outlet temperature, as shown in Figure 23.
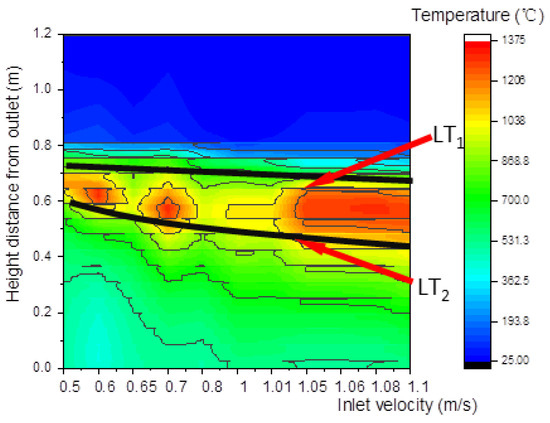
Figure 22.
Relationship between inlet velocity and temperature along the center line.
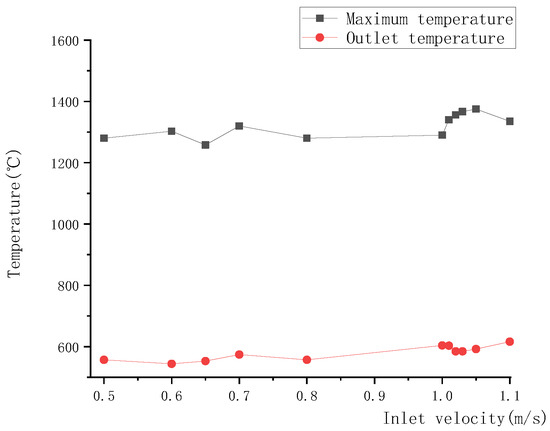
Figure 23.
Relationship between inlet velocity and outlet temperature, or maximum temperature.
In Figure 24, the area of the high-temperature zone obviously increased as ER increased, which could be explained by the increased area of the oxidation reaction zone. As a result showed in Figure 25, more heat was produced, and both the maximum temperature and outlet temperature rapidly rose.
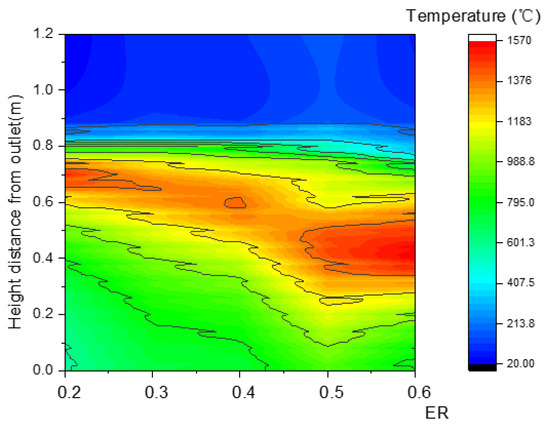
Figure 24.
Relationship between ER and temperature along the center line.
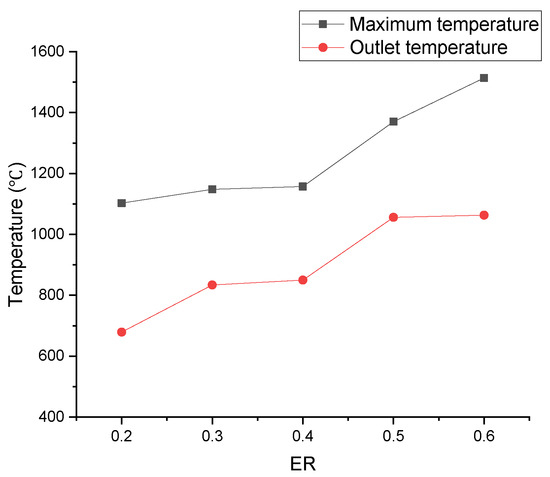
Figure 25.
Relationship between ER and outlet temperature, or maximum temperature.
3.5. Discussion
In essence, gasification is composed of a series of complicated chemical reactions. In an area where reactions with high reaction-dynamics velocity occur, there would inevitably be more products and heat, and the characteristics of the concentration field and temperature field would form in the gasification reactor due to diffusion and heat transfer. However, governed by the mass action law and the Arrhenius law, high concentration and high temperature further increased the reaction-dynamics velocity in this area, and this mutually restrictive relationship directly caused all three fields (i.e., gasification concentration, reaction-dynamics velocity, and temperature) to exhibit obvious partitions.
The boundary zone step points of the reaction kinetic rate, species concentration, and temperature distributions along the center line of the gasifier are shown in Figure 26.
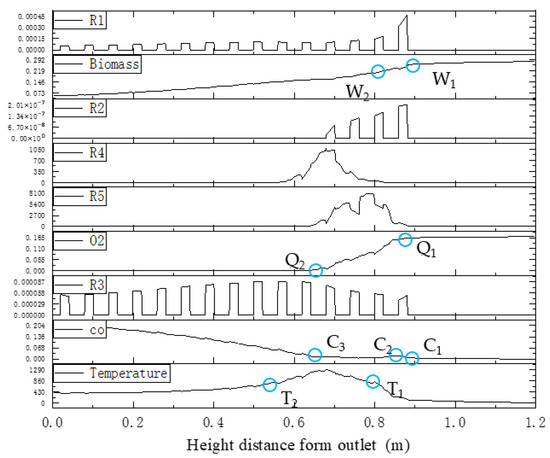
Figure 26.
Step points of reaction kinetic rate, species concentration, and temperature along the center line in the downdraft fixed-bed gasifier.
Pyrolysis reaction R1 determines the decrease in the biomass mass and step points W1 and W2. A rise in CO concentration between step points C1 and C2 is caused by reaction R2, which provides heat in the formation of the temperature-rising zone. Subsequently, CO, hydrogen, and oxygen in the fluid engage in oxidation reactions R4 and R5, which causes the decrease in CO concentration between C2 and C3 and the decline of oxygen concentration between Q1 and Q2. A high-temperature zone between T1 and T2 is created. After oxygen is exhausted, reduction reaction R3 becomes the main reaction in this zone, while the CO concentration increases between C3 and the outlet boundary, and the temperature-dropping zone is formed.
It is clear that the partition characteristics of the kinetic rate distributions are the root cause for zoning in fixed-bed gasification, which determines the partitioning of concentration and temperature fields. However, in real biomass gasification in a downdraft fixed bed, it is difficult to directly measure the kinetic rate. As shown in Figure 26, the measurable step points of CO concentration distributions inside the gasifier fit well with the partition characteristics of the kinetic rate distribution field.
4. Conclusions
A “fluid-solid interfacial reaction” method was proposed to simulate heterogeneous reactions inside a downdraft fixed-bed gasifier. The partitioning of the reaction-dynamics velocity field, species concentration field, and temperature field in the fixed-bed biomass gasification process were investigated. A simulation for a holistic gasification model with the heterogeneous reaction method of “hand in hand to surface” was used to determine differences between heterogeneous reactions and homogeneous reactions in terms of reaction site, reaction heat transfer mode, and reaction product diffusion mode. This method provides a way to simulate the partitioning of the gasification concentration field, reaction-dynamics velocity field, and temperature field in fixed beds.
The partition height, boundary, thickness, and other characteristics were defined using results from field analysis, and it was found that the reaction-dynamics velocity field, species concentration field, and temperature field could exhibit independent partitioning in the holistic model. The partition characteristics of reaction zones indicate that the spatial separation between heterogeneous and homogeneous reactions was the root cause for stratification in fixed-bed gasification. Partitioning of the reaction-dynamics velocity field determined the partitioning of the concentration and temperature fields, so the species concentration field showed obvious partition characteristics and a partition boundary. Meanwhile, the temperature field was divided into a heating zone, a high-temperature zone, and a cooling zone, but without clear boundaries. The influence of gasification parameters on partitioning was also investigated. The simulation results show that the inlet velocity caused the heights of various zones to move downward, while increasing ER changed the partition thickness. The inlet velocity determines the gasification efficiency of fixed beds to some extent, while ER determines the primary reaction and reaction mechanism in fixed beds.
The positions of the partition boundary nodes of the gasification concentration field, reaction-dynamics velocity field, and temperature field can be determined, and changes in the CO concentration indirectly reflect the reaction mechanism and stratification in fixed-bed gasifiers. For this reason, further exploring techniques and methods for measuring and evaluating CO concentration in gasification reactors will provide a theoretical foundation for actively intervening in fixed-bed gasification and innovating gasification technology.
Author Contributions
Conceptualization, L.T.; Software, Q.W.; Validation, Q.W. and H.M.; Formal analysis, H.M.; Investigation, H.M.; Resources, L.T.; Data curation, H.L.; Writing—original draft, L.T.; Visualization, H.L.; Project administration, L.T.; Funding acquisition, L.T., H.L. and H.M. All authors have read and agreed to the published version of the manuscript.
Funding
This work was supported by the National Natural Science Foundation of China (BK32401527).
Data Availability Statement
The original contributions presented in this study are included in the article. Further inquiries can be directed to the corresponding author.
Conflicts of Interest
Authors Qi Wang and Haiyan Li were employed by the AVIC Jincheng Group Co., Ltd. The remaining authors declare that the research was conducted in the absence of any commercial or financial relationships that could be construed as a potential conflict of interest.
References
- Adeoye, O.O.; Lora, E.E.S.; Andrade, R.V.; Pupo, L.P.; Jaén, R.L. Review of entrained flow co-gasification technology of biomass with different fuels. Fuel 2025, 404, 136420. [Google Scholar] [CrossRef]
- Trubetskaya, A. Reactivity effects of inorganic content in biomass gasification: A review. Energies 2022, 15, 3137. [Google Scholar] [CrossRef]
- Jayah, T.H.; Aye, L.; Fuller, R.J.; Stewart, D.F. Computer simulation of a downdraft wood gasifier for tea drying. Biomass Bioenergy 2003, 25, 459–469. [Google Scholar] [CrossRef]
- Ratnadhariya, J.K.; Channiwala, S.A. Three zone equilibrium and kinetic free modeling of biomass gasifier- novel approach. Renew. Energy 2009, 34, 1050–1058. [Google Scholar] [CrossRef]
- Biagini, E.; Barontini, F.; Tognotti, L. Development of a bi-equilibrium model for biomass gasification in a downdraft bed reactor. Bioresour. Technol. 2016, 201, 156–165. [Google Scholar] [CrossRef] [PubMed]
- Dejtrakulwong, C.; Patumsawad, S. Four Zones modeling of the downdraft biomass gasification process: Effects of moisture content and air to fuel ratio. Energy Procedia 2014, 52, 142–149. [Google Scholar] [CrossRef]
- Kumar, U.; Paul, M.C. Sensitivity analysis of homogeneous reactions for thermochemical conversion of biomass in a downdraft gasifier. Renew. Energy 2019, 151, 332–341. [Google Scholar] [CrossRef]
- Kumar, U.; Paul, M.C. CFD modeling of biomass gasification with a volatile break-up approach. Chem. Eng. Sci. 2019, 195, 413–422. [Google Scholar] [CrossRef]
- Kuo, P.C.; Wu, W.; Chen, W.H. Gasification performances of raw and torrefied biomass in a downdraft fixed bed gasifier using thermodynamic analysis. Fuel 2014, 117, 1231–1241. [Google Scholar] [CrossRef]
- Ramzan, N.; Ashraf, A.; Naveed, S.; Malik, A. Simulation of hybrid biomass gasification using Aspen plus: A comparative performance analysis for food, municipal solid and poultry waste. Biomass Bioenergy 2011, 35, 3962–3969. [Google Scholar] [CrossRef]
- Tinaut, F.V.; Melgar, A.; Pérez, J.F.; Horrillo, A.X. Effect of biomass particle size and air superficial velocity on the gasification process in a downdraft fixed bed gasifier. Fuel Process. Technol. 2011, 89, 1076–1089. [Google Scholar] [CrossRef]
- Blasi, C.D. Dynamic behavior of stratified downdraft gasifiers. Chem. Eng. Sci. 2000, 55, 2931–2944. [Google Scholar] [CrossRef]
- Chaurasia, A. Modeling of downdraft gasification process: Studies on particle geometries in thermally thick regime. Energy 2018, 142, 991–1009. [Google Scholar] [CrossRef]
- Chaurasia, A. Modeling of downdraft gasification process: Part I—Studies on shrinkage effect on tabular, cylindrical and spherical geometries. Energy 2019, 169, 130–141. [Google Scholar] [CrossRef]
- Luo, H.; Lin, W.G.; Song, W.L.; Li, S.G.; Dam-johansen, K.; Wu, H. Three dimensional full-loop CFD simulation of hydrodynamics in a pilot-scale dual fluidized bed system for biomass gasification. Fuel Process. Technol. 2019, 195, 106146. [Google Scholar] [CrossRef]
- Jeong, H.J.; Hwang, I.S.; Park, S.S.; Hwang, J. Investigation on co-gasification of coal and biomass in Shell gasifier by using a validated gasification model. Fuel 2017, 196, 371–377. [Google Scholar] [CrossRef]
- Cubero, A.; Sanchez-Insa, A.; Fueyo, N. The effect of particle polydispersion in a gasifier bed dynamics using Eulerian-Eulerian models. Fuel Process. Technol. 2020, 198, 106216. [Google Scholar] [CrossRef]
- Rogel, A.; Aguillon, J. The 2D Eulerian Approach of Entrained Flow and Temperature in a Biomass Stratified Downdraft Gasifier. Am. J. Appl. Sci. 2006, 3, 2068–2075. [Google Scholar] [CrossRef]
- Janajreh, I.; Shrah, M.A. Numerical and experimental investigation of downdraft gasification of wood chips. Energy Convers. Manag. 2013, 65, 783–792. [Google Scholar] [CrossRef]
- Yan, W.C.; Shen, Y.; You, S.; Sim, S.H.; Luo, Z.H.; Tong, Y.W.; Wang, C.H. Model-Based Downdraft Biomass Gasifier Operation and Design for Synthetic Gas Production. J. Clean. Prod. 2018, 178, 476–493. [Google Scholar] [CrossRef]
- Gonza’lez, A.W.; Juan, F.P.; Chapela, S.; Porteiro, J. Numerical analysis of wood biomass packing factor in a fixed-bed gasification process. Renew. Energy 2018, 121, 579–589. [Google Scholar] [CrossRef]
- Gonza’lez, A.W.; Pe’rez, J.F. CFD analysis and characterization of biochar produced via fixed-bed gasification of fallen leaf pellets. Energy 2019, 186, 115904. [Google Scholar] [CrossRef]
- Gomez, M.A.; Porteiro, J.; Patino, D.; Miguez, J.L. CFD modelling of thermal conversion and packed bed compaction in biomass combustion. Fuel 2014, 117, 716–732. [Google Scholar] [CrossRef]
- Yan, G.H.; Jiang, J.G.; Xu, M.; Sun, F.H.; Sun, R.F. Dynamic model of reaction process in partial oxidation area in biomass gasification. J. Combust. Sci. Technol. 2013, 19, 73–78. [Google Scholar]
- Simone, M.; Nicolella, C.; Tognotti, L. Numerical and experimental investigation of downdraft gasification of woody residues. Bioresour. Technol. 2013, 133, 92–101. [Google Scholar] [CrossRef]
- Barman, N.S.; Ghosh, S.; De, S. Gasification of biomass in a fixed bed downdraft gasifier—A realistic model including tar. Bioresour. Technol. 2012, 107, 505–511. [Google Scholar] [CrossRef]
- Gerun, L.; Paraschiv, M.; Vijeu, R.; Bellettre, J.; Tazerout, M.; Gobel, B.; Henriksen, U. Numerical investigation of the partial oxidation in a two-stage downdraft gasifier. Fuel 2008, 87, 1383–1393. [Google Scholar] [CrossRef]


Disclaimer/Publisher’s Note: The statements, opinions and data contained in all publications are solely those of the individual author(s) and contributor(s) and not of MDPI and/or the editor(s). MDPI and/or the editor(s) disclaim responsibility for any injury to people or property resulting from any ideas, methods, instructions or products referred to in the content. |
© 2026 by the authors. Licensee MDPI, Basel, Switzerland. This article is an open access article distributed under the terms and conditions of the Creative Commons Attribution (CC BY) license.