Article

Influence of Local Microclimate Conditions on Indoor Thermal Comfort: The Example of Historical Urban Structure Located in the Central Part of Lodz (Poland)


by
Anna Dominika Bochenek
1,*,
Katarzyna Klemm
1 and
Konrad Witczak
2
1
Institute of Environmental Engineering and Building Installations, Faculty of Civil Engineering, Architecture and Environmental Engineering, Lodz University of Technology, 90-924 Lodz, Poland
2
Department of Building Materials Physics and Sustainable Design, Faculty of Civil Engineering, Architecture and Environmental Engineering, Lodz University of Technology, 90-924 Lodz, Poland
*
Author to whom correspondence should be addressed.
Energies 2026, 19(3), 662; https://doi.org/10.3390/en19030662
Submission received: 1 October 2025 / Revised: 18 December 2025 / Accepted: 15 January 2026 / Published: 27 January 2026

Abstract

Progressive climate change and building morphology influence the specific microclimate of built-up areas. This has a fundamental role in research on energy use and thermal comfort inside buildings. Most studies using data for dynamic energy simulation are based on information collected at meteorological stations in rural areas. This can lead to erroneous predictions. The main goal of the study was to combine two simulation tools—ENVI-met for microclimate predictions around historical building layouts, and DesignBuilder for assessing indoor comfort. Illustrating the impact of input data on simulation results was conducted using three types of weather data: (1) from a field campaign, (2) from a suburban station, and (3) from the typical meteorological year. The obtained results confirm that the highest precision was achieved in analyses where information obtained at a real scale in the city centre was used as boundary conditions (field measurements: MAPE = 0.6 °C, RMSE = 0.7 °C). The next step was to estimate the thermal sensations inside the living room of the existing residential building. Thermal comfort was determined using the operative temperature as an indicator. Incorporating realistic urban weather inputs enhanced the reliability of indoor comfort modelling and provided a more accurate basis for planning thermal resilience in historic residential buildings.

1. Introduction

European Union countries are involved in leading efforts to develop a sustainable, secure, and low-carbon energy system. A set of policy initiatives, called the European Green Deal, was announced in September 2020 [1]. It aims to reduce greenhouse gas emissions by at least 40% by 2030 (compared to 1990) [2]. Research conducted by Gasparotti (2024) showed that already in 2021, the reduction was at the level of 30% in the European Union [3]. Nevertheless, urban agglomerations are considered the main emitters of global carbon emissions (over 70%) [4]. According to Liu et al. (2025), it is the spatial arrangement of cities, which is difficult to modify, that has a huge impact on energy efficiency [5]. The main factor is the compactness of the urban form [6]. The key issue is to improve the energy efficiency of buildings, especially with regard to historic buildings located in inner cities [7]. These buildings, often under conservation protection, do not meet modern standards of energy efficiency and thermal comfort [8]. They are considered to be the most sensitive to changes in external weather conditions [9,10].
For more than a decade, there has been a proposal to improve the energy efficiency of existing buildings, including cultural heritage sites in Poland. The provisions are included in the Directive (EU) 2018/844 of the European Parliament and of the Council of 30 May 2018 amending Directive 2010/31/EU on the energy performance of buildings and Directive 2012/27/EU on energy efficiency (Text with EEA relevance) (2018) [11]. Activities will cover both the transformation of building structures [12,13] and the implementation of active [14] and passive technical systems [15]. In addition, the above-mentioned directives draw attention to the shaping of microclimatic parameters in the rooms [16]. Increasing the quality of the indoor environment is supposed to translate into improvement in, among other things, the thermal comfort of users [17,18,19].
Progressive climate change is being particularly acutely felt in urban areas. Most cities are experiencing the characteristic urban heat island phenomenon, which is defined as the difference in temperature between downtown areas and areas surrounding the city. It is noticeable in settlement units with more than 5000 inhabitants [20]. Due to the scale of occurrence, it is one of the most frequently addressed issues in the scientific sphere. Research on UHI has been conducted extensively in Europe [21], Asia [22], North America [23], South America [24], and Africa [25]. According to Harmay et al. (2021) [26], the intensity of the Urban Heat Island phenomenon is closely related to spatial development. The centre-periphery temperature difference can vary from 1 to 2 °C during the daytime, and 3–6 °C during the nighttime. According to Radoux et al. (2025) [27], the temperature difference can reach 6–10 °C. In extreme cases, it can reach 12 °C (Poland, Czech Republic, India) [28,29,30]. Undoubtedly, the phenomenon leads to deterioration in the quality of urban conditions. It contributes significantly to an increase in the number of hot days and an increase in heat waves. It causes a weakening of air flow, as well as an increase in pollution levels [31]. It directly affects the prevailing microclimatic conditions and human thermal comfort. It translates into economic issues related to expanded energy costs and extra cooling consumption [32]. As a result, heat-stress-associated mortality and illnesses impair public health [33].
City centres often constitute their historic core, with buildings that do not meet modern thermal standards. In addition to residential buildings, public spaces such as squares and pedestrian zones are a key element. Compact, historic buildings, often devoid of large green areas, contribute to the creation of specific microclimate conditions that affect both the users of the space and the residents themselves. Rising air temperatures, especially in summer, prolonged heatwaves, and impaired air exchange significantly contribute to a deterioration in human thermal comfort. Historical buildings located in city centres often do not meet modern requirements for thermal insulation. In the context of the increase in air temperature associated with the impact of the urban heat island, this may lead to a deterioration of indoor thermal comfort.
Analyses of microclimate conditions in urban environments are usually carried out on a natural scale [34] or using numerical simulations [35]. A commonly used tool is Envi-met, a three-dimensional (3D) numerical model initially developed by Bruse and Fleer (1998) [36]. This model has been validated by many authors [37] for different climatic zones, cities, and urban forms.
In the field of urban climatology, it is common practice to use information from meteorological stations as input data in simulation studies. Usually, they are located in suburban areas, sometimes a dozen or so kilometres away from the study area. Such an approach is undoubtedly advantageous due to the ease of data acquisition, but it is burdened with some errors. It does not take into account the complex relations between the structure of buildings and microclimate. Another solution used especially in building energy analyses is the typical meteorological year. Typical meteorological years represent the average microclimatic conditions prevailing in the considered geographical area. They are developed on the basis of long-term measurement data, which are most often obtained from suburban meteorological stations.
In the presented research, in order to make the assumed initial conditions correspond with the real context, in situ measurements have been conducted. The obtained data on basic microclimate parameters, such as temperature, humidity, and airflow velocity, were used as input data for the simulation. However, to illustrate the significance of the assumed initial conditions, additional simulations based on TMY were performed.
One of the meteorological parameters that significantly influences cooling/heating energy consumption is temperature (UHI). There are many papers that address this issue [38]. Some of them also analyze the impact on indoor human comfort [39].
This research is intended to address the following specific objectives by taking the historical urban structure of Lodz as a case study:
  • Coupling of simulation tools—ENVI-met for assessing the microclimate in the building environment and DesignBuilder for indoor thermal comfort.
  • The impact of three types of input weather data on the results of numerical simulations was assessed for a typical structure of historical buildings in the centre of Lodz. This made it possible to reflect the microclimate parameters in the immediate vicinity of the analyzed buildings.
The analysis of microclimatic conditions and their impact on thermal comfort in residential tenement buildings located within dense urban fabric is relevant not only from the perspective of indoor environmental quality, but also in terms of energy efficiency. The local microclimate—shaped by phenomena such as the urban heat island, limited air exchange within street canyons, or the thermal mass of surrounding buildings—directly affects the outdoor air temperature and thus the heating and cooling demand of such dwellings. Tenement buildings, often characterized by heterogeneous construction and insufficient thermal insulation, tend to be particularly sensitive to fluctuations in external conditions. Therefore, microclimate assessments conducted in the immediate vicinity of the building form an essential component of a broader energy-efficiency evaluation and support informed planning of refurbishment measures, optimization of energy use, and the development of climate-adaptation strategies. Integrating thermal comfort analysis with an energy-efficiency perspective ensures that the obtained results can be directly applied in engineering practice as well as in the shaping of local energy and urban policies.

2. Materials and Methods

2.1. The Measurement Campaign in the Typical Street Canyon in Lodz

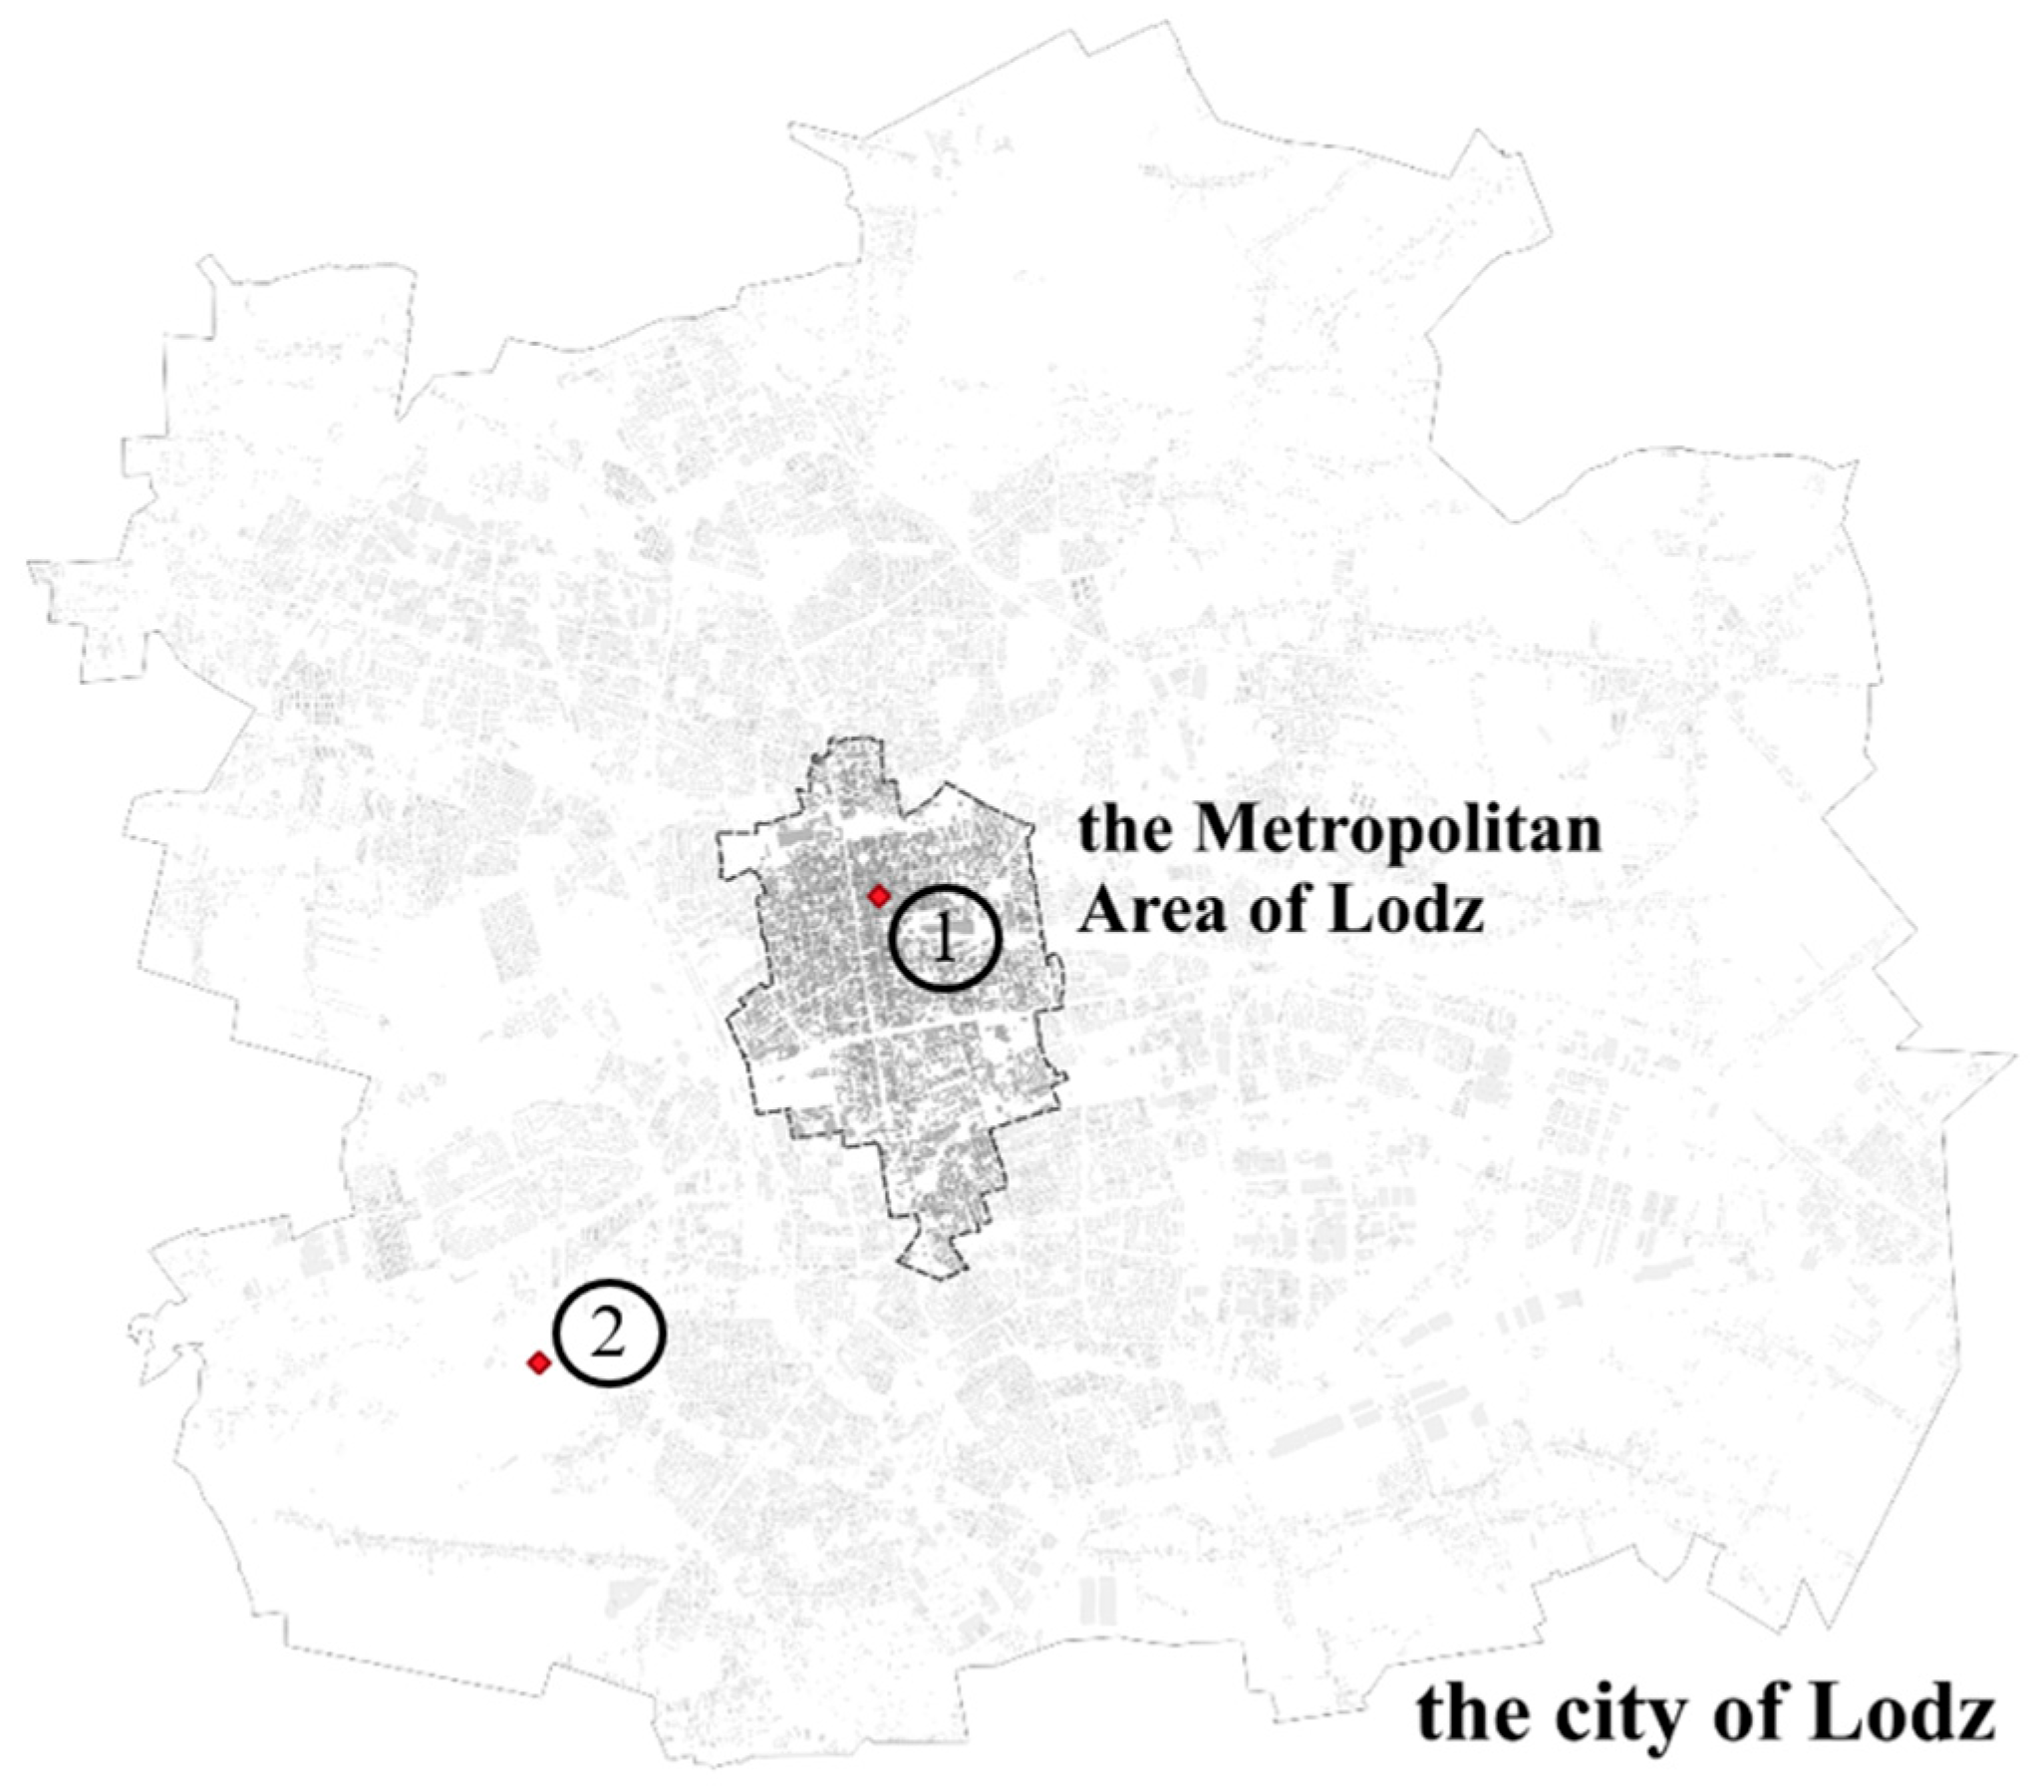
Lodz is the fourth largest city in the country in terms of population. Located in central Poland, 30 km south of the geometric centre, it has, for example, key communication significance (19°28′ E longitude, 51°45′ N latitude). The city’s core is a compact historical structure of 19th-century buildings, complete with exceptional Art Nouveau tenement houses. Consequently, current architectural and urban planning efforts are focused on the regeneration of historic districts (Figure 1).
As mentioned at the beginning, the study is a continuation of research on the typical spatial structure of Lodz. In this study, the research was carried out within a typical urban form—a street canyon, which is a basic element of the historical urban grid [40,41]. The typical form of a street canyon was determined through analyses of the building structure in the most urbanized part of the city—the so-called Metropolitan Area. Information obtained from the Voivodeship and Municipal Conservators of Monuments, as well as the Lodz Geodetic Centre, was used for this purpose. Data on the height of buildings, geometric parameters of buildings, dimensions of passageways, and reference areas (data for 13,315 buildings and 10,050 cadastral plots) were processed. As a result, the dimensions of a typical street canyon were determined. In-depth studies of the material characteristics of buildings were also conducted (based on information from the Municipal/Voivodeship Conservators of Monuments) [42,43].
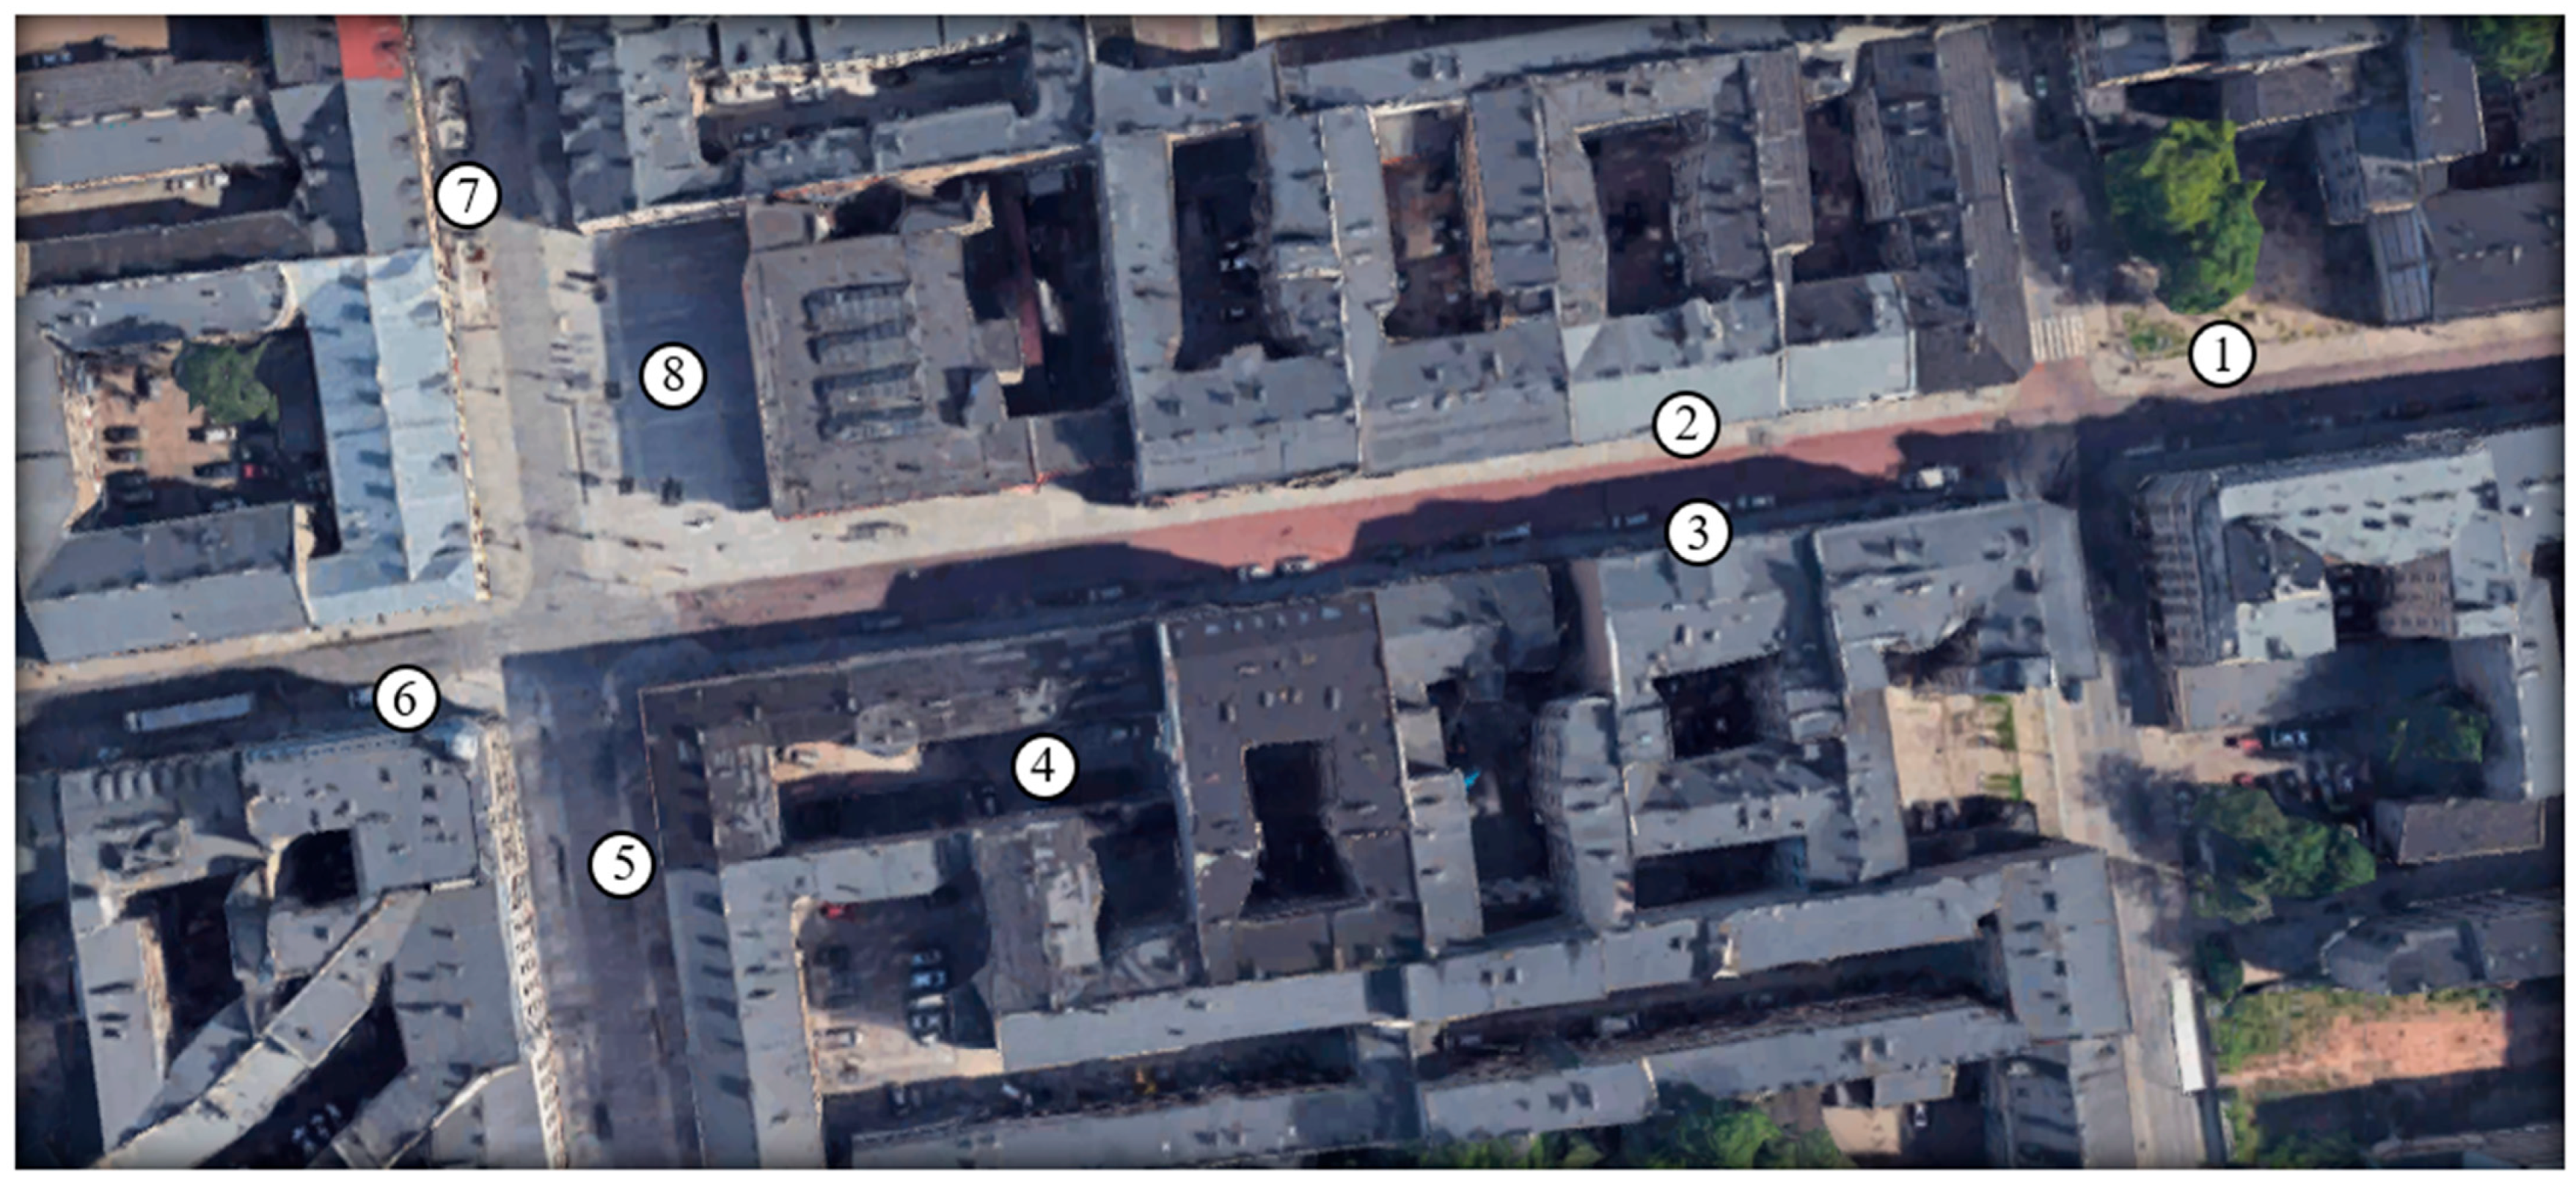
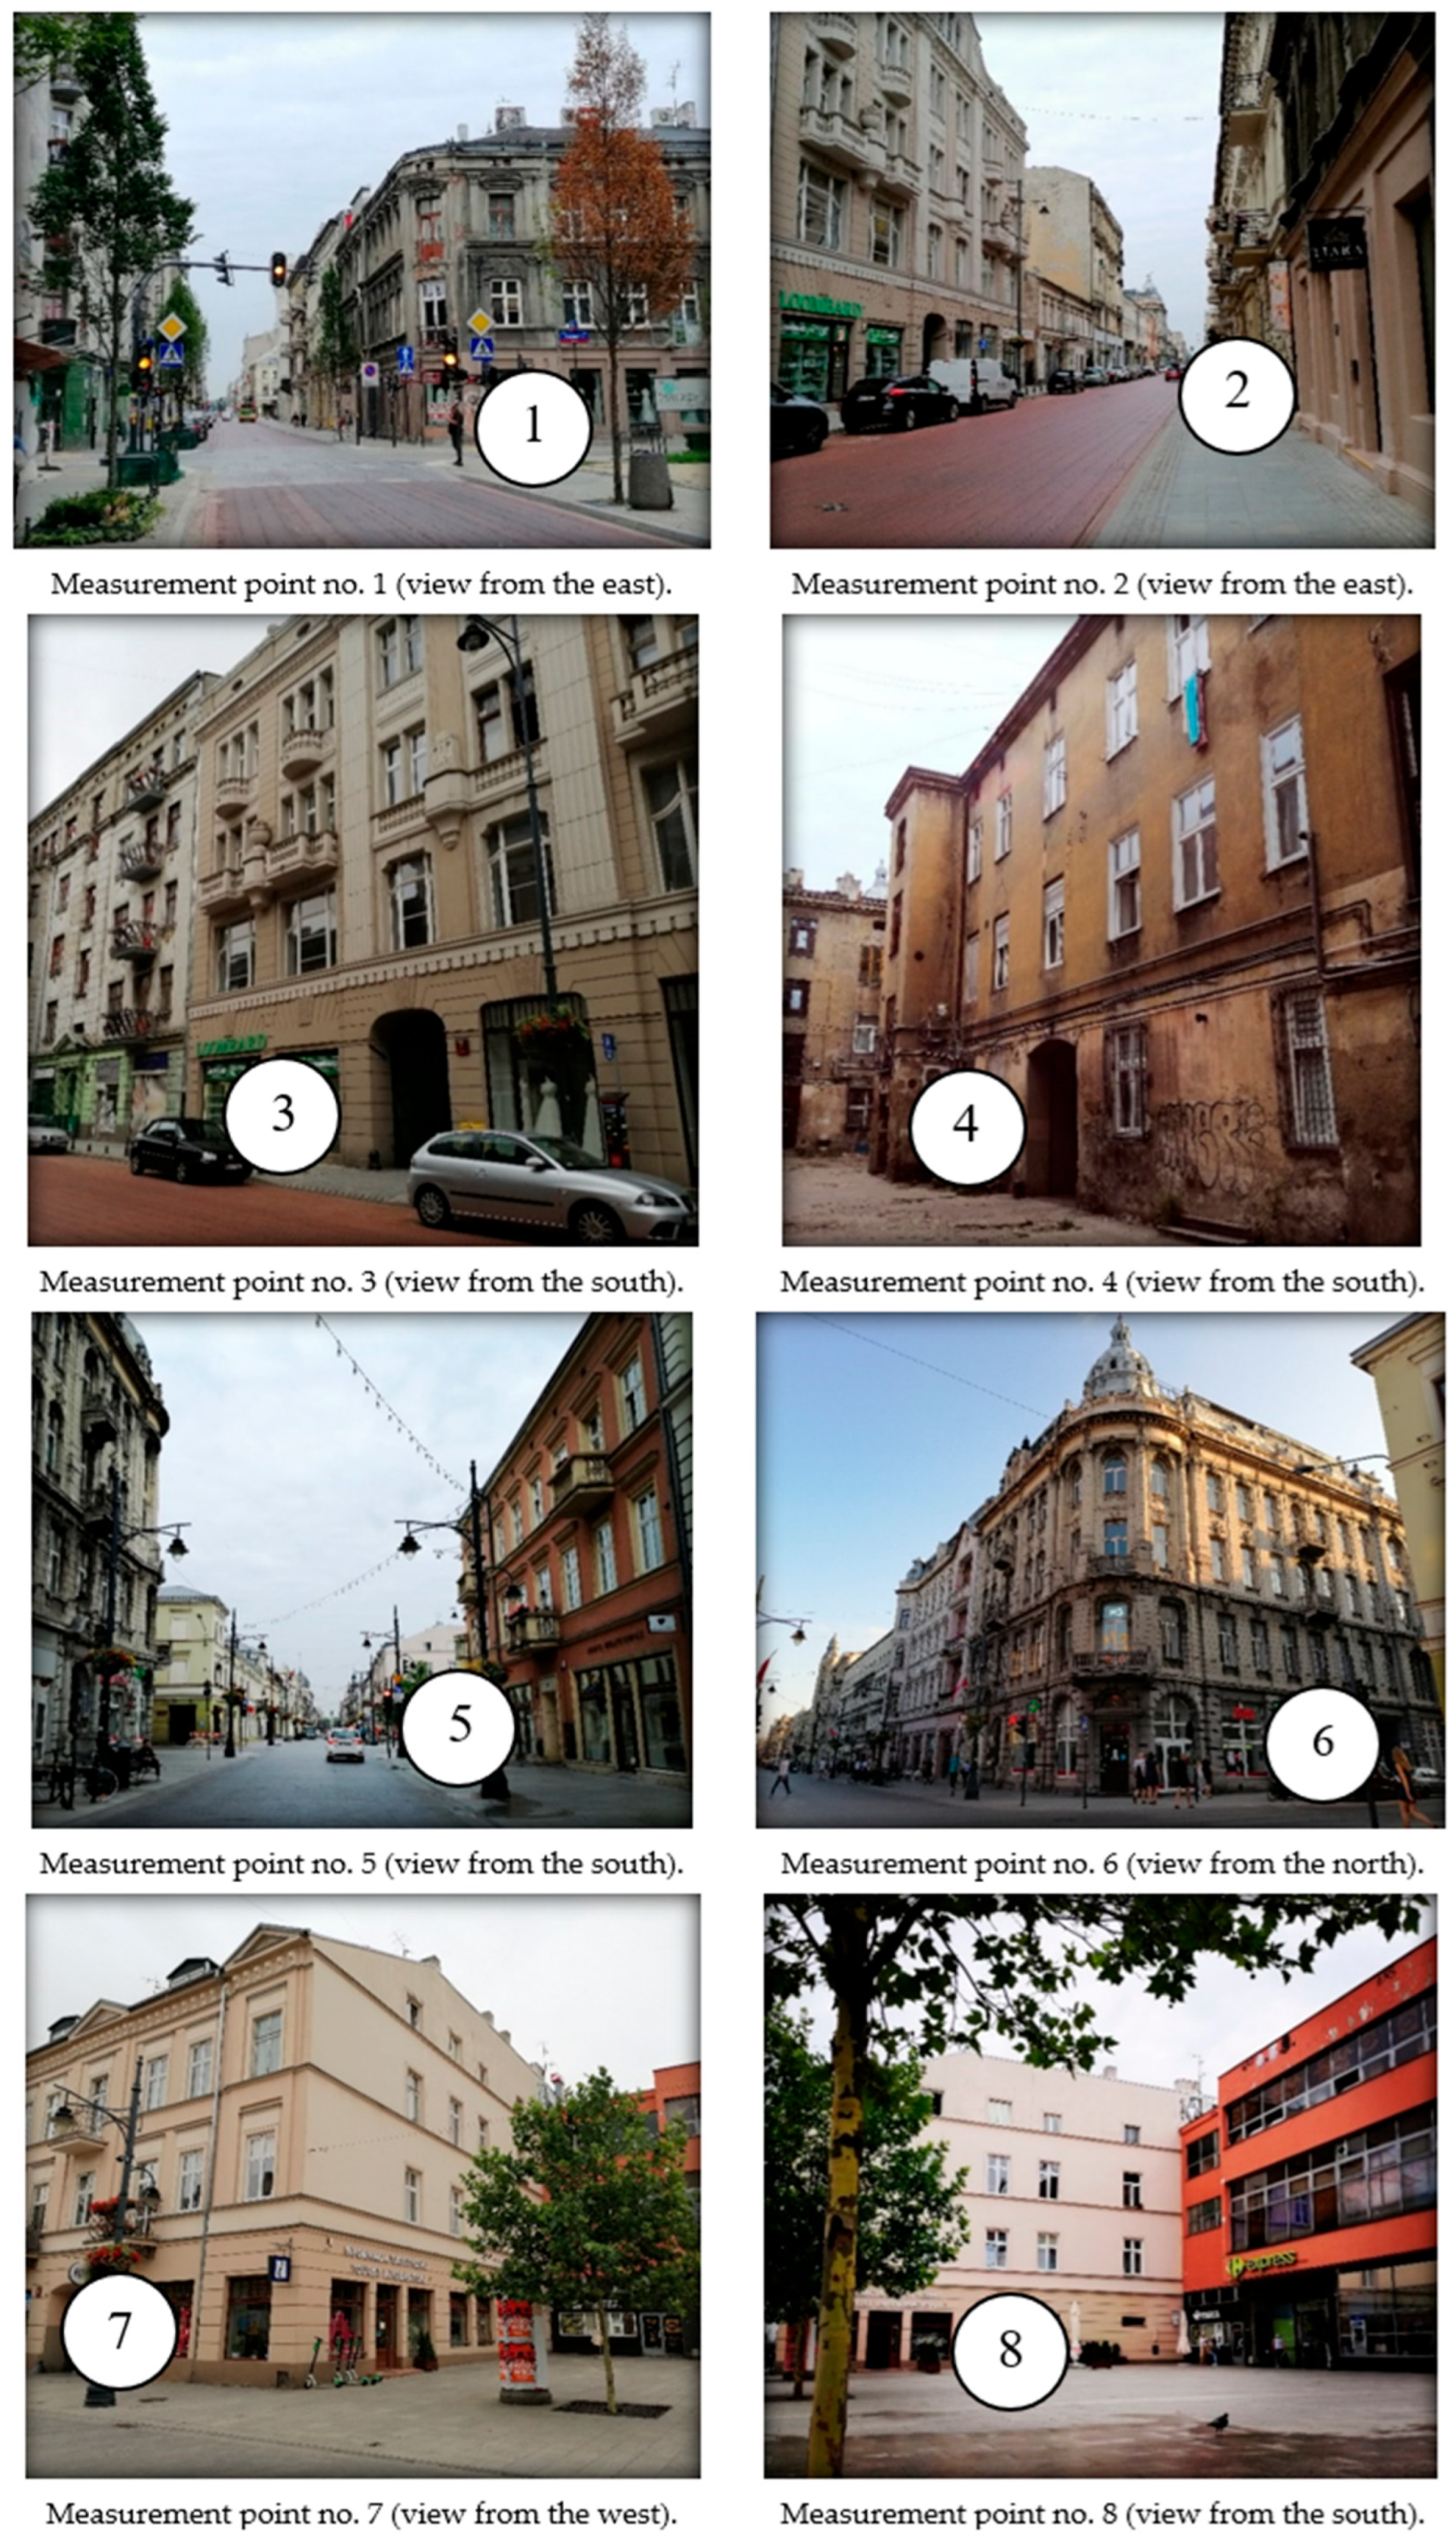
The study area was selected. A typical street canyon was identified as a communication zone (a section of the street and its immediate surroundings). Within this area, a series of measurements of basic meteorological parameters (outdoor air temperature, humidity, wind velocity) was taken to determine the microclimate prevailing in the Metropolitan Area. The campaign took place on 6 July 2021. It included measurements performed at eight points using mobile devices—Testo 410-2 (Testo SE & Co. KGaA, Warsaw, Poland, Table A1, Figure 2 and Figure 3).
The measurement points were selected in such a way that the information could be used to validate the numerical model in a later phase of the study.
  • 1st measurement point—located in the north-eastern part of the intersection. Dense tenement houses were located in the immediate vicinity, provided that the buildings were situated at a considerable distance from the measurement point in the north. The lack of a corner building in the north-eastern section resulted in an undeveloped area covered with high vegetation.
  • 2nd measurement point—located at the northern frontage of the canyon, by the gate passage of a tenement house. In the vicinity, a medium–high (3–4 storey) tenement house was built. From the south, there was a traffic route (used for public and individual transport).
  • 3rd measurement point—located at the southern frontage of the canyon, in the immediate vicinity of the 4-storey buildings, by the gate passage of a tenement house. From the north, it is adjacent to the traffic route designed for public and individual transport.
  • 4th measurement point—located in the city’s forecourt enclosed on four sides by tenement houses, at a short distance from the front building, at the gated passage. It was surrounded by medium–high buildings.
  • 5th measurement point—located in the southeast corner of the intersection of Jaracza/Piotrkowska Streets, at the frontage formed by 3-storey tenement buildings.
  • 6th measurement point—located at the northern facade of a four-storey corner tenement house, by a gate passage. On the north side, there was a traffic route for passenger and individual vehicles.
  • 7th measurement point—located a short distance from the corner of a three-storey building (Piotrkowska 28 Street). From the west, there was a traffic lane, which can be considered a traffic-calmed zone (possibility of entry for residents, as well as targeted entry).
  • 8th measurement point—located in the square created by withdrawing the corner of the building at the intersection of Jaracza/Piotrkowska Streets, at a considerable distance from the buildings, surrounded by planted trees forming an avenue along the transport route (Piotrkowska Street).
Measurements were conducted around the clock (from 0:00 to 11:00 p.m., 6 July 2021). They were carried out in the pedestrian traffic zone (h = 1.5 m) and included meteorological parameters such as air temperature and relative humidity. The results are presented in Table A2.
In the further part of the work, the data obtained from field tests were used to validate the numerical simulations. The next step was to numerically simulate the microclimate conditions for a typical street canyon, for which the measurement campaign was conducted.

2.2. The Numerical Simulation Based on Real Measurement Data

The research was conducted using ENVI-met (ver. 4.4.5.), one of the most popular numerical simulation software used for proper microclimatic and thermal comfort analysis in urbanized terrain. This CFD (Computational Fluid Dynamics) application takes into account airflow between buildings, heat exchange processes between horizontal and vertical surfaces, turbulence, vegetation parameters, and pollutant dispersion.
ENVI-met uses the Arakawa C orthogonal grid to create outdoor environments. Consequently, it allows for the creation of only straight and rectangular structures. As a result, any curves in walls and roofs must be approximated and aligned with the grid points. Accurate ground slope and exposure are taken into account in energy balances. Furthermore, ENVI-met utilizes the finite difference method, and the atmospheric advection and diffusion equations are implemented to allow the program to use relatively large time steps, optimizing system requirements and enabling calculations to be performed on any computer.
Depending on the turbulence models, modelling precision, and meteorological parameters used, it can generate varying results. The current state of research indicates that the software is still insufficiently verified. Therefore, it requires full validation and verification (comparative in situ testing).
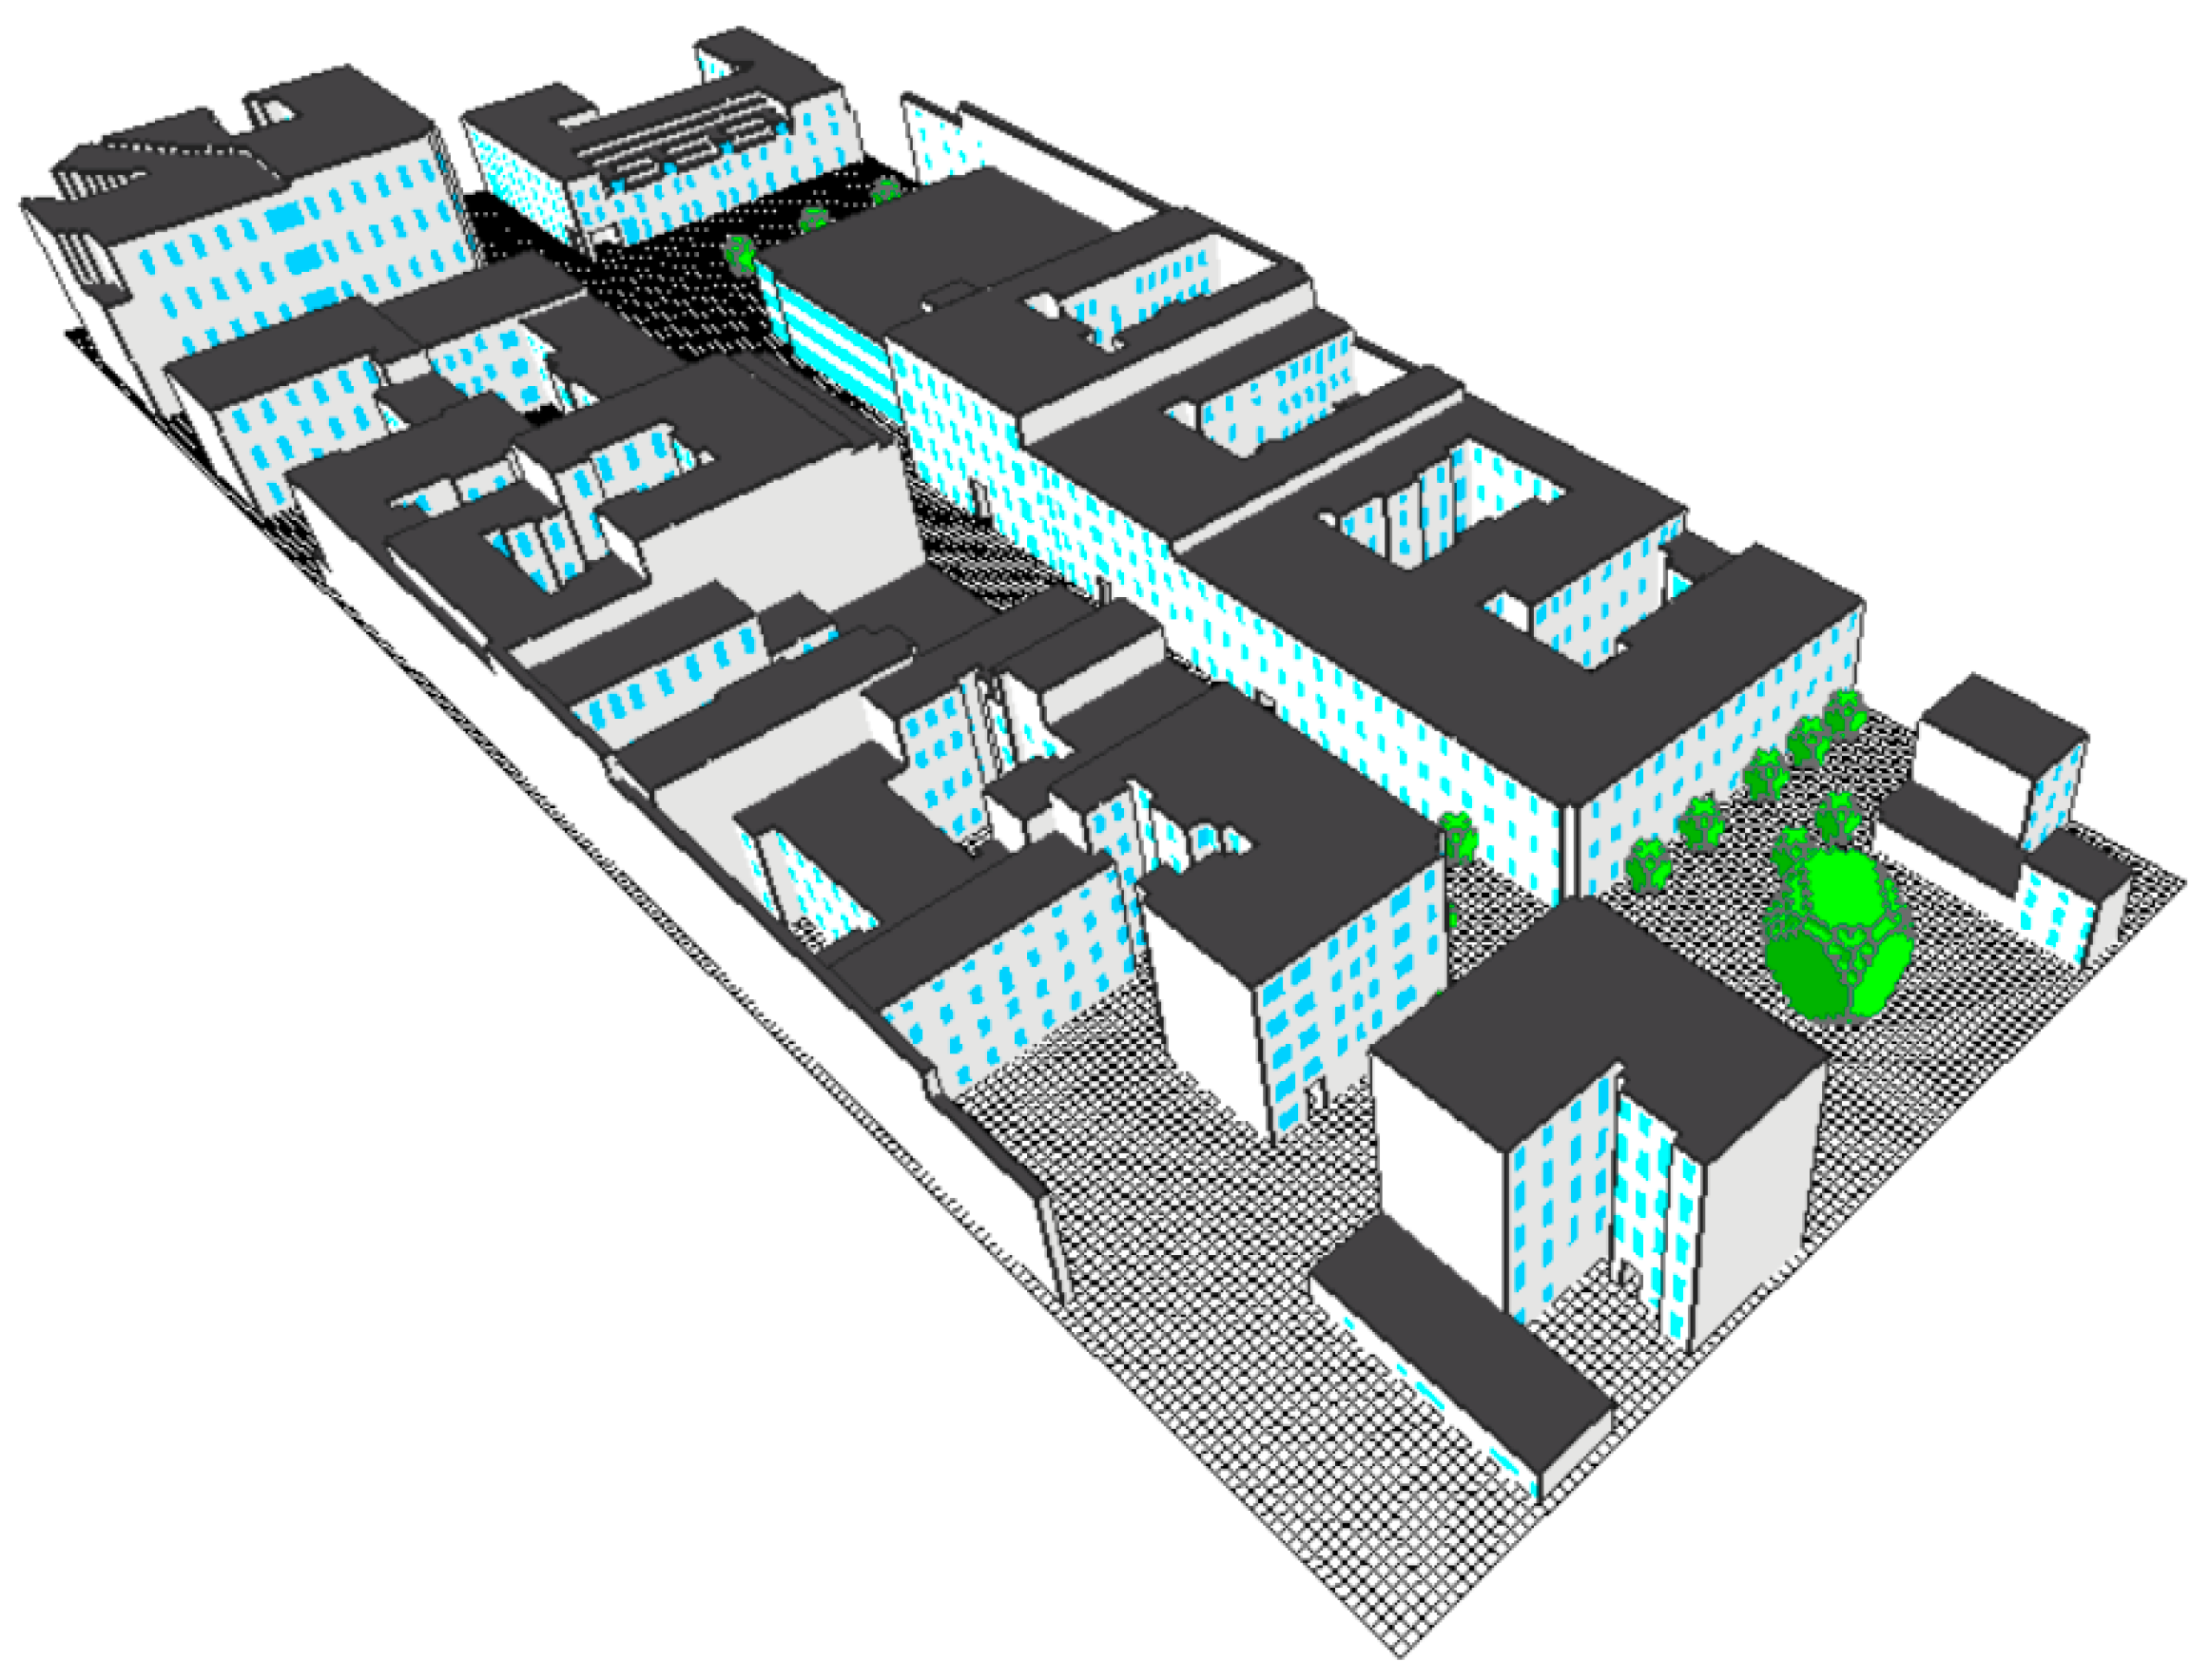
For verification purposes, a three-dimensional model of the selected canyon was made. The ENVI-met application database was supplemented with the materials characteristic of the Metropolitan Area of Lodz. They were used in the process of defining the canyon floor surface, creating building structures, and introducing natural environment components (planting trees). The model had dimensions of 262 × 105 × 30 grids. The resolution of a single model cell was 1 × 1 × 1 m. A vertical grid was used—an equidistant grid —composed of elements of constant height. The exceptions were five cells near the ground, whose vertical dimension was 20% of the model’s reference height. This was a relatively large area that included not only the street canyon but also the immediate surrounding area. This type of procedure was intentional in order to obtain the closest image of reality as possible. The Metropolitan Area was used as the model location based on the geographic coordinates of this area. A rotation of 9° from the north direction was introduced to match the canyon with the grid structure of the 3D domain. The model parameters are shown in Figure 4 and Table 1.
The program settings required entering the hourly values of air temperature, as well as relative humidity, which were measured at point no. (1). Such an action resulted from the analysis of meteorological conditions for the city. It was established that on that day, the air inflow from the eastern sector dominated. However, it was necessary to define other parameters. The ENVI-met program automatically determines the hourly irradiance for the area, which is based on geographical coordinates. Nonetheless, according to many studies [44,45], it is allowed to make corrections to the values. By comparing the weather data from the weather station with the information in the ENVI-met program, it was possible to determine the adjustment factor (Figure 4). Then, the average value of 24 h airflow at a height of 10 m above ground level had to be entered. The measurements conducted in the field consisted of readings of instantaneous parameters prevailing in public spaces (Testo 410-2 measuring instrument); therefore, the airflow data could not be used in the simulation process. In order to assess the airflow in the inner-city area, the method described in Bochenek and Klemm (2020) [42] was used (modified logarithmic equation and Simiu dependency) [46,47].
Then, a numerical simulation of the meteorological conditions prevailing in the street canyon on 6 July 2021 was performed.

2.3. Comparison Analysis

Liu et al. (2021) [48] proposed a test method based on numerical fluid mechanics tools, including ENVI-met. The authors paid special attention to validate the models with at least two measuring instruments. This is due to discrepancies in the accuracy of simulation forecasts. Therefore, the consistency of simulation results with reference values was determined by mean absolute percentage error (MAPE) (Equation (1)). It is indicated in the studies that MAPE underestimates the measurement error, and therefore, a second measure of RMSE (Equation (2)) was chosen to verify the calculations. In addition, RMSE is used in numerous studies; it is possible to compare the obtained forecasts for the temperate climate zone (Lodz) with data published as part of scientific work carried out by researchers in other climate zones [48,49,50].
M A P E = 100 n i = 1 n y i y ^ i y i ,
where n—number of measurements, y i —reference value, y ^ i —simulation output value.
R M S E = 1 n i = 1 n y i y ^ i 2 ,
where n—number of measurements, y i —reference value, y ^ i —simulation output value.

3. Results

3.1. Validation of the Numerical Model (Real Measurement Data)

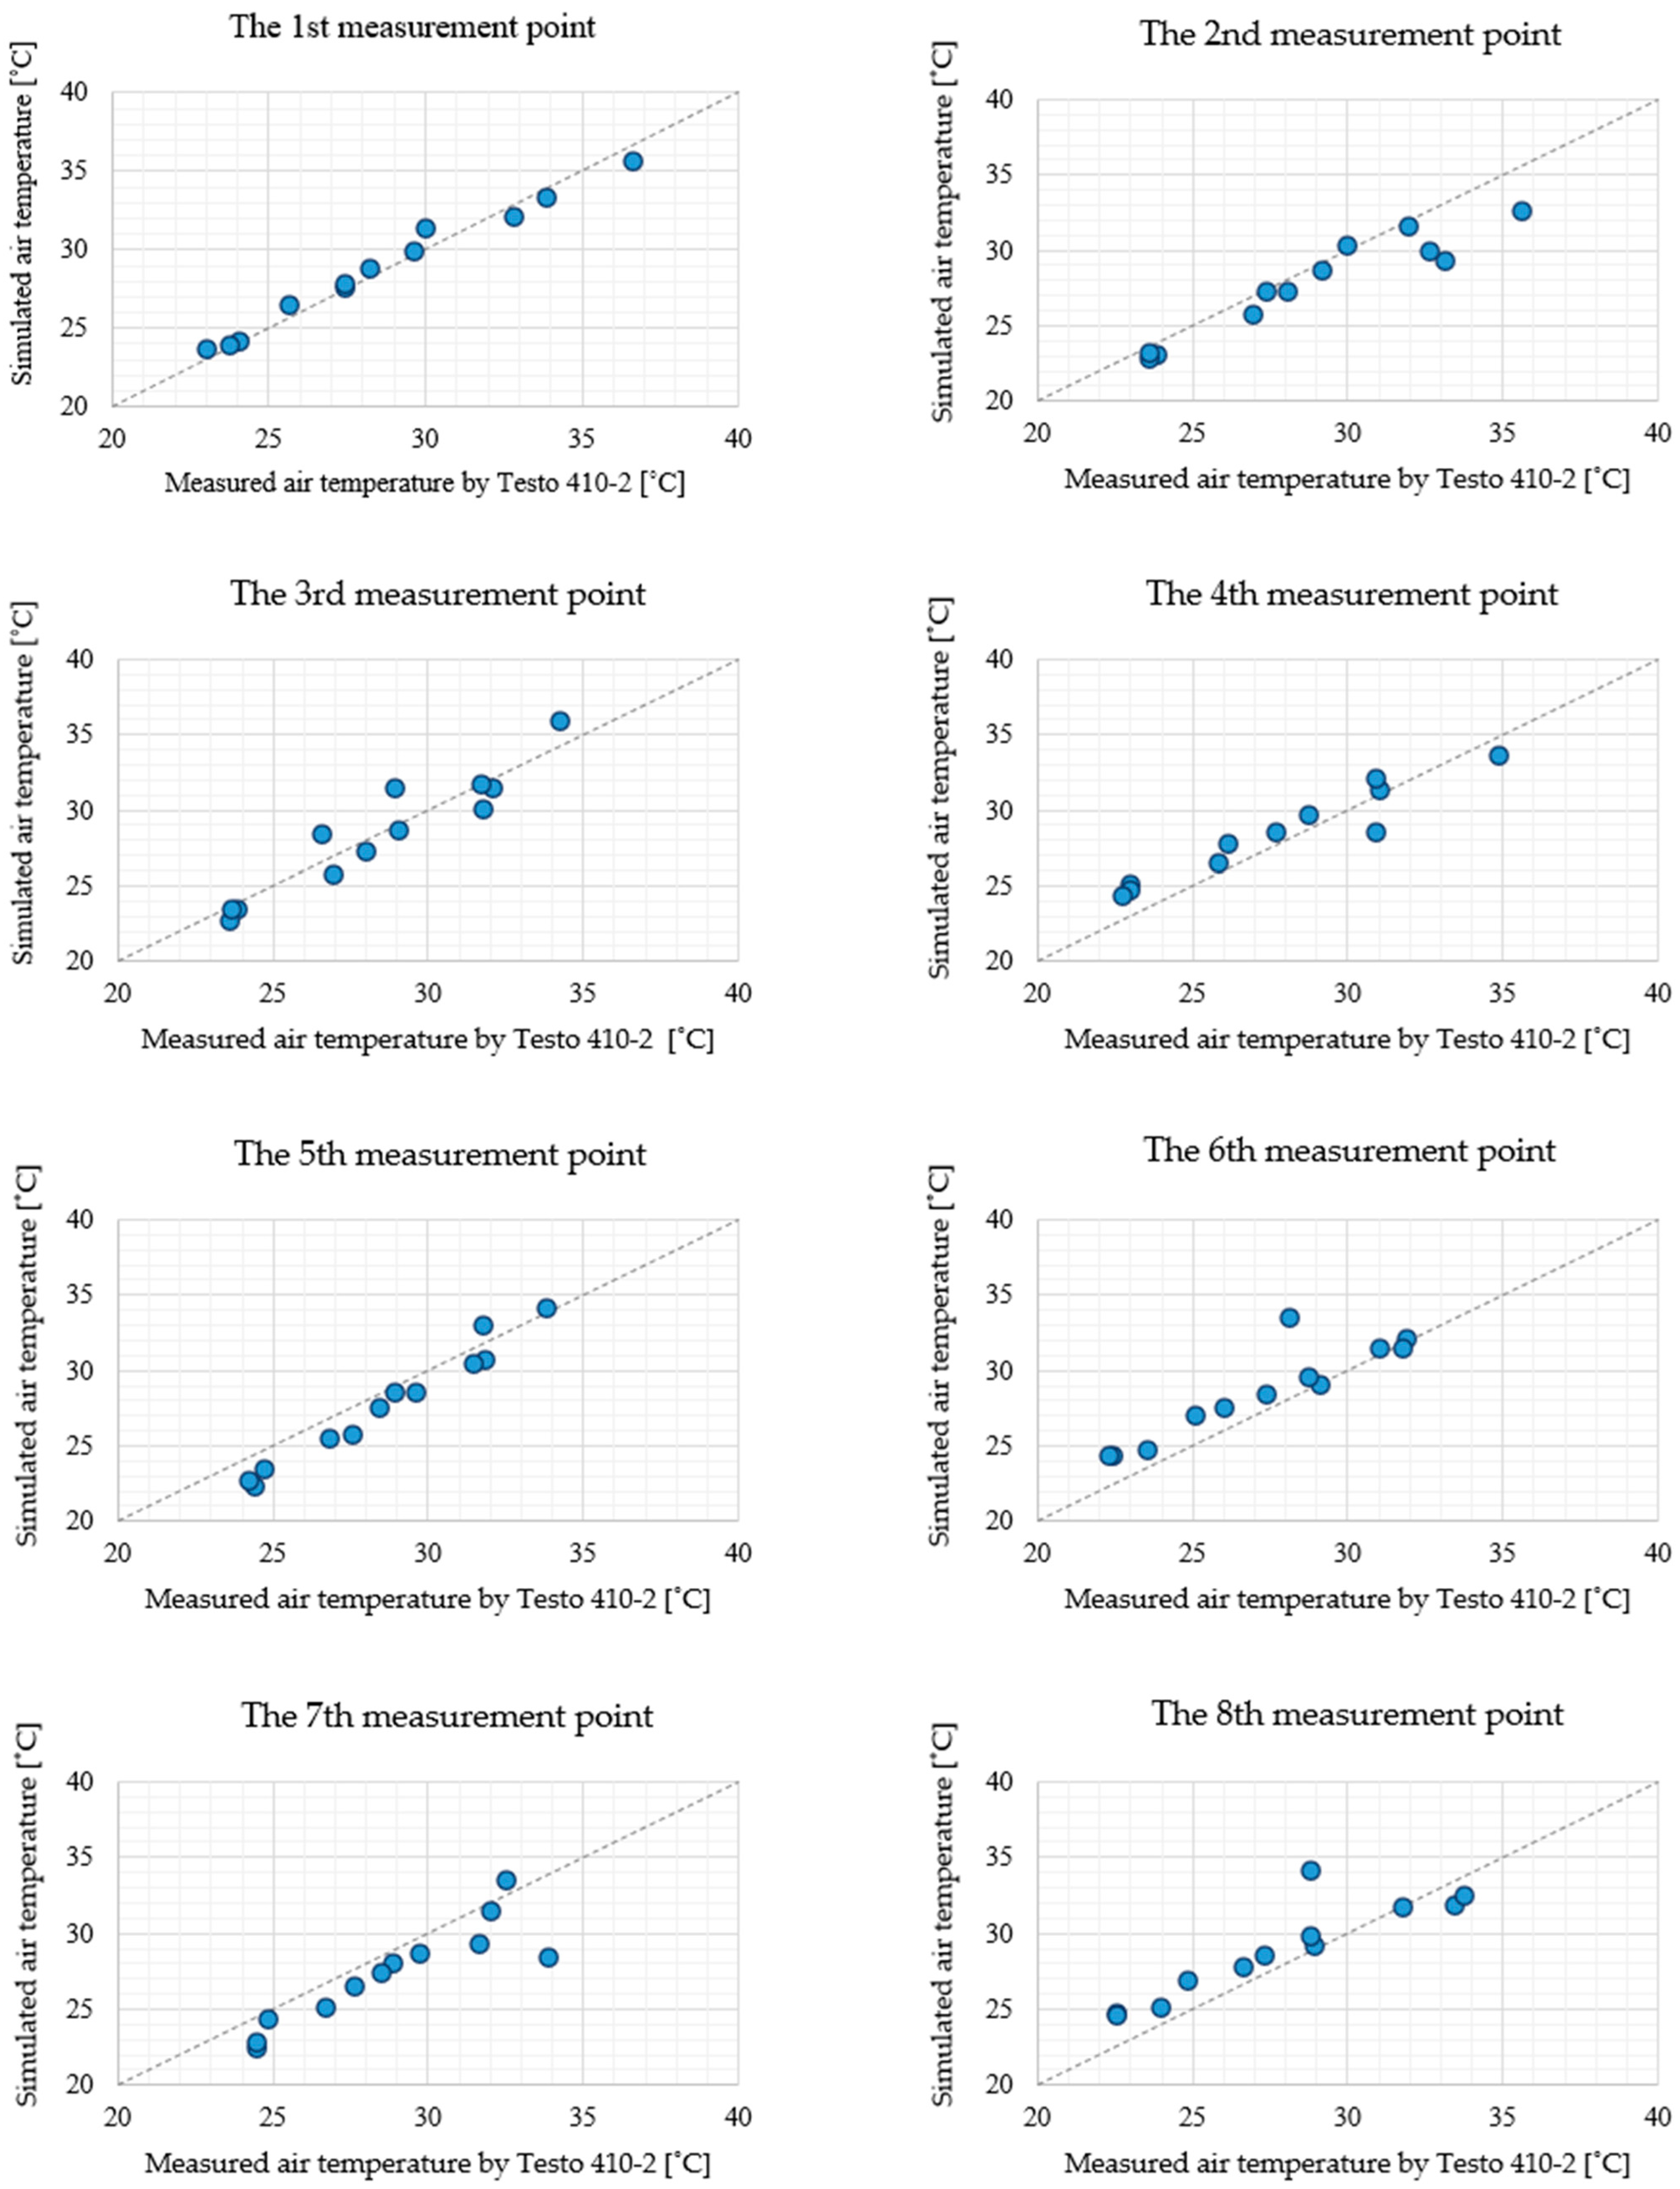
Comparative analyses of simulation results based on information from the measurement campaign with reference values showed that tests conducted with the ENVI-met application were burdened with measurement discrepancies ranging from 0.6 °C to 1.7 °C (MAPE), from 0.7 °C to 2.2 °C (RMSE) (reference values obtained with Testo 410-2; Figure 5). The smallest difference in results was observed at measuring point no. 1. This was due to the fact that the values were entered into the model from the east. The simulation results, at the entrance to the computational domain, were burdened with the smallest errors. The further west, the greater the discrepancies between the simulated and actual values. This was due to the simplified representation of the urban structure of a typical street canyon (e.g., the need to enter objects into a rectangular grid of cells), as well as the microclimate data (a constant solar radiation correction coefficient was assumed; therefore, it was not possible to account for temporary cloud cover). Nevertheless, it should be recognized that the conducted numerical simulations were characterized by the high accuracy of microclimatic predictions (Tariku and Gharib Mombeni (2023) [51]: RMSE for TA = 1.5 °C, Zhou et al. (2025) [52]: RMSE for TA = 1.6 °C, Jänicke et al. (2015) [53]: RMSE for TA = 1.3 °C, Ye et al. (2025) [54]: RMSE for TA = 0.7 °C, Guergour et al. (2024) [55]: RMSE for TA = 1.9 °C, Kotharkar and Dongarsane (2024) [56]: RMSE for TA = 2.4 °C).

3.2. Outdoor Microclimatic Conditions

For comparative purposes, an analysis of the impact of input data on the simulation results was performed using the Envi-met application. These data concerned external weather conditions in the vicinity of Lodz’s historical built environment. Three types of input meteorological data were used for the assessment:
(1)
from numerical simulations based on measurements of meteorological parameters as part of a direct field campaign conducted in the Lodz Metropolitan Area (6 July 2021),
(2)
from numerical simulations based on data collected from the nearest meteorological station, Lodz-Lublinek (6 July 2021),
(3)
Typical Meteorological Year based on meteorological data from 2007 to 2021 (TMY scenario).
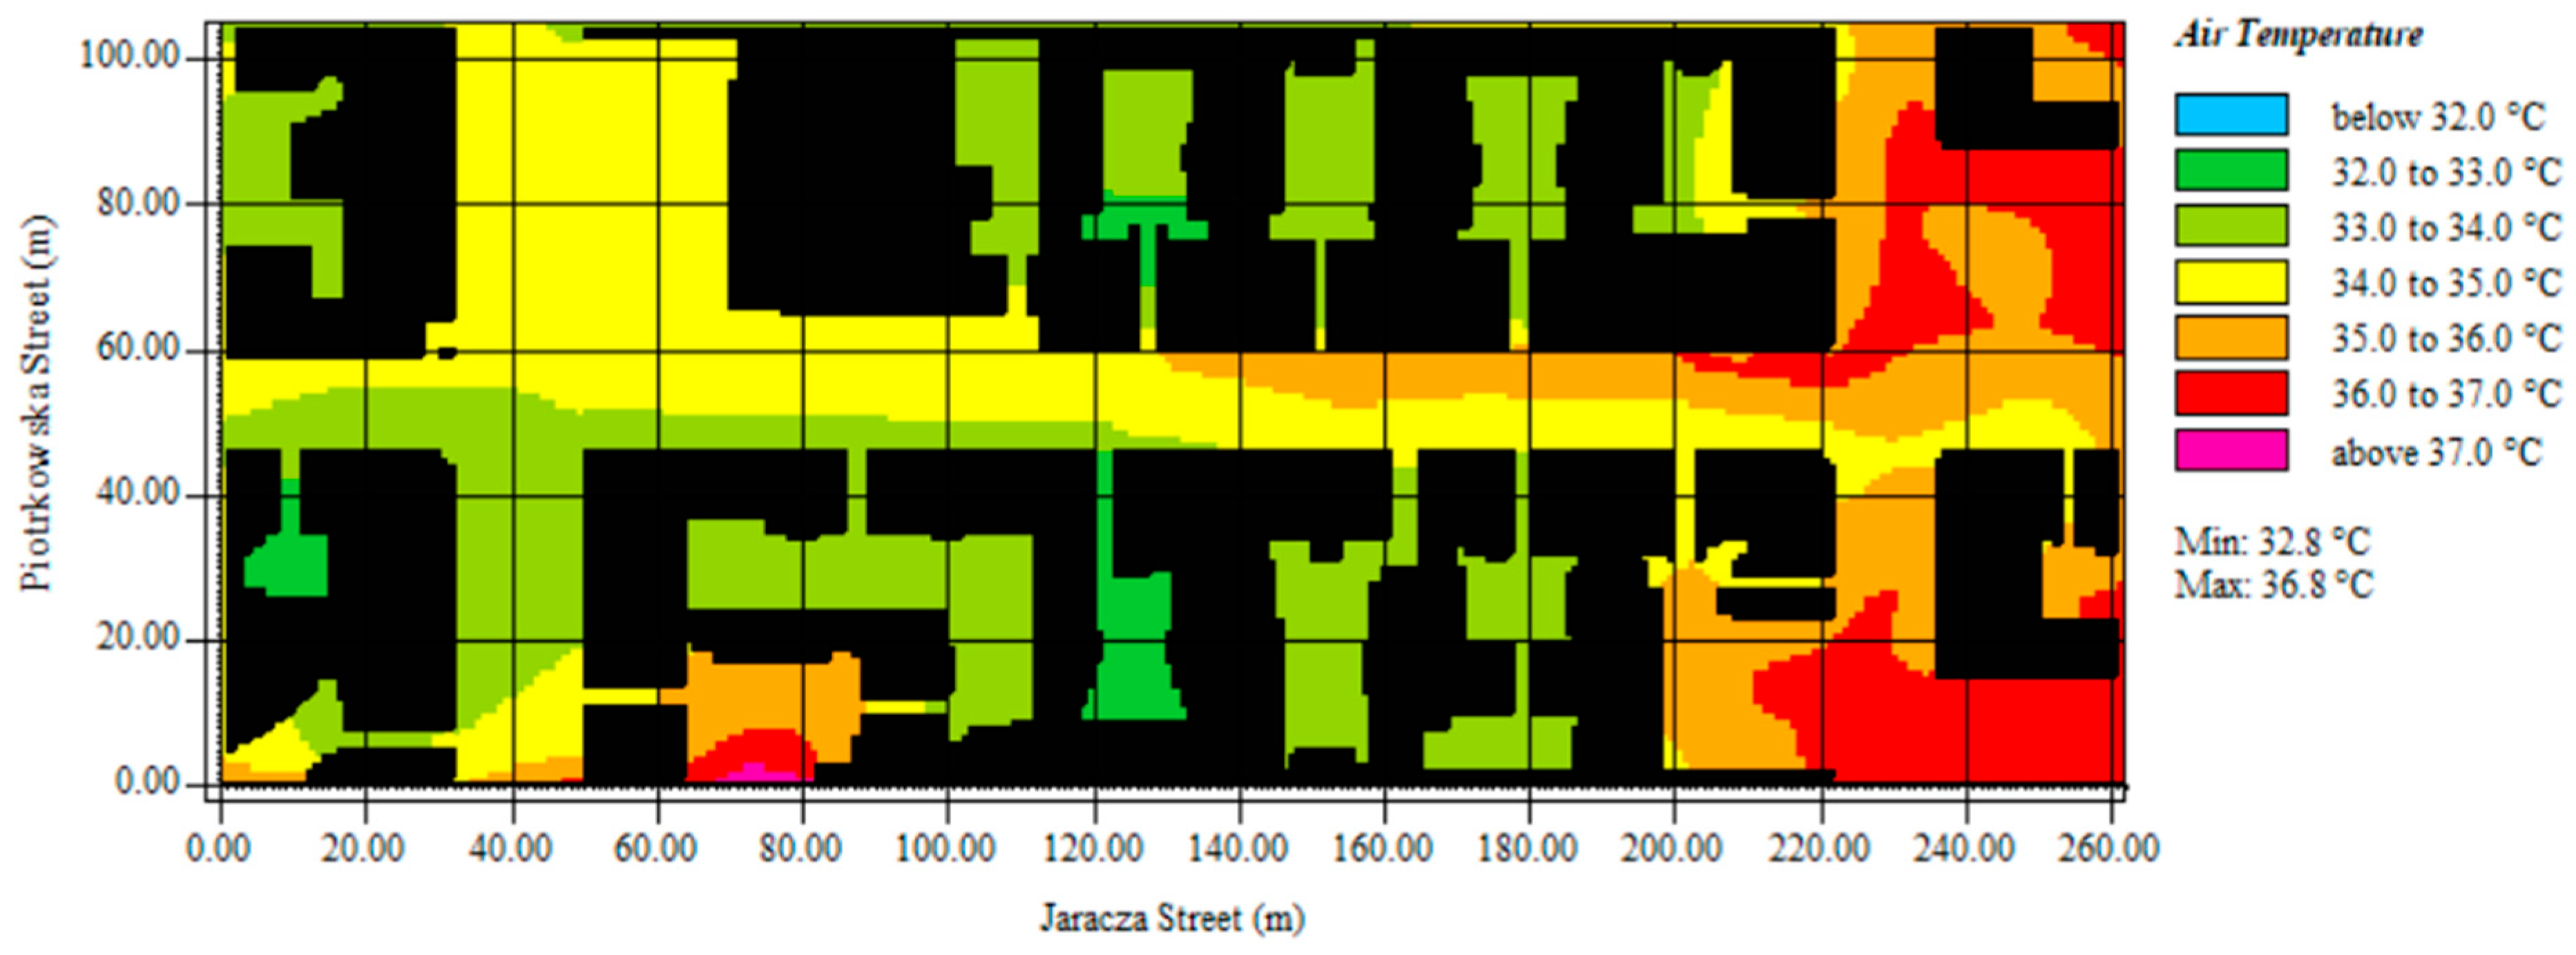
Studies have shown that microclimate parameters undergo significant modifications in highly urbanized areas. The results depend on the type of weather data entered. Analyses based on field data reflected the thermal conditions prevailing in the street canyon (MAPE = 0.6 °C, RMSE = 0.7 °C) (Figure 6). Air temperature ranged from 32.8 °C to 36.8 °C at the warmest point of the day (2 o’clock). The highest values were recorded in public spaces highly exposed to solar radiation. Minimum values were observed within dense residential development with an internal courtyard (32–33 °C). As literature studies show, it is becoming a beneficial solution to use direct field measurements to estimate the microclimatic conditions in public spaces, including street canyons [56,57,58].
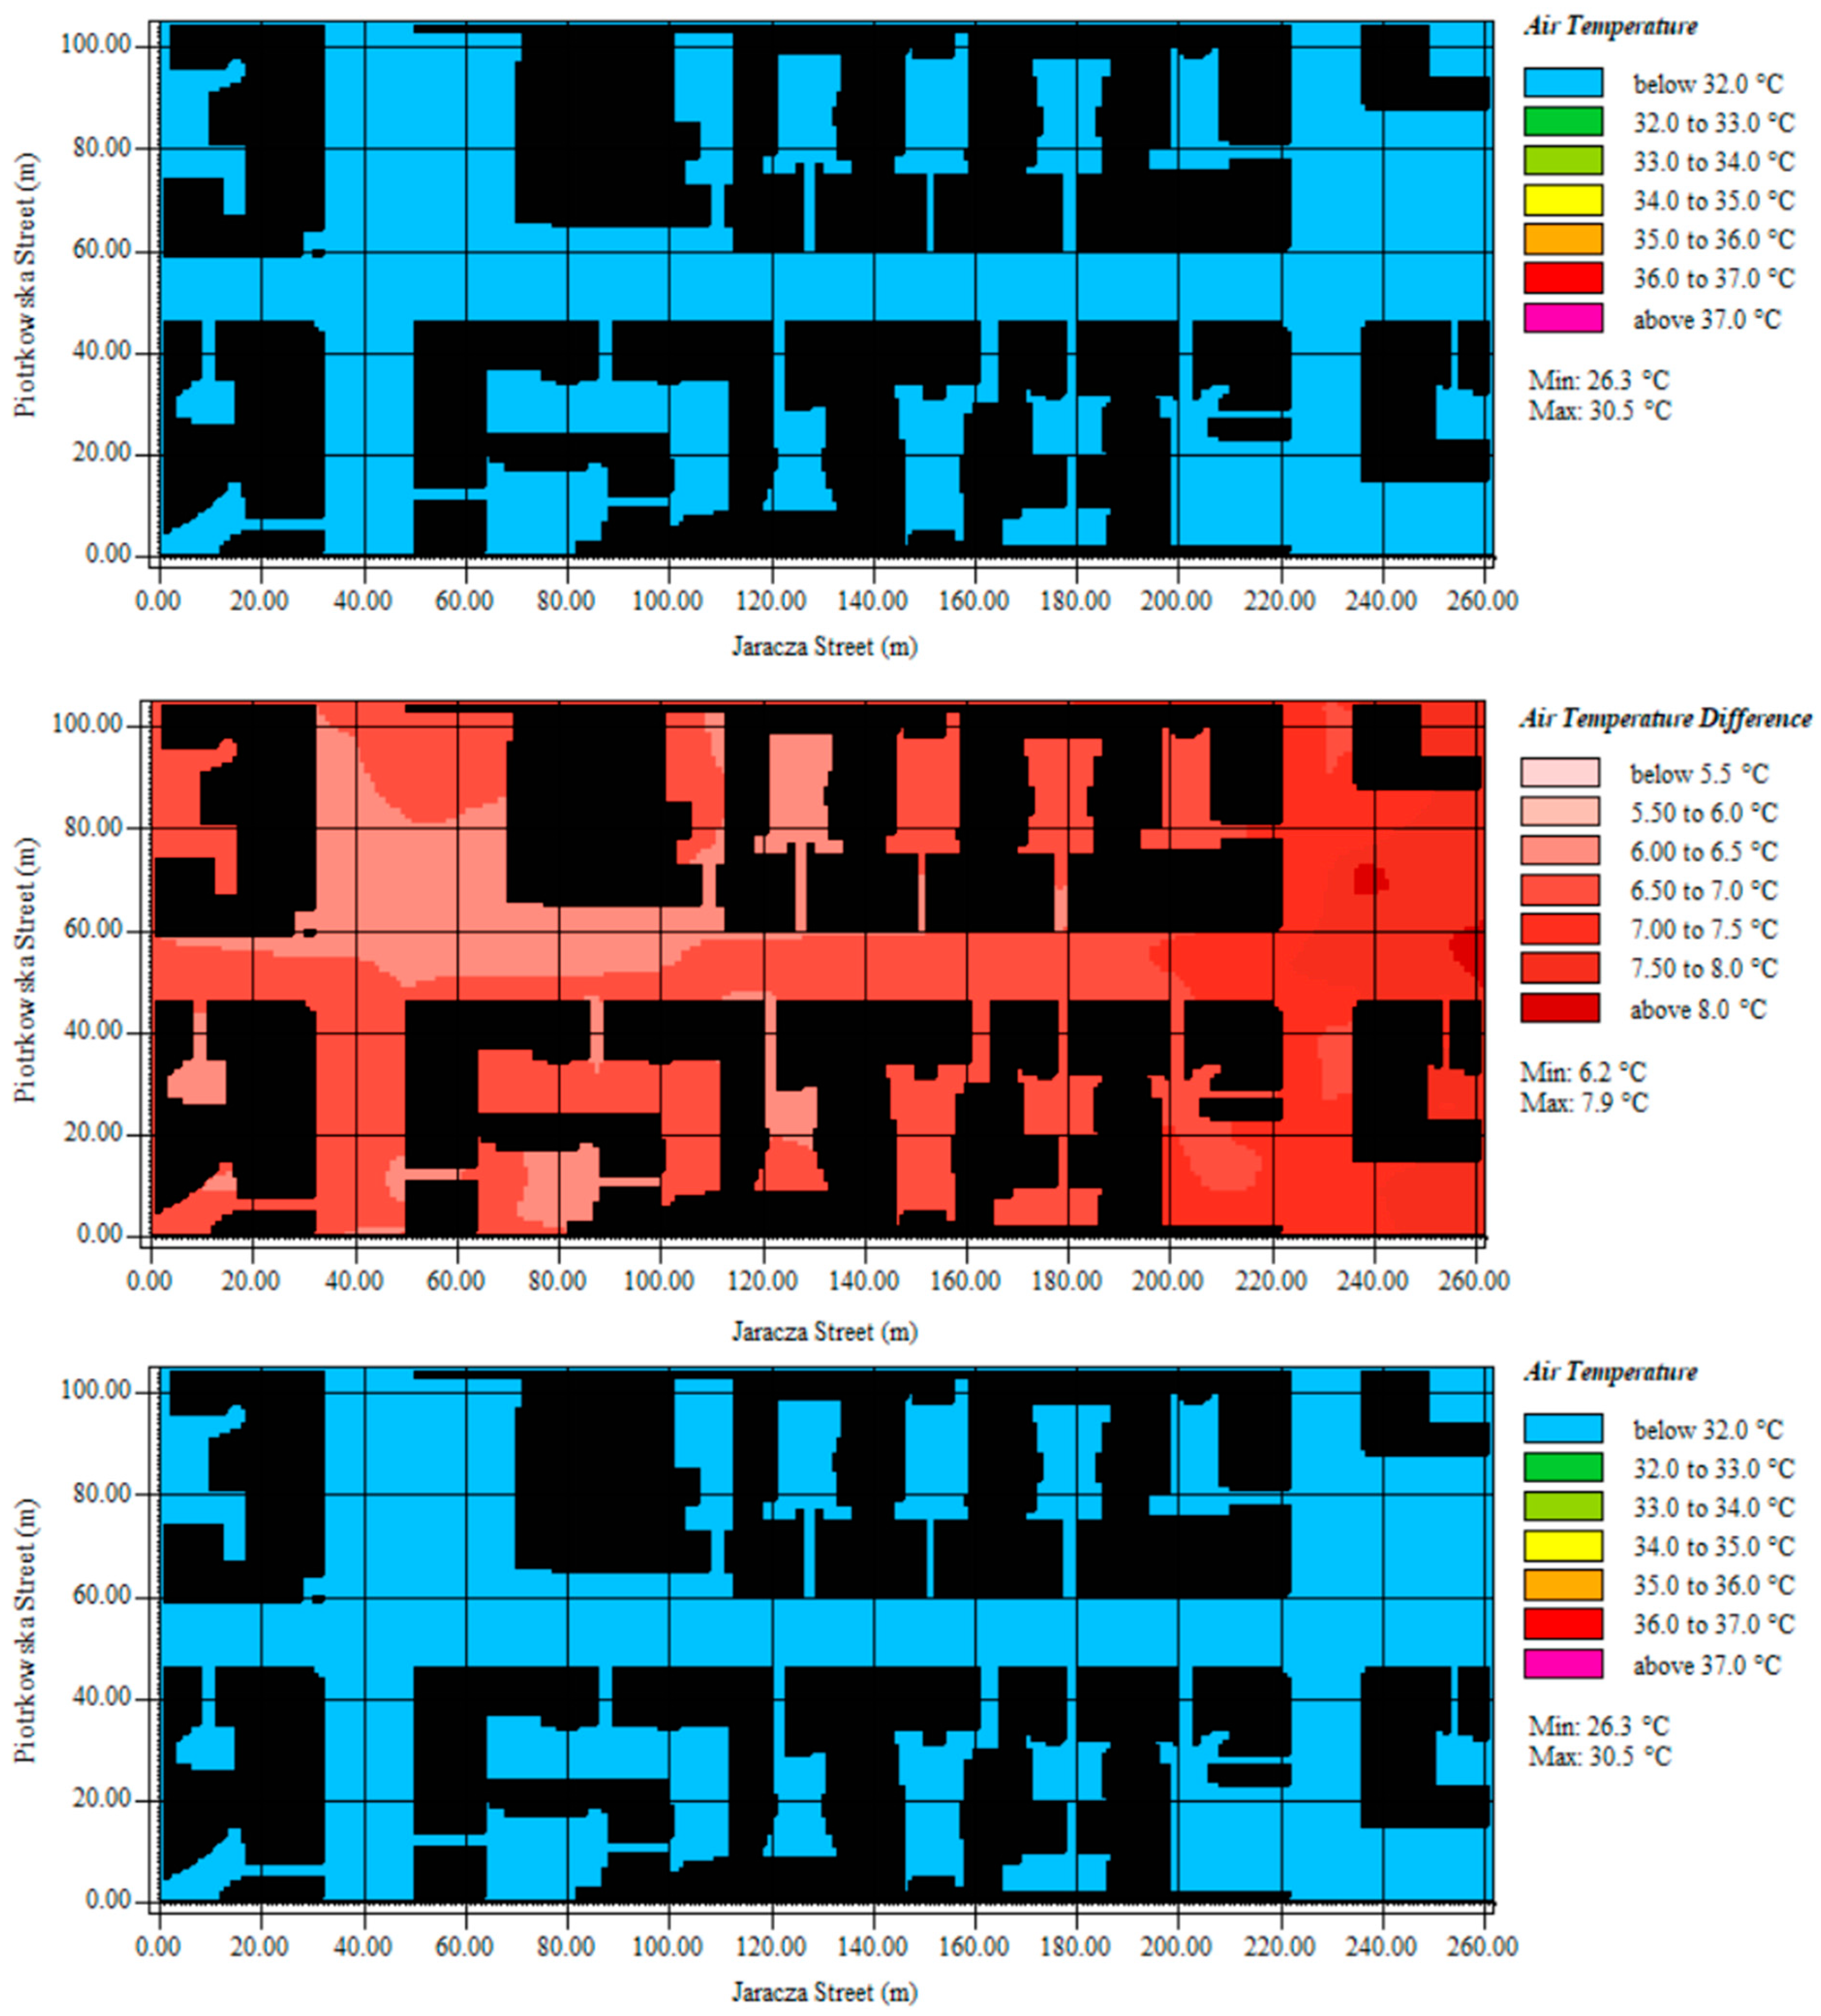
In the second case, simulations based on information from a suburban measurement station, thermal conditions should be considered milder (Figure 7). Air temperature ranged from 26.3 to 30.5 °C. However, it should be noted that the analyses were subject to a significant forecast error (MAPE = 3.6 °C, RMSE = 4.0 °C).
Using other measurement data, such as average conditions characterizing a given area—a Typical Meteorological Year—obtained from a suburban weather station, can be subject to significant errors. One cause is the urban heat island phenomenon in urban areas, particularly during cloudless, windless summer days. This leads to heat accumulation within the dense urban structure. The temperature of the outdoor air, vertical surfaces (building walls), and horizontal surfaces (floors) in the city centres increases. The thermal environment of the urban area undergoes significant changes [59,60,61]. As a result, conducting research based on average conditions (TMY) will not be reliable. A comparative study of numerical simulations based on field data, a suburban meteorological station, and TMY in a street canyon can be used as an example. In the last case (TMY), thermal conditions should be considered the mildest. Air temperature ranged from 26.3 to 30.5 °C. The analyses were subject to a larger forecast error (MAPE = 5.9 °C, RMSE = 6.3 °C).

3.3. The Influence of External Microclimatic Parameters on Human Indoor Comfort

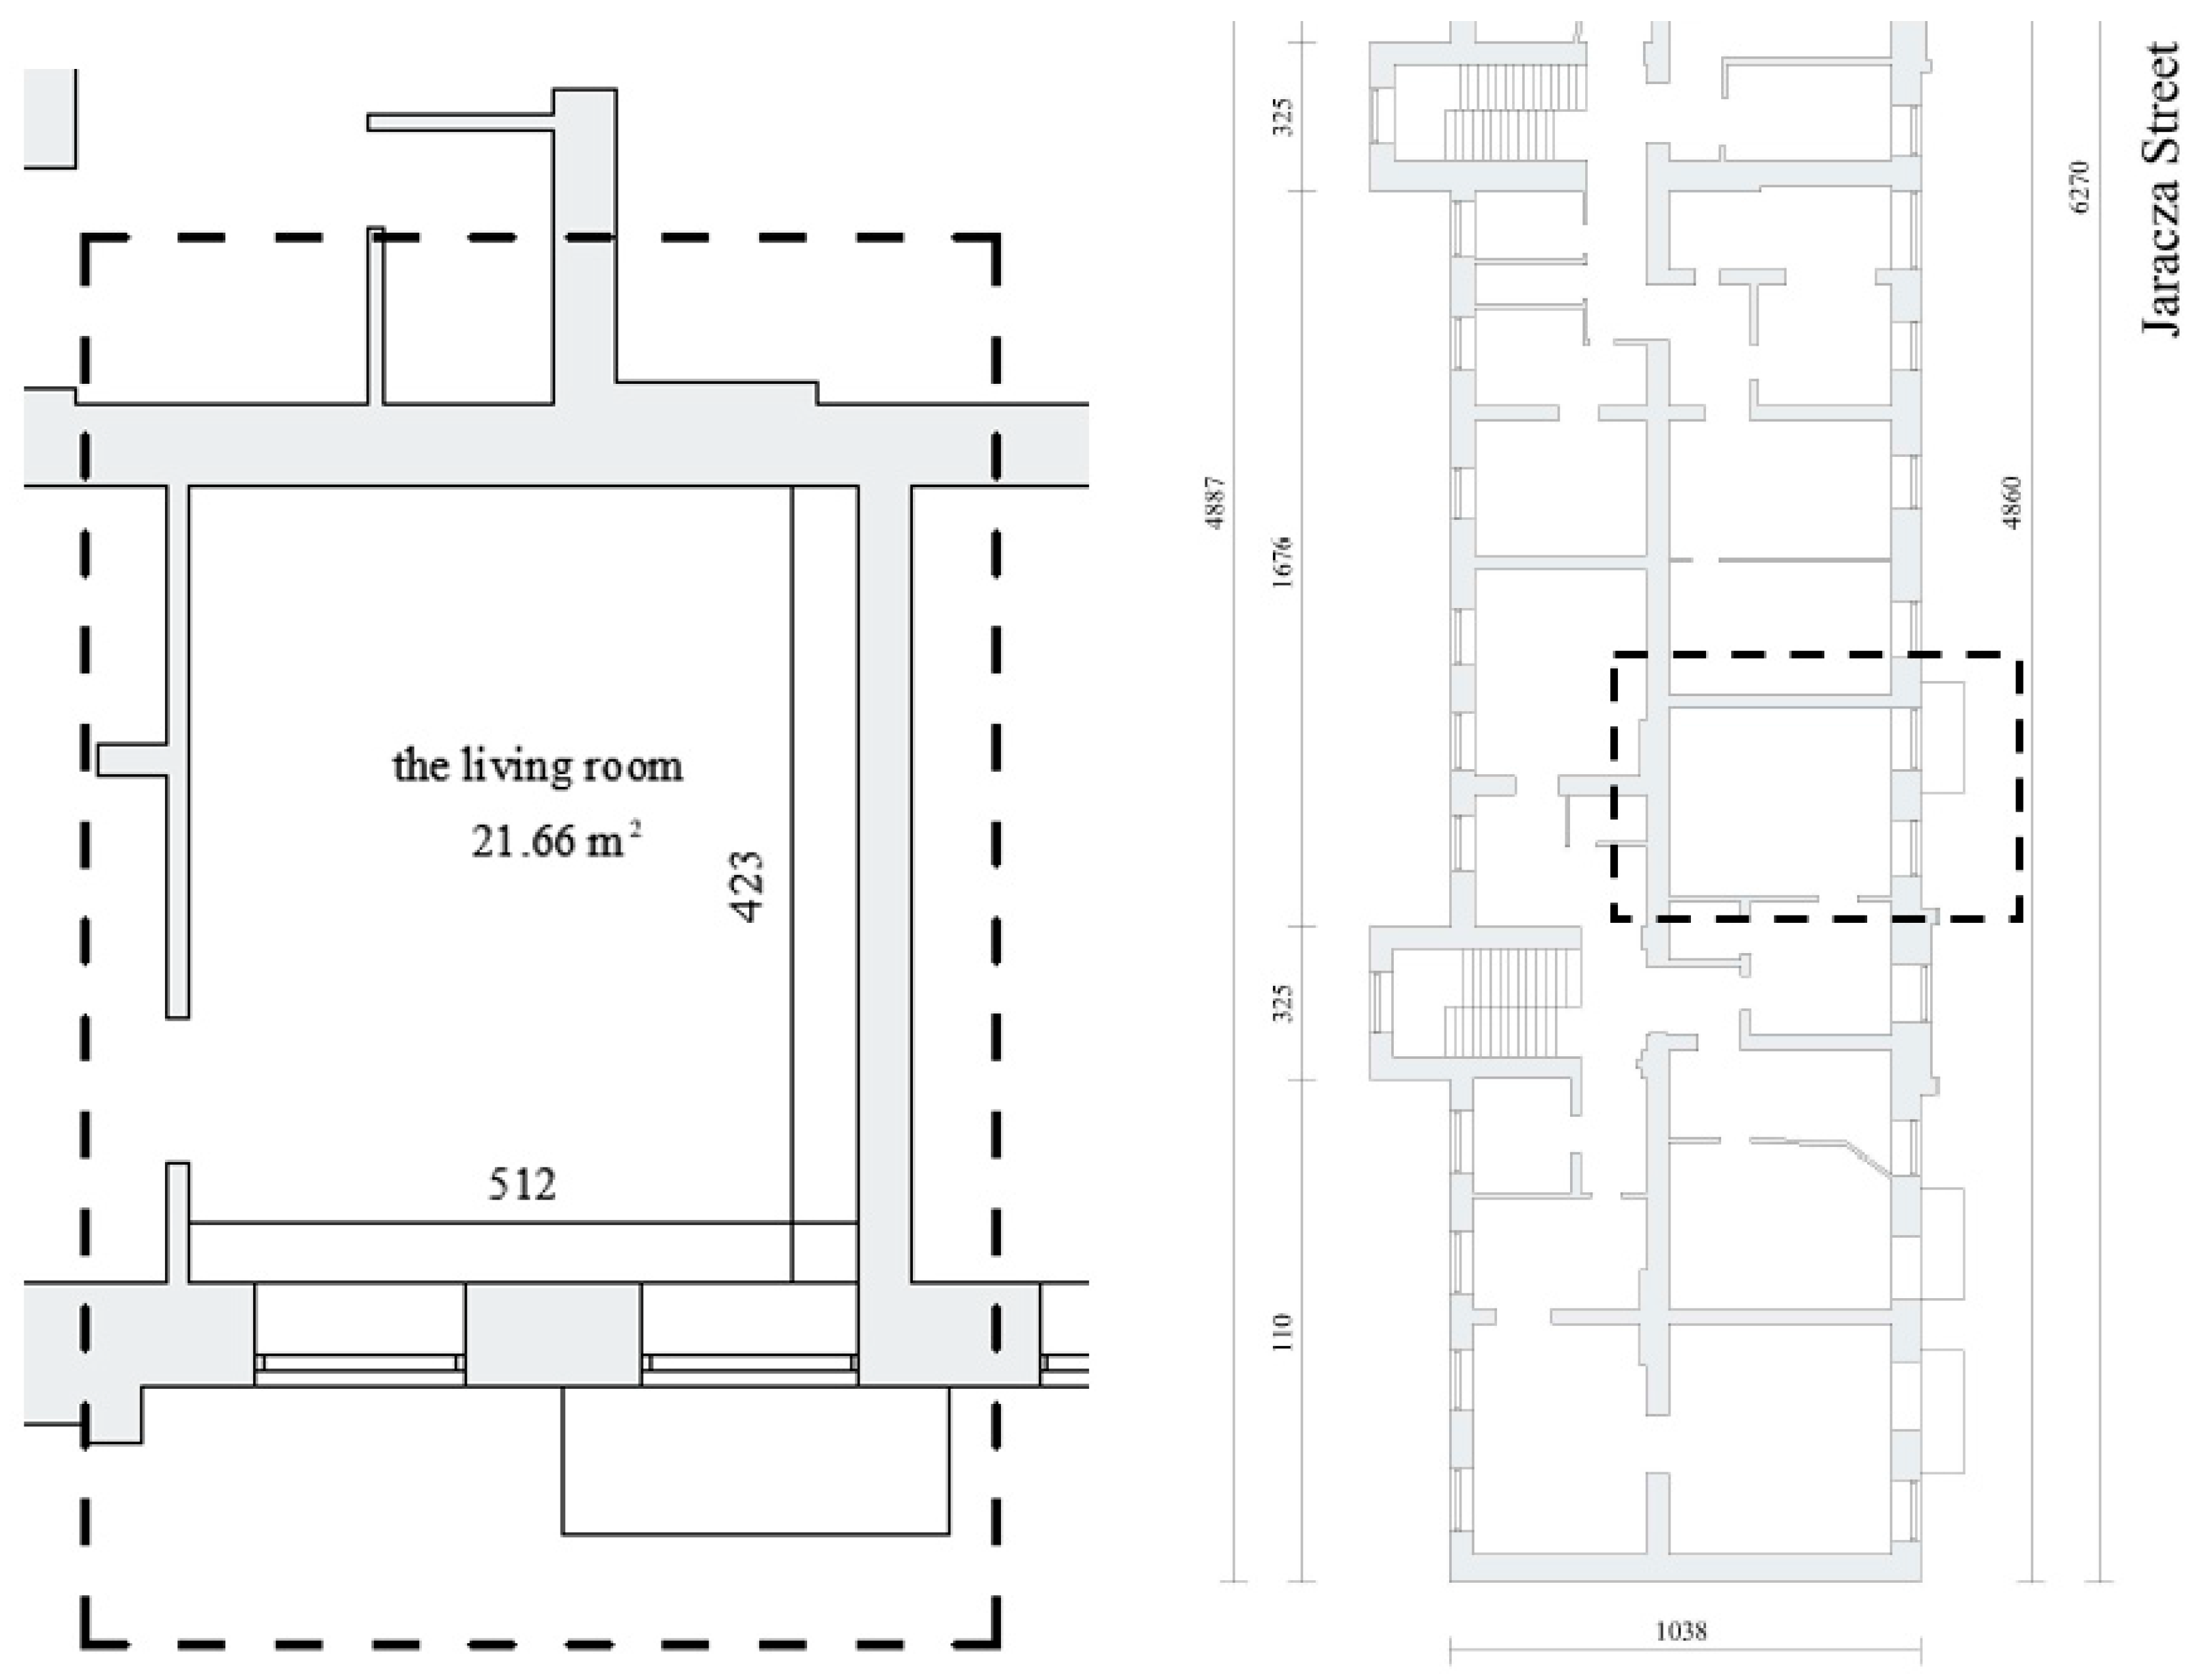
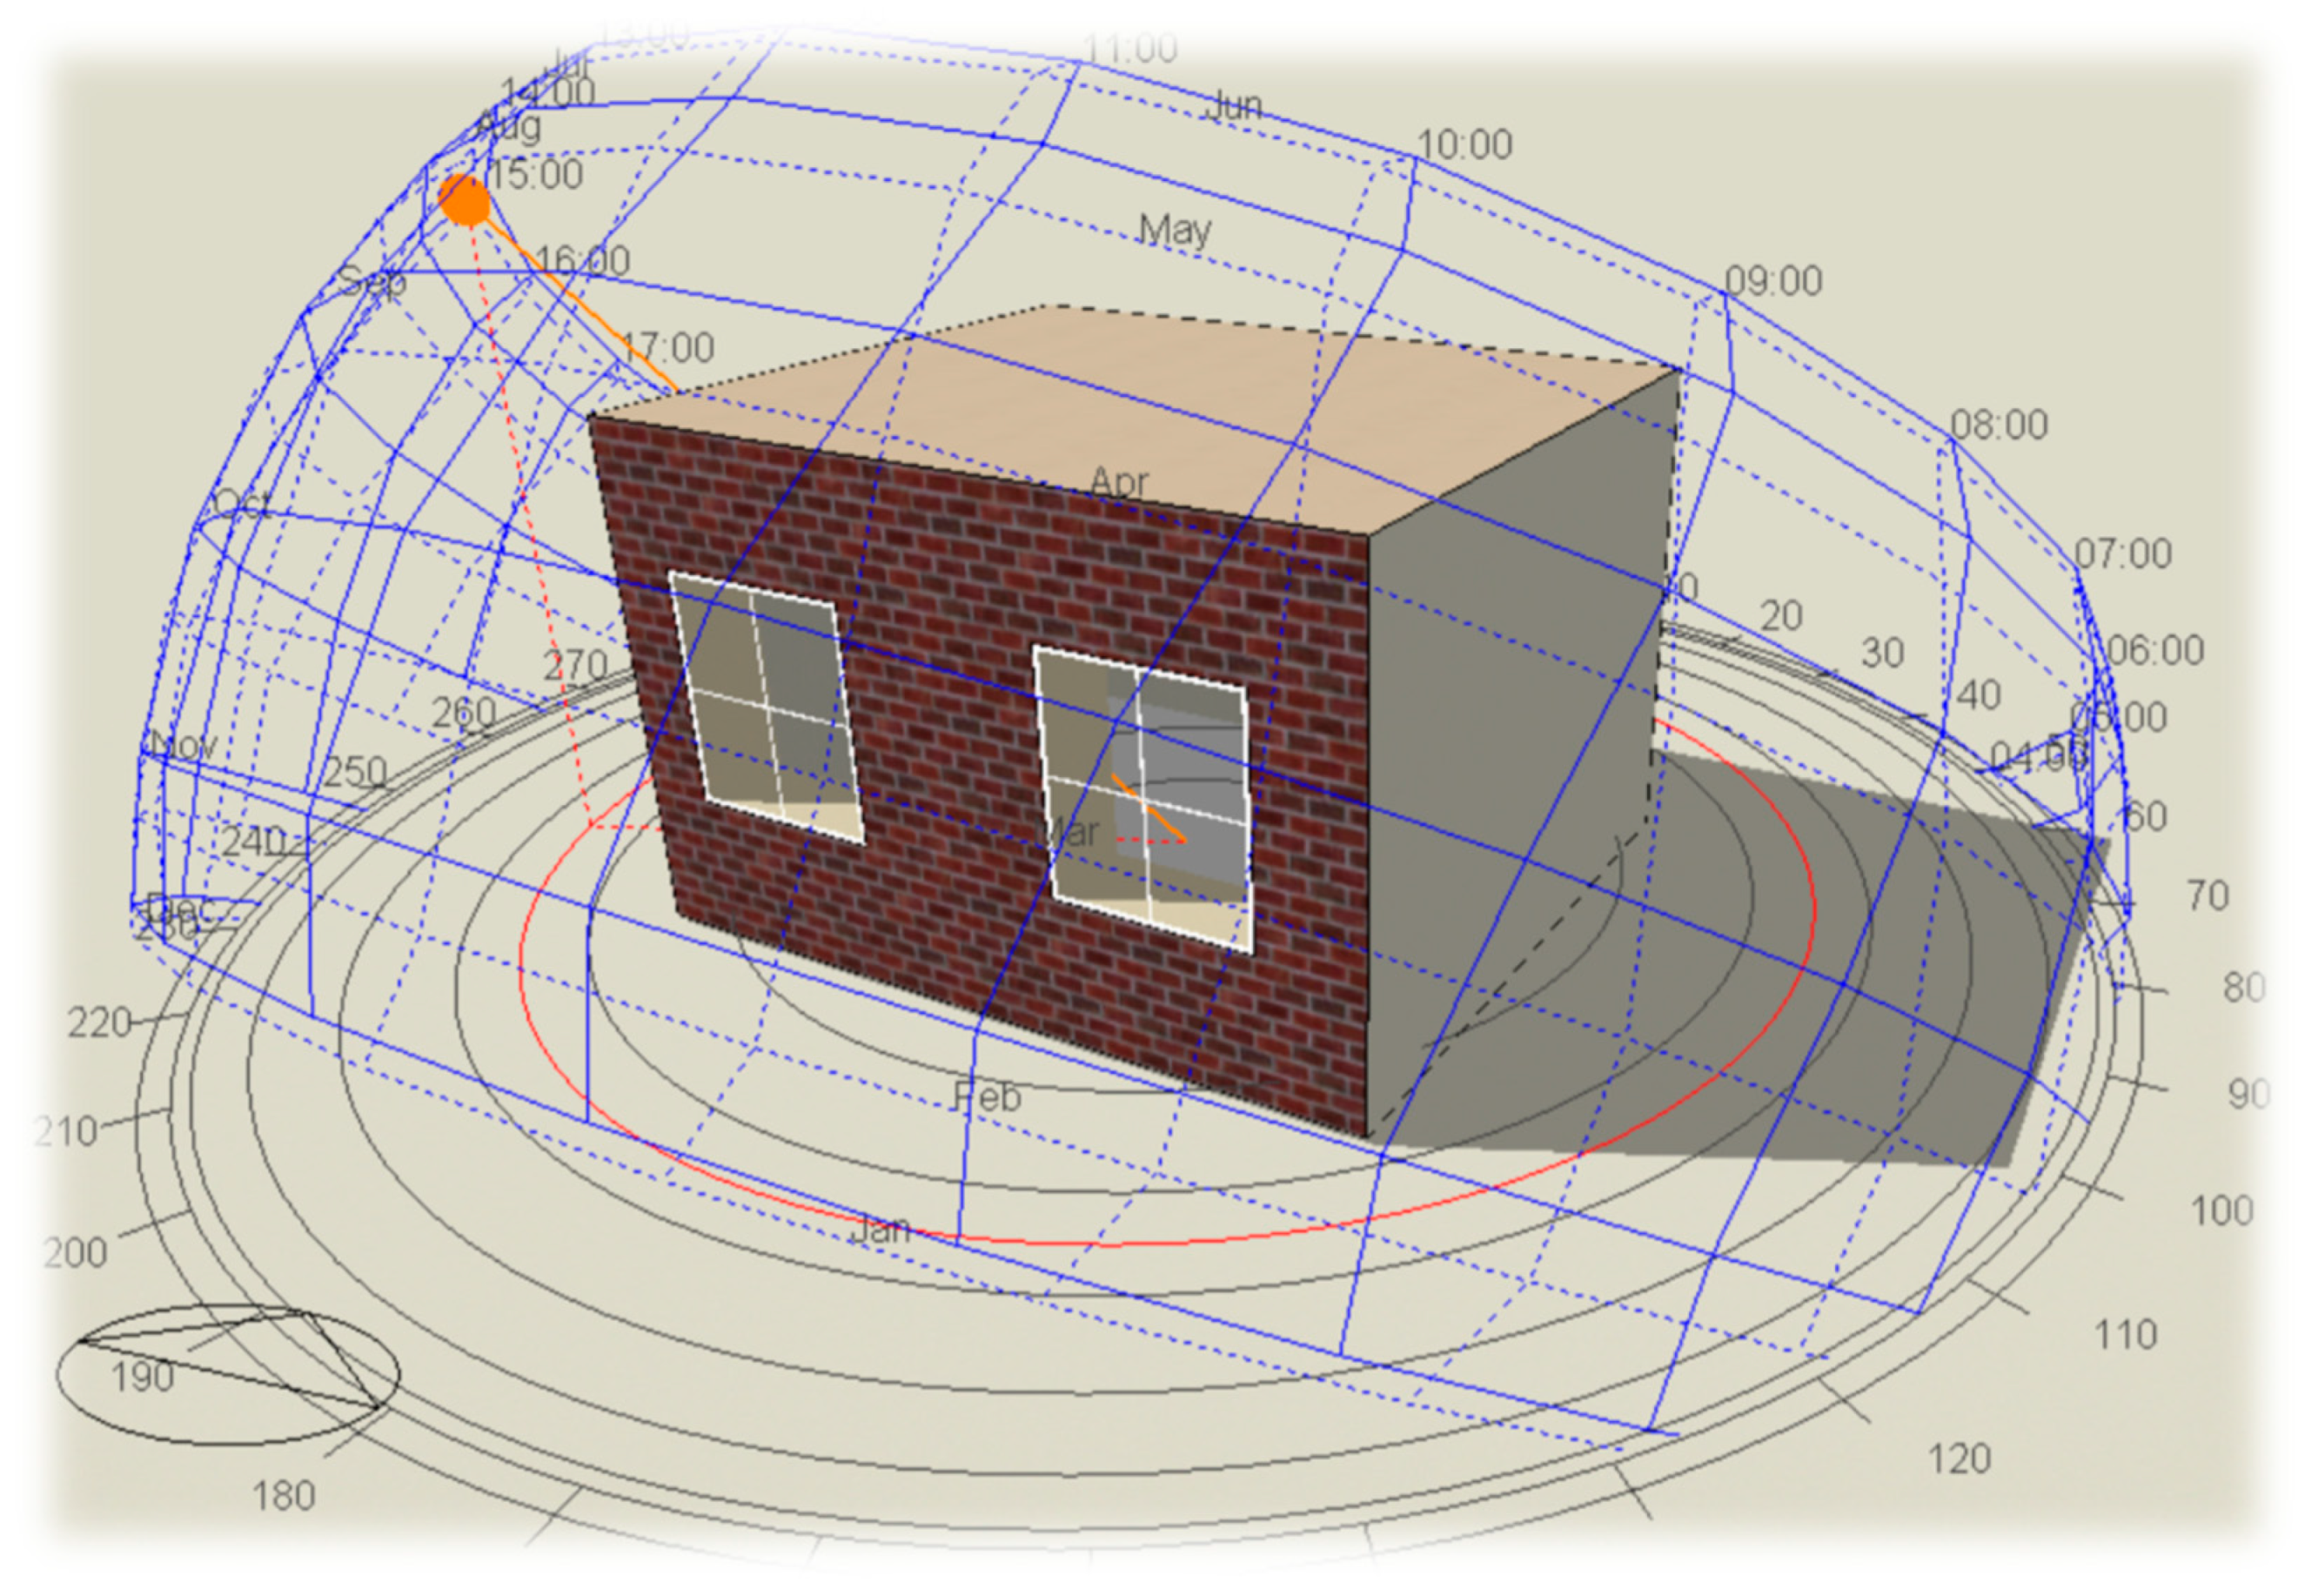
The next stage of the research consisted of analyzing the thermal conditions in the naturally ventilated front building of the street canyon. The information on the residential building located at the crossroad of Jaracza/Piotrkowska Streets (address: Jaracza 1), in the inner city, in the Metropolitan Area of Lodz, was used for the assessment. The data were obtained from archival databases of public institutions, including the City Conservator of Monuments and the City Surveying Centre. On this basis, a prototype of a room intended for human habitation was made. The horizontal projection of a residential building with services on the ground floor, made at the height of the second storey (the level of residential premises in the strict city centre), was used. The analyses included thermal conditions in the living room (Figure 8 and Figure 9). Fully adiabatic conditions were assumed for the external partitions of the analyzed room, except for the external southern elevation. Figure 9 presents a sun path diagram from DesignBuilder, overlaid on the model of the analysed space, indicating the southern orientation of the windows, as marked in the lower-left corner of the figure. The input meteorological data used information from the residential level, from simulations performed in the ENVI-met software (Table A3). They were used as data to determine the thermal comfort of a person staying in a room of a naturally ventilated residential building in DesignBuilder.

3.4. Configuration of the Residential Zone in DesignBuilder

In the model, the parameters of the ‘living’ zone were defined. The zone represents a dining area in a residential building and is characterized by low occupancy intensity (density 0.0169 persons/m2) and the ‘eating/drinking’ activity profile. The occupancy schedule named Dwell_DomDining_Occ was assigned, and the metabolic load was set at 0.9 met.
  • Internal Gains
Heat gains from equipment were defined based on two groups:
  • Household products—3.06 W/m2.
  • Miscellaneous equipment—3.74 W/m2.
The total heat gain from equipment amounts to approximately 6.8 W/m2. For both categories, a radiant fraction of 0.20 was adopted. Electrical loads were linked to the Dwell_DomDining_Equip schedule, which reflects typical equipment usage in the morning and evening hours.
The Dwell_DomDining_Equip schedule uses a Compact Schedule profile describing the percentage of maximum load in individual hours of the day. The highest loads occur in the evening (approx.at 19:00), while values drop significantly during nighttime and early morning hours.
  • Ventilation rates characteristic
On 6 July, natural ventilation responded to outdoor temperature by operating at its highest daytime intensity. During the early morning and late evening, the airflow remained at the minimum level of approximately 1–2 ach, while for the majority of the day the ventilation rate reached and maintained its maximum value of around 6.5–7 ach, reflecting favourable temperature conditions for natural ventilation.
  • Construction assemblies used in the model
The building constructions were represented using multi-layer assemblies. The external wall assembly comprised three layers: 20 mm of external cement—lime plaster, a 580 mm brick structural layer, and 20 mm of internal gypsum plaster. The ceiling was modelled as a 250 mm layer of brick and 20 mm of internal gypsum plaster. The lightweight internal wooden floor consisted of a 19 mm timber flooring layer placed over a 50 mm air gap. The internal partition wall was defined as a three-layer element: 20 mm of gypsum plaster, a 230 mm brickwork core, and 20 mm of gypsum plaster on the opposite side.
In the model, double-glazed windows were applied. Solar heat gain coefficient (SHGC): 0.6. U-value:1.4 W/(m2K).

3.5. Thermal Comfort in a Room Located on the Street Canyon Side

At first, the external weather conditions around the residential building were analyzed. Two types of meteorological data were used for evaluation:
(1)
Numerical simulations based on measurements of meteorological parameters as a part of direct field campaigns carried out in the Metropolitan Area of Lodz (RMS scenario—simulation on the basis of real measurements).
(2)
For comparison—Typical Meteorological Year based on the meteorological data from 2007 to 2021 (TMY scenario).
Studies have shown that microclimate parameters are significantly modified in highly urbanized areas (Table 2). The results depend on the type of weather data entered. Analyses based on information obtained from direct measurement campaigns conducted in the Metropolitan Area of Lodz were characterized by higher outdoor air temperatures (RMS scenarios). In the case of a Typical Meteorological Year, the average temperature observed during the summer in Lodz was observed. It is clear that this temperature significantly deviates from the actual values recorded in the city centre.
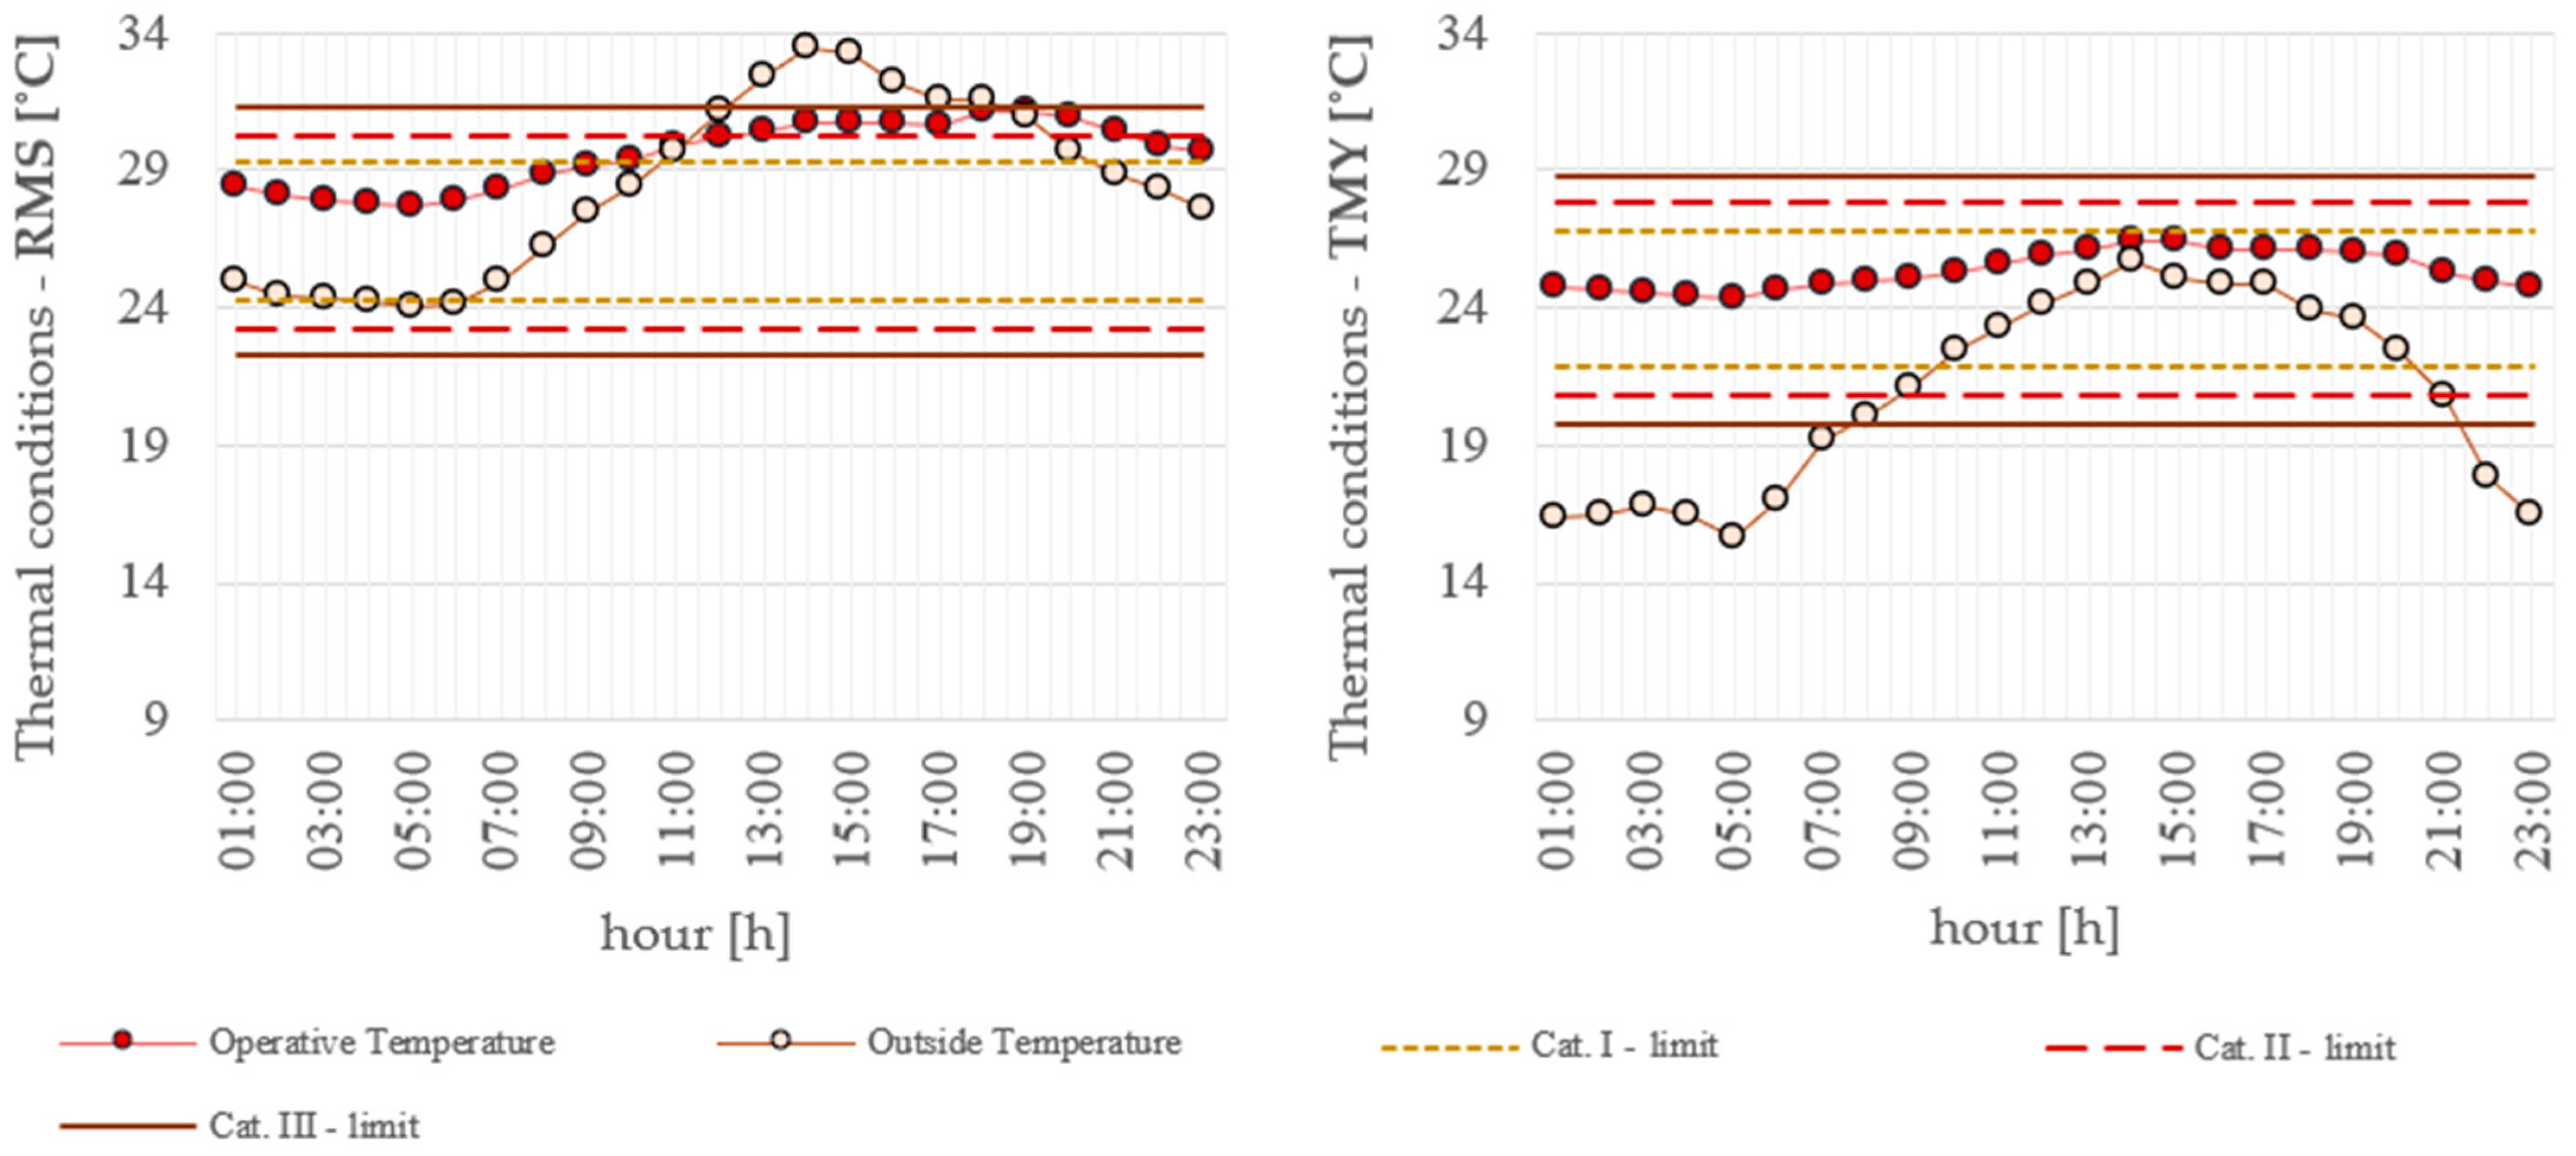
The obtained information was used to estimate the thermal sensations inside the living room of the existing naturally ventilated residential building. Thermal comfort was estimated using an index, which was the operative temperature (Top) according to the standard PN-EN 16798-1:2019-06—Energy performance of buildings—Ventilation of buildings—Part 1: Indoor environment input parameters for design and assessment of energy performance of buildings with respect to indoor air quality, thermal environment, lighting and acoustics—Module M1-6 (2019) [62,63]. In order to determine whether the estimated indoor thermal sensations could be considered comfortable, it was necessary to determine thermal sensation thresholds corresponding to standard thermal comfort categories. Based on the information available on outdoor weather conditions, the outdoor running mean temperature was calculated (according to Equation (3)). If records of the outdoor running mean temperature were not available, Equation (4) would have to be used.
θ r m = 1 α θ e d 1 + α θ e d 2 + α 2 θ e d 3 ,
θ r m = θ e d 1 + 0.8 θ e d 2   + 0.6 θ e d 3 + 0.5 θ e d 4 + 0.4 θ e d 5 + 0.3 θ e d 6 + 0.2 θ e d 7 ) / 3.8 ,
where θ r m —running mean temperature for today [°C], θ e d 1 —daily mean external temperature for the previous day [°C], θ e d 2 —daily mean external temperature for the previous day, and so on [°C], and α —a constant (0.8).
The operative temperature thresholds were calculated according to Equations (5)–(10). and the optimal index value was calculated using Equation (11) for a residential building without a mechanical cooling system [62]. They were determined for a building that can be classified in both (1st category) with a high level of expectation—very sensitive and fragile person with special requirements (very young children, elderly person), (2nd category) normal level of expectation—renovated buildings, and (3rd category) an acceptable, moderate level of expectation (existing buildings). The results are presented in Figure 10.
Category IUpper limit θ i m a x = 0.33 θ r m + 18.8 + 2 (5)
Lower limit θ i m a x =   0.33 θ r m +   18.8   3(6)
Category IIUpper limit θ i m a x = 0.33 θ r m + 18.8 + 3 (7)
Lower limit θ i m a x =   0.33 θ r m +   18.8   4(8)
Category IIIUpper limit θ i m a x = 0.33 θ r m + 18.8 + 4 (9)
Lower limit θ i m a x =   0.33 θ r m +   18.8   5(10)
Optimal Operative Temperature θ c = 0.33 θ r m + 18.8 (11)
When real microclimate measurements taken at the building façade were used (RMS scenario), the indoor operative temperature remained fully within the adaptive comfort boundaries for the entire 24 h period. The operative temperature exhibited only moderate variation, increasing from approximately 28 °C during the early morning hours to about 30–31 °C at the peak of the day. The corresponding adaptive comfort limits for Category II, resulting from high outdoor running-mean temperatures, were positioned at roughly 29–31 °C. Consequently, indoor conditions in the RMS scenario stayed close to the centre of Category II throughout most of the day and moved toward its upper boundary between early afternoon and early evening. Despite the very high external temperatures, the indoor operative temperature did not exceed the upper Category III limit, confirming that the thermal mass of the building reduced the intensity of overheating even under strong urban heat island conditions.
In contrast, simulations driven by Typical Meteorological Year (TMY) weather data produced noticeably lower indoor operative temperatures. In this scenario, the operative temperature ranged from approximately 25 °C in the morning to around 26 °C in the afternoon, showing only small intraday fluctuations. Because the running-mean outdoor temperature derived from TMY data was significantly lower than in the RMS case, the adaptive comfort limits also shifted downwards. The Category II comfort band for the TMY day was located approximately between 25 °C and 27 °C. Under these conditions, indoor operative temperatures remained well within Category II at all hours, with no periods approaching Category III or the upper comfort boundaries.
Compared with the RMS results, the TMY-based simulation underestimated peak indoor operative temperatures by roughly 3–4 °C and did not capture the afternoon increase observed under real microclimate conditions. As a result, TMY data lead to a more optimistic assessment of indoor thermal comfort, particularly with respect to overheating risk and the duration of exposure near upper adaptive comfort limits.

4. Discussion

Thermal comfort studies in the interiors of historic buildings located in central parts of cities should take into account the complex nature of microclimate conditions resulting from the presence of the Urban Heat Island. Standard studies assume data from a meteorological station located in a suburban area as boundary conditions. As a result, the adopted data do not account for the influence of local building structure, degree of ground sealing, materiality, and local heat sources. An alternative could be the use of numerical simulations. To this end, the authors attempted to combine two tools: ENVI-met, which reflects the external microclimate near the studied structure, and DesignBuilder, which is a tool for determining conditions within building interiors.
In order to determine the impact of the adopted weather data on the accuracy of the simulation, three types of data were taken into account, i.e., from direct field measurements, from a suburban weather station, and from a Typical Meteorological Year. The obtained results confirm that the highest precision was achieved in analyses where information obtained at a real scale in the city centre was used as boundary conditions (field measurements: MAPE = 0.6 °C, RMSE = 0.7 °C). The use of information from the suburban weather station was subject to larger errors (MAPE = 3.6 °C, RMSE = 4.0 °C). This fact is confirmed by the research conducted by Pei et al. [64], which was conducted in Wuhan, China. They were focused on developing a coupling method of ENVI-met and COMFIE for more precise energy building simulations. It turns out that the use of data from a suburban area may result in overestimation of the heating load (5.8%) and underestimation of the cooling load (8.7%). Another approach based on Typical Meteorological Year information did not provide a reliable picture of weather conditions in the city centre (MAPE = 5.9 °C, RMSE = 6.3 °C). It turns out that the building structure had a significant impact on the modification of microclimatic parameters. This can be confirmed by research by Salvati and Kolokotroni [65] in Cadiz (Spain) and London (United Kingdom). Their analyses focused on energy demand in residential buildings, taking into account the impact of climate change and urban settings. It turns out that contemporary simulation input weather files do not account for thermal changes occurring in cities. This translates into the quality of predictions for energy use in the residential sector and indoor thermal comfort assessment.
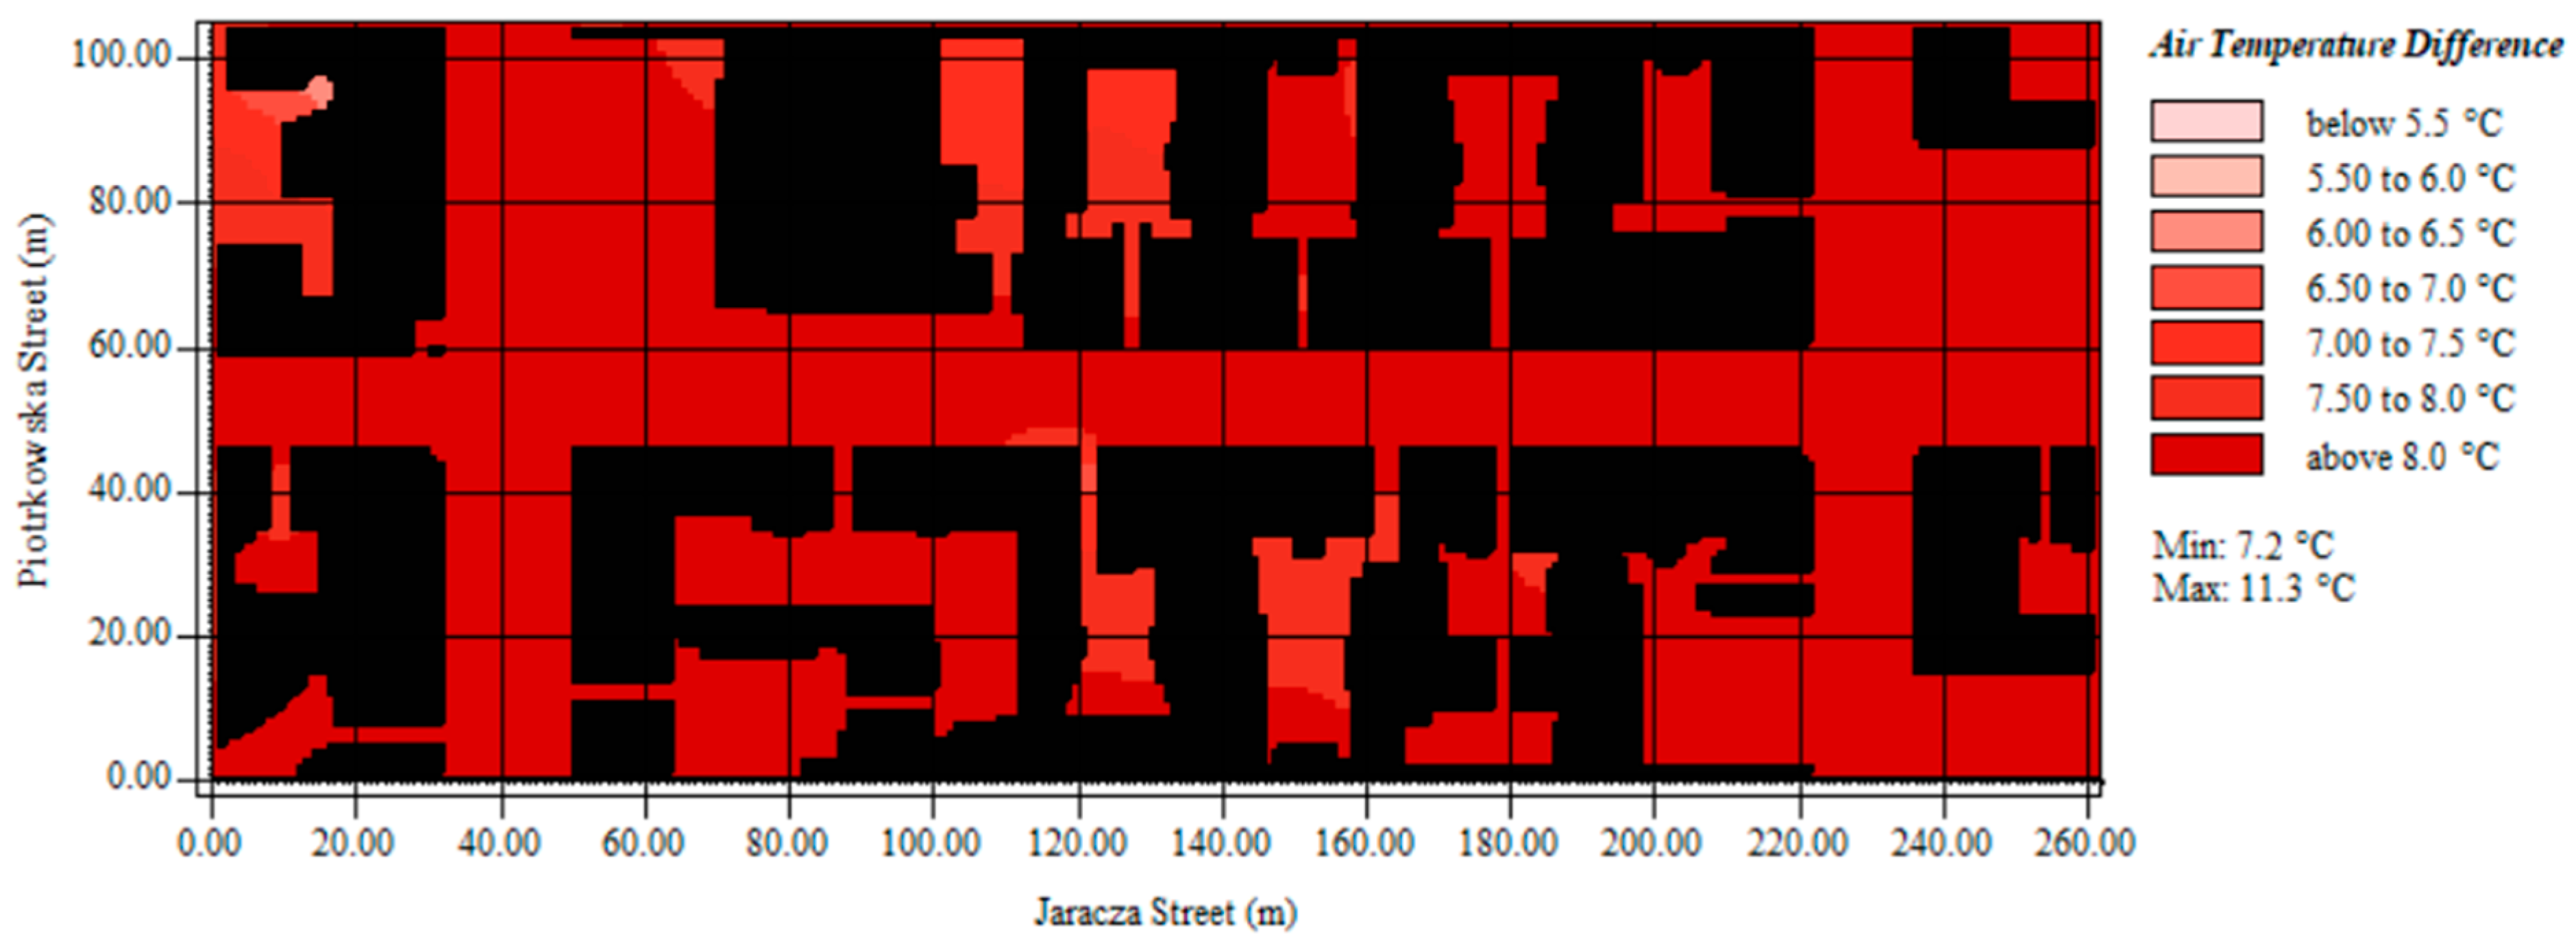
Next, temperature simulation analyses were conducted within a typical street canyon, taking into account three types of weather data as boundary conditions. The obtained results showed clear differences in maximum and minimum temperatures (real measurements: Tamax = 36.8 °C, Tamin = 32.8 °C; meteorological station: Tamax = 30.5 °C, Tamin = 26.3 °C; TMY: Tamax = 30.5 °C, Tamin = 26.3 °C). Even greater temperature differences are visible in the case of analyses of spatial variation in the parameter (real measurements vs. meteorological station Tdiff = 7.9 °C; real measurements vs. TMY Tdiff = 11.3 °C). This demonstrates the significant impact of local conditions (such as buildings and greenery) on the local microclimate. It also reinforces the need to consider local conditions when analyzing interior comfort and energy consumption.
Analyses conducted for the interior space demonstrated that the selection of boundary weather data has a substantial influence on the assessment of indoor thermal comfort. The evaluation was carried out using the adaptive comfort model defined in EN 16798-1, where the indoor operative temperature is interpreted as a function of the outdoor running-mean temperature ( θ r m ). This approach is appropriate for naturally ventilated residential buildings situated in dense urban areas, where occupants’ thermal expectations adapt to prevailing outdoor conditions.
The discrepancies between the two scenarios illustrate that using non-local weather data (such as TMY) may lead to an underestimation of overheating risk in dense urban environments. The RMS scenario—reflecting the actual microclimate modified by the surrounding canyon geometry, building surfaces, and local heat accumulation—produced indoor conditions much closer to upper comfort thresholds. This confirms that accurate representation of microclimatic conditions is essential for reliable adaptive comfort assessments in historic residential buildings and for identifying periods when occupants may experience diminished thermal comfort or require adaptive actions (e.g., evening ventilation, shading, or behavioural adjustments).
These findings also have direct implications for the estimation of cooling energy demand in building performance simulations. When realistic, locally measured microclimatic conditions are used as boundary data, the indoor temperatures remain closer to upper adaptive comfort thresholds, indicating a thermal environment that operates with reduced safety margins. This suggests that the actual cooling loads in dense urban areas are likely higher than those predicted using suburban or TMY weather files, which systematically underestimate both outdoor and indoor temperature peaks. Consequently, simulations that do not account for urban heat island effects may misrepresent the building’s cooling needs, leading to under-dimensioned cooling systems or inaccurate evaluation of passive mitigation strategies. Incorporating realistic urban weather inputs, therefore, enhances the reliability of energy modelling and provides a more accurate basis for planning thermal resilience and adaptive comfort strategies in historic residential buildings.

5. Conclusions

The increasing phenomena associated with global warming are impacting the current outdoor thermal environment of urban areas, especially public spaces, as well as the indoor thermal comfort of dwellers. These trends, which will intensify, are expected to worsen the city’s livability and vitality at the physical, economic, social, and environmental levels.
Identification of local climate zones within the city. Delineate areas with similar physical characteristics, such as terrain roughness class, development structure compactness, percentage of impervious surface, biologically active area, or albedo of building materials. For such separated zones, basic microclimate parameters should be determined. These parameters could then be used to calculate correction coefficients, allowing modification of data from measurement stations. This would result in taking into account conditions similar to the real ones.
In the context of progressing climate change and the increasing frequency of extreme heat events, the need to integrate realistic, city-centre-specific weather data becomes even more critical. Only such data can reliably reflect the combined effects of the urban heat island and global warming on both adaptive thermal comfort and whole-building energy performance. Incorporating these locally relevant conditions into future climate scenarios is therefore essential for developing accurate predictions of cooling needs and for supporting effective adaptation strategies in urban residential buildings.
Currently developed medium- and long-term climate change scenarios are based on data from suburban weather stations. This means they are generalized models. They do not take into account local microclimate conditions, and therefore phenomena occurring in urbanized zones. This undoubtedly impacts energy management in cities, potentially leading to erroneous assumptions regarding energy demand in buildings.
One of the challenges facing modern cities is the need to adapt to changing climatic conditions. Analyzing future climate scenarios, it is necessary to simultaneously assess the effectiveness of implemented adaptation strategies, such as green walls, green roofs, tree rows, and water elements. These can significantly modify local microclimate conditions and also influence indoor and outdoor human thermal comfort.

Author Contributions

Conceptualization, A.D.B., K.K. and K.W.; methodology, A.D.B., K.K. and K.W.; software, A.D.B., K.K. and K.W.; validation, A.D.B., K.K. and K.W.; formal analysis, A.D.B., K.K. and K.W.; investigation, A.D.B., K.K. and K.W.; resources, A.D.B. and K.K.; data curation, A.D.B., K.K. and K.W.; writing—original draft preparation, A.D.B., K.K. and K.W.; writing—review and editing, A.D.B., K.K. and K.W.; visualization, A.D.B., K.K. and K.W.; supervision, A.D.B. and K.K.; project administration, A.D.B. and K.K.; funding acquisition, A.D.B. and K.K. All authors have read and agreed to the published version of the manuscript.

Funding

This work was financed by the Rector of Lodz University of Technology under the ‘FU2N—Fund for the Improvement of Skills of Young Scientists’ program supporting scientific excellence at the Lodz University of Technology—grant no. W6/1/2025/FU2N, as well as from the reserve of the Rector of Lodz University of Technology for co-financing Open Access publications.

Data Availability Statement

The original contributions presented in this study are included in the article. Further inquiries can be directed to the corresponding author.

Acknowledgments

The authors wish to acknowledge anonymous reviewers whose comments/suggestions helped to improve and clarify this manuscript. This work has been supported by the Institute of Environmental Engineering and Building Installations, as well as, the Department of Building Materials Physics and Sustainable Design, Faculty of Civil Engineering, Architecture and Environmental Engineering, Lodz University of Technology.

Conflicts of Interest

The authors declare no conflicts of interest.

Appendix A

Table A1. Devices for measuring basic meteorological parameters.
Energies 19 00662 i002Device for Measuring Basic Meteorological Parameters (Testo 410-2)
ParametersRangeAccuracy
Outdoor air temperature [−10]–[+50] °C±0.5 °C
Outdoor air humidity 1–100%±2.5%
Wind speed 0.4–20 m/s±0.2 m/s
Time of measurements
Measurement interval
0.00–23.00
1 h
Energies 19 00662 i003Meteorological station Davis Vantage Pro2 (6152EU)
Outdoor air temperature [−45]–[+65] °C±0.5 °C
Outdoor air humidity 1–100%±3%
Wind speed 1–80 m/s±1 m/s
Wind direction 0–360°±3°
Time of measurements
Measurement interval
10.00–18.00
1 h
Table A2. Basic meteorological parameters, measured with the Testo 410-2 in the street canyon.
Relative Air Humidity at the Measuring Points [%]
12345678
Hour [h]0:0058.160.059.960.961.262.160.361.0
2:0059.860.959.962.163.260.258.859.3
4:0061.565.265.363.365.366.465.768.6
6:0069.763.965.766.165.767.566.566.8
8:0049.550.748.252.554.754.852.653.6
10:0042.339.638.037.742.841.644.041.7
12:0033.238.635.935.431.636.038.432.3
14:0029.334.030.131.032.742.141.341.1
16:0039.437.837.035.837.134.631.235.3
18:0034.336.534.038.636.734.535.234.3
20:0045.244.544.241.540.540.841.939.9
22:0049.948.248.847.447.146.246.246.8
23:0055.453.954.153.154.052.751.251.1
Air temperature at the measuring points [°C]
12345678
Hour [h]0:0023.823.323.423.122.822.923.122.8
2:0024.023.223.523.023.523.524.324.0
4:0023.722.822.723.022.322.422.522.5
6:0023.023.323.522.722.722.322.822.5
8:0027.427.328.425.825.525.125.124.8
10:0029.629.631.530.928.529.128.128.9
12:0033.829.331.631.033.031.029.433.4
14:0036.626.636.034.834.128.128.428.8
16:0030.030.030.130.930.831.933.633.7
18:0032.832.831.828.830.531.731.531.7
20:0028.228.228.728.728.628.728.828.8
22:0027.427.427.427.727.627.427.527.3
23:0025.625.625.826.125.926.026.626.6
Table A3. Basic meteorological parameters implemented in the indoor simulation (DesignBuilder).
External Microclimatic Parameters in the Vicinity of the Residential Building
Hour1:002:003:004:005:006:007:008:009:00
Temperature [°C]25.325.124.924.724.524.525.326.627.7
Humidity [%]54.655.656.657.559.260.958.052.648.6
Hour10:0011:0012:0013:0014:0015:0016:0017:0018:00
Temperature [°C]28.629.931.432.633.733.132.131.431.5
Humidity [%]45.642.138.436.034.135.136.737.937.7
Hour19:0020:0021:0022:0023:00
Temperature [°C]30.829.729.028.527.7
Humidity [%]39.642.344.346.148.6

References

  1. Ciot, M.-G. On European green deal and sustainable development policy (The case of Romania). Sustainability 2021, 13, 12233. [Google Scholar] [CrossRef] [Scilit]
  2. Almeida, D.V.; Kolinjivadi, V.; Ferrando, T.; Roy, B.; Herrera, H.; Gonçalves, M.V.; Van Hecken, G. The “Greening” of Empire: The European Green Deal as the EU first agenda. Pol. Geo. 2023, 105, 102925. [Google Scholar] [CrossRef] [Scilit]
  3. Gasparotti, C.M. Reducing greenhouse gases-target to achieve climate and energy objectives in the EU. RMEE 2024, 23, 207–219. [Google Scholar] [CrossRef] [Scilit]
  4. Cheng, C.; Yan, X.; Fang, Z.; Zhou, Q.; Tang, Y.; Li, N.; Tang, D. Proposing carbon reduction strategies for mega-urban agglomerations—A cluster analysis based on carbon emission intensity. Ecol. Indic. 2024, 166, 112336. [Google Scholar] [CrossRef] [Scilit]
  5. Liu, Z.; Xu, Q.; Lyu, S.; Yang, R.; Wan, Z. A Review of the Impact of Urban Form on Building Carbon Emissions. Buildings 2025, 15, 2604. [Google Scholar] [CrossRef] [Scilit]
  6. Ding, G.; Guo, J.; Pueppke, S.G.; Yi, J.; Ou, M.; Ou, W.; Tao, Y. The Influence of Urban Form Compactness on CO2 Emissions and Its Threshold Effect: Evidence from Cities in China. J. Environ. Manag. 2022, 322, 116032. [Google Scholar] [CrossRef] [Scilit]
  7. Kulovesi, K.; Oberthür, S. Assessing the EU’s 2030 Climate and Energy Policy Framework: Incremental change toward radical transformation? RECIEL 2020, 29, 151–166. [Google Scholar] [CrossRef] [Scilit]
  8. Almeida, M.; Ascione, F.; Iaccheo, A.; Iovane, T.; Mastellone, M. Towards the Necessary Decarbonization of Historic Buildings: A Review. Energies 2025, 18, 502. [Google Scholar] [CrossRef] [Scilit]
  9. Kochanek, E. The energy transition in the Visegrad group countries. Energies 2021, 14, 2212. [Google Scholar] [CrossRef] [Scilit]
  10. Kougias, I.; Taylor, N.; Kakoulaki, G.; Jäger-Waldau, A. The role of photovoltaics for the European Green Deal and the recovery plan. Renew. Sust. Energ. 2021, 144, 111017. [Google Scholar] [CrossRef] [Scilit]
  11. The European Union. Directive (EU) 2018/844 of the European Parliament and of the Council of 30 May 2018 Amending Directive 2010/31/EU on the Energy Performance of Buildings and Directive 2012/27/EU on Energy Efficiency (Text with EEA Relevance). Available online: http://data.europa.eu/eli/dir/2018/844/oj (accessed on 10 December 2025).
  12. Lin, Y.; Huang, T.; Yang, W.; Hu, X.; Li, C. A Review on the Impact of Outdoor Environment on Indoor Thermal Environment. Buildings 2023, 13, 2600. [Google Scholar] [CrossRef] [Scilit]
  13. Schünemann, C.; Ziemann, A.; Goldberg, V. Spatially resolved indoor overheating evaluation using microscale meteorological simulation as input for building simulation—Opportunities and limitations. City Environ. Interact. 2023, 20, 100122. [Google Scholar] [CrossRef] [Scilit]
  14. Mahmoud, H.; Ragab, A. Urban Geometry Optimization to Mitigate Climate Change: Towards Energy-Efficient Buildings. Sustainability 2021, 13, 27. [Google Scholar] [CrossRef] [Scilit]
  15. Lundgren Kownacki, K.; Gao, C.; Kuklane, K.; Wierzbicka, A. Heat stress in indoor environments of Scandinavian urban areas: A literature review. Int. J. Environ. Res. Public. Health 2019, 16, 560. [Google Scholar] [CrossRef] [Scilit] [PubMed]
  16. Hailu, H.; Gelan, E.; Girma, Y. Indoor thermal comfort analysis: A case study of modern and traditional buildings in hot-arid climatic region of Ethiopia. Urban. Sci. 2021, 5, 53. [Google Scholar] [CrossRef] [Scilit]
  17. Li, J.; Zheng, B.; Chen, X.; Qi, Z.; Bedra, K.B.; Zheng, J.; Li, Z.; Liu, L. Study on a full-year improvement of indoor thermal comfort by different vertical greening patterns. J. Build. Eng. 2021, 35, 101969. [Google Scholar] [CrossRef] [Scilit]
  18. Jia, L.-R.; Han, J.; Chen, X.; Li, Q.-Y.; Lee, C.-C.; Fung, Y.-H. Interaction between thermal comfort, indoor air quality and ventilation energy consumption of educational buildings: A comprehensive review. Buildings 2021, 11, 591. [Google Scholar] [CrossRef] [Scilit]
  19. Arsad, F.S.; Hod, R.; Ahmad, N.; Baharom, M.; Ja’afar, M.H. Assessment of indoor thermal comfort temperature and related behavioural adaptations: A systematic review. Environ. Sci. Pollut. Res. 2023, 30, 73137–73149. [Google Scholar] [CrossRef] [Scilit]
  20. Dian, C.; Pongrácz, R.; Dezső, Z.; Bartholy, J. Annual and monthly analysis of surface urban heat island intensity with respect to the local climate zones in Budapest. Urban. Clim. 2020, 31, 100573. [Google Scholar] [CrossRef] [Scilit]
  21. Ferrari, A.; Kubilay, A.; Derome, D.; Carmeliet, J. The use of permeable and reflective pavements as a potential strategy for urban heat island mitigation. Urban. Clim. 2020, 31, 100534. [Google Scholar] [CrossRef] [Scilit]
  22. Yang, X.; Peng, L.L.H.; Jiang, Z.; Chen, Y.; Yao, L.; He, Y.; Xu, T. Impact of urban heat island on energy demand in buildings: Local climate zones in Nanjing. Appl. Energy 2020, 260, 114279. [Google Scholar] [CrossRef] [Scilit]
  23. Equere, V.; Mirzaei, P.A.; Riffat, S. Definition of a new morphological parameter to improve prediction of urban heat island. SCS 2020, 56, 102021. [Google Scholar] [CrossRef] [Scilit]
  24. Umezaki, A.S.; Ribeiro, F.N.D.; Oliveira, A.P.; Soares, J.; Miranda, R.M. Numerical characterization of spatial and temporal evolution of summer urban heat island intensity in São Paulo, Brazil. Urban. Clim. 2020, 32, 100615. [Google Scholar] [CrossRef] [Scilit]
  25. Simwanda, M.; Ranagalage, M.; Estoque, R.C.; Murayama, Y. Spatial Analysis of Surface Urban Heat Islands in Four Rapidly Growing African Cities. Remote Sens. 2019, 11, 1645. [Google Scholar] [CrossRef] [Scilit]
  26. Harmay, N.S.M.; Kim, D.; Choi, M. Urban Heat Island associated with Land Use/Land Cover and climate variations in Melbourne, Australia. Sustain. Cities Soc. 2021, 69, 102861. [Google Scholar] [CrossRef] [Scilit]
  27. Radoux, J.; Dominique, M.; Hartley, A.; Lamarche, C.; Bos, A.; Defourny, P. Land Cover Types Drive the Surface Temperature for Upscaling Surface Urban Heat Islands with Daylight Images. Remote Sens. 2025, 17, 2815. [Google Scholar] [CrossRef] [Scilit]
  28. Kabisch, N.; Remahne, F.; Ilsemann, C.; Fricke, L. The urban heat island under extreme heat conditions: A case study of Hannover, Germany. Sci. Rep. 2023, 13, 23017. [Google Scholar] [CrossRef] [Scilit]
  29. Geletič, J.; Lehnert, M.; Savić, S.; Milošević, D. Inter-/intra-zonal seasonal variability of the surface urban heat island based on local climate zones in three central European cities. Build. Environ. 2019, 156, 21–32. [Google Scholar] [CrossRef] [Scilit]
  30. Veena, K.; Parammasivam, K.M.; Venkatesii, T.N. Urban Heat island studies: Current status in India and a comparison with the International studies. J. Earth Syst. Sci. 2020, 129, 85. [Google Scholar] [CrossRef] [Scilit]
  31. Dobrzański, M.; Muniak, D.P.; Müller, J.; Cichowicz, R. The impact of power units on air quality on a university campus located in the center of an urban agglomeration. Energy 2025, 324, 324. [Google Scholar] [CrossRef] [Scilit]
  32. Jaroń, A.; Borucka, A.; Ślusarczyk, M. Long-Term Trends in Air Pollution in Poland on Selected Examples—A Spatial and Temporal Analysis of PM10 Concentrations. Appl. Sci. 2025, 15, 12379. [Google Scholar] [CrossRef] [Scilit]
  33. Azimi, M.N.; Rahman, M.M. Unveiling the health consequences of air pollution in the world’s most polluted nations. Sci. Rep. 2024, 14, 9856. [Google Scholar] [CrossRef] [Scilit]
  34. Yan, D.; Xu, L.; Wang, Q.; Feng, J.; Wu, X. Quantifying Landscape Effects on Urban Park Thermal Environments Using ENVI-Met and 3D Grid Profile Analysis. Forests 2025, 16, 1085. [Google Scholar] [CrossRef] [Scilit]
  35. Koutsanitis, S.; Sinou, M.; Kanetaki, Z.; Tousi, E.; Varelidis, G. Thermal Performance Investigation in Historical Urban Neighborhoods Using ENVI-Met Simulation Software. Land 2025, 14, 284. [Google Scholar] [CrossRef] [Scilit]
  36. Schöneberger, P.; Sinsel, T.; Ouyang, W.; Tan, Z.; Bruse, M.; Simon, H. Enhancing urban microclimate simulations: Validating ENVI-met’s accuracy in modeling multi-directional radiative fluxes and mean radiant temperature in subtropical Hong Kong. Build. Environ. 2025, 284, 113475. [Google Scholar] [CrossRef] [Scilit]
  37. Brahimi, M.; Benabbas, M.; Djaghrouri, D. Setting up the ENVI-met digital tool to evaluate climatic conditions at an urban scale: A case study of Djelfa, Algeria. J. Bulg. Geogr. Soc. 2023, 49, 113–127. [Google Scholar] [CrossRef] [Scilit]
  38. Kim, J.; Yeom, S.; Hong, T. Analyzing the cooling effect, thermal comfort, and energy consumption of integrated arrangement of high-rise buildings and green spaces on urban heat island. Sustain. Cities Soc. 2025, 119, 106105. [Google Scholar] [CrossRef] [Scilit]
  39. Song, Y.; Mao, F.; Liu, Q. Human Comfort in Indoor Environment: A Review on Assessment Criteria, Data Collection and Data Analysis Methods. IEEE Access 2019, 7, 119774–119786. [Google Scholar] [CrossRef] [Scilit]
  40. Wu, J.; Chang, H.; Yoon, S. Numerical Study on Microclimate and Outdoor Thermal Comfort of Street Canyon Typology in Extremely Hot Weather—A Case Study of Busan, South Korea. Atmosphere 2022, 13, 307. [Google Scholar] [CrossRef] [Scilit]
  41. Zhou, Z.; Wang, P.; Deng, J.; Ouyang, C.; Xu, Y.; Jiang, W.; Ma, K. Numerical Simulation of Street Canyon Morphology and Microclimate in Hot Summer and Cold Winter Zone. Buildings 2023, 13, 2433. [Google Scholar] [CrossRef] [Scilit]
  42. Bochenek, A.; Klemm, K. The Impact of Passive Green Technologies on the Microclimate of Historic Urban Structures: The Case Study of Lodz. Atmosphere 2020, 11, 974. [Google Scholar] [CrossRef] [Scilit]
  43. Bochenek, A.; Klemm, K. Effectiveness of Tree Pattern in Street Canyons on Thermal Conditions and Human Comfort. Assessment of an Urban Renewal Project in Historical District in Lodz (Poland). Atmosphere 2021, 12, 751. [Google Scholar] [CrossRef] [Scilit]
  44. Wu, J.; Wang, Y.; Li, S.; Wu, Q.; Lee, T.; Yoon, S. Quantitative Study on the Effects of Street Geometries and Tree Configurations on the Outdoor Thermal Environment. Energies 2024, 17, 2223. [Google Scholar] [CrossRef] [Scilit]
  45. Ouyang, W.; Sinsel, T.; Simon, H.; Morakinyo, T.E.; Liu, H.; Ng, E. Evaluating the thermal-radiative performance of ENVI-met model for green infrastructure typologies: Experience from a subtropical climate. Build. Environ. 2022, 207, 108427. [Google Scholar] [CrossRef] [Scilit]
  46. Battisti, A. Bioclimatic Architecture and Urban Morphology. Studies on Intermediate Urban Open Spaces. Energies 2020, 13, 5819. [Google Scholar] [CrossRef] [Scilit]
  47. Banerjee, S.; Pek, R.X.Y.; Yik, S.K.; Ching, G.N.; Ho, X.T.; Dzyuban, Y.; Crank, P.J.; Acero, J.A.; Chow, W.T.L. Assessing impact of urban densification on outdoor microclimate and thermal comfort using ENVI-met simulations for Combined Spatial-Climatic Design (CSCD) approach. Sustain. Cities Soc. 2024, 105, 105302. [Google Scholar] [CrossRef] [Scilit]
  48. Liu, Z.; Cheng, W.; Jim, C.Y.; Morakinyo, T.E.; Shi, Y.; Ng, E. Heat mitigation benefits of urban green and blue infrastructures: A systematic review of modeling techniques, validation and scenario simulation in ENVI-met V4. Build. Environ. 2021, 200, 107939. [Google Scholar] [CrossRef] [Scilit]
  49. Rizzo, F. Investigation of the Time Dependence of Wind-Induced Aeroelastic Response on a Scale Model of a High-Rise Building. Appl. Sci. 2021, 11, 3315. [Google Scholar] [CrossRef] [Scilit]
  50. Brahimi, M.; Benabbas, M.; Altan, H.; Nocera, F.; Costanzo, V. Enhancing Urban Microclimates: Potential Benefits of Greenery Strategies in a Semi-Arid Environment. Sustainability 2023, 15, 16380. [Google Scholar] [CrossRef] [Scilit]
  51. Tariku, F.; Gharib Mombeni, A. ANN-Based Method for Urban Canopy Temperature Prediction and Building Energy Simulation with Urban Heat Island Effect in Consideration. Energies 2023, 16, 5335. [Google Scholar] [CrossRef] [Scilit]
  52. Zhou, X.; Sun, Y.; Li, T.; Zhou, Y.; Tan, T.; Yu, C.; Dai, S. Optimizing Microclimate Comfort in Macao: ENVI-Met Simulation of High-Density Urban Layouts Under the Climate in the Lingnan Area. Atmosphere 2025, 16, 70. [Google Scholar] [CrossRef] [Scilit]
  53. Jänicke, B.; Meier, F.; Hoelscher, M.T.; Scherer, D. Evaluating the Effects of Façade Greening on Human Bioclimate in a Complex Urban Environment. Adv. Meteorol. 2015, 1, 747259. [Google Scholar] [CrossRef] [Scilit]
  54. Ye, Z.; Liu, J.; Huang, Z. Identifying the best combination of vegetation and paving materials to improve the outdoor thermal comfort in a campus courtyard. Sci. Rep. 2025, 15, 20602. [Google Scholar] [CrossRef] [Scilit]
  55. Guergour, H.; Cheraitia, M.; Dechaicha, A.; Alkama, D. Optimization of urban morphology to enhance outdoor thermal comfort: A microclimate analysis. J. Bulg. Geogr. Soc. 2024, 51, 107–130. [Google Scholar] [CrossRef] [Scilit]
  56. Kotharkar, R.; Dongarsane, P. Investigating outdoor thermal comfort variations across Local Climate Zones in Nagpur, India, using ENVI-met. Build. Environ. 2024, 249, 111122. [Google Scholar] [CrossRef] [Scilit]
  57. Ayyad, Y.N.; Sharples, S. Envi-MET validation and sensitivity analysis using field measurements in a hot arid climate. IOP Conf. Ser. Earth Environ. Sci. 2019, 329, 012040. [Google Scholar] [CrossRef] [Scilit]
  58. Dai, Y.; Hou, M.; Wang, H.; Tu, W. Source Location Identification in an Ideal Urban Street Canyon with Time-Varying Wind Conditions under a Coupled Indoor and Outdoor Environment. Buildings 2023, 13, 3121. [Google Scholar] [CrossRef] [Scilit]
  59. Haeri, T.; Hassan, N.; Ghaffarianhoseini, A. Evaluation of microclimate mitigation strategies in a heterogenous street canyon in Kuala Lumpur from outdoor thermal comfort perspective using Envi-met. Urban. Climate 2023, 52, 101719. [Google Scholar] [CrossRef] [Scilit]
  60. Deng, Y.; Kong, X.; Zhou, Z. Field measurement and CFD simulation study on UHI in high-density blocks of Shanghai based on street canyons. Sustain. Cities Soc. 2025, 124, 106302. [Google Scholar] [CrossRef] [Scilit]
  61. Forouzandeh, A. Prediction of surface temperature of building surrounding envelopes using holistic microclimate ENVI-met model. Sustain. Cities Soc. 2021, 70, 102878. [Google Scholar] [CrossRef] [Scilit]
  62. PN-EN 16798-1:2019-06; Energy Performance of Buildings—Ventilation of Buildings—Part 1: Indoor Environment Input Parameters for Design and Assessment of Energy Performance of Buildings with Respect to Indoor Air Quality, Thermal Environment, Lighting and Acoustics—Module M1-6. Polish Standards Institution: Warsaw, Poland, 2019.
  63. d’Ambrosio Alfano, F.R.; Olesen, B.W.; Pepe, D.; Palella, B.I. Working with Different Building Energy Performance Tools: From Input Data to Energy and Indoor Temperature Predictions. Energies 2023, 16, 743. [Google Scholar] [CrossRef] [Scilit]
  64. Pei, L.; Schalbart, P.; Peuportier, B. Quantitative Evaluation of the Effects of Heat Island on Building Energy Simulation: A Case Study in Wuhan, China. Energies 2023, 16, 3032. [Google Scholar] [CrossRef] [Scilit]
  65. Salvati, A.; Kolokotroni, M. Urban microclimate and climate change impact on the thermal performance and ventilation of multi-family residential buildings. Energy Build. 2023, 294, 113224. [Google Scholar] [CrossRef] [Scilit]
Figure 1. Location of the Metropolitan Area of Lodz (1—urban canyon, 2—suburban meteorological station).
Energies 19 00662 g001
Figure 2. Location of measurement points within the typical street canyon.
Energies 19 00662 g002
Figure 3. Location of measurement points in the typical street canyon (the pedestrian view).
Energies 19 00662 g003
Figure 4. Parameters of the typical street canyon model (source: own elaboration).
Energies 19 00662 g004
Figure 5. Comparison of simulation results conducted on the basis of information obtained from the measurement campaign with reference values for the street canyon (6 July 2021) (source: own elaboration).
Energies 19 00662 g005
Figure 6. Thermal conditions in the street canyon (14:00 o’clock, 6 July 2021) (simulation based on real measurements).
Energies 19 00662 g006
Figure 7. Thermal conditions in the street canyon (14:00 o’clock, 6 July 2021) (from the top: simulation based on data from suburban meteorological station, the difference in simulated air temperature in the street canyon: real measurements vs. meteorological station, TMY based on data from 2007 to 2021, the difference in simulated air temperature in the street canyon: real measurements vs. TMY).
Energies 19 00662 g007aEnergies 19 00662 g007b
Figure 8. The living room parameters used to create the prototype (dashed line—location of the living room) (source: own elaboration).
Energies 19 00662 g008
Figure 9. A model of the living room of a residential building in the Metropolitan Area of Lodz (source: own elaboration).
Energies 19 00662 g009
Figure 10. Adaptive thermal comfort assessment for indoor operative temperature based on EN 16798-1–room located on the street canyon side (6 July 2021) (source: own elaboration).
Energies 19 00662 g010
Table 1. Settings of the external environment simulation in ENVI-met.
General Settings
Simulation date6 July 2021
Start time0:00
Model horizontal dimension262 × 105 × 30 grids
1 × 1 × 1 m (resolution)
Model vertical dimension1 m (first cell divided into 5 elements—20% of the reference height)
Weather Conditions
Radiation (adjustment factor)0.8
Air temperature(defined in Table A2)
Relative humidity(defined in Table A2)
Wind speed at 10 m height1.3 m/s
Wind directioneast
Three-dimensional Model Parameters
BuildingsBrick (internal part of the wall)
Plaster (external part of the wall)
Roofing felt
Impermeable surfacesAsphalt road (black)
Asphalt road with red coating
Concrete pavements
Permeable surfaceUnsealed soil
Greenery (deciduous trees)Cylindric, medium trunk, dense, medium (15 m)
Cylindric, medium trunk, dense, small (5 m)
Table 2. Outside temperature.
Energies 19 00662 i001 Date: 6 July
RMSTMY
Max temp. [°C]33.525.7
Min. temp. [°C]2415.6
Disclaimer/Publisher’s Note: The statements, opinions and data contained in all publications are solely those of the individual author(s) and contributor(s) and not of MDPI and/or the editor(s). MDPI and/or the editor(s) disclaim responsibility for any injury to people or property resulting from any ideas, methods, instructions or products referred to in the content.